


508个酒样中的甲醛的检测
方案详情

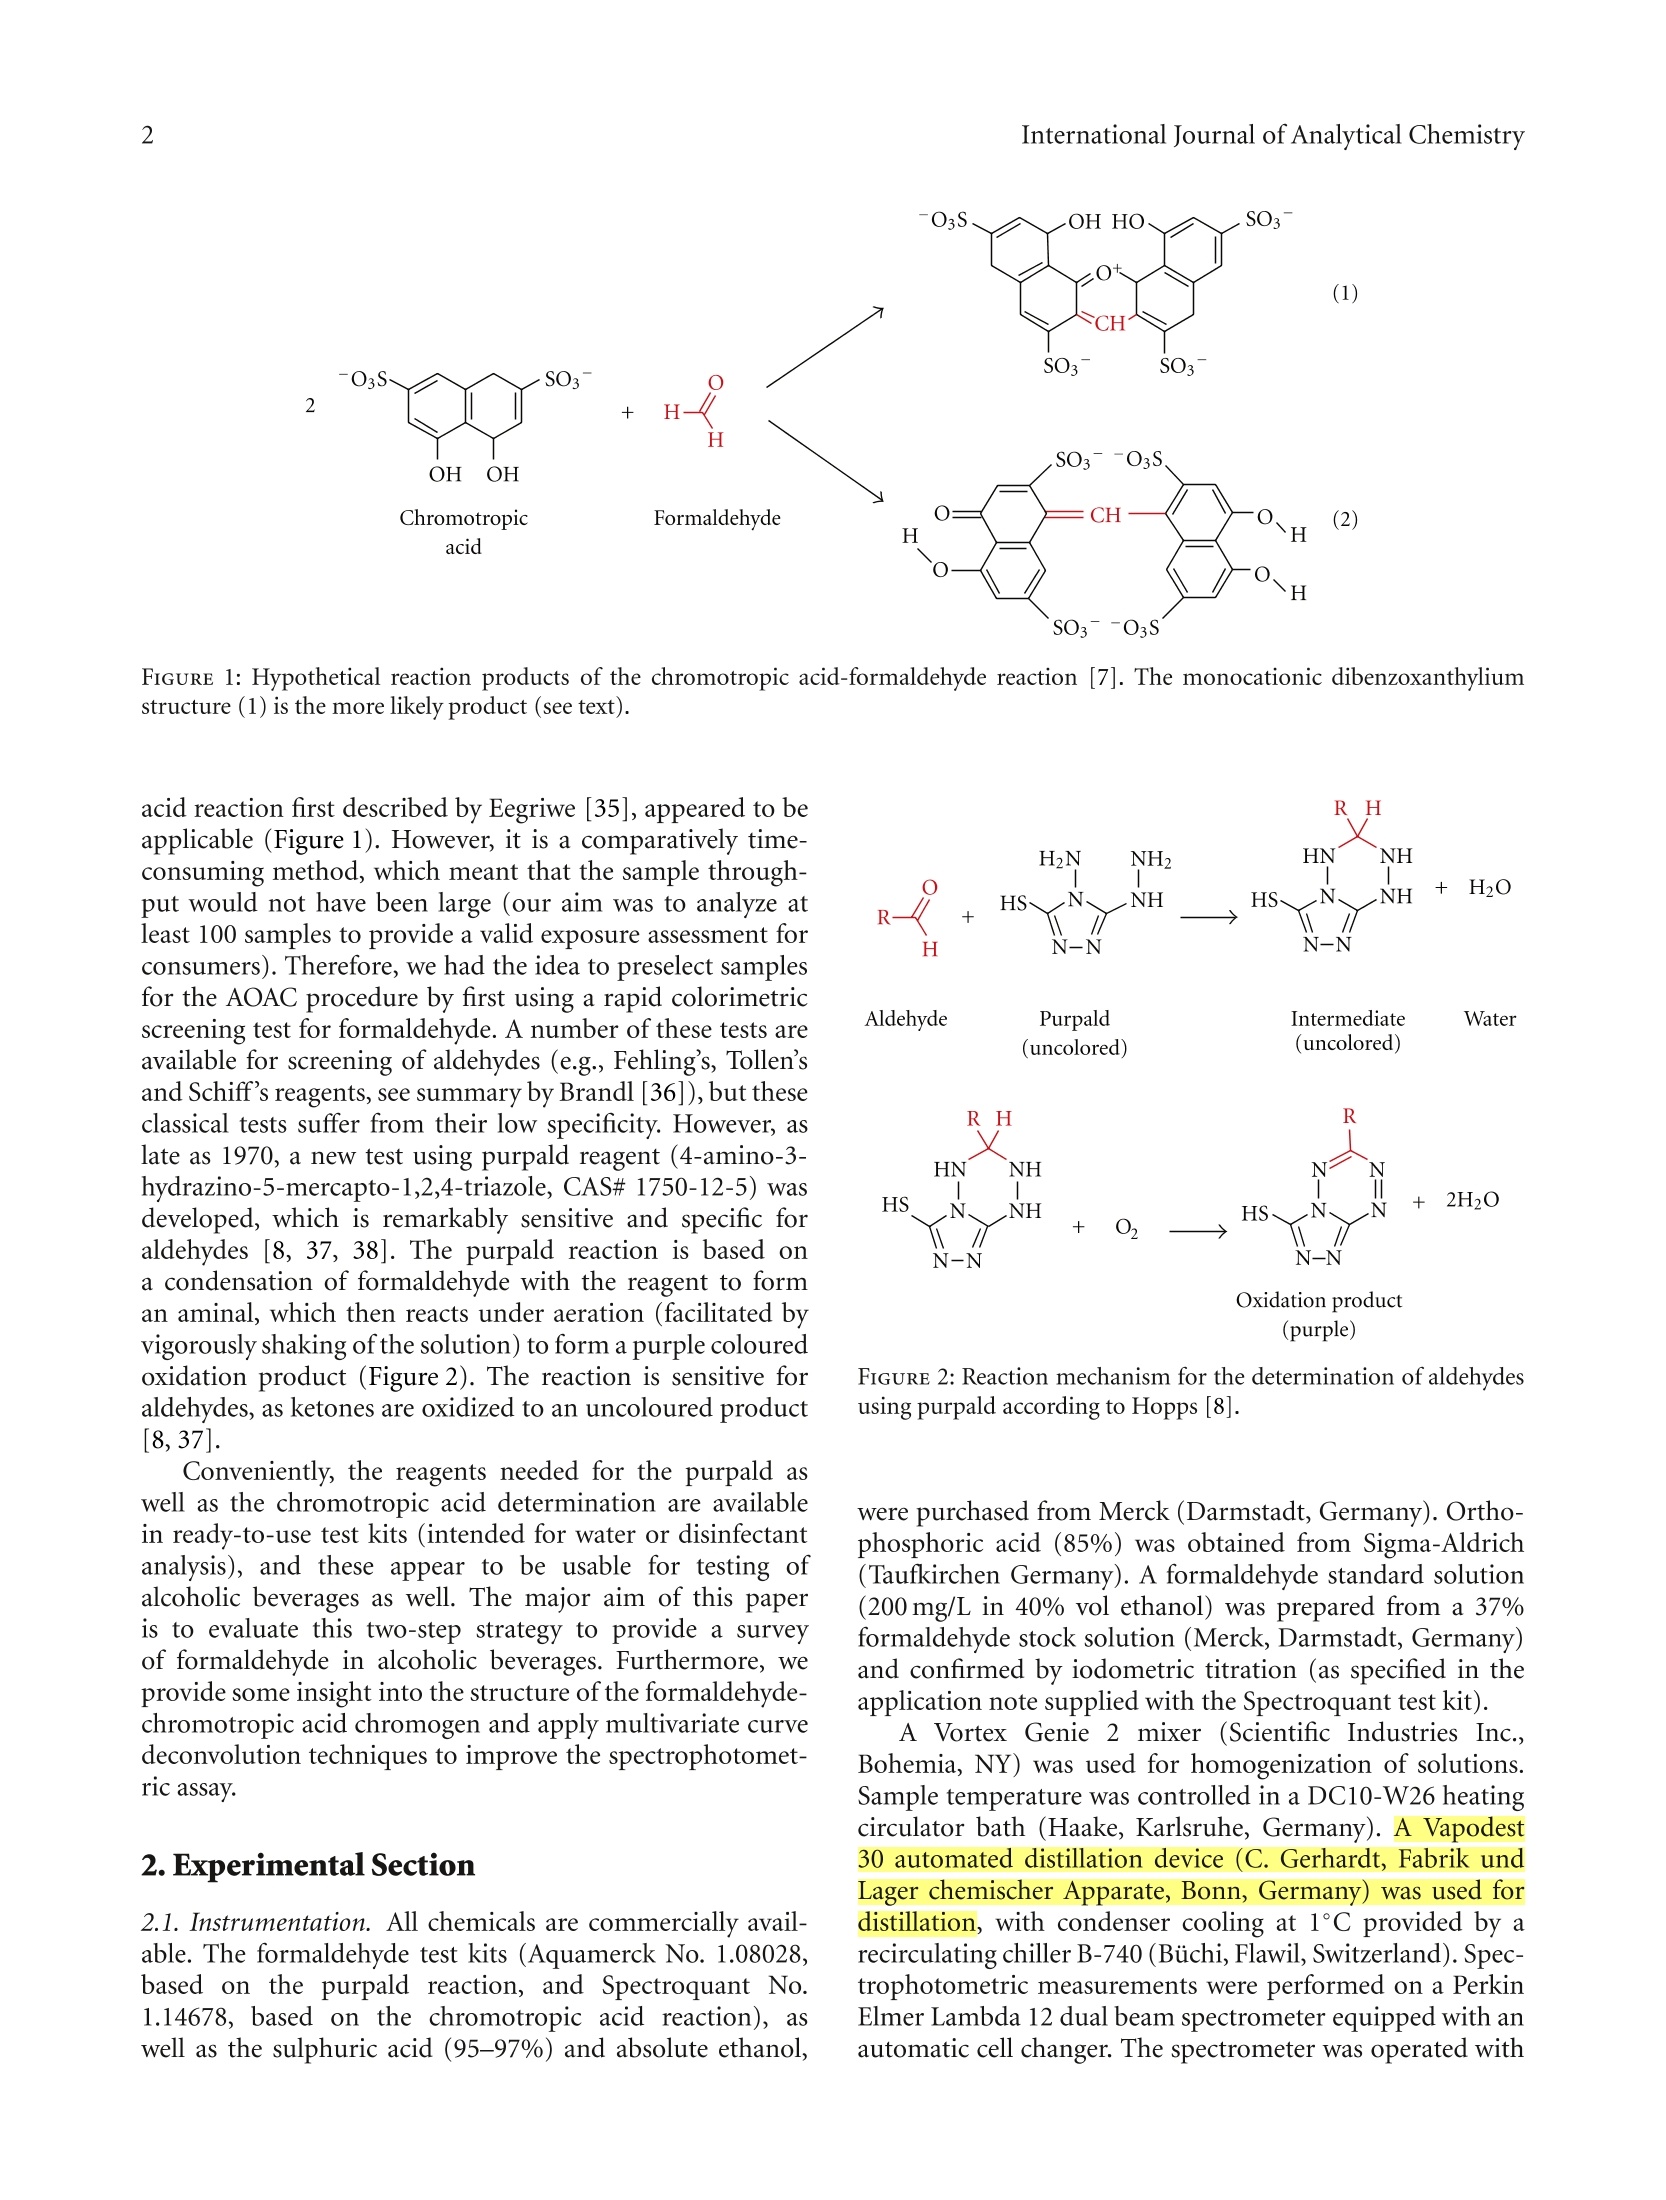
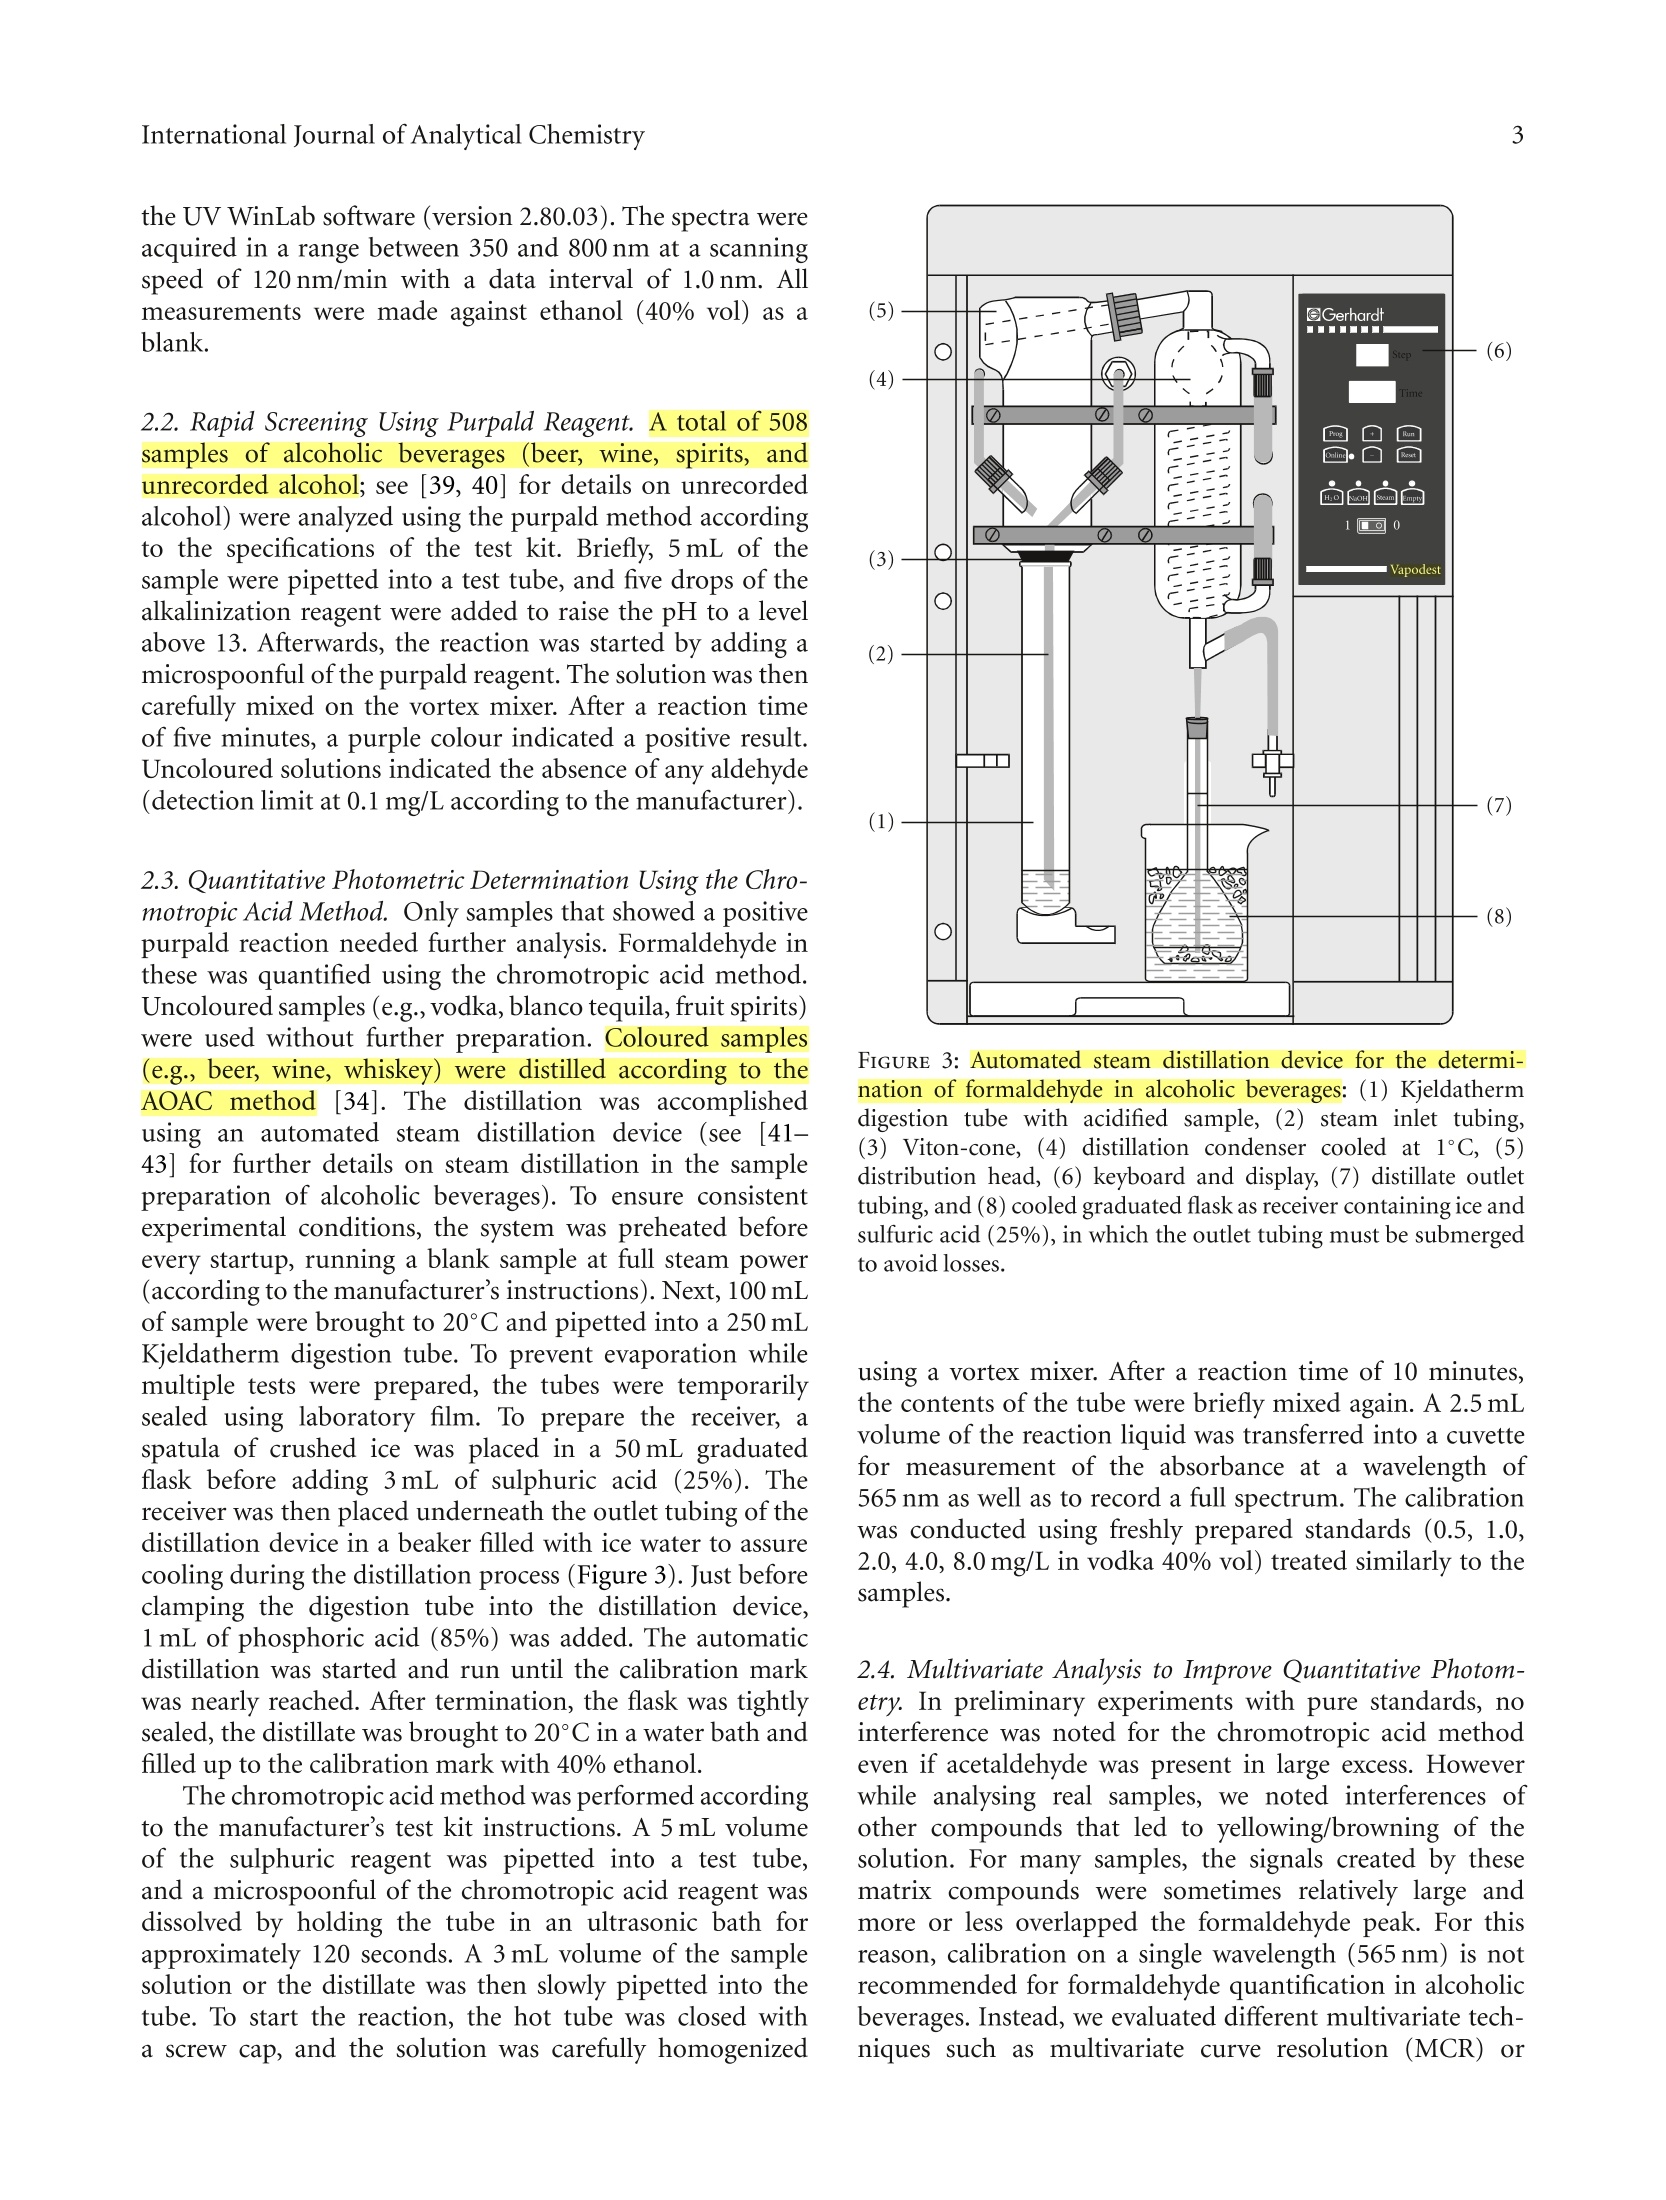
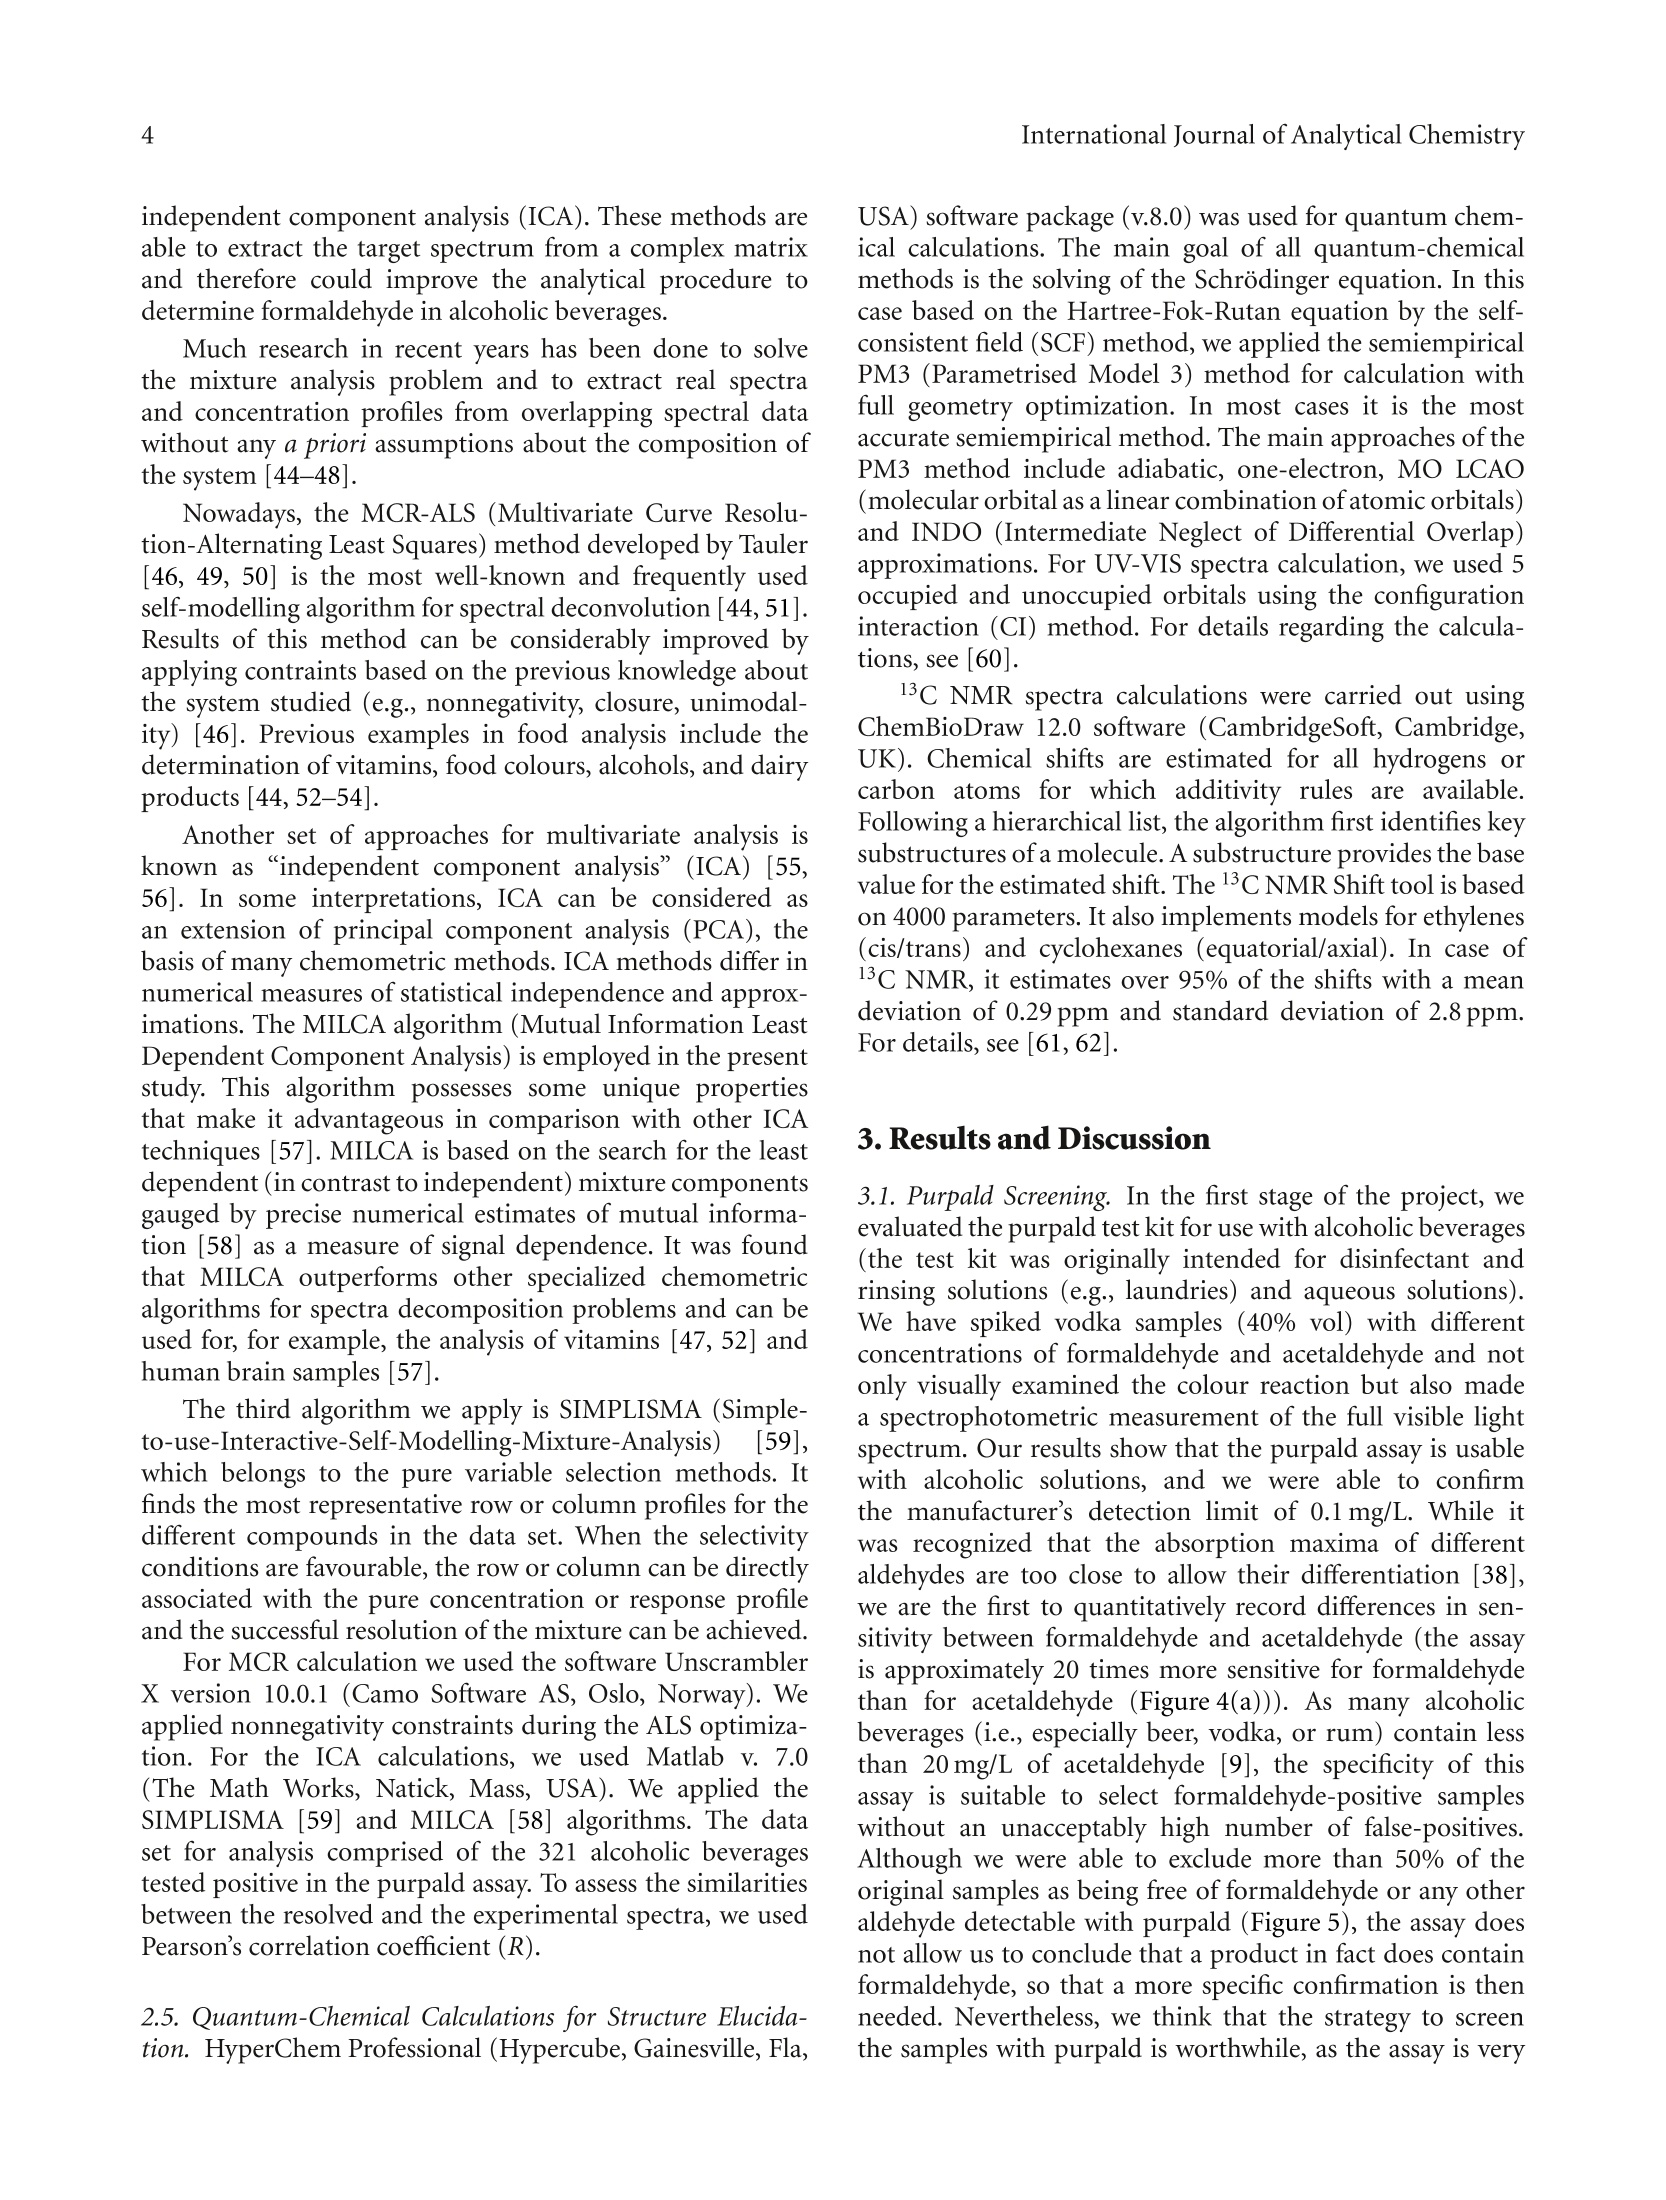
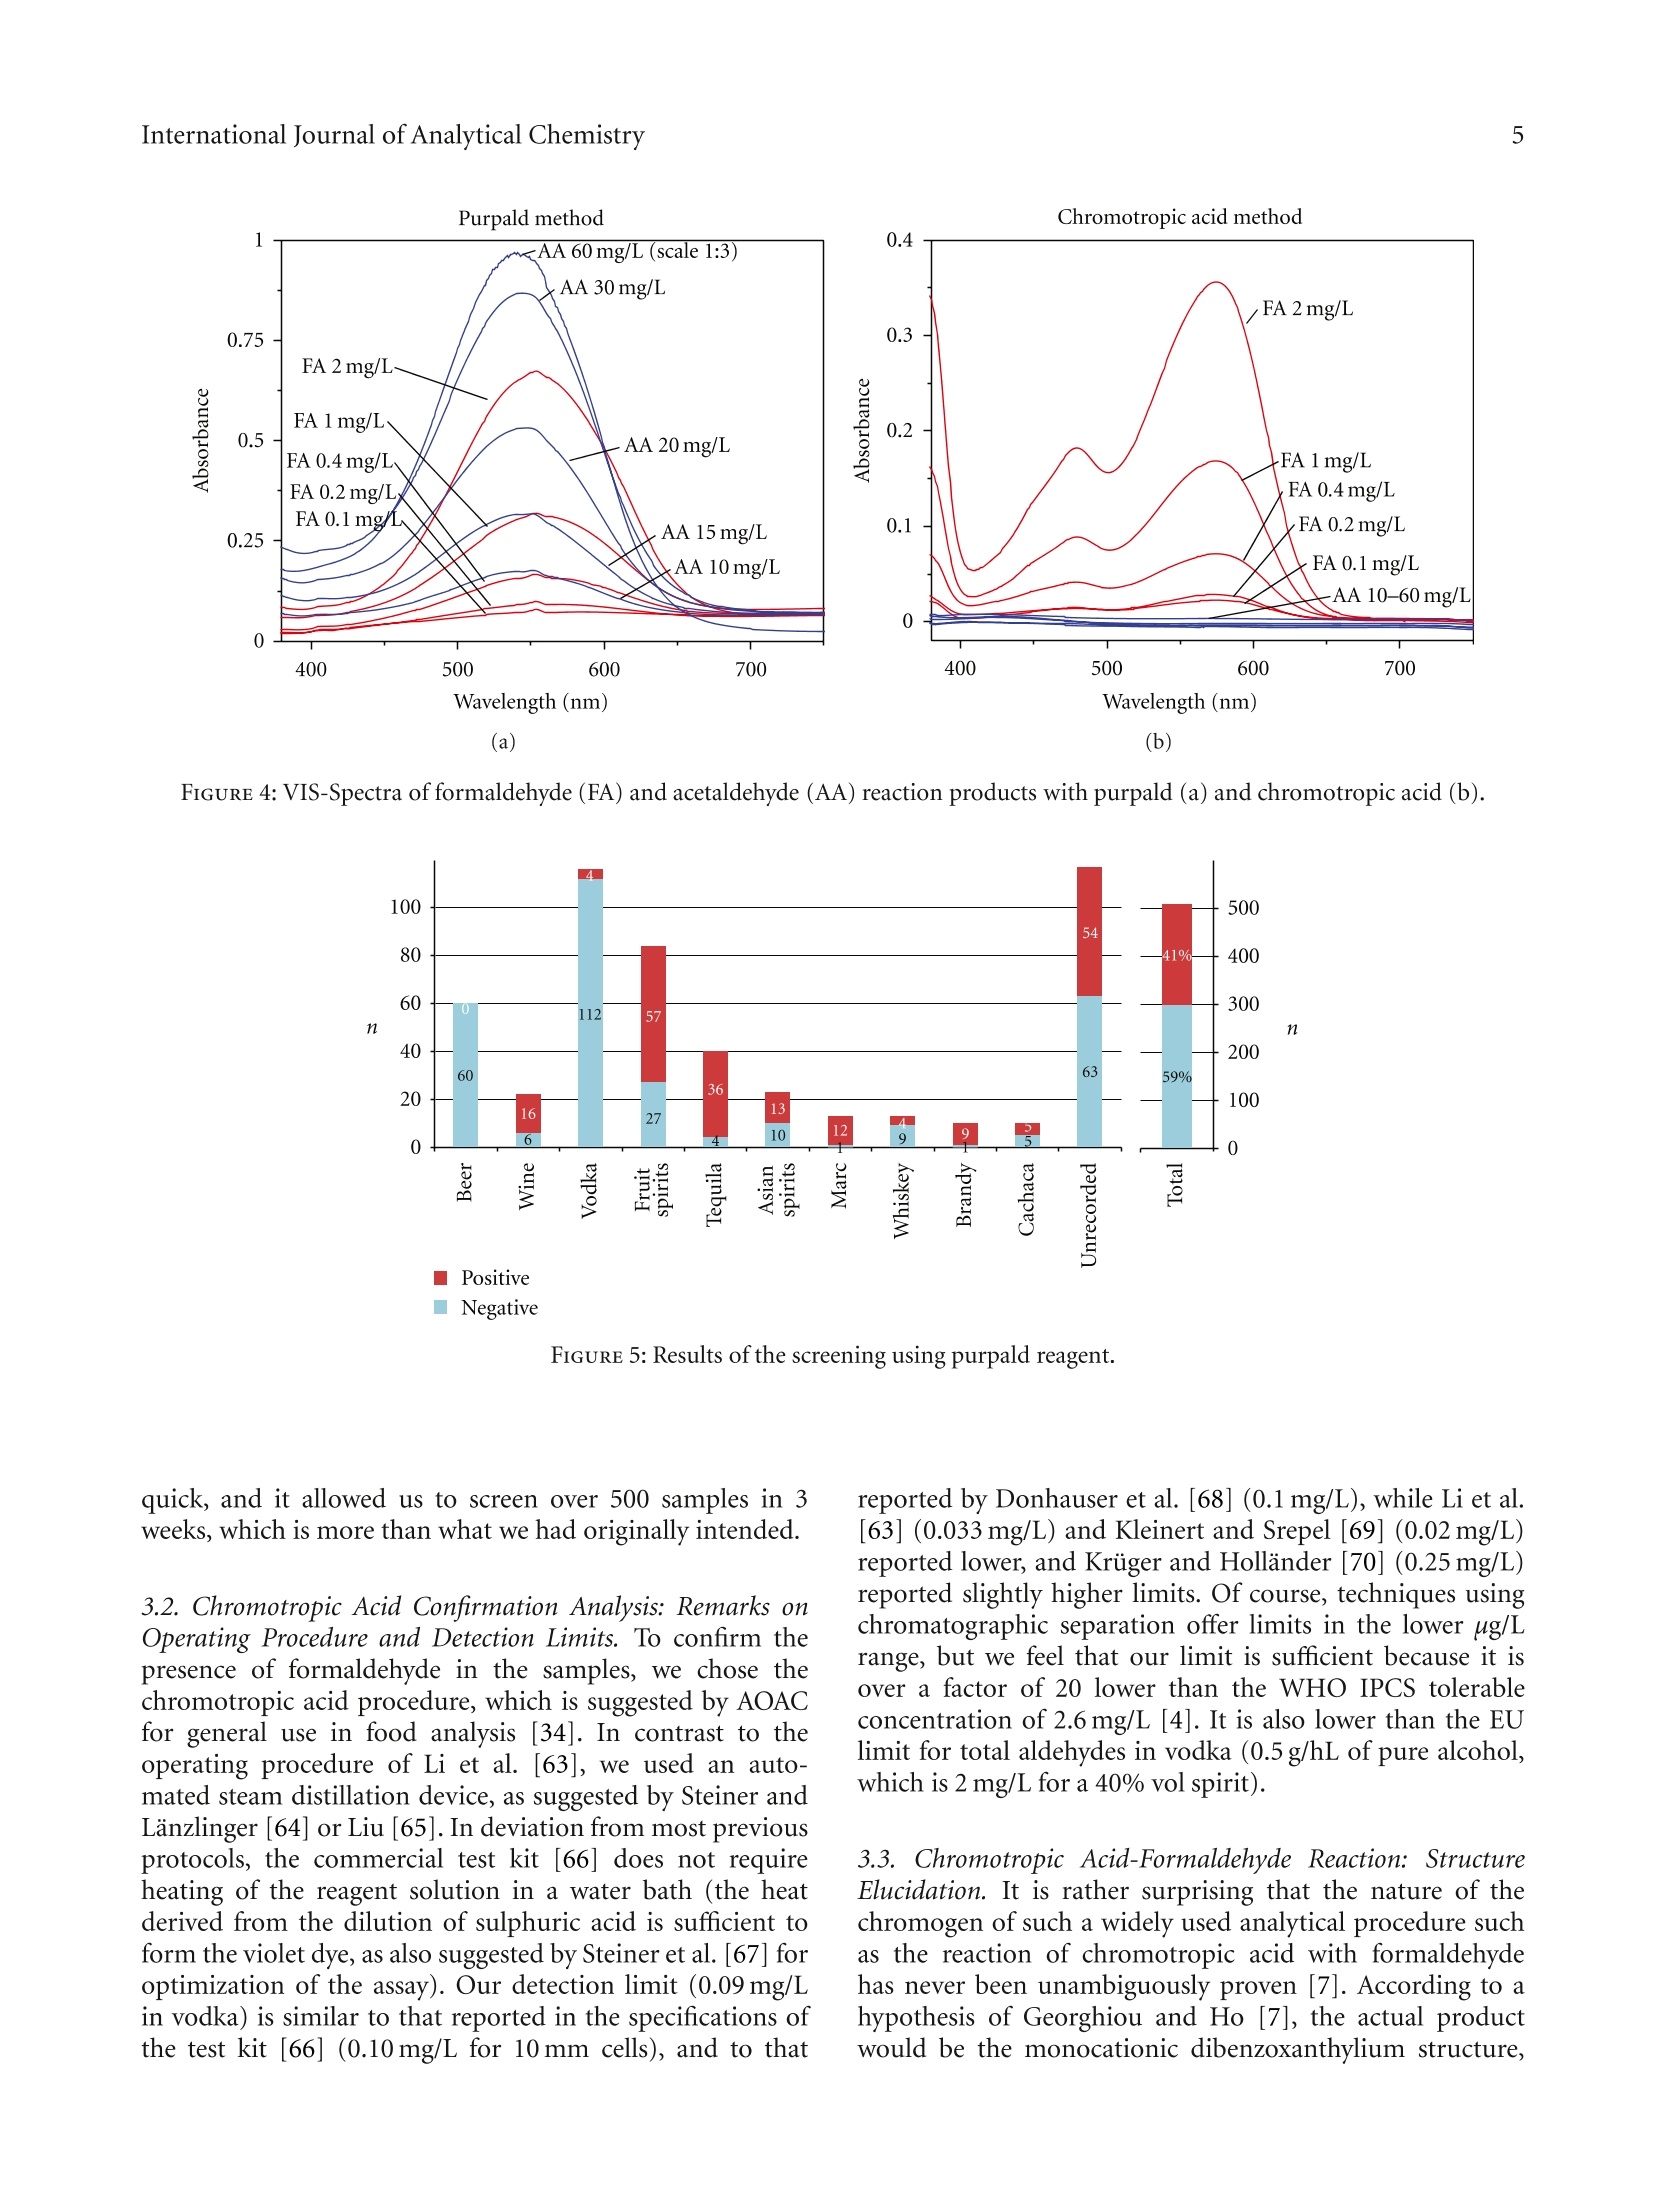
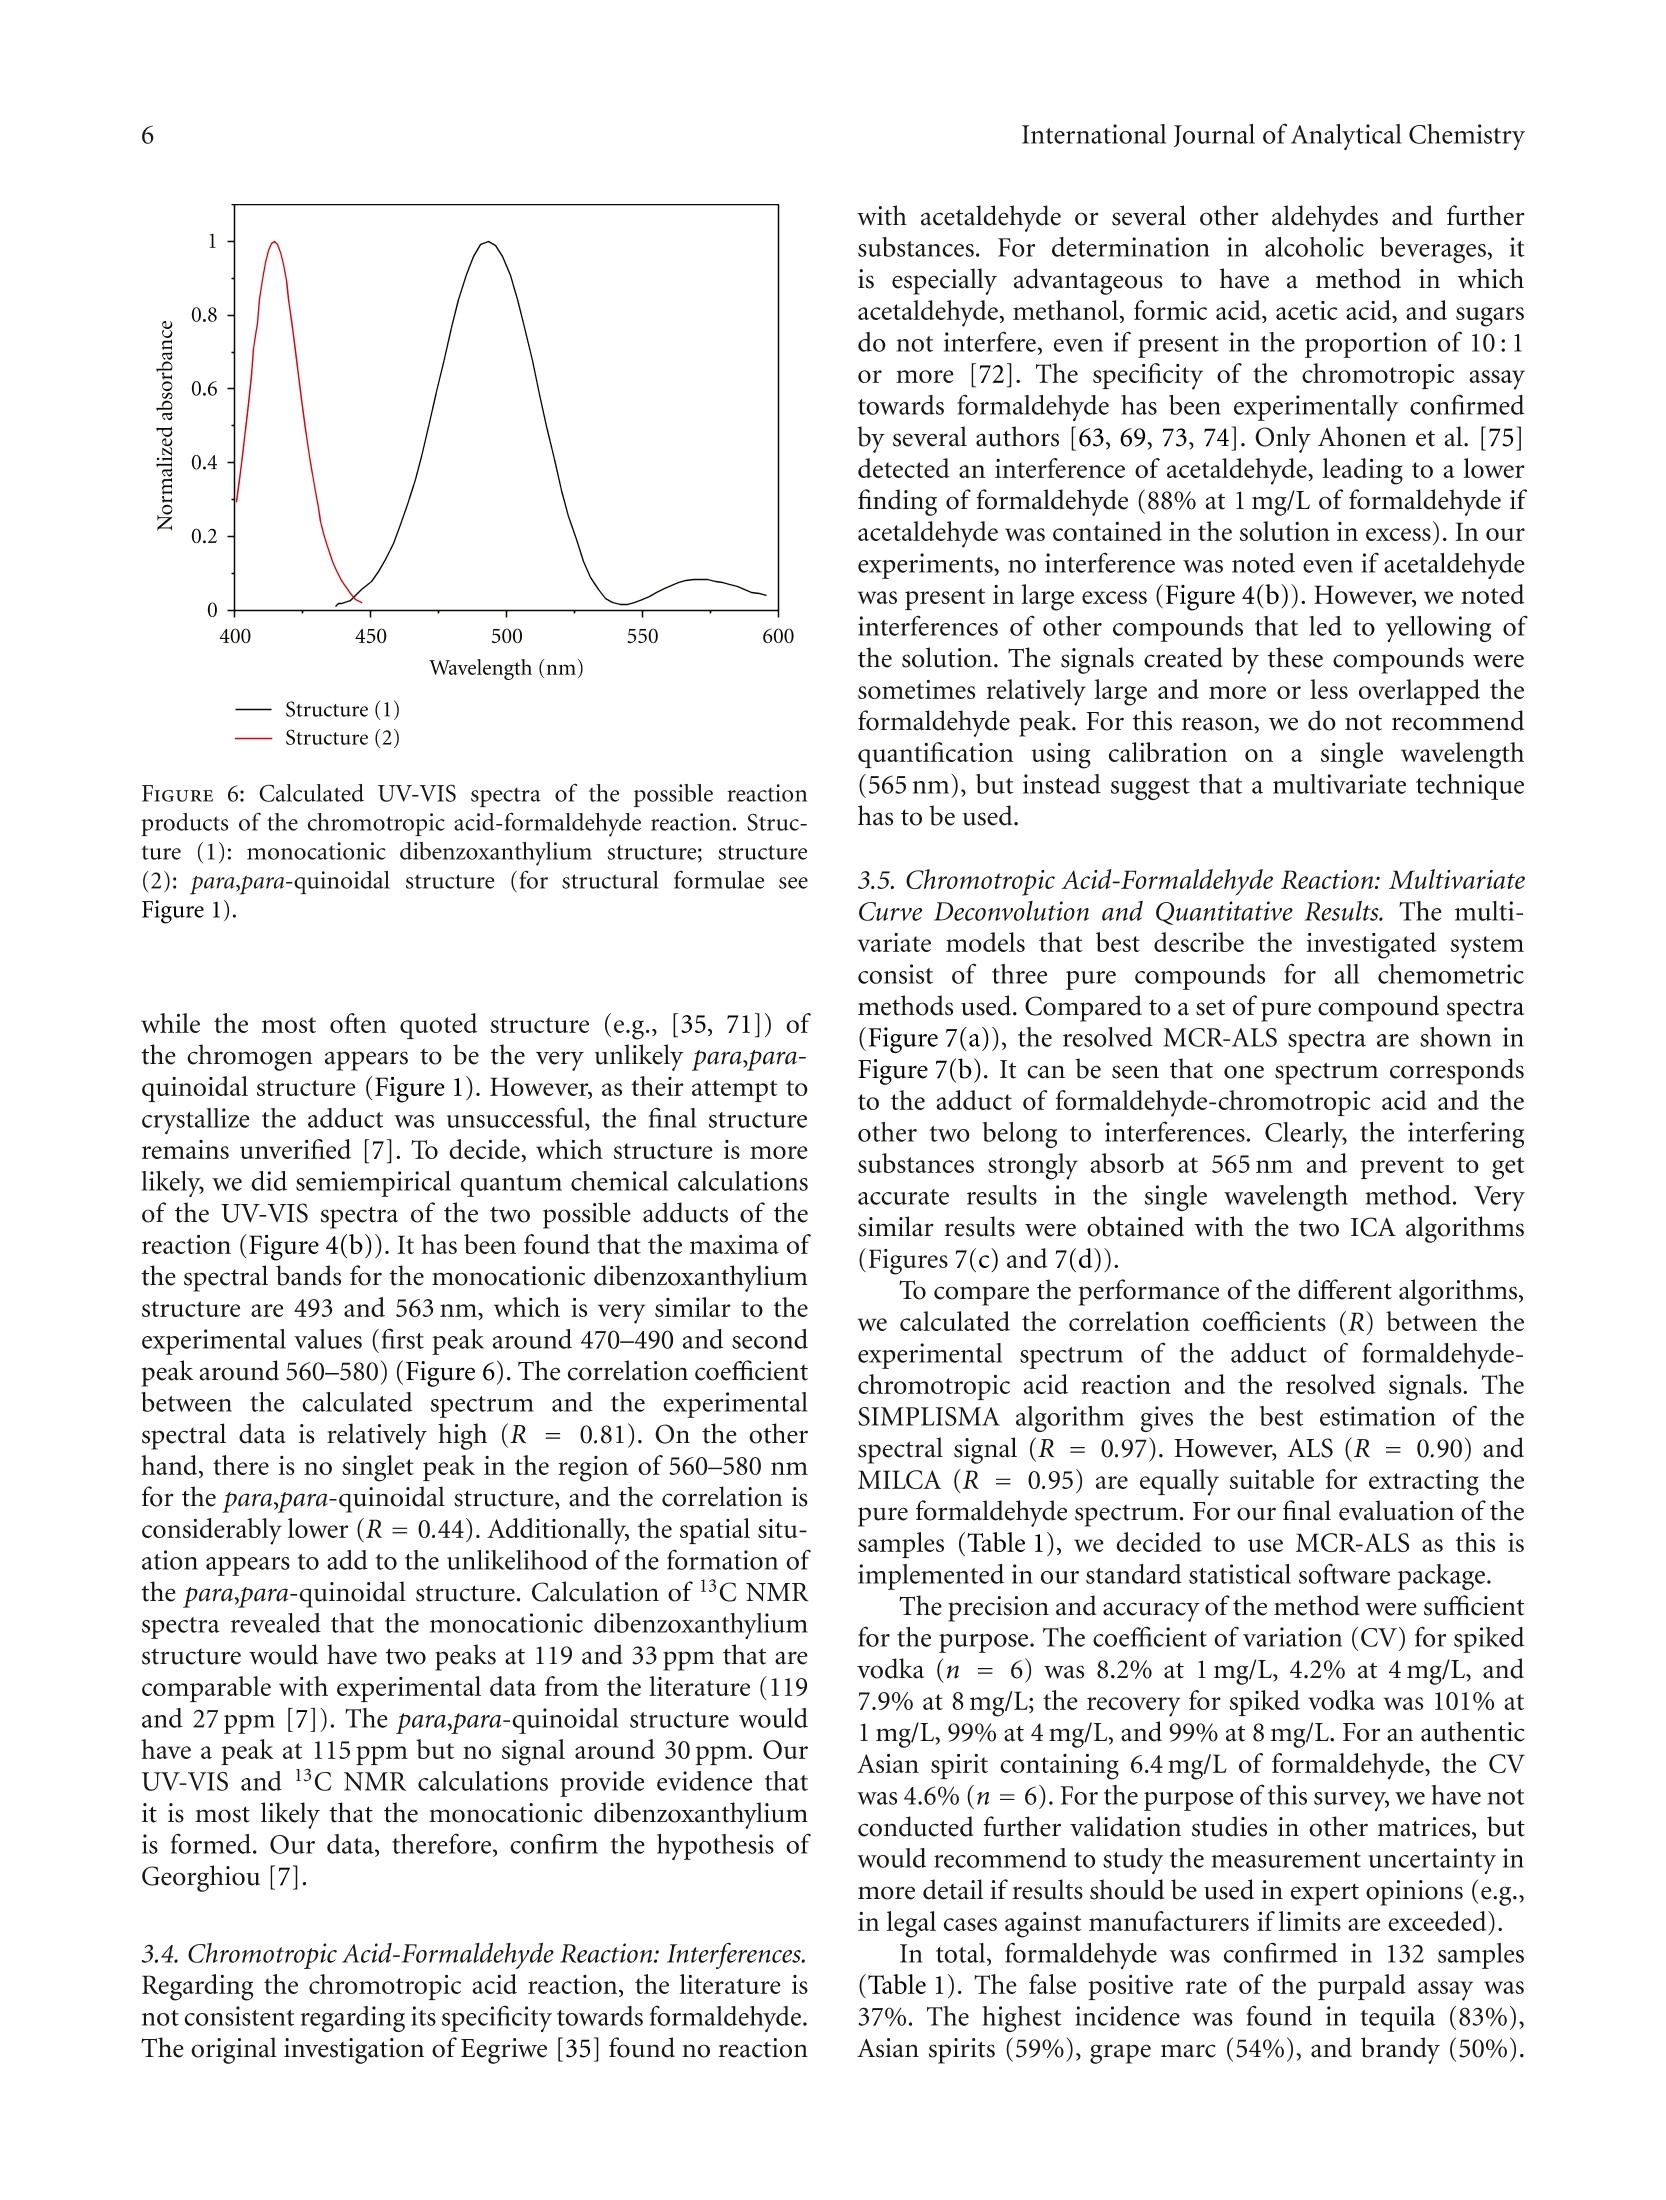
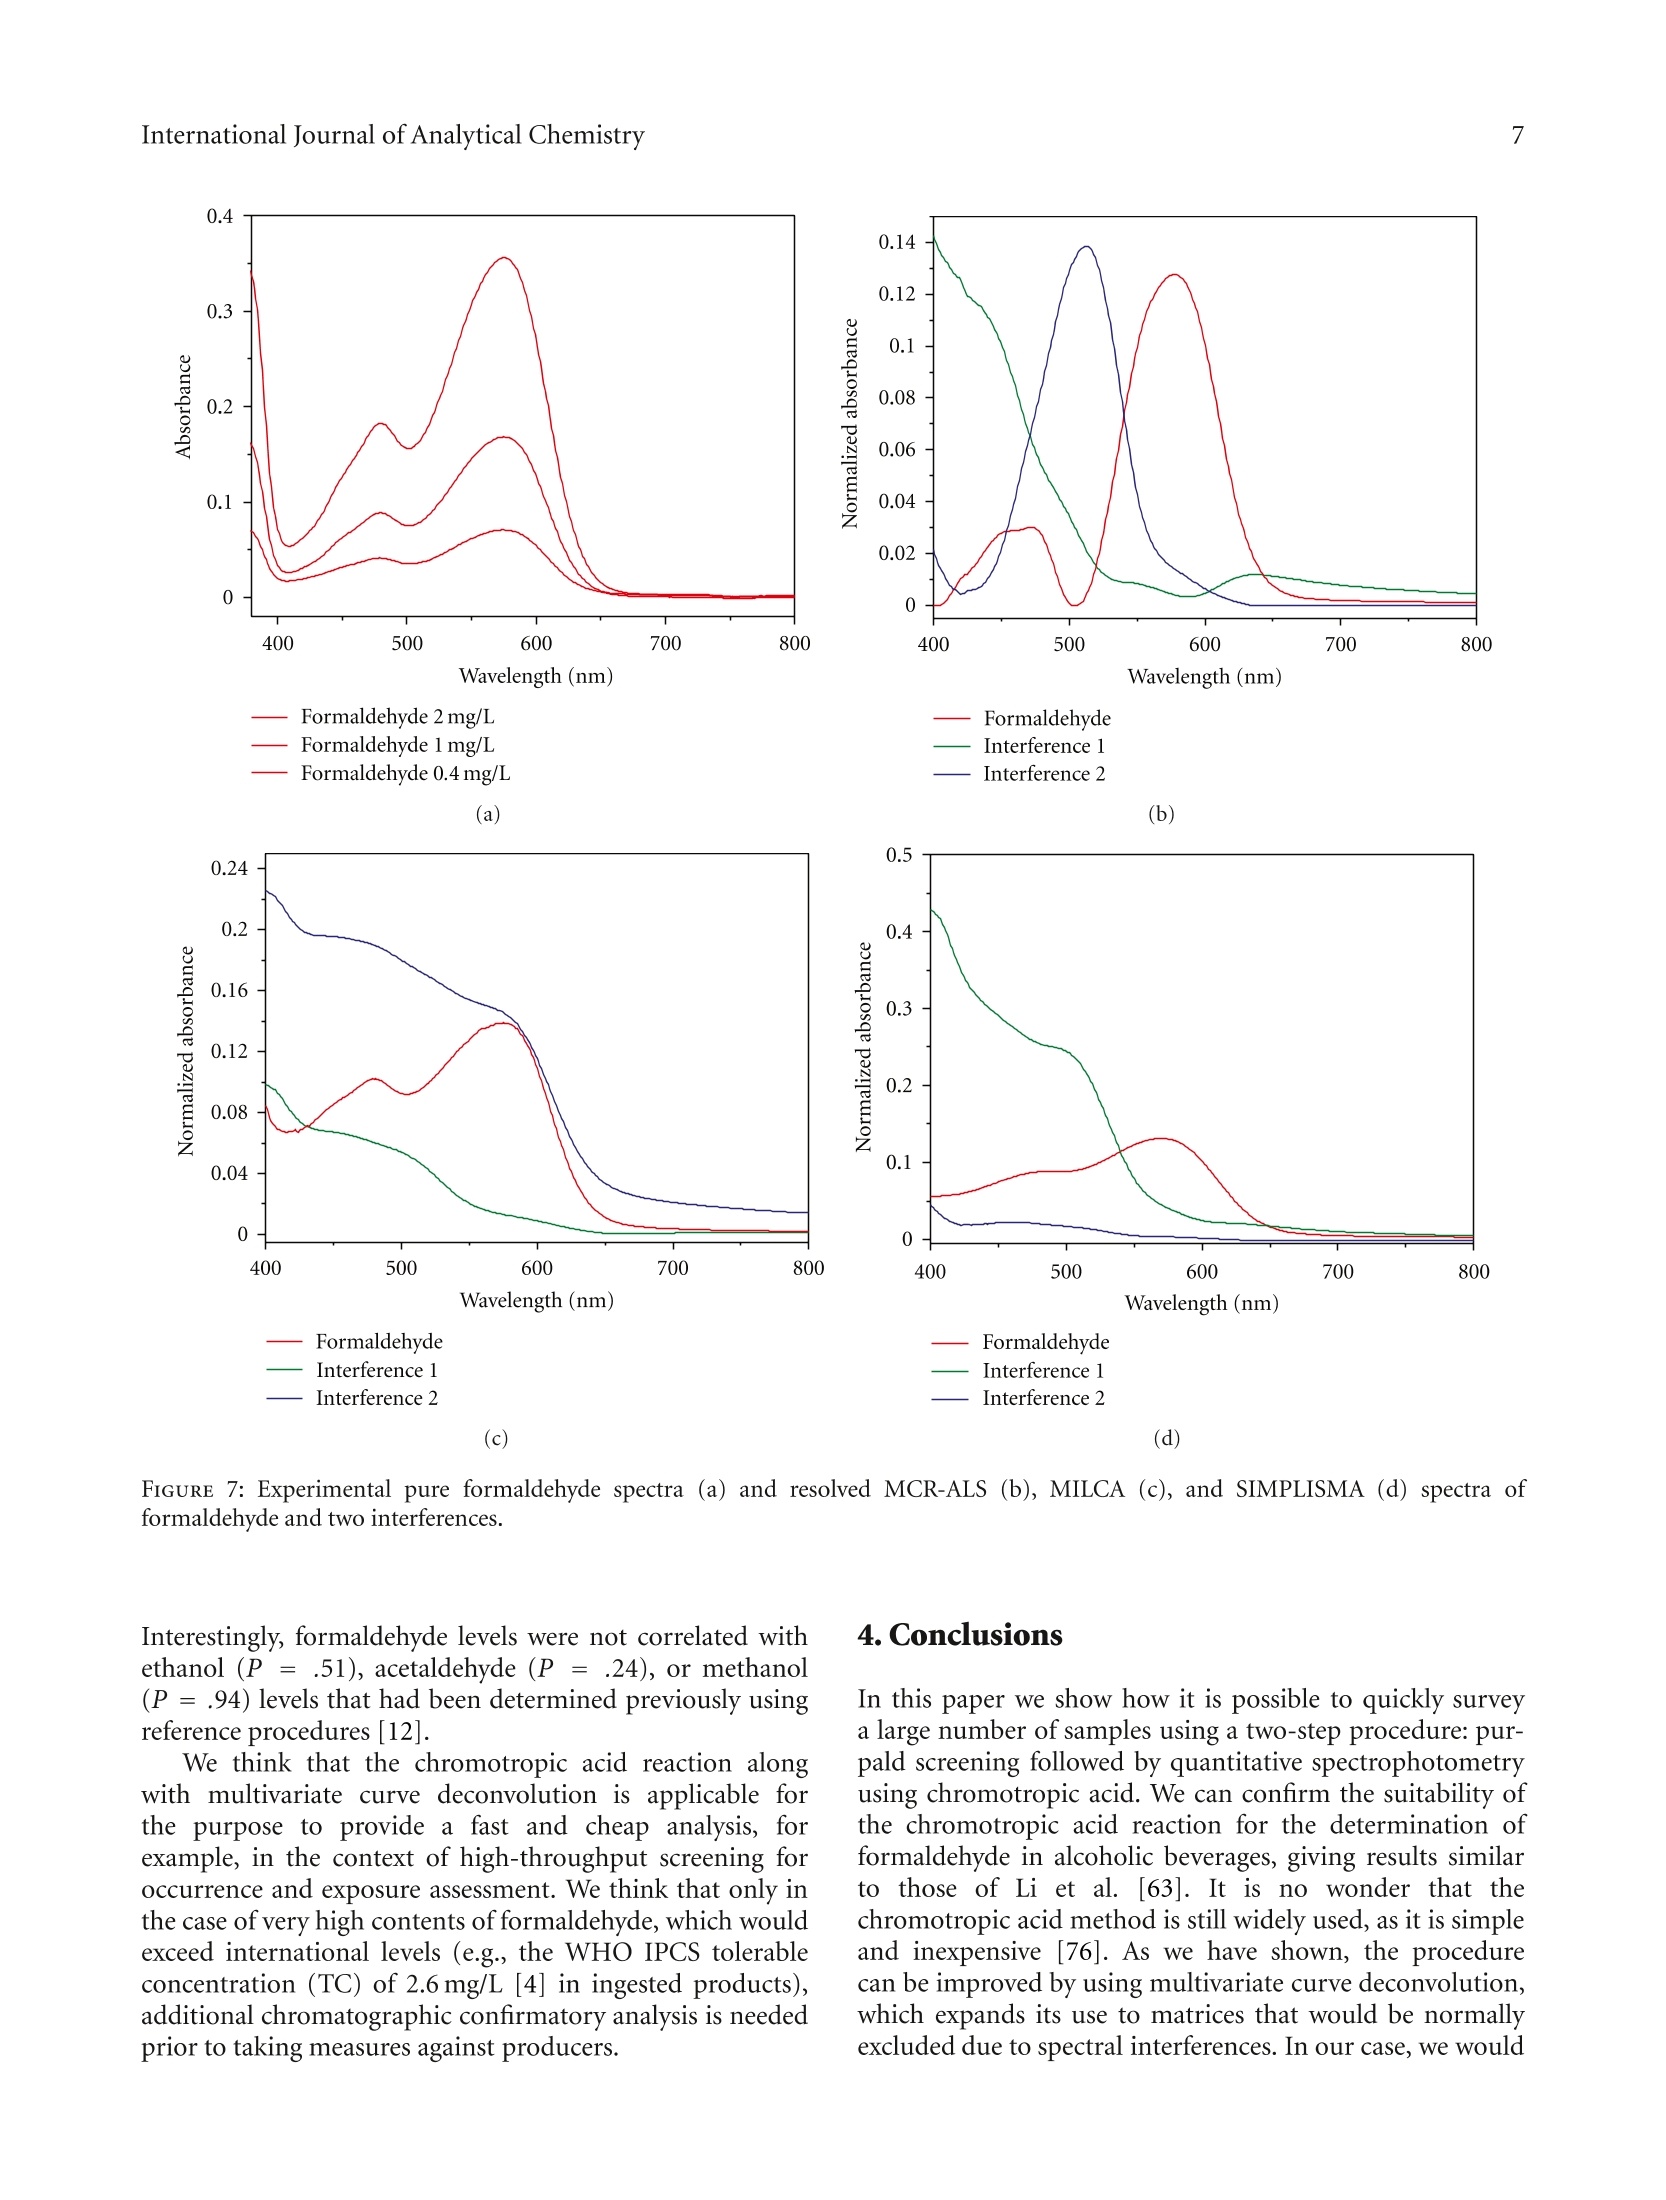
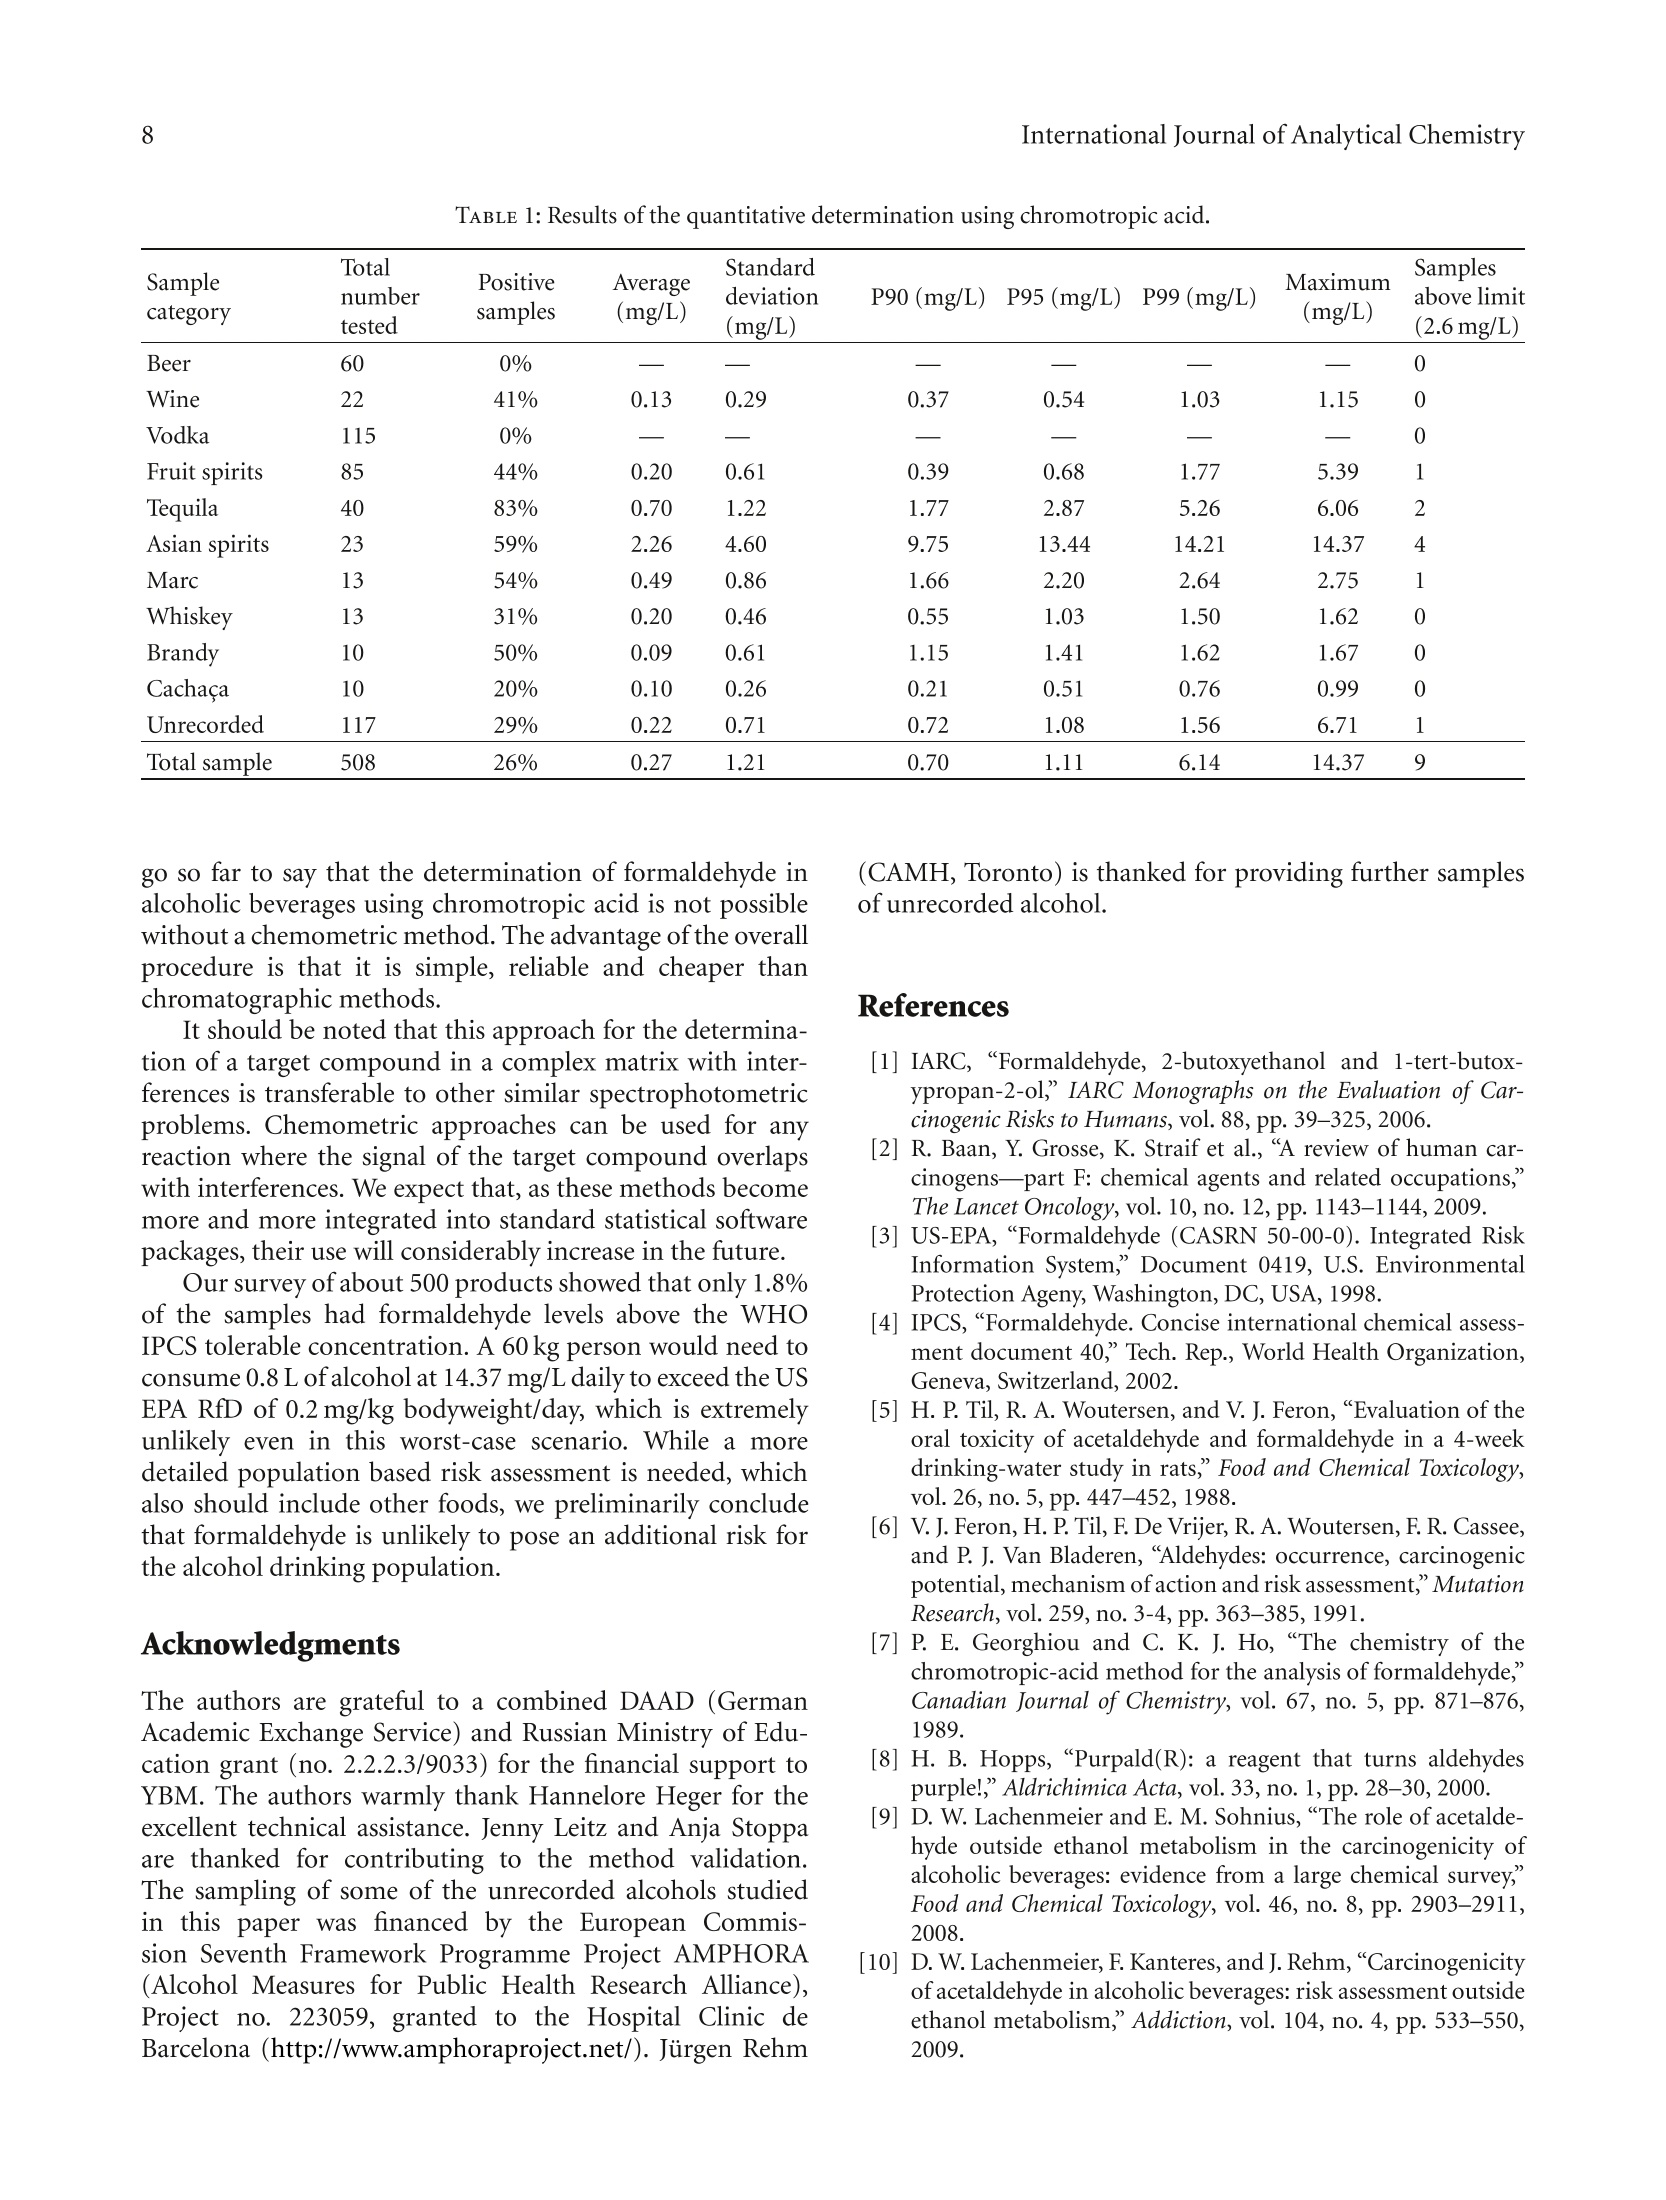
508个酒样中的甲醛的检测 Formaldehyde in Alcoholic Beverages-Large Chemical Survey Using Purpald Screening Followed by Chromotropic Acid Spectrophotometry with Multivariate Curve ResolutionInternational Journal of Analytical ChemistryVolume 2011, Article ID 797604,11 pagesdoi:10.1155/2011/797604 International Journal of Analytical Chemistry2 酒精饮料中的甲醛:使用Purpald筛选的大型化学调查,然后使用多元曲线分辨率的嗜色酸分光光度法 Research Article Formaldehyde in Alcoholic Beverages: Large Chemical Survey Using Purpald Screening Followed by Chromotropic Acid Spectrophotometry with Multivariate Curve Resolution Julien A. Jendral, Yulia B. Monakhova,1,2 and Dirk W.Lachenmeier IChemisches und Veterinaruntersuchungsamt (CVUA) Karlsruhe, Weissenburger Strafe 3, 76187 Kar l sruhe, Germany 2Department of Chemistry, Saratov State Universit y , Astrakhanskaya Street 83, Saratov 410012, Russia Correspondence should be addressed to Dirk W. Lachenmeie r , lachenmeier@web.de Received 11 January 2011; Revised 8 March 2011; Accepted 30 March 2011 Academi c Editor: Jan Ake Jonsson Copyright @ 2011 Jul i en A. Jendral et al. This is an open access article distr i buted under the Creative Commons Attribution License, which permits unrestricted use, distribution , and reproduction in any medium, provided the original work is properly cited. A strategy for analyzing formaldehyde in beer, wine, spirits, and unrecorded alcohol was developed, and 508 samples from wor l dw i de origin were analyzed. In the f ir s t step, samples are quali t at i vely screened using a simple colorimetric t est with the purpald reagent , which is extremely sensit i ve for formaldehyde (detection l i m i t 0.1 mg/L). 210 samples (41%) gave a positive purpald reaction. In the second step, formaldehyde i n posi t ive samples is confirmed by quantitative spectrophotometry of the chromotropic acid -formaldehyde derivative combined w i th Multivariate Curve Resolution-Alternating Least Squares (MCR-ALS).Calculation of UV-VIS and 13C NMR spectra confirmed t he monocationic dibenzoxanthylium structure as the product of t he reaction and disproved the wide l y cited para,para -quinoidal structure. Method validat i on for the spectrophotometric procedure showed a detection limit of 0.09 mg/L and a prec i sion o f 4.2-8.2% CV. In total, 132 samples (26%) contained formaldehyde with an average of 0.27 mg/L (range 0-14.4 mg/L). The highest i ncidence occurred i n tequila (83%), Asian spiri t s (59%), grape marc (54%), and brandy (50%). Our survey showed that only 9 samples (1.8%) had formaldehyde l evels above the WHO IPCS tolerable concentration of 2.6 m g/L. 1.Introduction The International Agency for Research on Cancer (IARC)has upgraded the cancer classification of formaldehyde in 2006 to now being clearly “carcinogenic to humans”(group 1) [1]. More recent l y, formaldehyde has been implicated by the IARC as a causative agent of leukemia as well as nasopharyngeal cancer in humans [2]. The US EPA provides a reference dose for chronic oral exposure (RfD) of 0.2 mg/kg bodyweight/day [3]. The WHO IPCS [4] has establ i shed a tolerable concentration (TC) of 2.6mg/L in ingested products based on animal experiments [5]. Systematic data are currently lacking regarding the formaldehyde content of alcoholic beverages or indeed of most food i n general . Feron et al. [6] estimated that the formaldehyde intake by food may range between 1.5 and 14 mg/person/day , which could,therefore, exceed the RfD in a worst case scenario. As we had previously conducted i n-depth research into acetaldehyde content of alcoholic beverages [9, 10], we were recently asked if we had similar data on formaldehyde and if this compound may pose a risk to consumers in addition to the risk of ethanol [11]. We had no such data,because formaldehyde cannot be analyzed along with the other volat il es (e.g., acetaldehyde and me t hanol ) during a typical gas chromatographic reference method [12]. For this reason, a separate assay has to be developed. It quickly became clea r that i nstrumenta l techniques such as GC [13-20], HPLC [21-30], or f low-i njection fluorimetric analysis [31-33], which require extensive sample prepara t ion and derivatization steps, in addi t ion to having costly and compl i -cated instrumental requirements, would not be feasible fo the economic and time-efficient survey of a l arge number of samples . I n contrast , the commonly applied AOAC reference method 931.08 [34], based on the chromotropic FIGURE 1: Hypothe t ical reaction products of the chromotropic acid -formaldehyde reaction [7]. The monocationic dibenzoxanthylium structure (1) is the more likely product (see text ). ac i d reaction first described by Eegriwe [35], appeared to be applicable (Figure 1). However, it i s a comparatively time-consuming method, which meant t hat the sampl e through-put would not have been large (our aim was to analyze at least 100 samples to provide a valid exposure assessment for consumers). Therefore, we had the idea to preselect samples for the AOAC procedure by first using a rapid colorimetric screening test for formaldehyde. A number of these tests are available for screening of aldehydes (e.g., Fehling’s, Tollen’s and Schiff ’s reagents, see summary by Brandl [36]), but these classical tests suffer from their low speci f icity. However, as late as 1970, a new test using purpald reagent (4-amino-3-hydrazino-5-mercapto-1,2,4-triazole, CAS# 1750-12-5) was developed, which is remarkably sensit i ve and specific for aldehydes [8, 37, 38]. The purpald reaction is based on a condensation of formaldehyde with the reagent to form an aminal, which then reacts under aeration (facilitated by vigorously shaking ofthe solution ) to form a purple coloured oxidation product (Figure 2). The reaction i s sensitive for aldehydes, as ketones are oxidized to an uncoloured product [8,37]. Conveniently, the reagents needed for the purpald as well as the chromotropic acid determination are available in ready-to-use test ki t s (intended for water or disinfectant analysis), and these appear to be usable for testing of alcoholic beverages as well. The major a i m of this paper is to evaluate this two-step strategy to provide a survey of formaldehyde in alcoholic beverages. Furthermore, we provide some i nsight into the structure of the forma l dehyde-chromotropic acid chromogen and apply multivariate curve deconvolution techniques to improve the spectrophotomet-ric assay. 2. Experimental Section 2.1. Instrumentation. All chemicals are commerc i ally avail -able. The formaldehyde test kits (Aquamerck No. 1.08028,based on the purpald reaction, and Spectroquant No.1.14678, based on the chromotropic acid reaction), as well as the sulphuric acid (95-97%) and absolute ethanol, FIGURE 2: Reac t ion mechanism for the determination of aldehydes using purpald according to Hopps [8]. were purchased from Merck (Darmstadt, Germany). Ortho-phosphoric acid (85%) was obtained from Sigma-Aldrich (Taufkirchen Germany). A formaldehyde standard solution (200 mg/L in 40% vol ethanol ) was prepared from a 37%formaldehyde stock solution (Merck, Darmstadt, Germany)and conf i rmed by iodometric t i tration (as speci f ied in the application note supplied with the Spectroquant test kit ). A Vortex Genie 2 mixer (Scienti f ic Industries Inc.Bohemia, NY) was used for homogenization of solutions Sample temperature was controlled in a DC10-W26 heat i ng circulator bath (Haake, Karlsruhe, Germany). A Vapodest 30 automated disti l l a tion device (C. Gerhardt , Fabrik und Lager chemischer Apparate, Bonn, Germany) was used for dist i llation, with condenser cooling a t 1C provided by a recirculating chiller B-740 (Buchi, Flawil , Switzer l and). Spec-trophotometric measurements were performed on a Perkin Elmer Lambda 12 dual beam spectrometer equipped with an automatic cel l changer. The spectrometer was operated with the UV WinLab software (version 2.80.03). The spectra were acquired in a range between 350 and 800 nm at a scanning speed of 120 nm/min with a data interval of 1.0 nm. All measurements were made against ethanol (40% vol) as a blank. 2.2. Rapid Screening Using Purpald Reagent.A A total of 508samples of alcoholic beverages (beer, wine, spirits, and unrecorded alcohol; see [39, 40] for d e tails on unrecorded alcohol) were analyzed using the purpald method according to the specifications of the test kit. Briefly, 5mL of the sample were pipetted into a test tube, and five drops of the alkalinization reagent were added to raise the pH to a level above 13. Af t erwards, the reac t ion was started by adding a microspoonful of the purpald reagent. The solution was then carefully mixed on the vortex mixer. After a reaction t i me of f ive minutes, a purple colour indicated a positive result.Uncoloured solutions indicated the absence of any aldehyde (detection l imit at 0.1 mg/L according to the manufacturer). 2.3. Quantitative Photometric Determination Using the Chro-motropic Acid Method. Only samples that showed a positive purpald reaction needed further analysis. Formaldehyde in these was quantified us i ng the chromotropic acid method.Uncoloured samples (e.g.,vodka, blanco tequila, fruit spirits)were used without further preparation. Coloured samples (e.g., beer, wine, whiskey) were dis t illed according to the AOAC method [34]. The distillation was accomplished using an automated steam distillation device (see [41-43] for further details on steam distillation in the sample preparation of alcoholic beverages). To ensure consistent experimental conditions, the system was preheated before every startup, running a blank sample at full steam power (according to the manufacturer’s i nstructions). Next, 100 mL of sample were brought to 20°C and pipetted into a 250 mL Kjeldatherm digestion tube. To prevent evaporation while multi p le tests were prepared, the tubes were temporarily sealed using laboratory f i lm. To prepare the receiver, a spatula of crushed ice was placed in a 50 mL graduated flask before adding 3mL of sulphuric acid (25%). The receiver was then placed underneath the outlet tubing of the dist i llation device in a beaker filled with ice water to assure cooling during the distillation process (Figure 3). Just before clamping the digestion tube into the distillation device,1 mL of phosphoric acid (85%) was added. The automatic distillation was started and run until the calibration mark was nearly reached. After termination, the f lask wa s tightly sealed, the dist i llate was brought to 20°C in a water bath and filled up to the calibration mark with 40% ethanol. The chromotropic acid method was performed according to the manufacturer 's test kit instructions. A 5mL volume of the sulphuric reagent was pipetted into a test tube,and a microspoonfu l of the chromotropic acid reagent was dissolved by holding the tube in an ultrasonic bath for approximately 120 seconds. A 3 mL volume of the sample solution or the distillate was then slowly pipetted i nto the tube. To start the reaction, the hot tube was closed with a screw cap, and the solution was carefully homogenized FIGURE 3: Automated steam distillation device for the determi-nation of formaldehyde in alcoholic beverages : (1) Kjeldatherm digestion tube with acidified sample, (2) steam i nlet tubing (3) Viton-cone, (4) distillation condenser cooled at 1°C,(5)distribution head, (6) keyboard and di s play (7) dist il late outle tubing, and (8) cooled graduated flask as receiver containing ice and sulfuric acid (25%), in which the outlet tubing must be submerged to avoid losses. using a vortex mixer. After a reaction time of 10 minutes,the contents of the tube were briefly mixed again. A 2.5 mI volume of the reaction liquid was transferred into a cuvette for measurement of the absorbance at a wavelength of 565 nm as well as to record a full spectrum. The cal i bration was conducted using freshly prepared standards (0.5, 1.0,2.0, 4.0, 8.0 mg/L in vodka 40% vol) treated similar l y to the samples. 2.4. Multivariate Analysis to Improve Quantitative Photom-etry. In prel i minary experiments with pure standards, no interference was noted for the chromotropic acid method even if acetaldehyde was present i n large excess. However while analysing real samples, we noted interferences of other compounds that led to yellowing/browning of the solution. For many samples, the signals created by these matrix compounds were sometimes relatively large and more or less overlapped the formaldehyde peak. For this reason, calibration on a single wavelength (565nm) is not recommended for formaldehyde quantification in alcoholic beverages. Instead, we evaluated different multivariate tech -niques such as multivariate curve resolution (MCR) O independent component an a lysis (ICA). These methods are able to extract the t arge t spec t rum from a complex matrix and therefore could improve the analytical procedure to determine formaldehyde in alcoholic beverages. Much research in recent years has been done to solve the mixture analysis problem and to extract real spectra and concentration profiles from overlapping spectral data without any a priori assumptions about the composition of the system [44-48]. Nowadays, the MCR-ALS (Multivariate Curve Resolu-tion-Alternating Least Squares) method developed by Tauler [46, 49, 50] is the most well -known and frequently used self -modell i ng algorithm for spectral deconvolution [44, 51].Results of this method can be considerably improved by applying contraints based on the previous know l edge about the system studied (e.g., nonnegativity, closure, unimodal-ity) [46]. Previous examples in food analysis include the determination of vitamins, food colours , alcohols, and dairy products 44,52-54. Another set of approaches for multivariate analysis is known as “independent component analysis”(ICA) [55,56]. In some interpretations, ICA can be considered as an extension of principal component analysis (PCA), the basis of many chemometric methods. ICA methods differ in numerical measures of statistical independence and approx-imations. The MILCA algorithm (Mutual Information Least Dependen t Component Ana l ysis) is employed in the present study. This algorithm possesses some unique properties that make it advantageous in comparison with other ICA techniques [57]. MILCA i s based on the search for the least dependent (in contrast to independent) mixture components gauged by precise numerical estimates of mutual informa-tion [58] as a measure of signal dependence. It was found that MILCA outperforms other specialized chemometric algorithms for spectra decomposition problems and can be used for, for example, the analysis of vitamins [47,52] and human brain samples [57]. The third algorithm we apply is SIMPLISMA (Simple-to-use-Interactive-Self-Modelling-Mixture -Analysis)[59],which belongs to the pure variable selection methods. It finds the most representat i ve row or column profiles for the different compounds in the data set. When the selectivity conditions are favourable, the row or column can be directly associated with the pure concentration or response profile and the successful resolution of the mixture can be achieved. For MCR calculation we used the software Unscrambler X version 10.0.1 (Camo Software AS, Oslo, Norway). We applied nonnegat i vity constraints during the ALS optimiza-tion. For the ICA calculations, we used Matlab v. 7.0(The Math Works, Natick, Mass, USA). We applied the SIMPLISMA [59] and MILCA [58] algorithms. The data set for analysis comprised of the 321 alcoholic beverages tested positive in the purpald assay. To assess the similarit i es between the resolved and the experimental spectra, we used Pearson's correlation coeff i cient (R). 2.5. Quantum-Chemical Calculations for Structure Elucida-tion. HyperChem Professional (Hypercube, Gainesville, Fla, USA) sof t ware package (v.8.0) was used for quantum chem-ical calcul a tions. The main goal of all quantum-chemical methods is the solving of the Schrodinger equation. In this case based on the Har t ree-Fok-Rutan equation by the self-consistent field (SCF) method, we applied the semiempirica PM3 (Parametr i sed Model 3) method for calculation with full geometry optimization. In most cases it is the most accurate semiempirical method. The main approaches of the PM3 method include adiabatic, one-electron, MO LCAO (molecular orbital as a linear combination of atomic orbitals )and INDO (I ntermediate Neglect of Differential Overlap)approximations. For UV-VIS spectra calculation, we used 5occupied and unoccupied orbitals using the configuration interac t ion (CI) method. For details regarding the calcula-tions, see [60]. 13C NMR spectra calculations were carried out using ChemBioDraw 12.0 software (CambridgeSoft, Cambridge,UK). Chemical shif t s are est i mated for all hydrogens or carbon atoms for which additivity rules are available.Following a hierarchical list, the algorithm first identifies key substructures of a molecule. A substructure provides the base value for the estimated shift. The 13CNMR Shift tool is based on 4000 parameters. It also implements mode ls for ethylenes (cis/trans) and cyclohexanes (equatorial/axial). In case of 13C NMR, it estimates over 95% of the shifts with a mean deviation of 0.29 ppm and standard deviation of 2.8 ppm.For details, see [61, 62]. 3. Results and Discussion 3.1. Purpald Screening. In the f irst stage of the projec t , we evaluated the purpald test kit for use with alcoholi c beverages (the test kit was originally intended for disinfectant and rinsing solutions (e.g., laundries) and aqueous solutions).We have spiked vodka samples (40% vol) with different concentrations of formaldehyde and acetaldehyde and not only visua l ly examined the colour reaction but also made a spec t rophotometric measurement of t he full visible light spectrum. Our results show that the purpald assay i s usable with alcoholic solutions, and we were able to confirm the manufacturer’s detection limit of 0.1 mg/L. While it was recognized that the absorption maxima of different aldehydes are too close to allow their differentiation [38],we are the first to quantitatively record differences in sen-sitivity between formaldehyde and acetaldehyde (the assay is approximately 20 times more sensitive for formaldehyde than for acetaldehyde (Figure 4(a))). As many alcoholic beverages (i.e ., espec ia lly beer, vodka, or rum) contain less than 20 mg/L of acetaldehyde [9], the spec if icity of this assay is suitable to select formaldehyde-positive samples without an unacceptably high number of false-positives.Although we were able to exclude more than 50% of the original samples as being free of f ormaldehyde or any other aldehyde detectable with purpald (Figure 5), the assay does not allow us to conclude that a product in fact does contain formaldehyde, so that a more specific confirmation is then needed. Nevertheless, we think that the strategy to screen the samples with purpald i s worthwhile, as t he assay i s very Chromotropic acid method 0.4 FA 2mg/L 0.3 0.22 FA1mg/L FA 0.4mg/L 0.1 FA 0.2 mg/L FA 0.1 mg/L -AA 10-60 mg/I 0 400 500 600 700 Wavelength (nm) (a) (b) FIGURE 4: VIS-Spectra of formaldehyde (FA) and acetaldehyde (AA ) reaction products with purpald (a) and chromotropic acid (b). 7 Negative quick, and it allowed us to screen over 500 samples in 3weeks, which is more than what we had originall y intended. 3.2. Chromotropic Acid Confirmation Analysis: Remarks on Operating Procedure and Detection Limits. To confirm the presence of formaldehyde in the samples, we chose the chromotropic ac i d procedure, which is suggested by AOAC for general use in food analysis [34]. In contrast to the operating procedure of L i et al. [63], we used an auto-mated steam dist i llation device, as suggested by Steiner and Lanzl i nger [64] or Liu [65]. In deviation from most previous protocols, the commercial test kit [66] does not require heating of the reagent solution in a water bath (the heat derived from the dilution of sulphuric acid i s sufficient to form the violet dye, as also suggested by Steiner et al.[67] for optimization of the assay). Our detection li mit (0.09mg/L in vodka ) is similar to that reported in the specifications of the test kit [66] (0.10mg/L for 10 mm cells), and to that reported by Donhauser et al. [68](0.1 mg/L ), whi l e L i et al [63](0.033 mg/L) and Kleiner t and Srepe l [69] (0.02mg/L)reported lowe r , and Kruger and Hollander [70] (0.25mg/L)reported slightly higher limits. Of course, techniques using chromatographic separation offer l imi t s in the lower ug/I range, but we feel that our l imit i s sufficient because i t is over a factor of 20 lower than the WHO IPCS tolerable concentration of 2.6 mg/L [4]. It is also lower than the EU limit for total aldehydes in vodka (0.5 g/hL of pure alcohol,which is 2 mg/L for a 40% vol spir i t). 3.3. Chromotropic Acid-Formaldehyde Reaction: Structure Elucidation. It is rather surprising that the nature of the chromogen of such a widely used analytical procedure such as the reaction of chromotropic acid with formaldehyde has never been unambiguously proven [7]. According to hypothesis of Georghiou and Ho [7], the actual product would be the monocationic dibenzoxanthylium structure, —Structure (1) Structure (2) FIGURE 6: Calculated UV-VIS spectra of the possible reaction products of the chromotropic acid -formaldehyde reactio n. Struc-ture (1): monocationic dibenzoxanthylium structure; struc t ure (2): para,para-quinoidal struc t ure (for structural formulae see Figure 1). while the most often quoted structure (e.g., [35,71]) of the chromogen appears to be the very unlikely para,para-quinoidal structure (Figure 1). However, as their attempt to crystallize the adduct was unsuccessful, the final structure remains unverif i ed [7]. To decide, which structure is more likely, we did semiempirical quantum chemical ca l culations of the UV-VIS spectra of the two possible adducts of the reaction (Figure 4(b)). It has been found that the maxima of the spectral bands for the monocationic dibenzoxanthy l ium structure are 493 and 563 nm, which i s very similar to the experimental values (f i rst peak around 470-490 and second peak around 560-580) (Figure 6). The correlation coefficient between the calculated spectrum and the experimental spectral data i s relatively high (R = 0.81). On the other hand, t here is no singlet peak i n the region of 560-580 nm for the para,para-quinoidal structure, and the correlation i s considerably lower (R=0.44). Additionally, the spa t ial situ-ation appears to add to the unl i kelihood of the formation of the para,para-quinoid a l structure. Calculation of 13C NMR spectra revealed that the monocationic dibenzoxanthylium structure would have two peaks at 119 and 33 ppm that are comparable with experimental data from the l iterature (119and 27 ppm [7]). The para,para-quinoidal structure would have a peak at 115 ppm but no signal around 30 ppm. Our UV-VIS and 13C NMR calculations provide evidence that it is most likely that the monocationic dibenzoxanthylium is formed. Our data, therefore, confirm the hypothesis of Georghiou [7]. 3.4. Chromotropic Acid-Formaldehyde Reaction: Interferences.Regarding the chromotropic acid reaction, the l iterature is not consistent regarding i t s specif i city towards formaldehyde.The or i ginal invest i gation of Eegriwe [35] found no reaction with acetaldehyde or several other aldehydes and further substances. For determina t ion in alcoholic beverages, it is especially advantageous to have a method in which acetaldehyde, methanol, formic acid, acetic acid, and sugars do not interfere , even if present in the proportion of 10:1or more [72]. The speci f ic i ty of the chromotropic assay towards formaldehyde has been experimentally confirmed by several authors [63, 69, 73, 74]. Only Ahonen et a l . [75]detected an interference of acetaldehyde, leading to a lower finding of formaldehyde (88% at 1 mg/L of formaldehyde if acetaldehyde was contained in the solution in excess). In our experiments, no i nterference was noted even i f acetaldehyde was present i n large excess (Figure 4(b)). However, we noted interferences of other compounds that led to yellowing of the solution. The signals created by these compounds were sometimes relatively large and more or less overlapped the formaldehyde peak. For this reason, we do not recommend quant i fication using calibration on a single wavelength (565 nm), but instead suggest that a multivariate technique has to be used. 3.5. Chromotropic Acid-Formaldehyde Reaction: Multivariate Curve Deconvolution and Quantitative Results. The mult i -variate models tha t best describe the investigated system consist of t hree pure compounds for all chemometric methods used. Compared to a set o f pure compound spectra (Figure 7(a)), the resolved MCR-ALS spectra are shown in Figure 7(b). It can be seen that one spectrum corresponds to the adduct of formaldehyde-chromotropic acid and the other two belong to inter f erences. Clearly, the interfering substances strongly absorb at 565 nm and prevent to get accurate results in the single wavelength method. Very similar results were obtained with the two ICA algor i thms (F i gures 7(c) and 7(d)). To compare the performance of the different algor i thms,we calculated the correlation coe f ficients (R) between the experimental spec t rum of the adduct of formaldehyde-chromotropic acid reaction and the resolved s i gnals. The SIMPLISMA algorithm gives the best estimation of the spectral signal (R =0.97). However, ALS (R = 0.90) and MILCA (R =0.95) are equally suitabl e for extracting the pure formaldehyde spectrum. For our final evaluation of the samples (Table 1), we decided to use MCR-ALS as this is implemented i n our standard statistical software package. The precision and accuracy of the method were sufficient for the purpose. The coef f icient of variation (CV) for spiked vodka (n = 6) was 8.2% a t 1 mg/L, 4.2% at 4 mg/L, and 7.9% at 8 mg/L ; the recovery for spiked vodka was 101% at 1 mg/L, 99% a t 4 mg/L, and 99% at 8 mg/L . For an authentic Asian spirit containing 6.4 mg/L of formaldehyde, the CV was 4.6% (n =6). For the purpose of this survey, we have not conducted further validation studies in other matrices, but would recommend to study the measurement uncertainty in more detail if results should be used in exper t opinions (e.g.in lega l cases against manufacturers i f l i mits are exceeded). In total, formaldehyde was confirmed in 132 samples (Table 1). The false positive rate of the purpald assay 工 was 37%. The highest incidence was found in tequila (83%),Asian spirits (59%), grape marc (54%), and brandy (50%). Wavelength (nm) Wavelength (nm) Formaldehyde 2 mg/L Formaldehyde Formaldehyde 1 mg/L Interference l Formaldehyde 0.4 mg/L 一 I nterference 2 (a) (b) Wavelength (nm)—Formaldehyde —Interference 1Interference 2(c) Wavelength (nm) Formaldehyde Interference 1 Interference 2 (d) FIGURE 7: Experimental pure formaldehyde spectra (a) and resolved MCR-ALS (b), MILCA (c ), and SIMPLISMA (d) spectra of formaldehyde and two interferences. Interest i ngly, formaldehyde levels were not correlated with ethanol (P = .51), acetaldehyde (P =.24), or methanol (P = .94) levels that had been determined previously using reference procedures [12]. We think that the chromotropic acid reaction along with multivariate curve deconvolution is applicable for the purpose to provide a fast and cheap analysis, for example, i n the context of high-throughput screening for occurrence and exposure assessment. We think that on l y in the case of very high contents of formaldehyde, which would exceed international levels (e.g., the WHO IPCS tolerable concentration (TC) of 2.6 mg/L [4] in ingested products),additional chromatographic confirmatory an a lysis is needed prior to taking measures against producers. 4. Conclusions In this paper we show how i t is possible to quickly survey a l arge number of samples using a two-step procedure: pur-pald screening followed by quantitative spectrophotometry using chromotropic acid. We can confirm the suitability of the chromotropic acid reaction for the determination of formaldehyde in alcoholic beverages, giving results similar to those of Li et al. [63]. It is no wonder that the chromotropic acid method is still widely used, as it is simple and inexpensive [76]. As we have shown, the procedure can be i mproved by using multivariate curve deconvolution,which expands its use to matrices that would be normally exc l uded due to spectral interferences. In our case, we would TABLE 1: Results of the quanti t ative determination using chromotropic acid. Sample Total number tested Positive samples Average (mg/L) Standard deviation (mg/L) P90(mg/L) ) P95 (mg/L) P99 (mg/L) Maximum Samples above limit (2.6mg/L) category (mg/L) Beer 60 0% 一 一 一 一 一 一 0 Wine 22 41% 0.13 0.29 0.37 0.54 1.03 1.15 0 Vodka 115 0% 一 一 一 0 Fruit spirits 85 44% 0.20 0.61 0.39 0.68 1.77 5.39 1 Tequila 40 83% 0.70 1.22 1.77 2.87 5.26 6.06 2 Asian spirits 23 59% 2.26 4.60 9.75 13.44 14.21 14.37 4 Marc 13 54% 0.49 0.86 1.66 2.20 2.64 2.75 1 Whiskey 13 31% 0.20 0.46 0.55 1.03 1.50 1.62 0 Brandy 10 50% 0.09 0.61 1.15 1.41 1.62 1.67 0 Cachaca 10 20% 0.10 0.26 0.21 0.51 0.76 0.99 0 Unrecorded 117 29% 0.22 0.71 0.72 1.08 1.56 6.71 1 Total sample 508 26% 0.27 1.21 0.70 1.11 6.14 14.37 9 go so far to say that the determination of formaldehyde in alcoholic beverages using chromotropic acid is not possible without a chemometric method. The advantage of the overall procedure is tha t it is simple, reliable and cheaper than chromatographic methods. It should be noted that this approach for the determina-tion of a target compound in a complex matrix with i nter-ferences is transferable to other similar spectrophotometric problems. Chemometric approaches can be used for any reaction where the signal of the target compound overlaps with interferences. We expect that, as these methods become more and more i ntegrated into standard statistical software packages, their use will considerably increase in the future. Our survey of about 500 products showed that only 1.8%of the samples had formaldehyde levels above the WHO IPCS tolerable concentration. A 60 kg person would need to consume 0.8 L of alcohol at 14.37 mg/L daily to exceed the US EPA RfD of 0.2 mg/kg bodywe i ght/day, which i s extremely unlikely even in this worst-case scenario. While a more detailed population based risk assessment is needed, which also should include other foods, we preliminarily conclude tha t formaldehyde is unl i kely to pose an additional risk for the alcohol drinking population. Acknowledgments The authors are grateful to a combined DAAD (German Academic Exchange Service) and Russian Ministry of Edu-cation grant (no. 2.2.2.3/9033) for the financial suppor t to YBM. The authors warmly thank Hannelore Heger for the excellent technical assistance. Jenny Leitz and Anja Stoppa are thanked for contributing to the method validation.The sampling of some of the unrecorded alcohols studied in this paper was financed by the European Commis-sion Seventh Framework Programme Project AMPHORA (Alcohol Measures for Public Health Research Alliance),Project no. 223059, granted to the Hospital Clinic de Barcelona (http://www.amphoraproject.net/). Juirgen Rehm (CAMH, Toronto) i s thanked for providing further samples of unrecorded alcohol. References [1] IARC,“Formaldehyde, 2-butoxyethanol and 1-tert-butox-ypropan-2-ol ,”IARC Monographs on the Evaluation of Car cinogenic Risks to Humans , vol . 88, pp. 39-325,2006. [2] R. Baan, Y. Grosse, K. Straif et a l ., “A review of human car-cinogens—part F: chemica l agents and related occupations,The Lancet Oncology, vol. 10, no. 12, pp. 1143-1144, 2009. [3] US-EPA,“Formalde h yde (CASRN 50-00-0). Integrated Risk Information System, Document 0419, U .S. Environmental Protection Ageny, Washington, DC, USA, 1998. [4] IPCS,“Formaldehyde . Concise international chem i cal assess-ment document 40, Tech. Rep., World Health Organization Geneva, Switzerland,2002. [5] H. P. Ti l , R. A. Woutersen, and V. J. Feron,“Evaluat i on of the oral toxic i ty of acetaldehyde and formaldehyde in a 4-week drinking-wate r study in rats, Food and Chemical Toxicology:vol . 26, no. 5, pp. 447-452,1988. [6] V. J. Feron, H. P. Til , F . De Vr i jer, R. A. Woutersen, F. R. Cassee,and P. J. Van Bladeren,“Ald e hydes: occurrence, carcinogenic potential, mechanism o f action and risk assessment,Mutation Research, vol . 259, no. 3-4, pp. 363-385,1991. [7] P. E. Georghiou and C. K. J. Ho, “The chemistry of the chromotropic -acid method for the analysis of formaldehyde,Canadian Journal of Chemistry, vol. 67, no. 5, pp. 871-876,1989. [8] H. B. Hopps,“Purpald(R): a reagent that turns aldehydes purple!, Aldrichimica Acta, vol. 33,no. 1, pp. 28-30,2000. [9] D. W. Lachenmeier and E. M. Sohnius,“The role of acetalde-hyde outside ethanol metabolism in the carcinogenicity of alcoholic beverages: ev i dence from a large chemical survey,Food and Chemical Toxicology, vol. 46, no. 8, pp. 2903-2911,2008. [10] D. W. Lachenmeier, F. Kanteres , and J. Rehm,“Carcinogenicity of acetaldehyde in alcoholic beverages: risk assessment outside ethanol metabolism, Addiction, vol . 104, no. 4, pp. 533-550,2009. [11] D. W. Lachenmeier, F . Kanteres, and J . Rehm,“Epidemiology-based r isk assessment using the benchmark dose/margin of exposure approach : the example of ethanol and liver cirr h osis," International Journal of Epidemiology, vol . 40, no.1, pp. 210-218, 2011. [12] European Commission,“Commission Regulation (EC) No 2870/2000 l aying down Community reference methods for the analysis of spir i ts drinks," Official Journal of the European Communities , vol . L333,pp. 20-46,2000. [13] M.N. Lau,J.D. Ebeler, and S. E. Ebeler,“Gas chromatograph i c analysis of aldehydes i n alcoholic beverages using a cysteamine derivatization procedure,” American Journal of Enology and Viticulture, vol . 50, no. 3, pp. 324-333, 1999. [14] H. Miyakawa, K. Fujinuma, and K. Kamata,“D etermination of formaldehyde in beer, Annual Report of Tokyo Metropolitan Institute of Public Health, vol . 58, pp. 185-188,2007. [15] Y. S. Park, Y. J. Lee, and K. T. Lee, “Analysis of formaldehyde and acetaldehyde in alcoho li c beverage, Journal of The Korean Societ y of Food Science and Nutrition, vol. 35, no. 10, pp. 1412-1419,2006. [16] J. Curylo and W. Wardencki,“H S-SPME-CGC-PID deter-mination of aldehydes in rect i fied spi rit s and vodkas after derivat i sation with 2,4,6-trichlorophenylhydrazine (TCPH),”Chemia Analityczna, vol. 50, no. 4, pp. 735-748, 2005. [17] P. Sowinski, W. Wardencki , and M. Partyka,“Development and evaluation of headspace gas chromatography method for the analy s is of carbony l compounds in spirit s and vodkas,”Analytica Chimica Acta, vol.539, no. 1-2, pp. 17-22,2005. [18]Q. J. Wu, H. Lin, W. Fan, J . J . Dong, and H. L. Chen,“Inves -tigation into benzene, trihalomethanes and formaldehyde in11Chinese lage r beers, Journal of the Institute of Brewing, vol.112, no. 4, pp. 291-294,2006. [19] J. Curylo and W. Wardencki, “Application of single drop extraction (SDE) gas chrom a tography method for the deter-mina t ion of carbonyl compounds in spirits and vodkas,”Analytical Letters, vol . 39, no. 13, pp. 2629-2642, 2006. [20] W. Wardencki, P. Sowinski, and J. Curylo,“Eva l uation of headspace solid-phase microextraction for the analysis of volatile carbonyl compounds i n spir i ts and alcoholic bever-ages, Journal of Chromatography A, vol . 984, no. 1, pp. 89-96,2003. [21] E. A. de Oliveira and J . B. de Andrade,“Simultaneous determination of formaldehyde and acetaldehyde and their respective hydroxyalkylsulfonic acids by HPLC,” Quimica Nova, vol . 17, no. 1, pp. 13-16, 1994. [22] J . B. de Andrade, J. N . Reis, M. V. Reboucas, H. L . C. Pinheiro et al.,“Determination of formaldehyde and acetaldehyde in drinking water and alcoholic beverages by high performance liquid chromatography (HPLC),” Quimica Analitica, vol. 15,no. 2,pp. 144-147,1996. [23] L. C. de Azevedo, M. M. Reis , G. E. Pereira, G. O. Da Rocha,L. A. Si l va, and J . B. De Andrade, “A l iquid chromatographic method optimization for the assessment of low and high molar mass carbonyl compounds in wines, Journal of Sepa-ration Science, vol. 32, no. 20, pp. 3432-3440, 2009. [24] J. C. Pires Penteado, A. C. Sobral, and J. C. Mas i ni,“Evaluation of monol i thic columns for determ i nation of formaldehyde and acetaldehyde in sugar cane spirits by high-performance liquid chromatography, Analytical Letters, vol. 41, no. 9, pp.1674-1681,2008. [25] G. Burini a n d R. Coli,“Determinatio n of formaldehyde in spirits by h igh -performance liquid chromatography with diode-array detection a f ter der i va t iza t ion,Analytica Chimica Acta, vol . 511, no. 1, pp. 155-158,2004. [26] J. F. Lawrence and J. R. Iyenga r , “The determination of formaldehyde in beer and soft drinks by HPLC of the 2,4-dinitrophenylhydrazone der i va t ive, International J ournal of Environmental Analytical Chemistry, vol . 15, no. 1, pp. 47-52,1983. [27] R. J. Elias, V. F . Laurie, S. E. Ebeler, J. W. Wong, and A. L Waterhouse, “Analysis of se l ected carbonyl oxidation produc t s in wine by l i quid chromatography with diode array detection,Analytica Chimica Acta, vol . 626, no. 1, pp. 104-110, 2008. [28]I D. M. Rodriguez, K. Wrobel, and K. Wrobel,“Determination of aldehydes in tequila by high-performance liquid ch r o matography with 2,4-dinitropheny l hydrazine derivatization,European Food Research and Technology, vol . 221, no. 6, pp 798-802,2005. [29] O. M. Sampaio, R. V. Reche, and D. W. Franco, “Chemical profile of rums as a function of their origin. The use of chemometric techniques for their i denti f ication,” Journal of Agricultural and Food Chemistry, vol. 56, no . 5,pp. 1661-1668,2008. [30] R. F. Nascimento, J. C. Marques, B. S. Lima Neto, D. De Keukeleire, and D. W. Franco,“Qualitative and quantitative high -performance l iquid chromatographic analysis of aldehy-des i n Brazi l ian sugar cane spirits and other disti l led alcoholic beverages," Journal of Chromatography A, vol . 782, no. 1, pp.13-23,1997. [31] X. Q. Zhao and Z . Q. Zhang,,“Microwave -assisted on line derivat i zation for sensitive f l ow injection f luorometric determination of formaldehyde in some foods, Talanta, vol.80, no. 1, pp. 242-245,2009. [32] X. Q. Zhao and Z. Q. Zhang,“Rapid and sensitive determi -nation of formaldehyde in some beverages and foods by flow-injec t ion f luor i metric analysi s , International Journal of Food Sc i ence and Technology, vol. 44, no. 1, pp. 216-221,2009. [33] F. S. de Oliveira,E. T. Sousa, and J. B. de Andrade, “A sensi ti ve flow analysis system for the fluorimetric determination of low levels of forma l dehyde in alcoholic beverages, Talanta, vol . 73,no. 3, pp. 561-566,2007. [34] AOAC, AOAC Offic i al Methods of Analysis, AOAC, Arlington Va, USA, 1995. [35] E . Eegriwe, “Reaktionen und Reagenzien zum Nachweis organischer Verbindungen IV. Formaldehyd,”Fresenius ’ Jour-nal o f Analytical Chemistry, vol . 110, no. 1, pp.22-25, 1937. [36] H. Brandl,“4-Amino-3-hydrazino-5-mercapto-4H-1,2,4-tri-azol (PurpaldR)—ein n eues sensi t i ves Reagenz auf Aldehyde,Praxis der Naturwissenschaften-Chemie, vol . 40, no. 7, pp. 25-29,1991. [37] R. G. Dickinson and N. W. Jacobsen,“A new sens i tive and specific test for the detection of aldehydes: formation of 6-mercapto -3-substituted-s-tr i azolo [4,3-b]-s -tetrazines,” Jour nal of the Chemical Society D: Chemical Communications, no.24, pp. 1719-1720,1970. [38] N. W. Jacobsen and R. G. Dickinson,“Spectrometric assay of aldehydes as 6-mercapto-3-substituted-s-triazolo(4,3-b)-s-te t razines, Analytical Chemistry, vol . 46, no. 2, pp. 298-299,1974. [39] J. Rehm, F. Kanteres , and D. W. Lachenmeier,“Unrecorded consumption, quality of a l cohol and hea l th consequences,Drug and Alcohol Review, vol. 29, no. 4, pp. 426-436, 2010. [40] D. W. Lachenmeier, R. Godelmann, M. Steiner, B. Ansay, J.Weigel, and G. Krieg, “Rapid and mobile determination of alcoholic strength in wine, beer and spirits using a flow-through infrared sensor, Chemistry Central Journal, vol. 4, no.1,p.5,2010. [41] D. W. Lachenmeier, O. Sviridov , W. Frank, and C. Athanasakis,“Rapid determination of the alcohol content in liqueur emulsions and other spirits using steam distillation and densitometry” Deutsche Lebensmit t el-Rundschau, vol. 99, no.11, pp. 439-444,2003. [42] D. W. Lachenmeier, P. A. Burri, T. Fauser, W. Frank, and S. G. Wa l ch,“Rapid determination of alcoholic strength of egg liqueur using steam distillation and oscilla t ion-type densimetry with per i staltic pumping, Analytica Chimica Acta,vol . 537, no. 1-2, pp. 377-384,2005. [43] D. W. Lachenmeier, S. G. Walch, and W. Kessler,“Using experimental design to optimise precision of steam dist i llation for de t ermining a l coholic strength i n spirits," European Food Research and Technology, vol. 223, no . 2, pp. 261-266, 2006. [44] D. W. Lachenmeier and W. Kessler,“Multivariate curve resolution of spectrophotometric data for the determination of artif i cial food colors,” Journal of Agricultural and Food Chemistry, vol . 56, no. 14, pp. 5463-5468,2008. [45] A. Kand e lbauer, W. Kessler, and R. W. Kessler,“Online UV-visible spectroscopy and mult i variate curve resolution as powerful tool for model-f ree invest i gation of laccase-catalysed oxidat i on,” Analytical and Bioanalytical Chemist r y, vol. 390,no. 5, pp. 1303-1315,2008. [46] A. de Juan and R. T auler,“Multivariate Curve Resolution (MCR) from 2000: progress in concepts and applications,”Cr i tical Reviews in Analytical Chemistry, vol. 36, no. 3-4, pp.163-176,2006. [47] Y. B. Monakhova, S. A. Astakhov, A. Kraskov, and S . P . Mush-takova,“Independent components i n spectroscopic analys is of complex mixtures," Chemometrics and Intelligent Laboratory Systems, vol. 103, pp. 108-115,2010. [48]W. Kessler and R. W. Kessler,“Multivariate curve resolution —integration of knowledge in chemometric modelsMultivariate curve resolution-integration von wissen in chemometrische modelle,” Chemie-Ingenieur-Technik, vol . 82, no. 4, pp. 441-451,2010. [49] R. Tauler, A. Smilde, and B. Kowalski, “Selec t iv i ty, local rank, 3-way data-analysis and ambiguity i n multivariate curve resolution, Journal of Chemometrics, vol. 9, no. 1, pp. 31-58,1995. [50] R. Tauler,“Multivariate curve resolution applied to second order data,” Chemometric s and I ntelligent Laboratory Systems,vol. 30, no. 1,pp. 133-146,1995. [51] W. Kessler and R. W. Kessler,“Multivariate curve resolution:a method of evaluating the kinetics of biotechnological reac t ions , Analytical and Bioanalytical Chemistry, vol.384, no.5, pp. 1087-1095,2006. [52] Y. U. B. Monakhova,S. P. Mushtakova, S . S. Kolesnikova , and S. A. Astakhov,“Chemometrics-assisted spectrophotometric method for simultaneous determination of vitamins i n com-plex mixtures, Analytical and Bioanalytical Chemistry, vol.397, no.3, pp. 1297-1306,2010. [53] H. Winning, F . H. Larsen, R. Bro, and S. B. Engelsen,“Quantitative analys i s of NMR spectra with chemometrics,Journal of Magnetic Resonance, vol. 190, no. 1,pp. 26-32,2008. [54]P. D. A. Pudney, T . M. Hancewicz, and D. G. Cunningham,“The use of confocal Raman spectroscopy to character i se t he microstructure of complex biomaterials : foods,” Spectroscopy,vol . 16, no. 3-4, pp. 217-225,2002. [55] A. Hyvarinen, E . Karhunen , and E. Oja, Independent Compo-nent Analysis, John Wiley & Sons, New York, NY, USA, 2001. [56] A. Cichocki and S. Amari, Adaptive Blind Signal and Image Processing, Learning Algorithms and Appl i cations, John Wiley & Sons, New York, NY, USA, 2002. [57] S. A. Astakhov , H. Stogbauer, A. Kraskov, and P. Grassberger “Monte Carlo algori t hm for least dependent non-negative mixture decomposition, Analytical Chemistry, vol . 78, no. 5,pp. 1620-1627,2006. [58] H. Stogbauer, A. Kraskov, S. A. Astakhov, and P. Grassberger “Least-dependent-component analysis based on mutual i nfor mat i on,”Physical Review E, vol. 70, no. 6, Article ID 066123,pp. 1-17,2004. [59] W. Windig a n d J. Guilment, “Interactive self -modeling mix ture analy s is ," Analytical Chemistry, vol . 63, no . 14, pp. 1425-1432,1991. [60] J . J . P. Stewart , Encyclopedia of Computational Chemistry, John Wiley & Sons, New York, NY, USA, 1998. [61] E . Pretsch, A. Furst, M. Badertscher , R. Burgin, and M. E Munk,“C13Shift: a computer program for the prediction of C NMR spectra based on an open set of addi t ivity rules, Journal of Chemical Information and Computer Science, vol. 32, pp.291-295,1992. [62] R. Buirgin Schaller, M. E. Munk, and E . Pretsch,“Spectra esti-mation for computer-aided structure determination,”Journal of Chemical Information and Computer Sciences, vol. 36, no. 2,pp. 239-243,1996. [63] Y.-L. Li, J . Liu, and W.-S . Guan,“Determination of trace formaldehyde in alcoholic beverages by chromotropic acic spectrophotometry ,”in Proceedings of the 3rd International Conference on Bioinformatics and Biomedical Engineering (ICBBE '09), p. 1, IEEE Xplore, Beijing, China, 2009. [64] K. Steiner and U . Lanzlinger, “Formaldehyde beer turbidity,Brauerei -Rundschau, vol . 93, no. 3,pp. 37-38, 1982. [65] Y . Liu,“Determination method for formaldehyde in beer of national standards, Chinese Journal of Public Health Engineering, vol . 8, no. 6, pp. 352-355, 2009. [66] Merck,“Spectroquant 上FormaldehydeTest 1.14678.0001Instructions for use,"Merck,Darmstadt, Germany, 2010. [67] K. Steiner, F. Schur , and H. Pfenninger,“Experiments to detect formaldehyde in bee r , Brauwissenschaft, vol. 22, no. 3, pp. 87-90,1969. [68] S. Donhauser, K. Glas, and G. Walla,“Detection of formalde-hyde in beer, Monat s schrift fir Brauwissenschaft, vol . 39, no.10, pp. 364-368,1986. [69] T. Kleiner t and E. Srepel,“Eine kolorimetr i sche Bestimmung kleiner Forma l dehydmengen mittelsChromotropsaure,Mikrochemie Vereinigt mit Mikrochimica Acta, vol. 33, no. 4,pp. 328-332,1948. [70] E. Kriger and H. J. Hollande r ,“Detection of formaldehyde i n beer,” Monatsschrift fir Brauerei , vol . 21, no. 6, pp. 155-165,1968. [71] E . L. R. Krug,“Interference of nitrate i n the determina t ion of formaldehyde by the chromotropic acid method, Analytical Chemistry, vol. 49, no. 12, pp. 1865-1867,1977. [72] D. A. MacFadyen,“Estimation of formaldehyde i n biologica mixtures,” Journal of Biological Chemistry, vol. 158, no. 1, pp 107-133,1945. [73] J. Knabe,“On the effec t of foreign substances on the pho tometric determination of formaldehyde with chromotropic acid," Archiv der Pharmazie , vol. 297,pp. 312-316,1964. [74]F F. Gasparini, P. L. We i nert, L. S. Lima, L. Pezza, and H R. Pezza, “A simple and green analytical method for the determination of formaldehyde,” Journal of the Brazilian Chemical Society , vol . 19, no. 8, pp. 1531-1537,2008. [75] I . Ahonen, E. Priha, and M. L. Aijala, “Specificity of analyt i cal methods used to determine the concentratio n of formalde-hyde in workroom air, Chemosphere , vol. 13, no. 4, pp. 521-525,1984. [76] E. Fagnani, C. B. Melios, L. Pezza, and H. R. Pezza,“Chromotropic ac i d-formaldehyde reaction in strongly acidic media. The role of dissolved oxygen and replacement of concentrated sulphuric acid,”Talanta, vol . 60, no. 1, pp. 171-176,2003. I nterna ti o n al J ourna l o f Analytical Chemistry Adv a nces i n P h y sica l Ch e m i s t r y Jo u rna l o f Q u a n t u m Che m i s t ry 二 Submit your manuscripts at http://www.hindawi.com The Scientific World Journal Jou r na l o f A n alyt i cal Method s in C h emistry NI B V B 23 I nternational J o urn a l of I n o rga ni c C h emistry Bioinorganic Chemistry and Applications Journal ofChromatography Journal of Journal of International Journal of Theoretical Chemistry Catalysts Research International Chemistry Spectroscopy
确定


还剩10页未读,是否继续阅读?

产品配置单
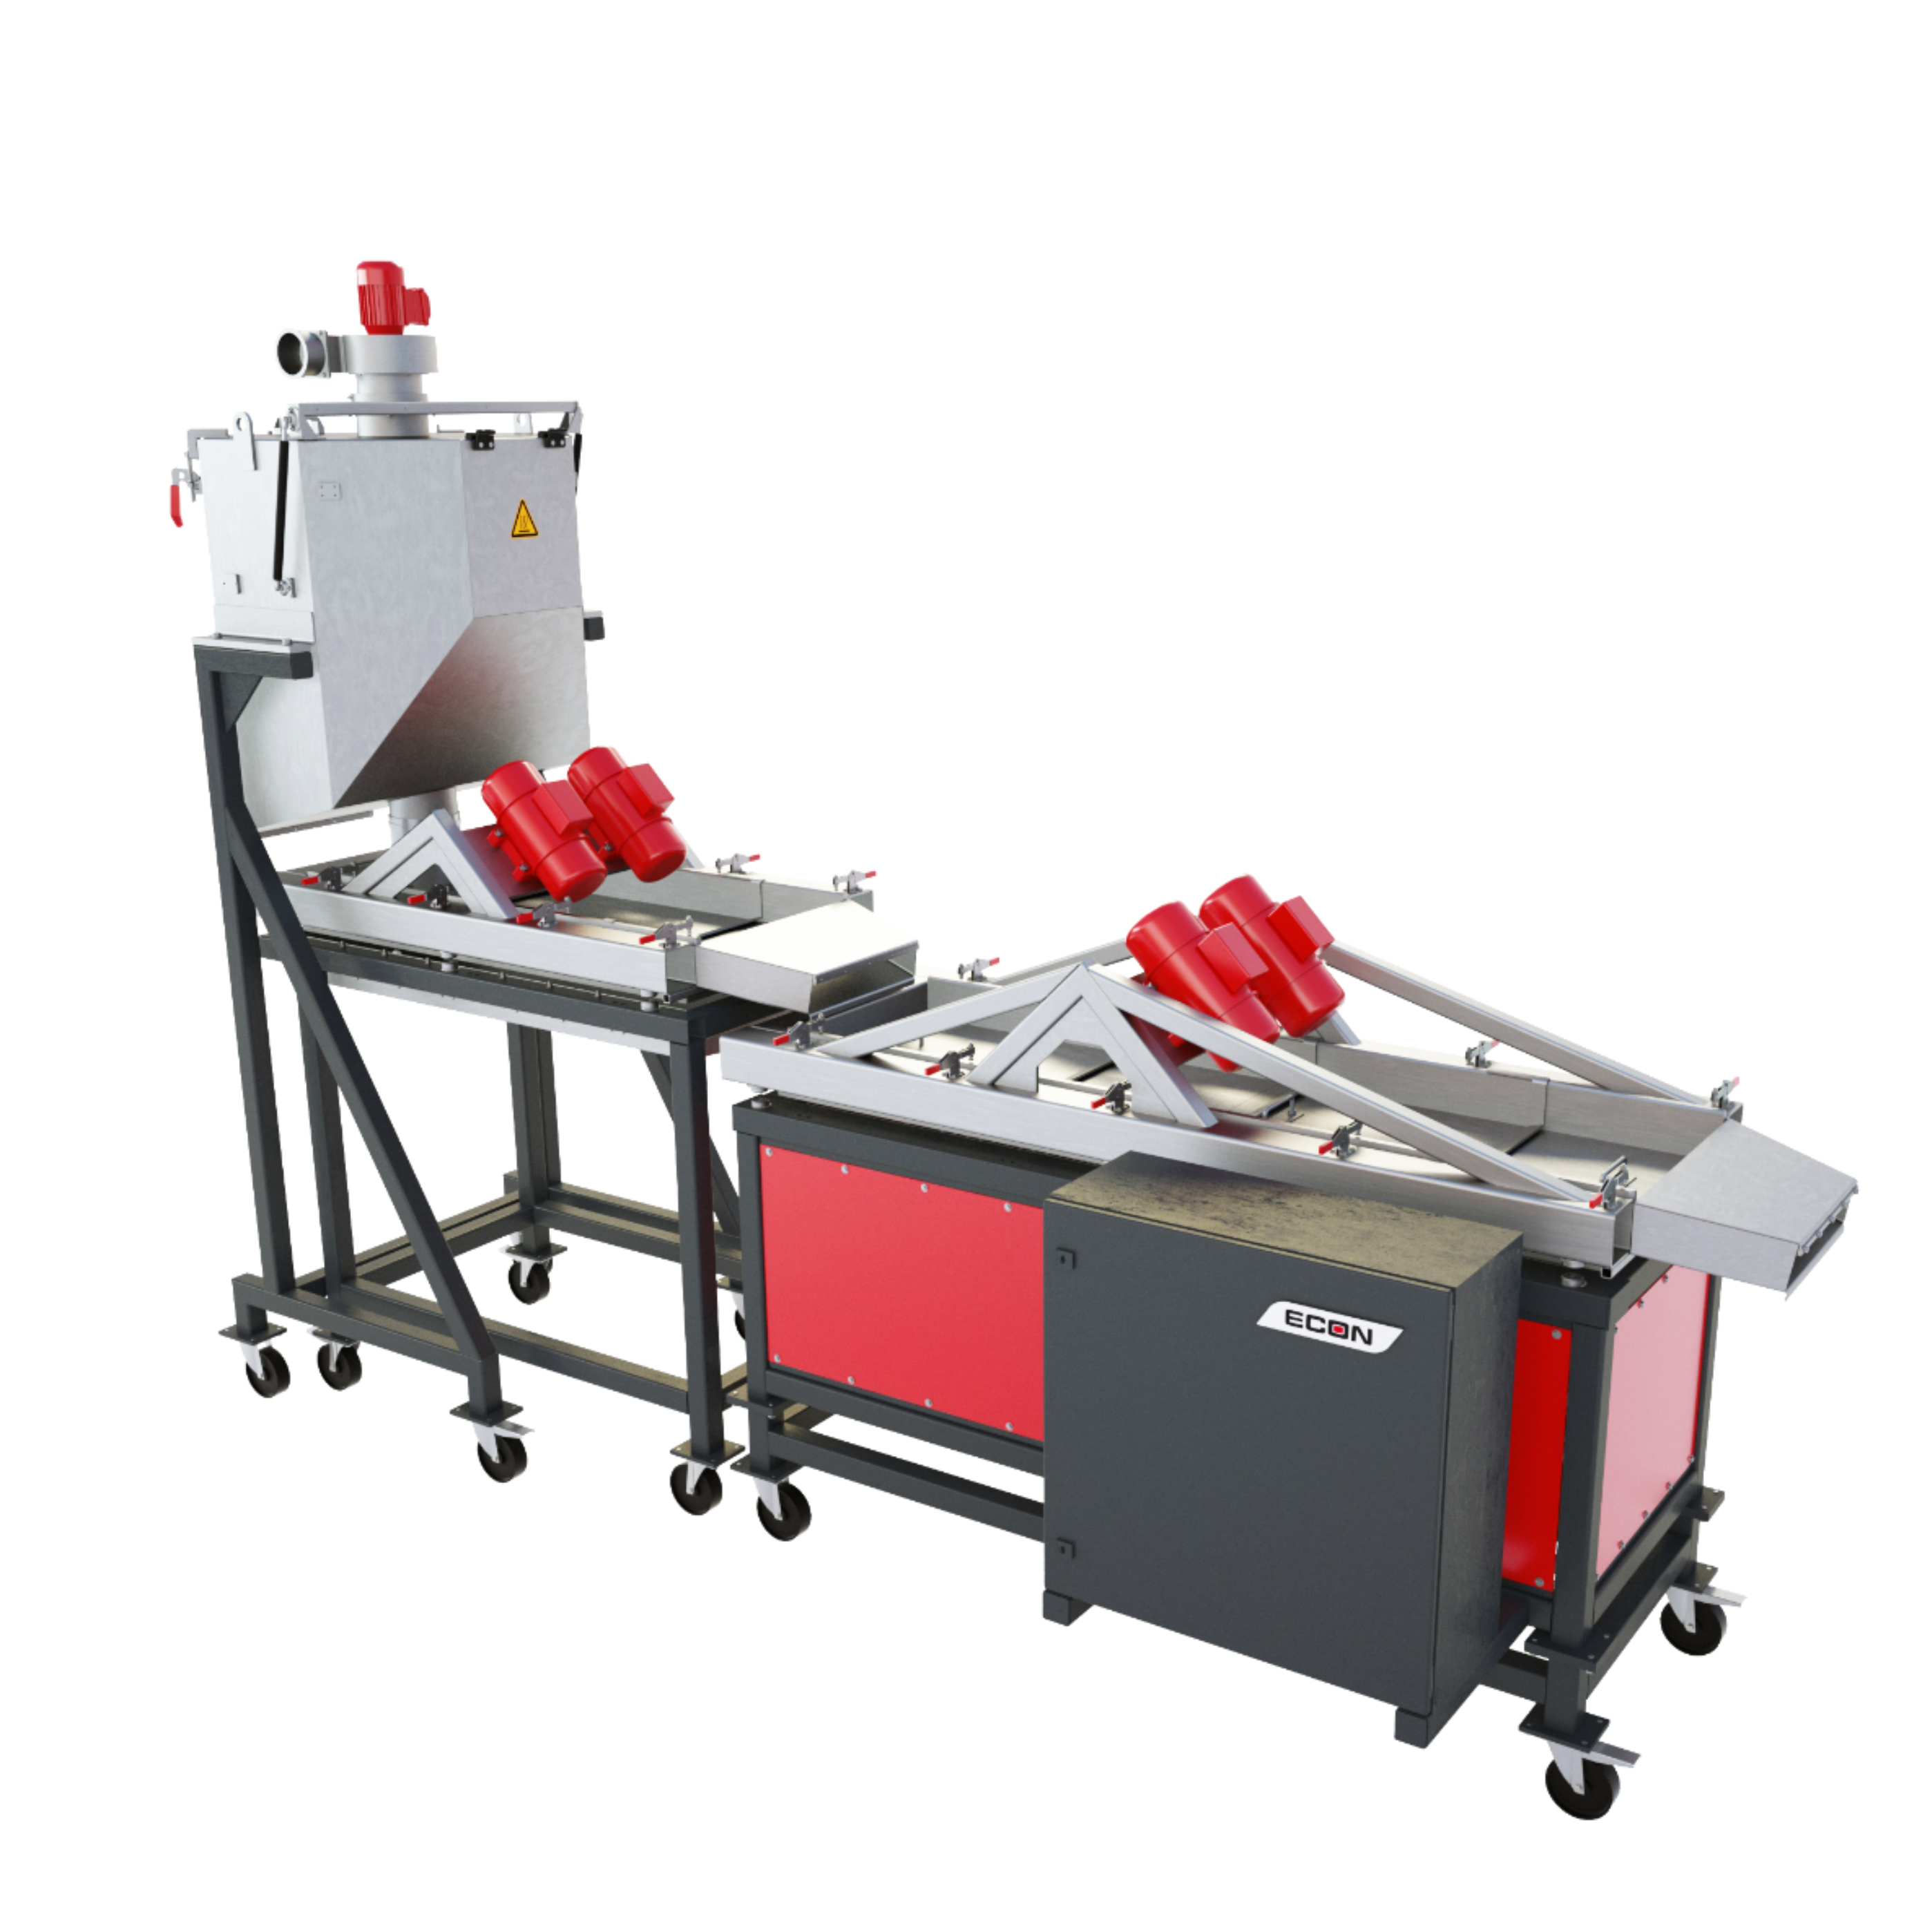
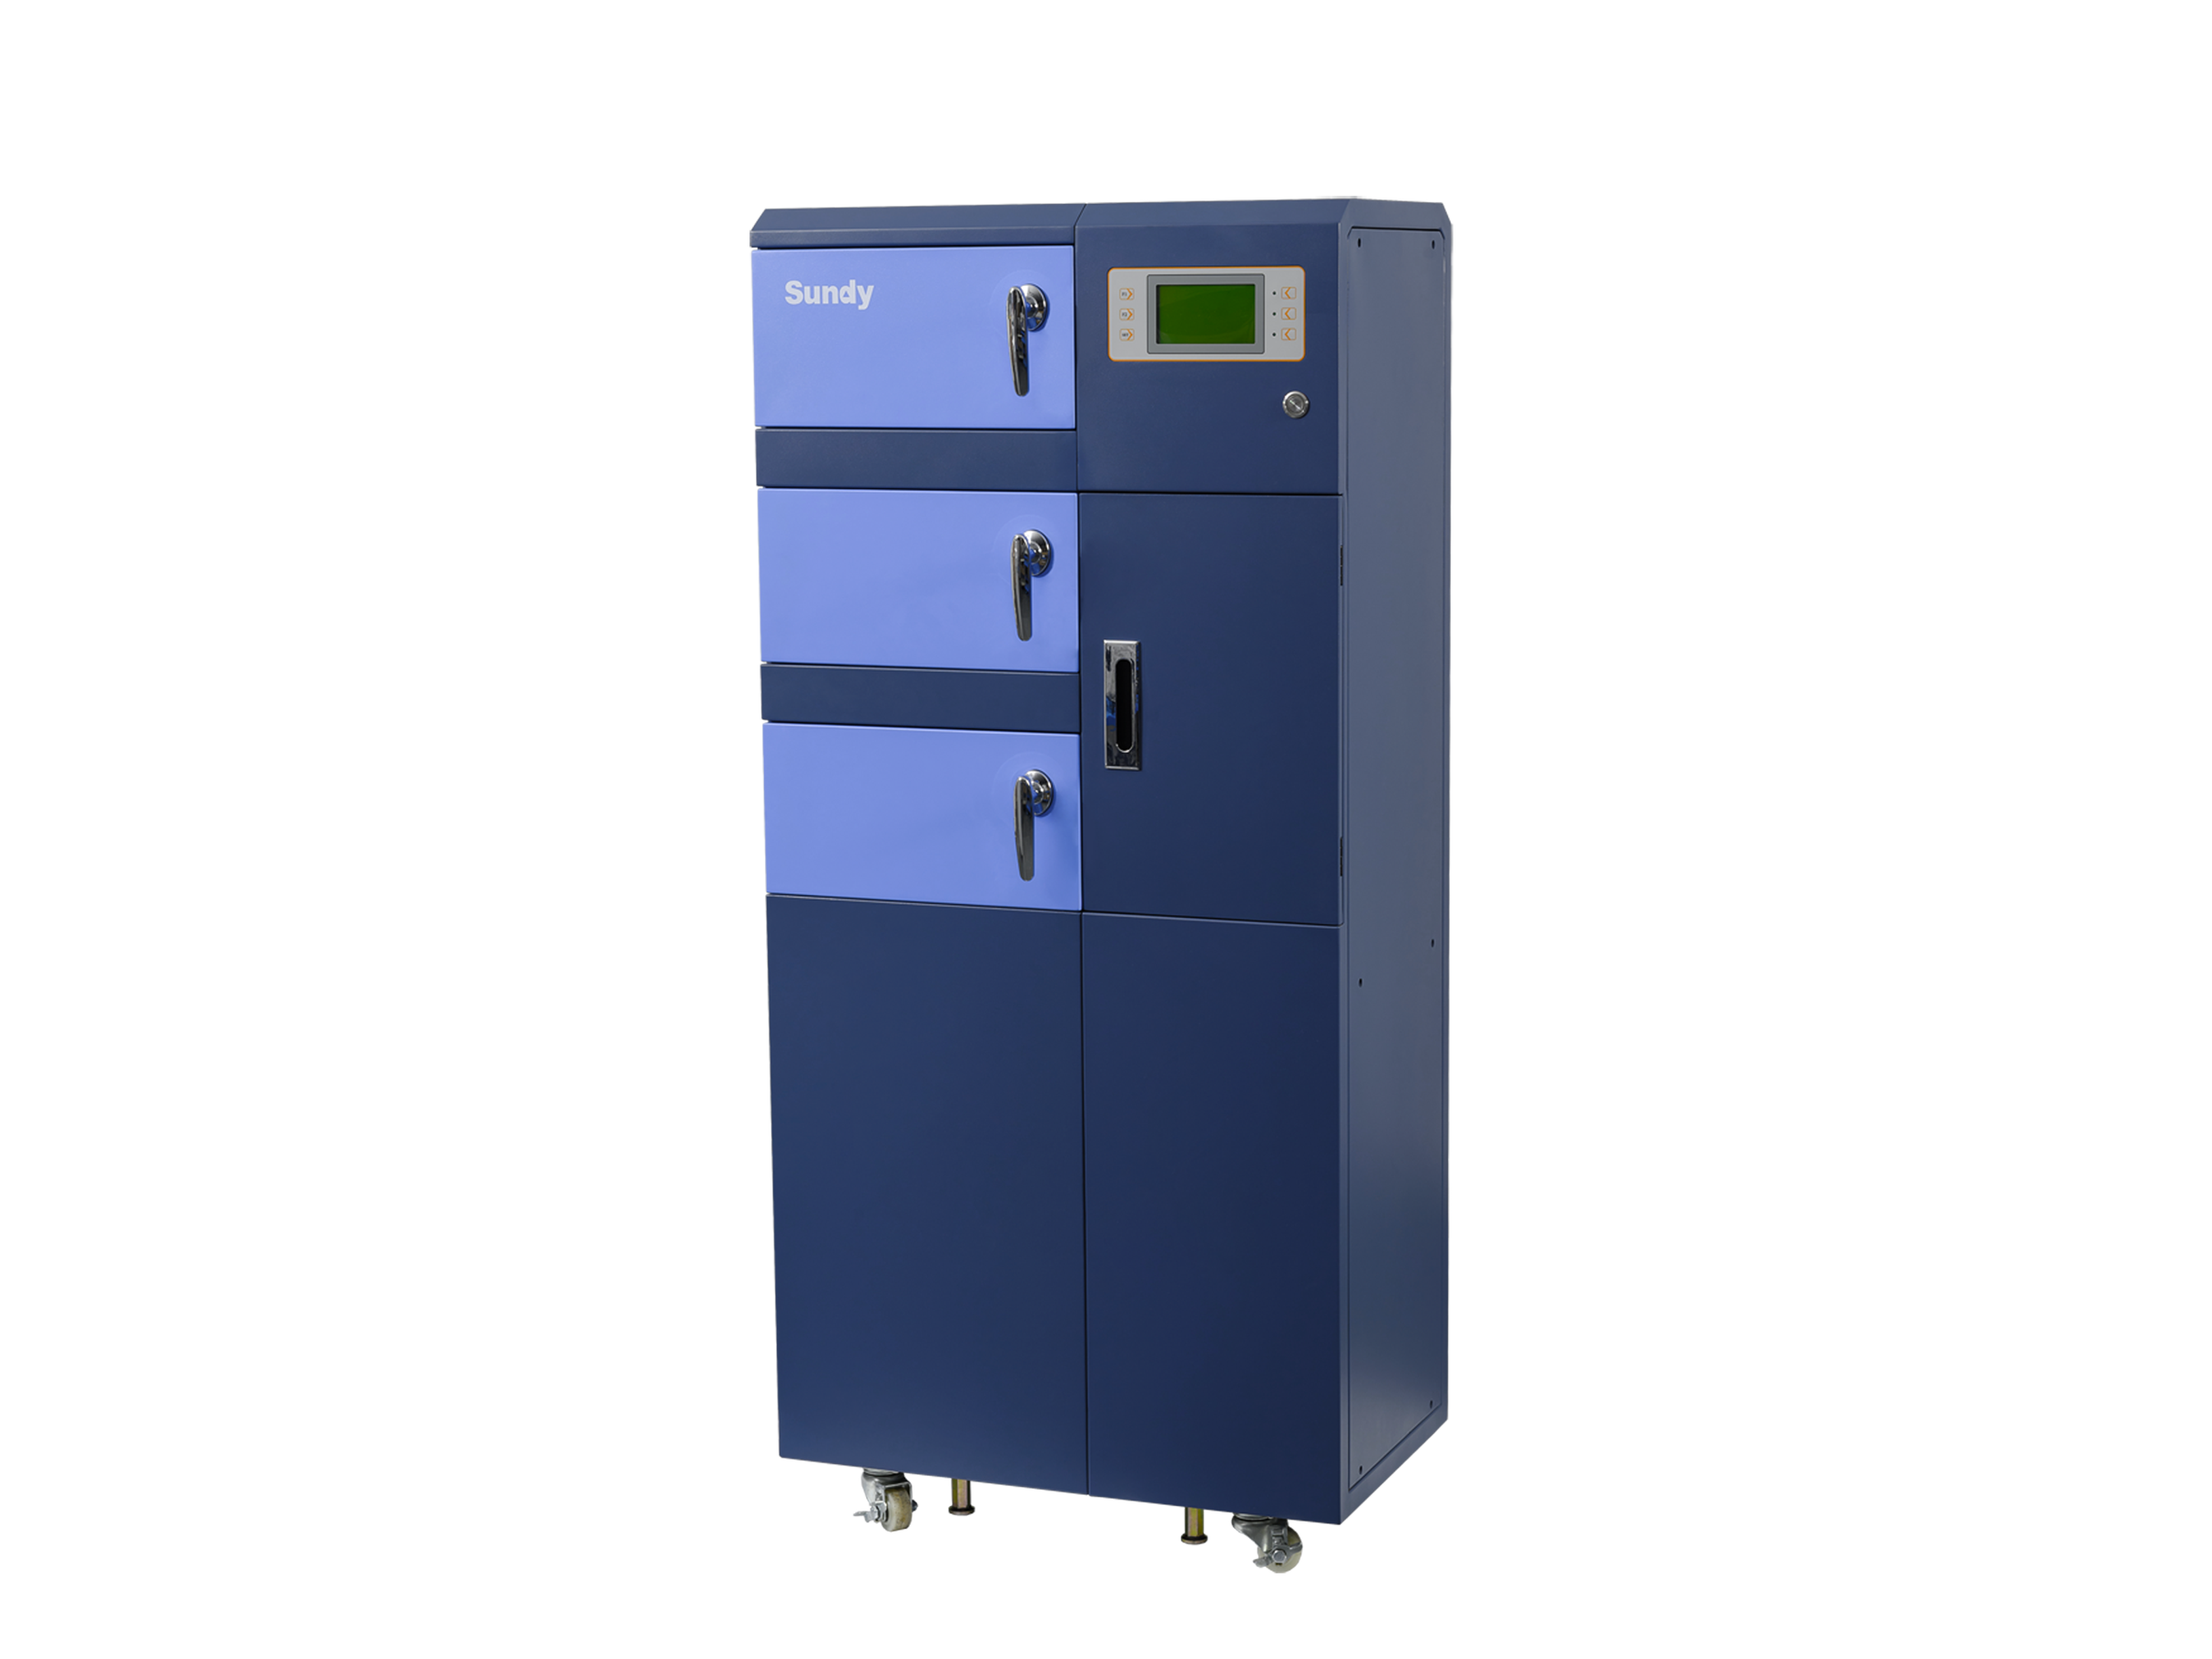
中国格哈特为您提供《508个酒样中的甲醛的检测 》,该方案主要用于啤酒中理化分析检测,参考标准--,《508个酒样中的甲醛的检测 》用到的仪器有格哈特全自动快速食品甲醛检测仪VAP550、格哈特快速干燥仪STL56
推荐专场
快速干燥仪
更多
该厂商其他方案
更多