


方案详情
文
对加入多种小米的饼干功能性,物理化学性,质地性和感官性的评价Evaluation of functional, physicochemical, textural, and sensorial properties of multi-millet-based biscuit
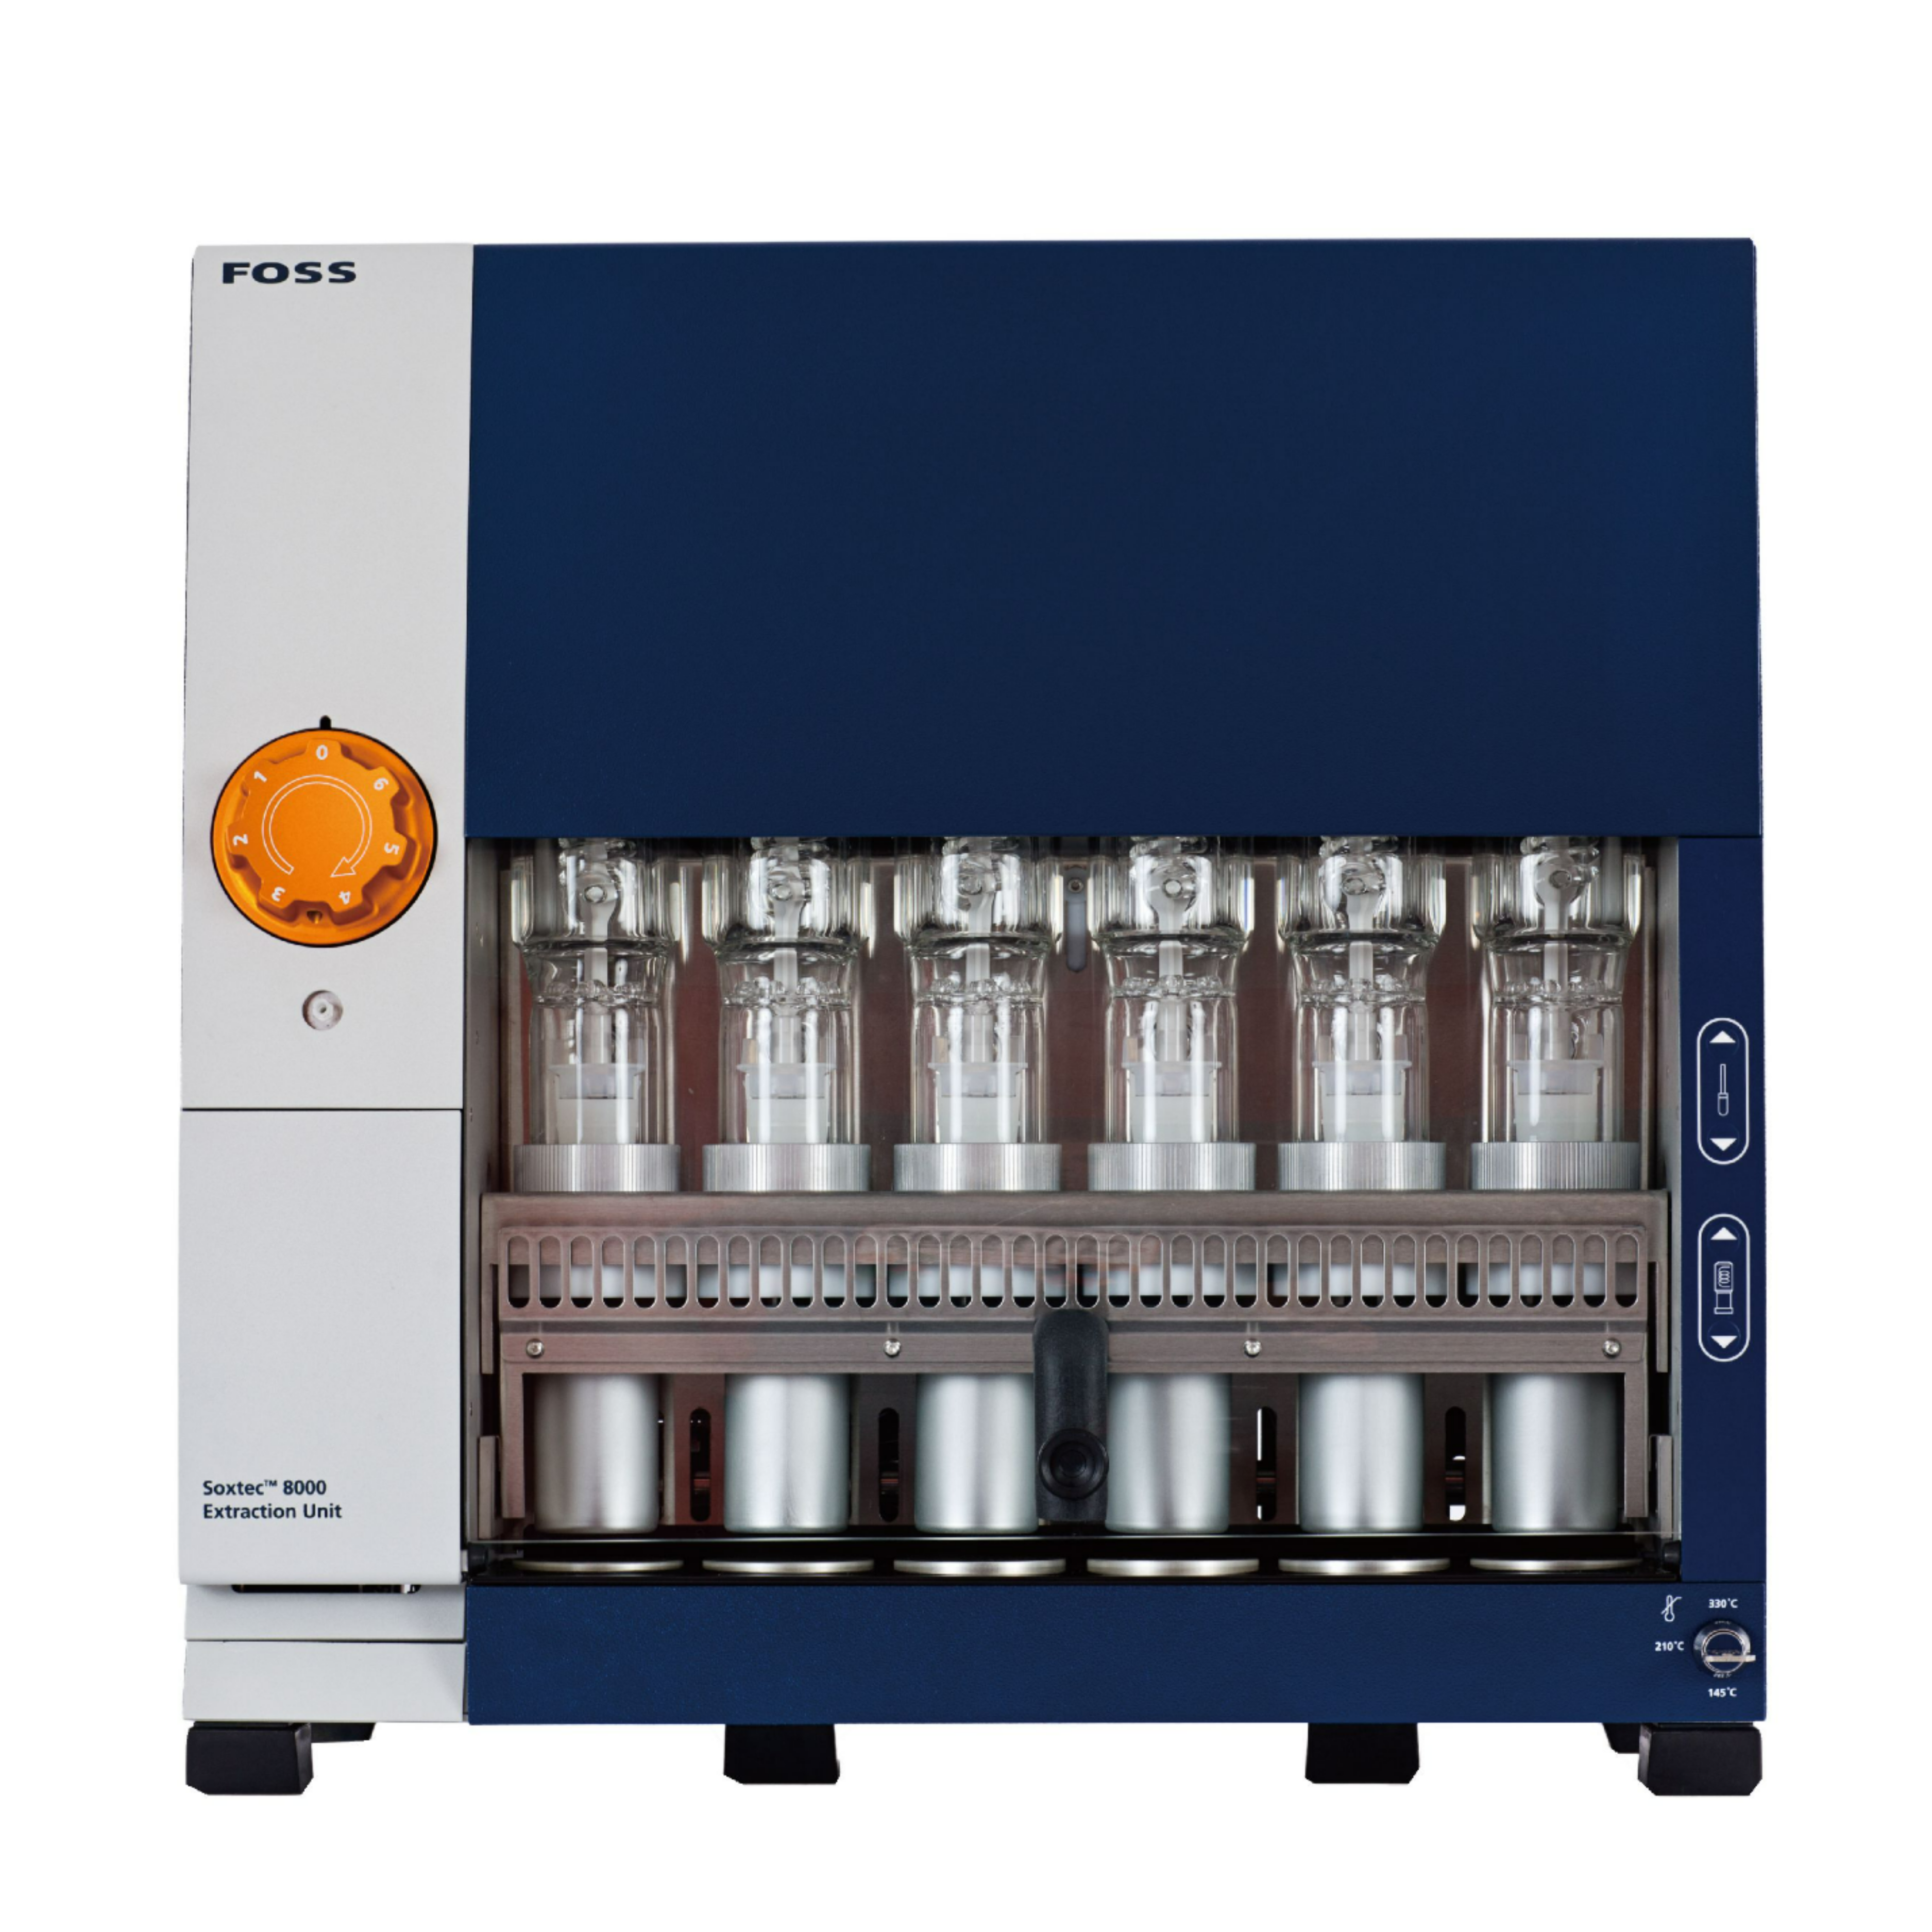
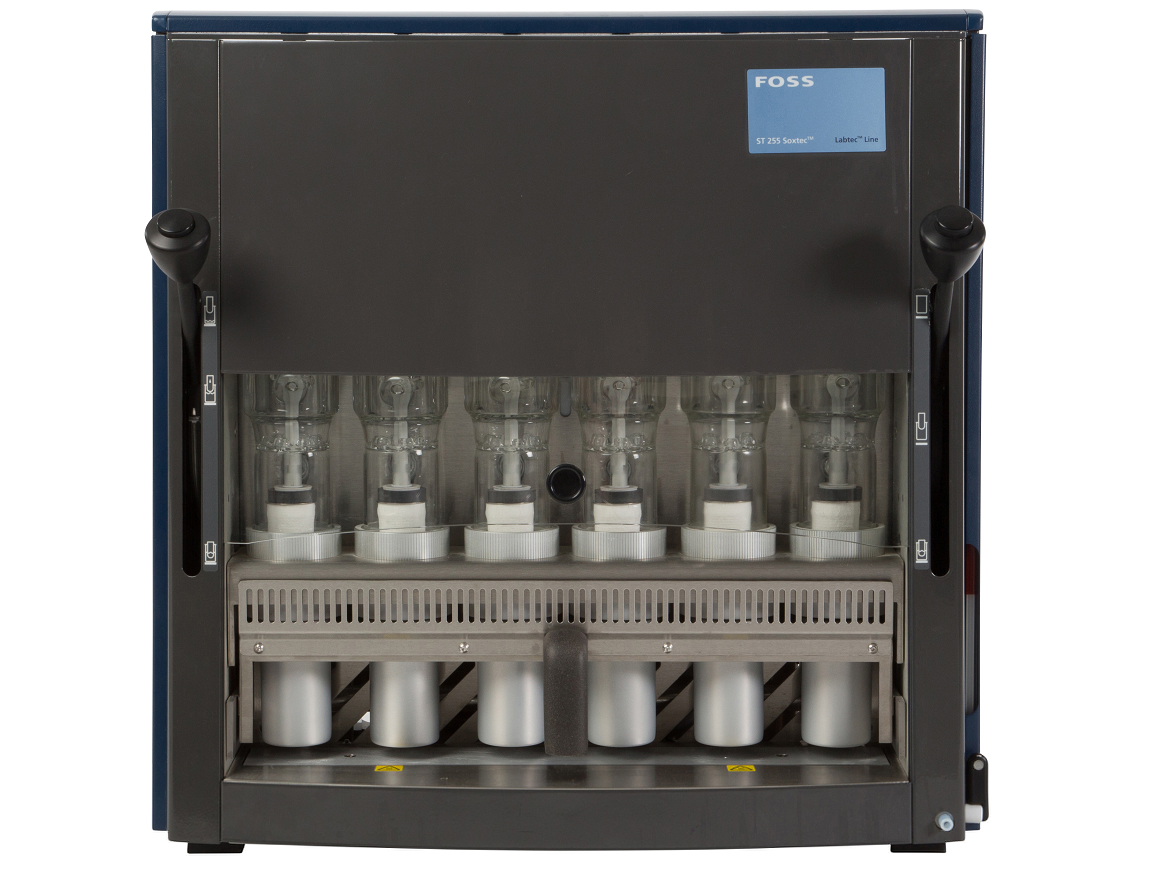
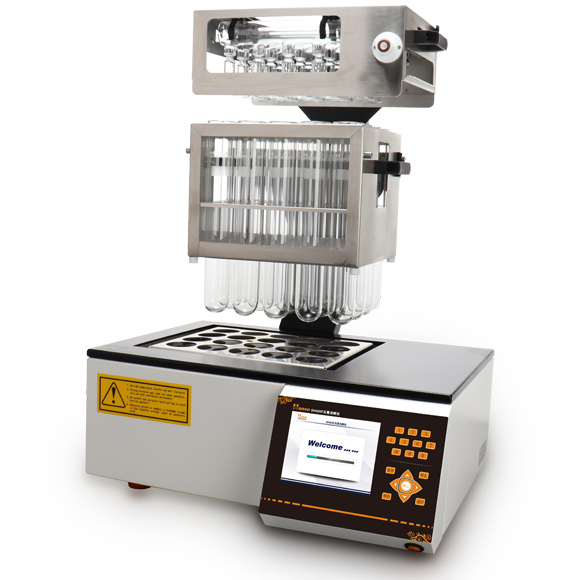
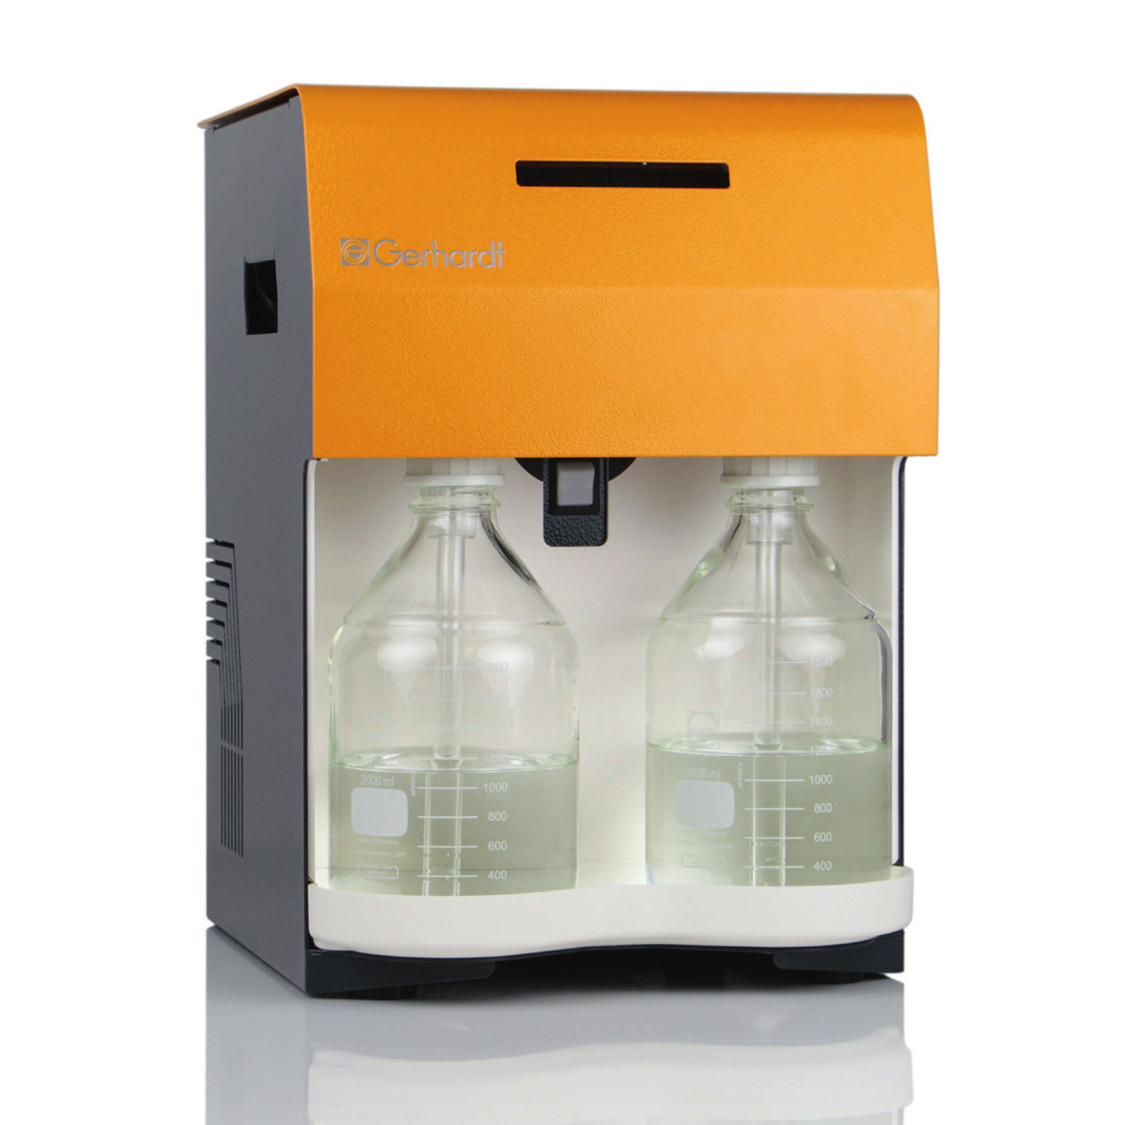
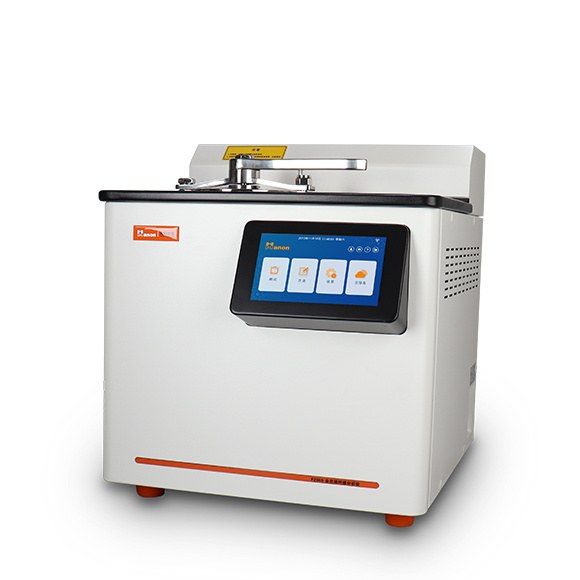
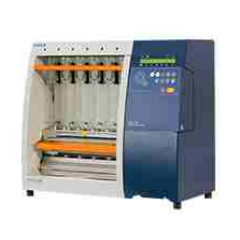
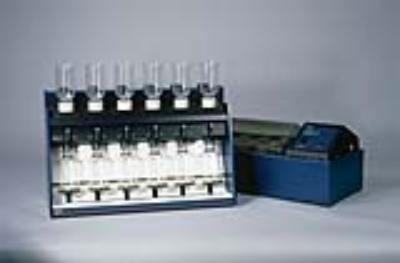
使用格哈特公司全自动凯氏定氮仪,全自动脂肪仪,全自动纤维仪检测加入多种小米的饼干的蛋白质、脂肪、纤维含量
方案详情

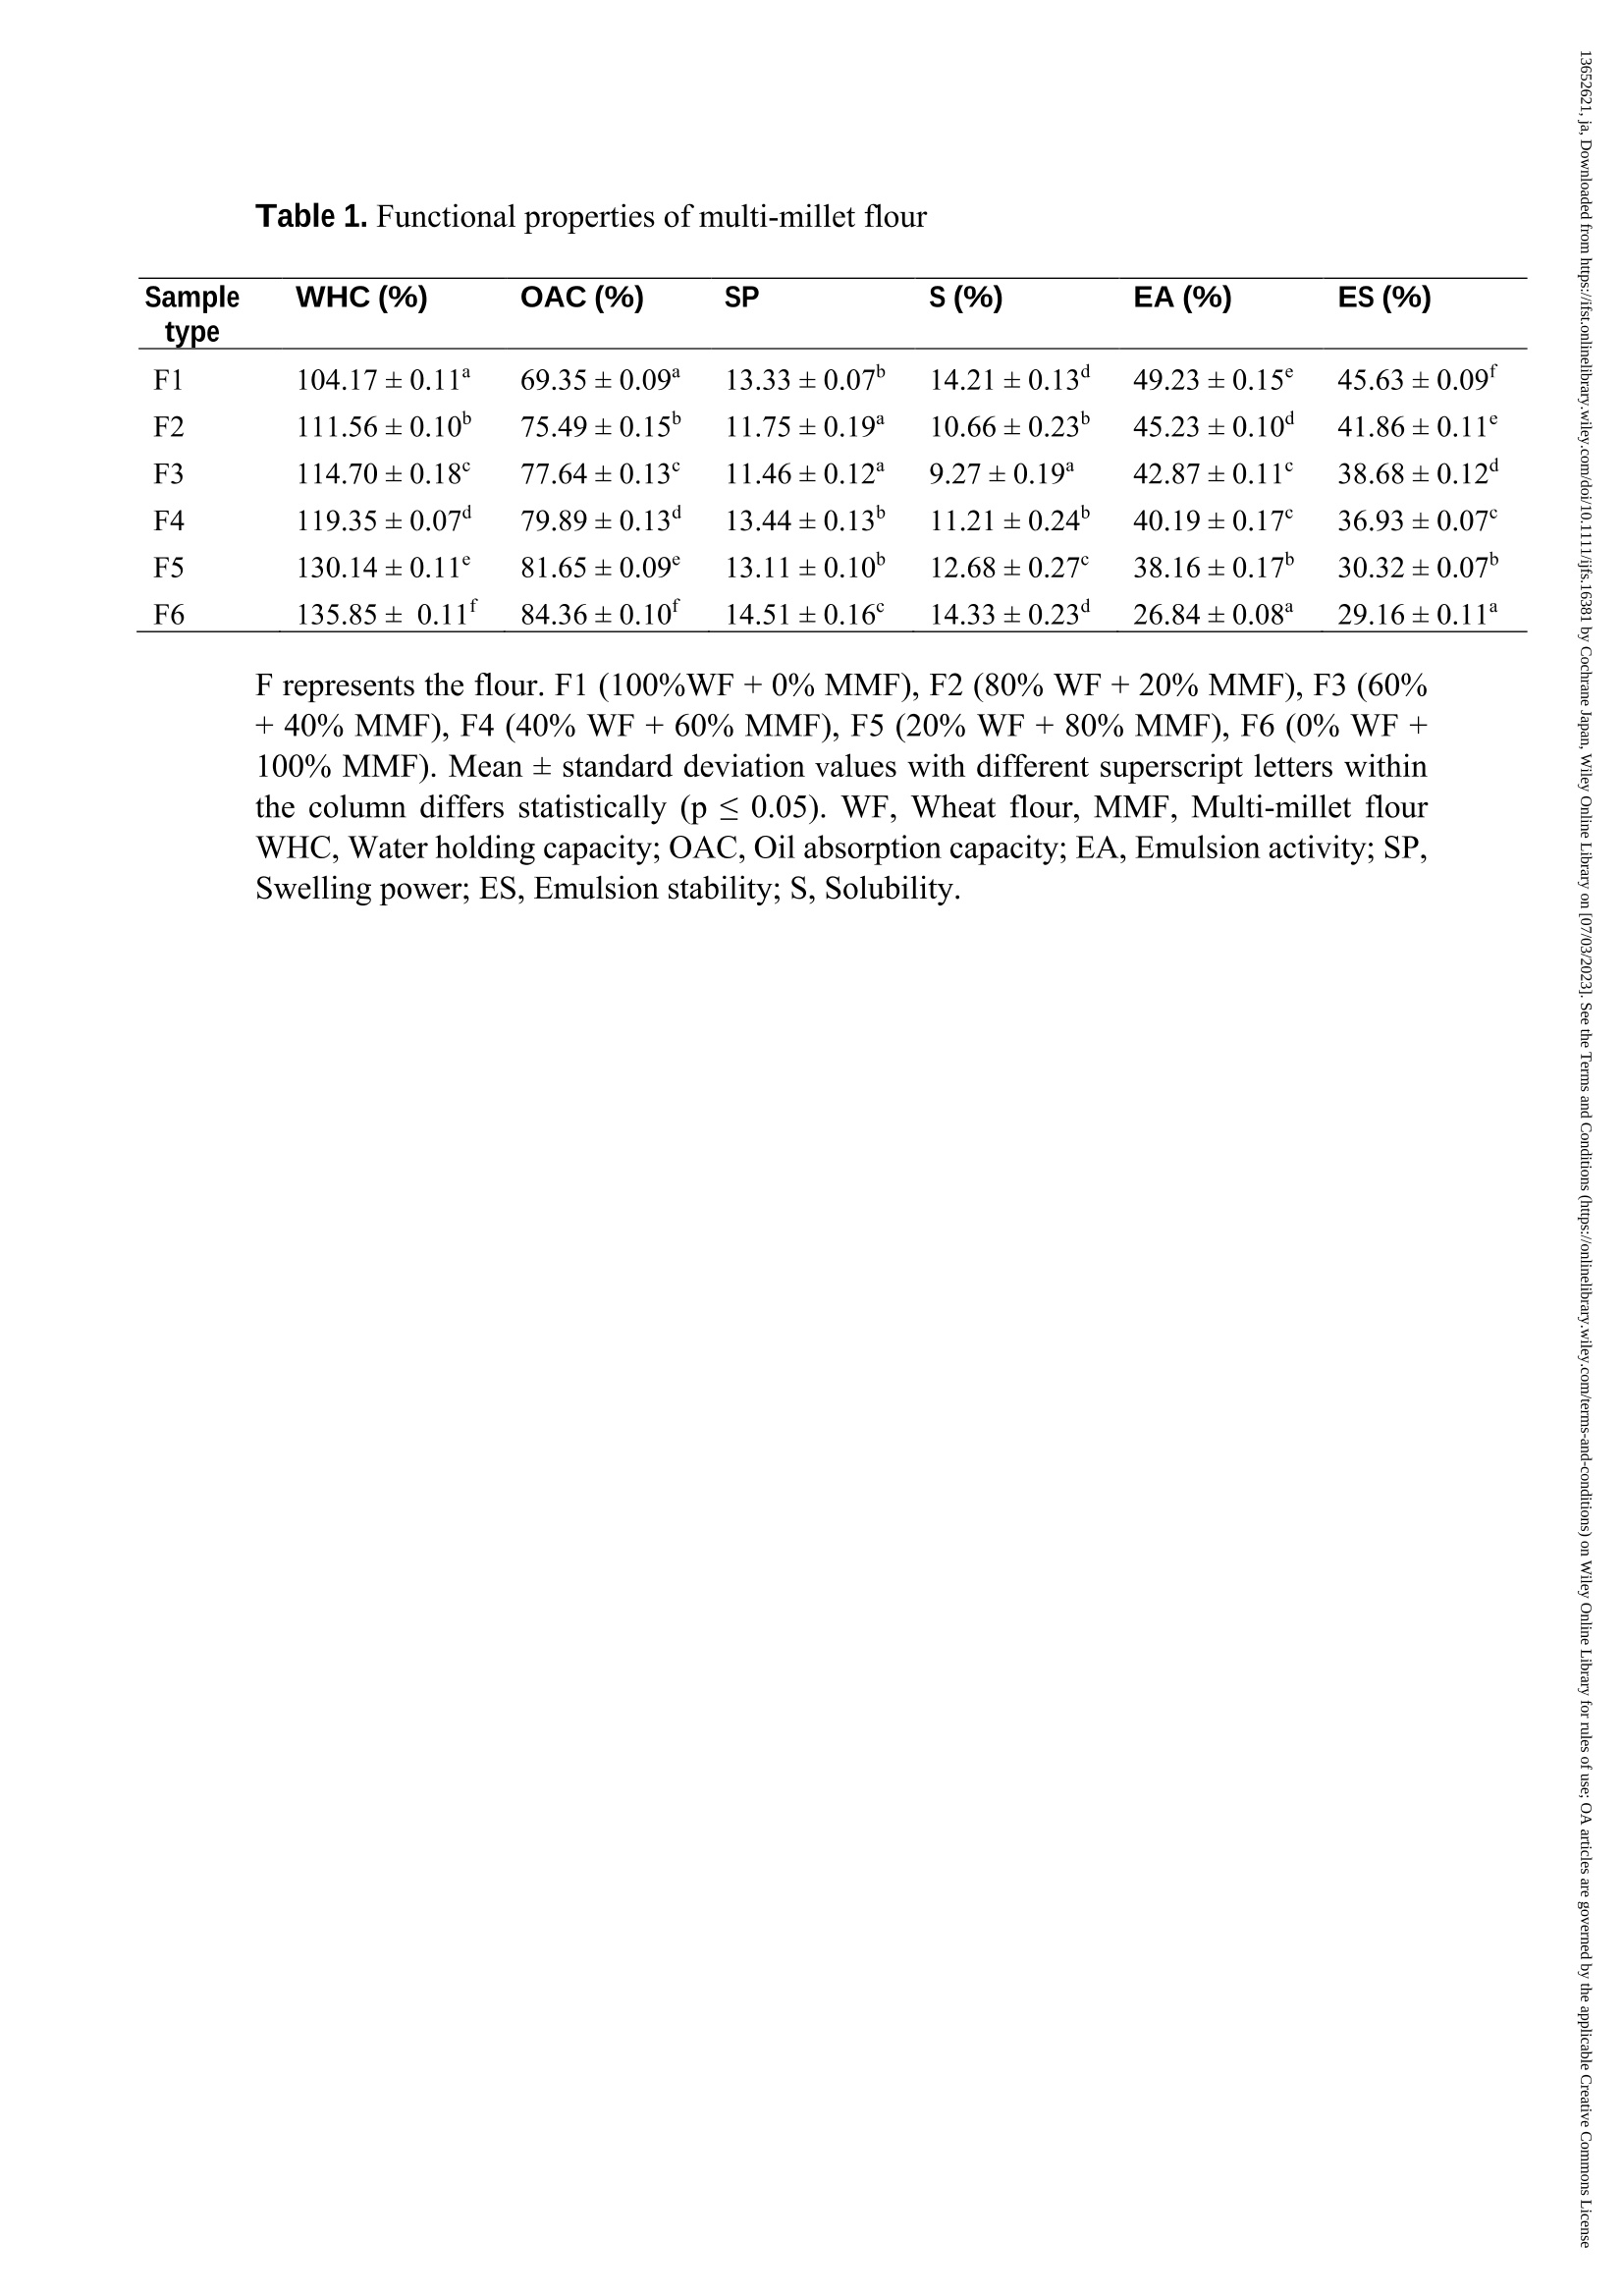
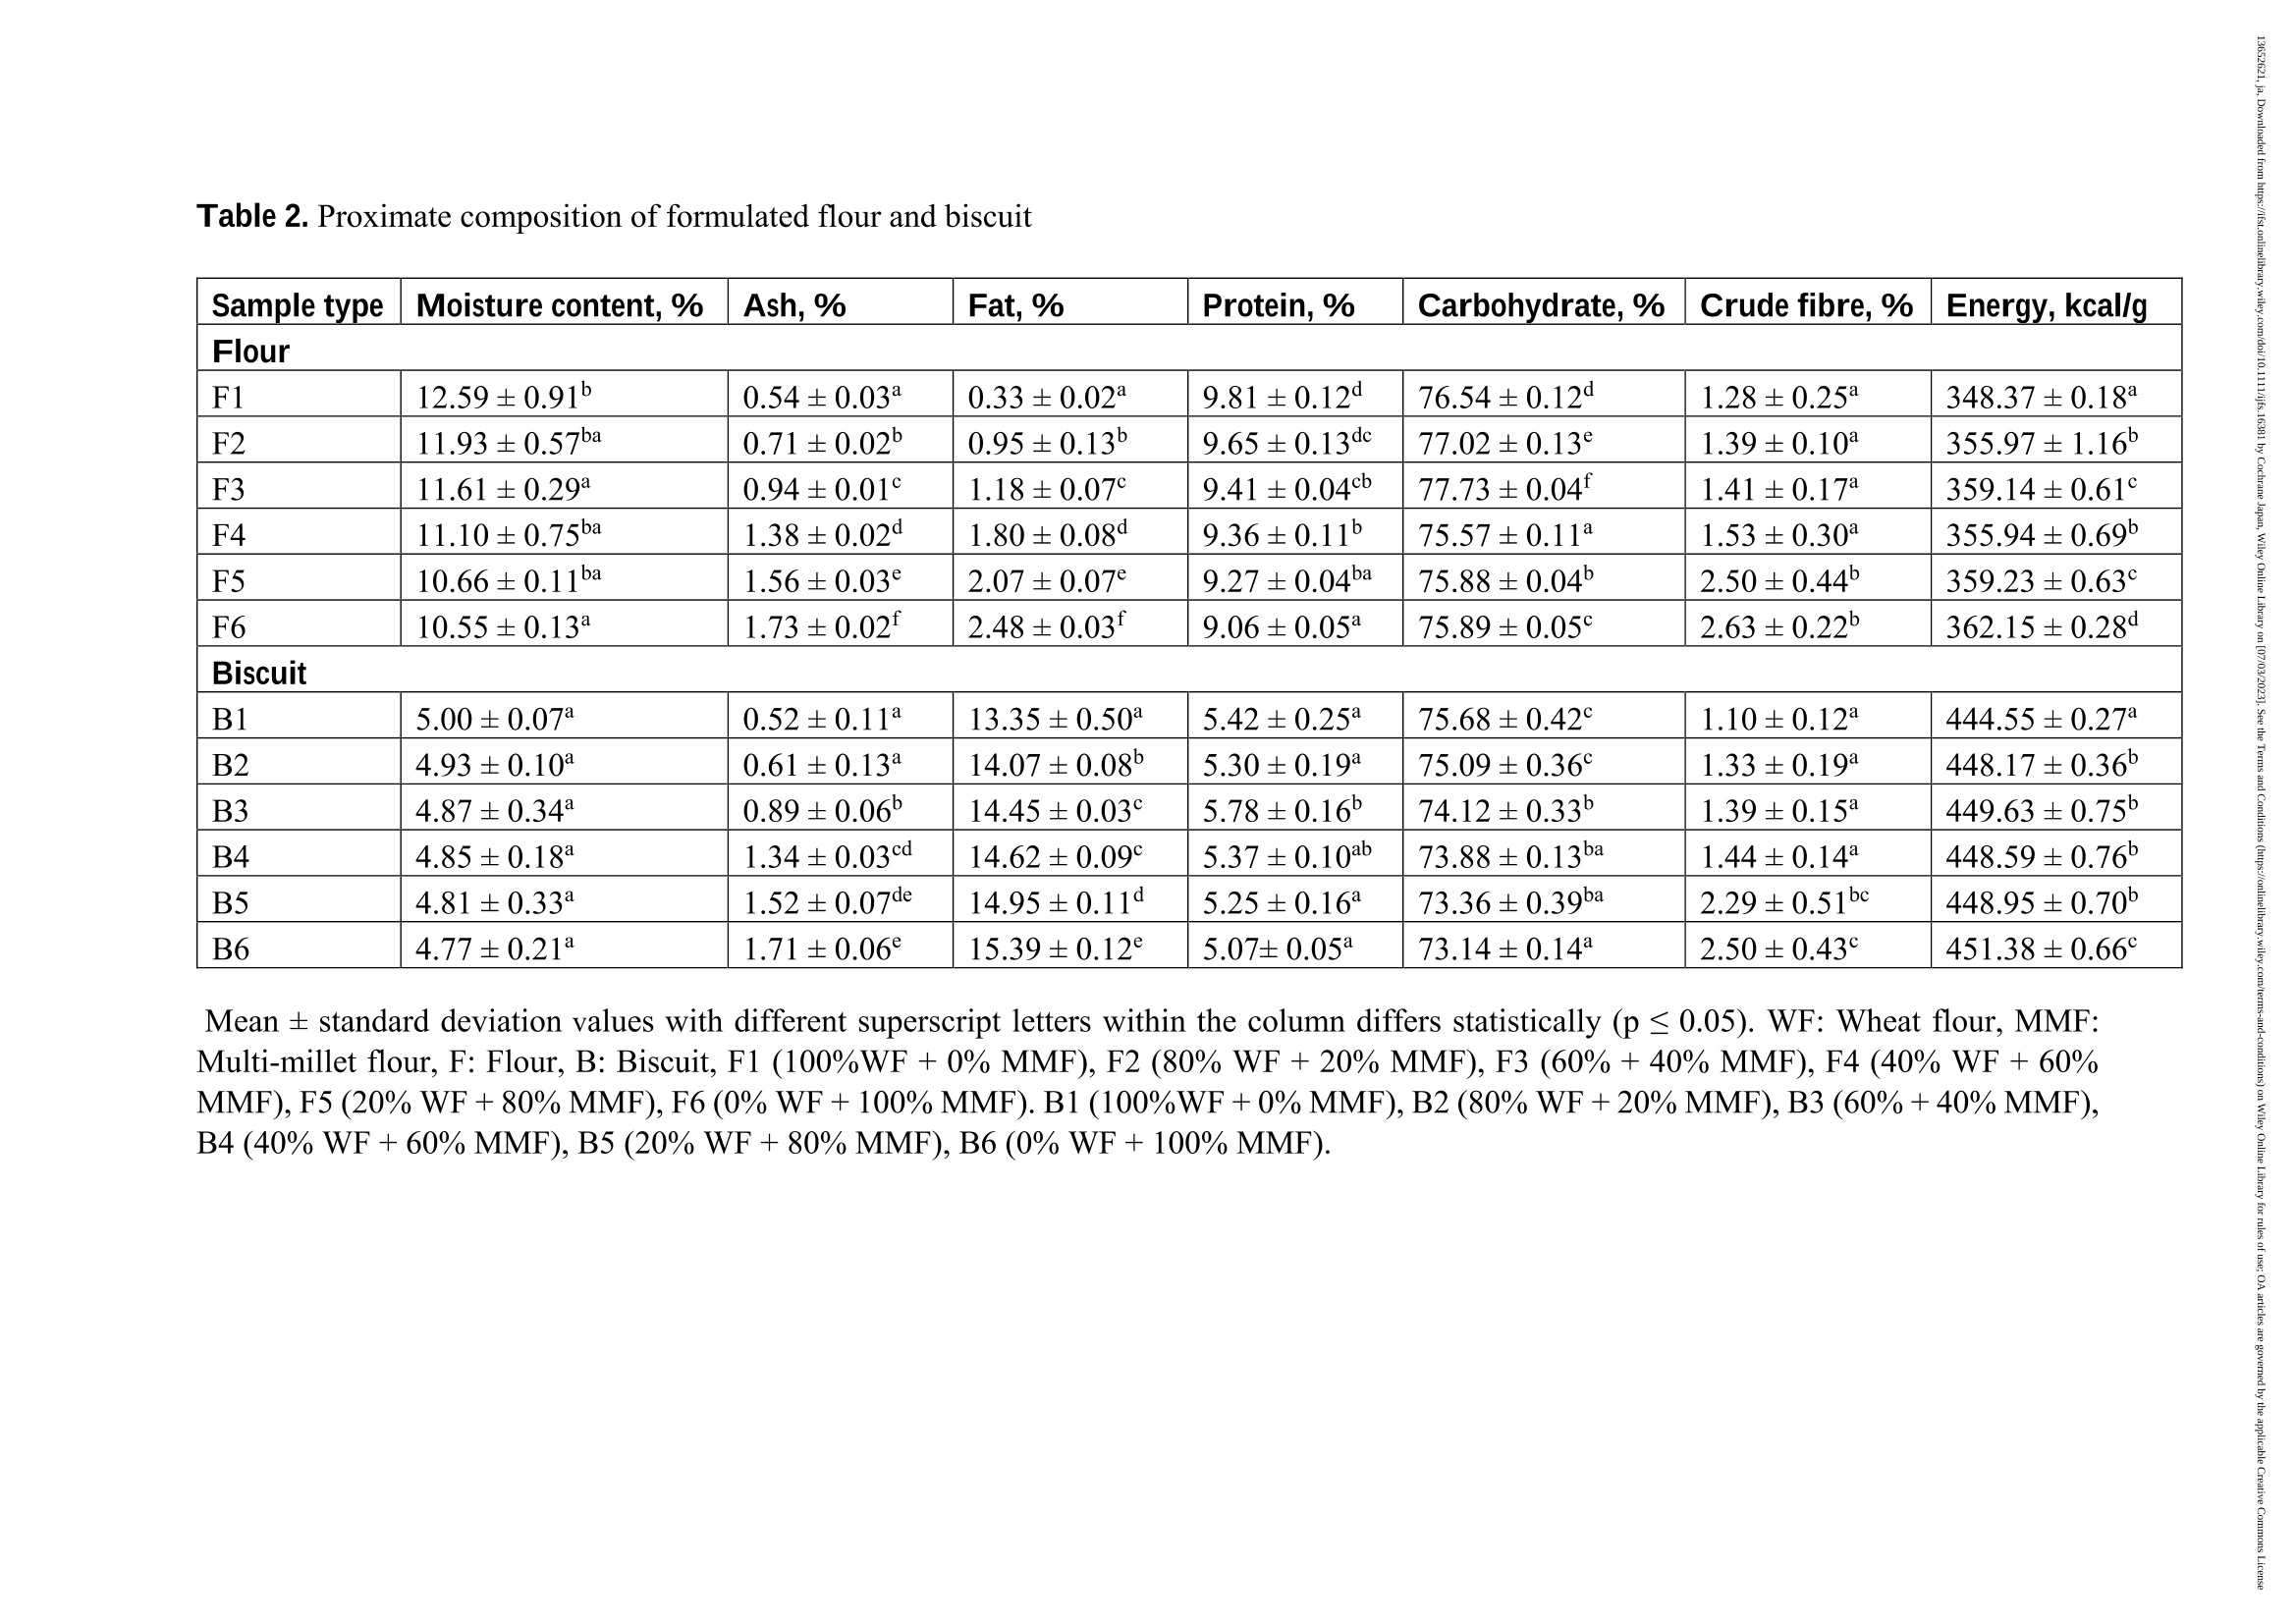
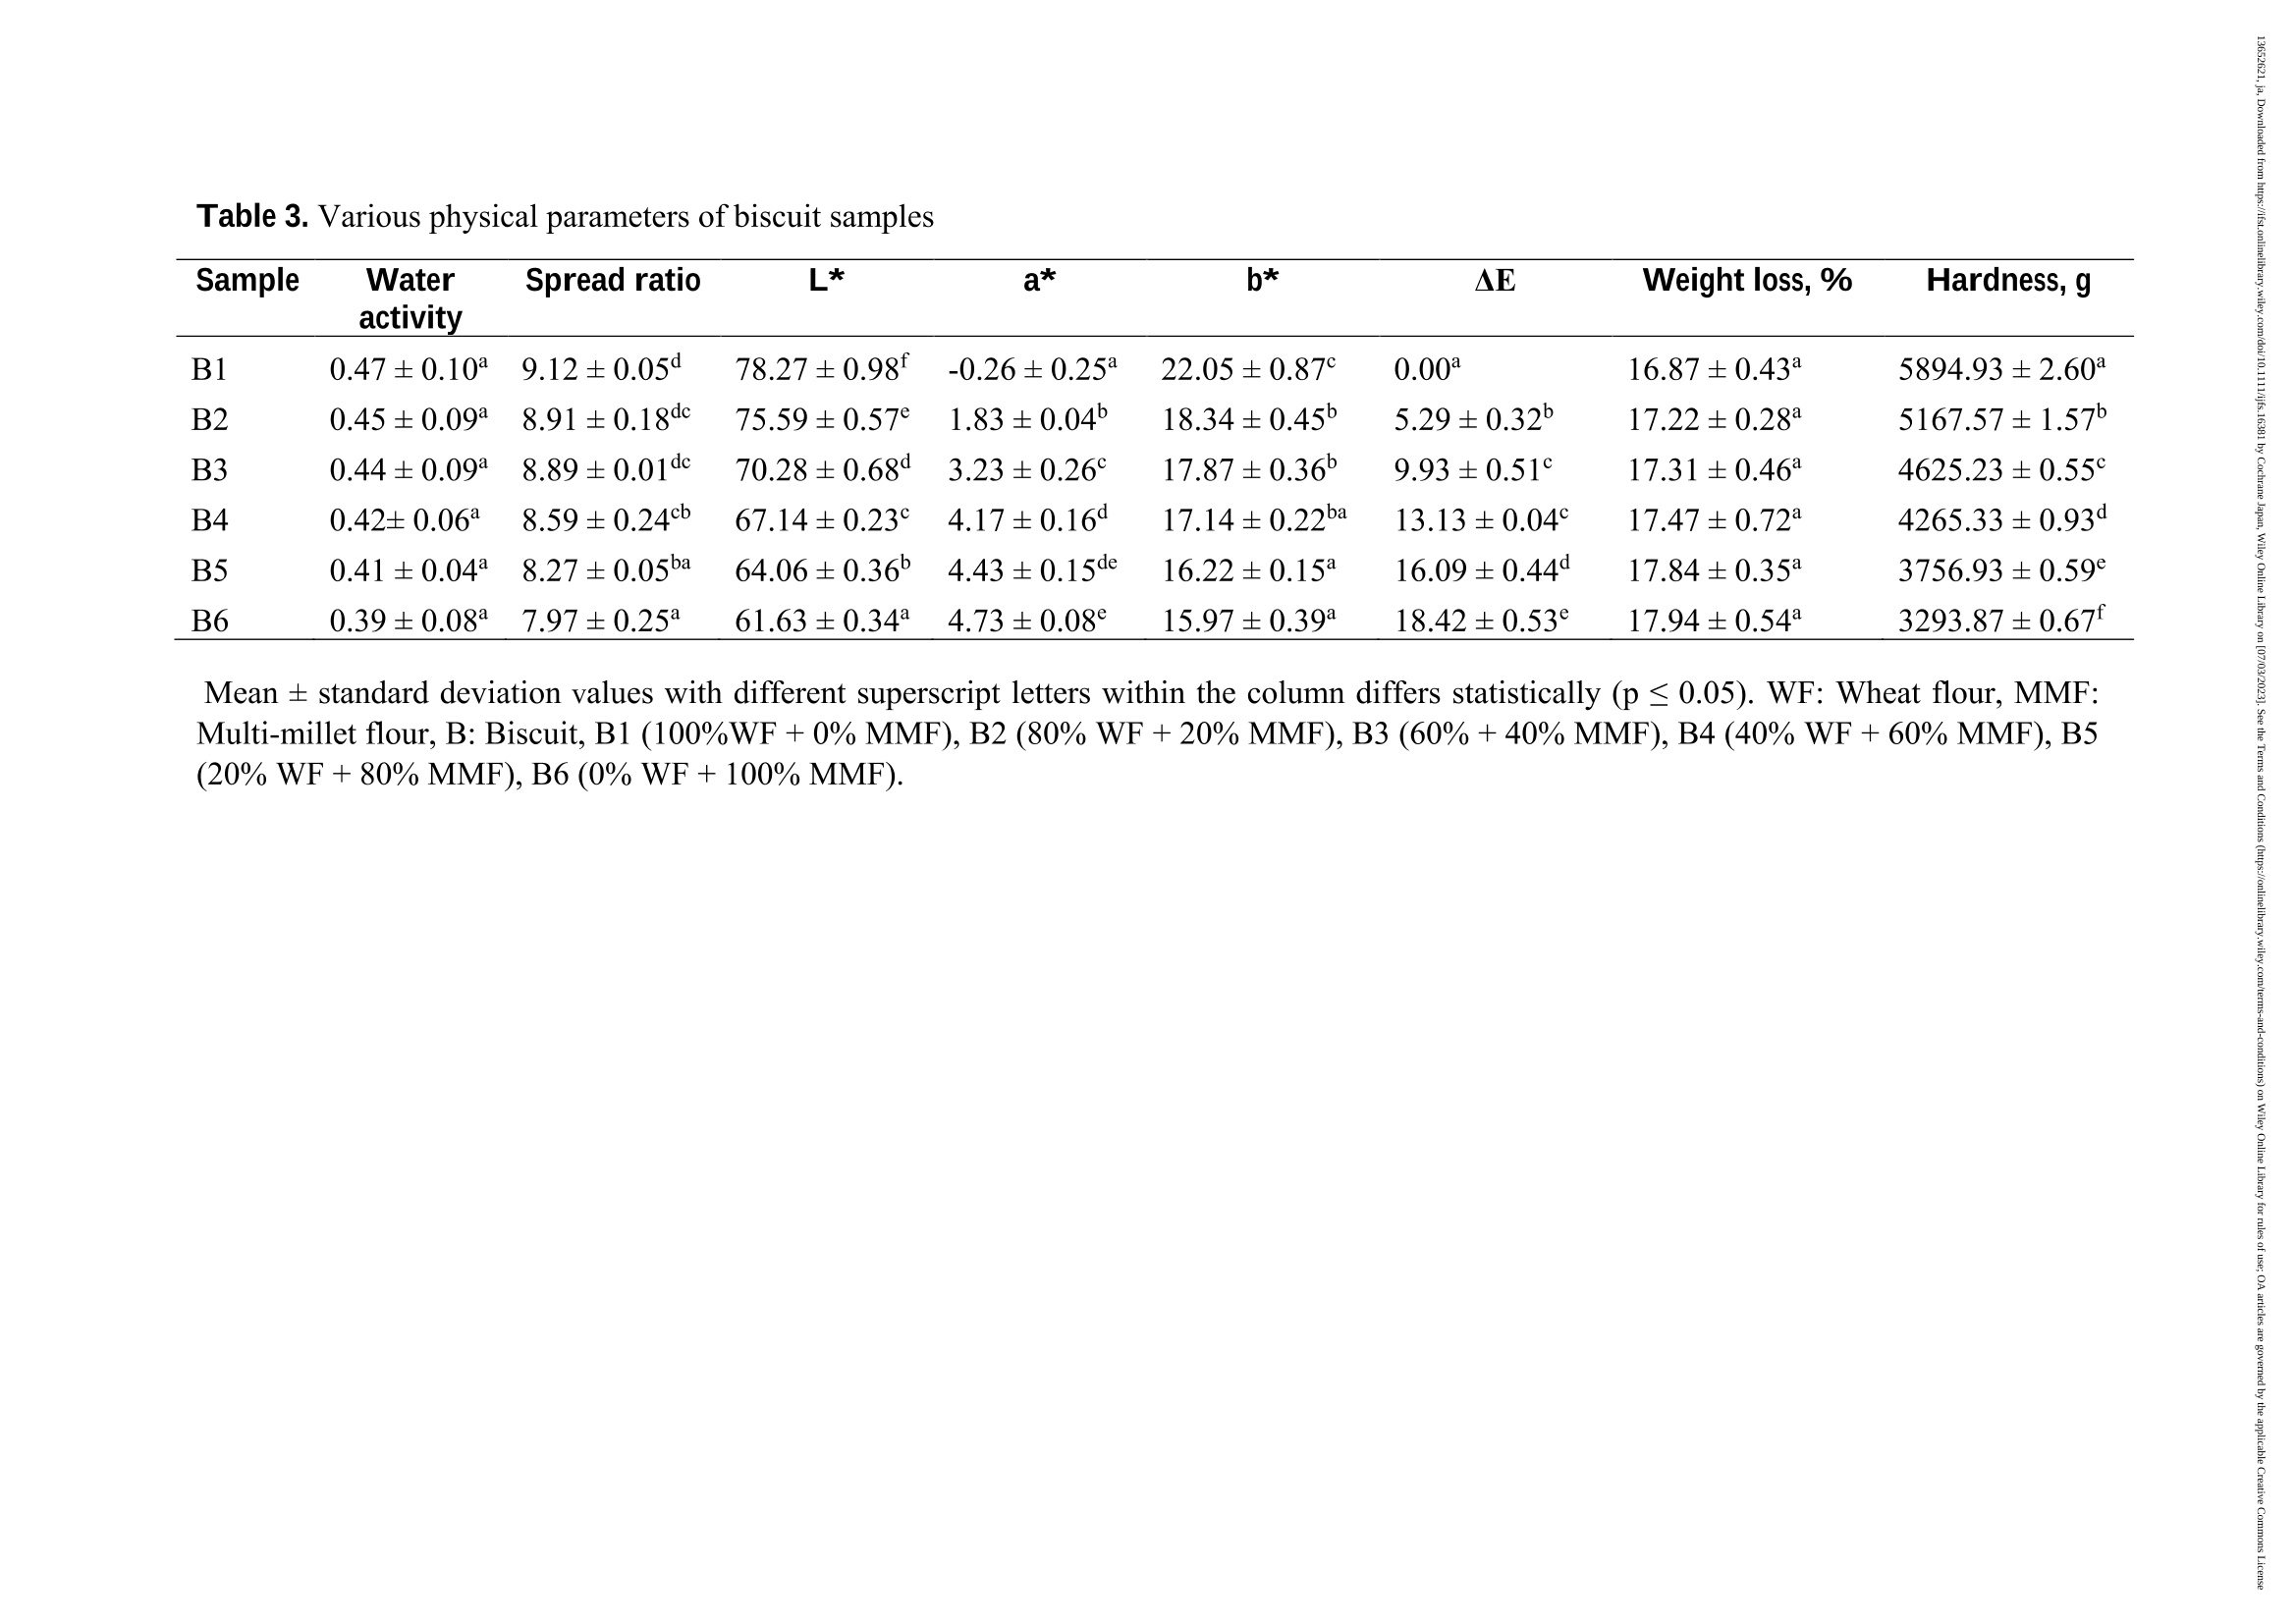
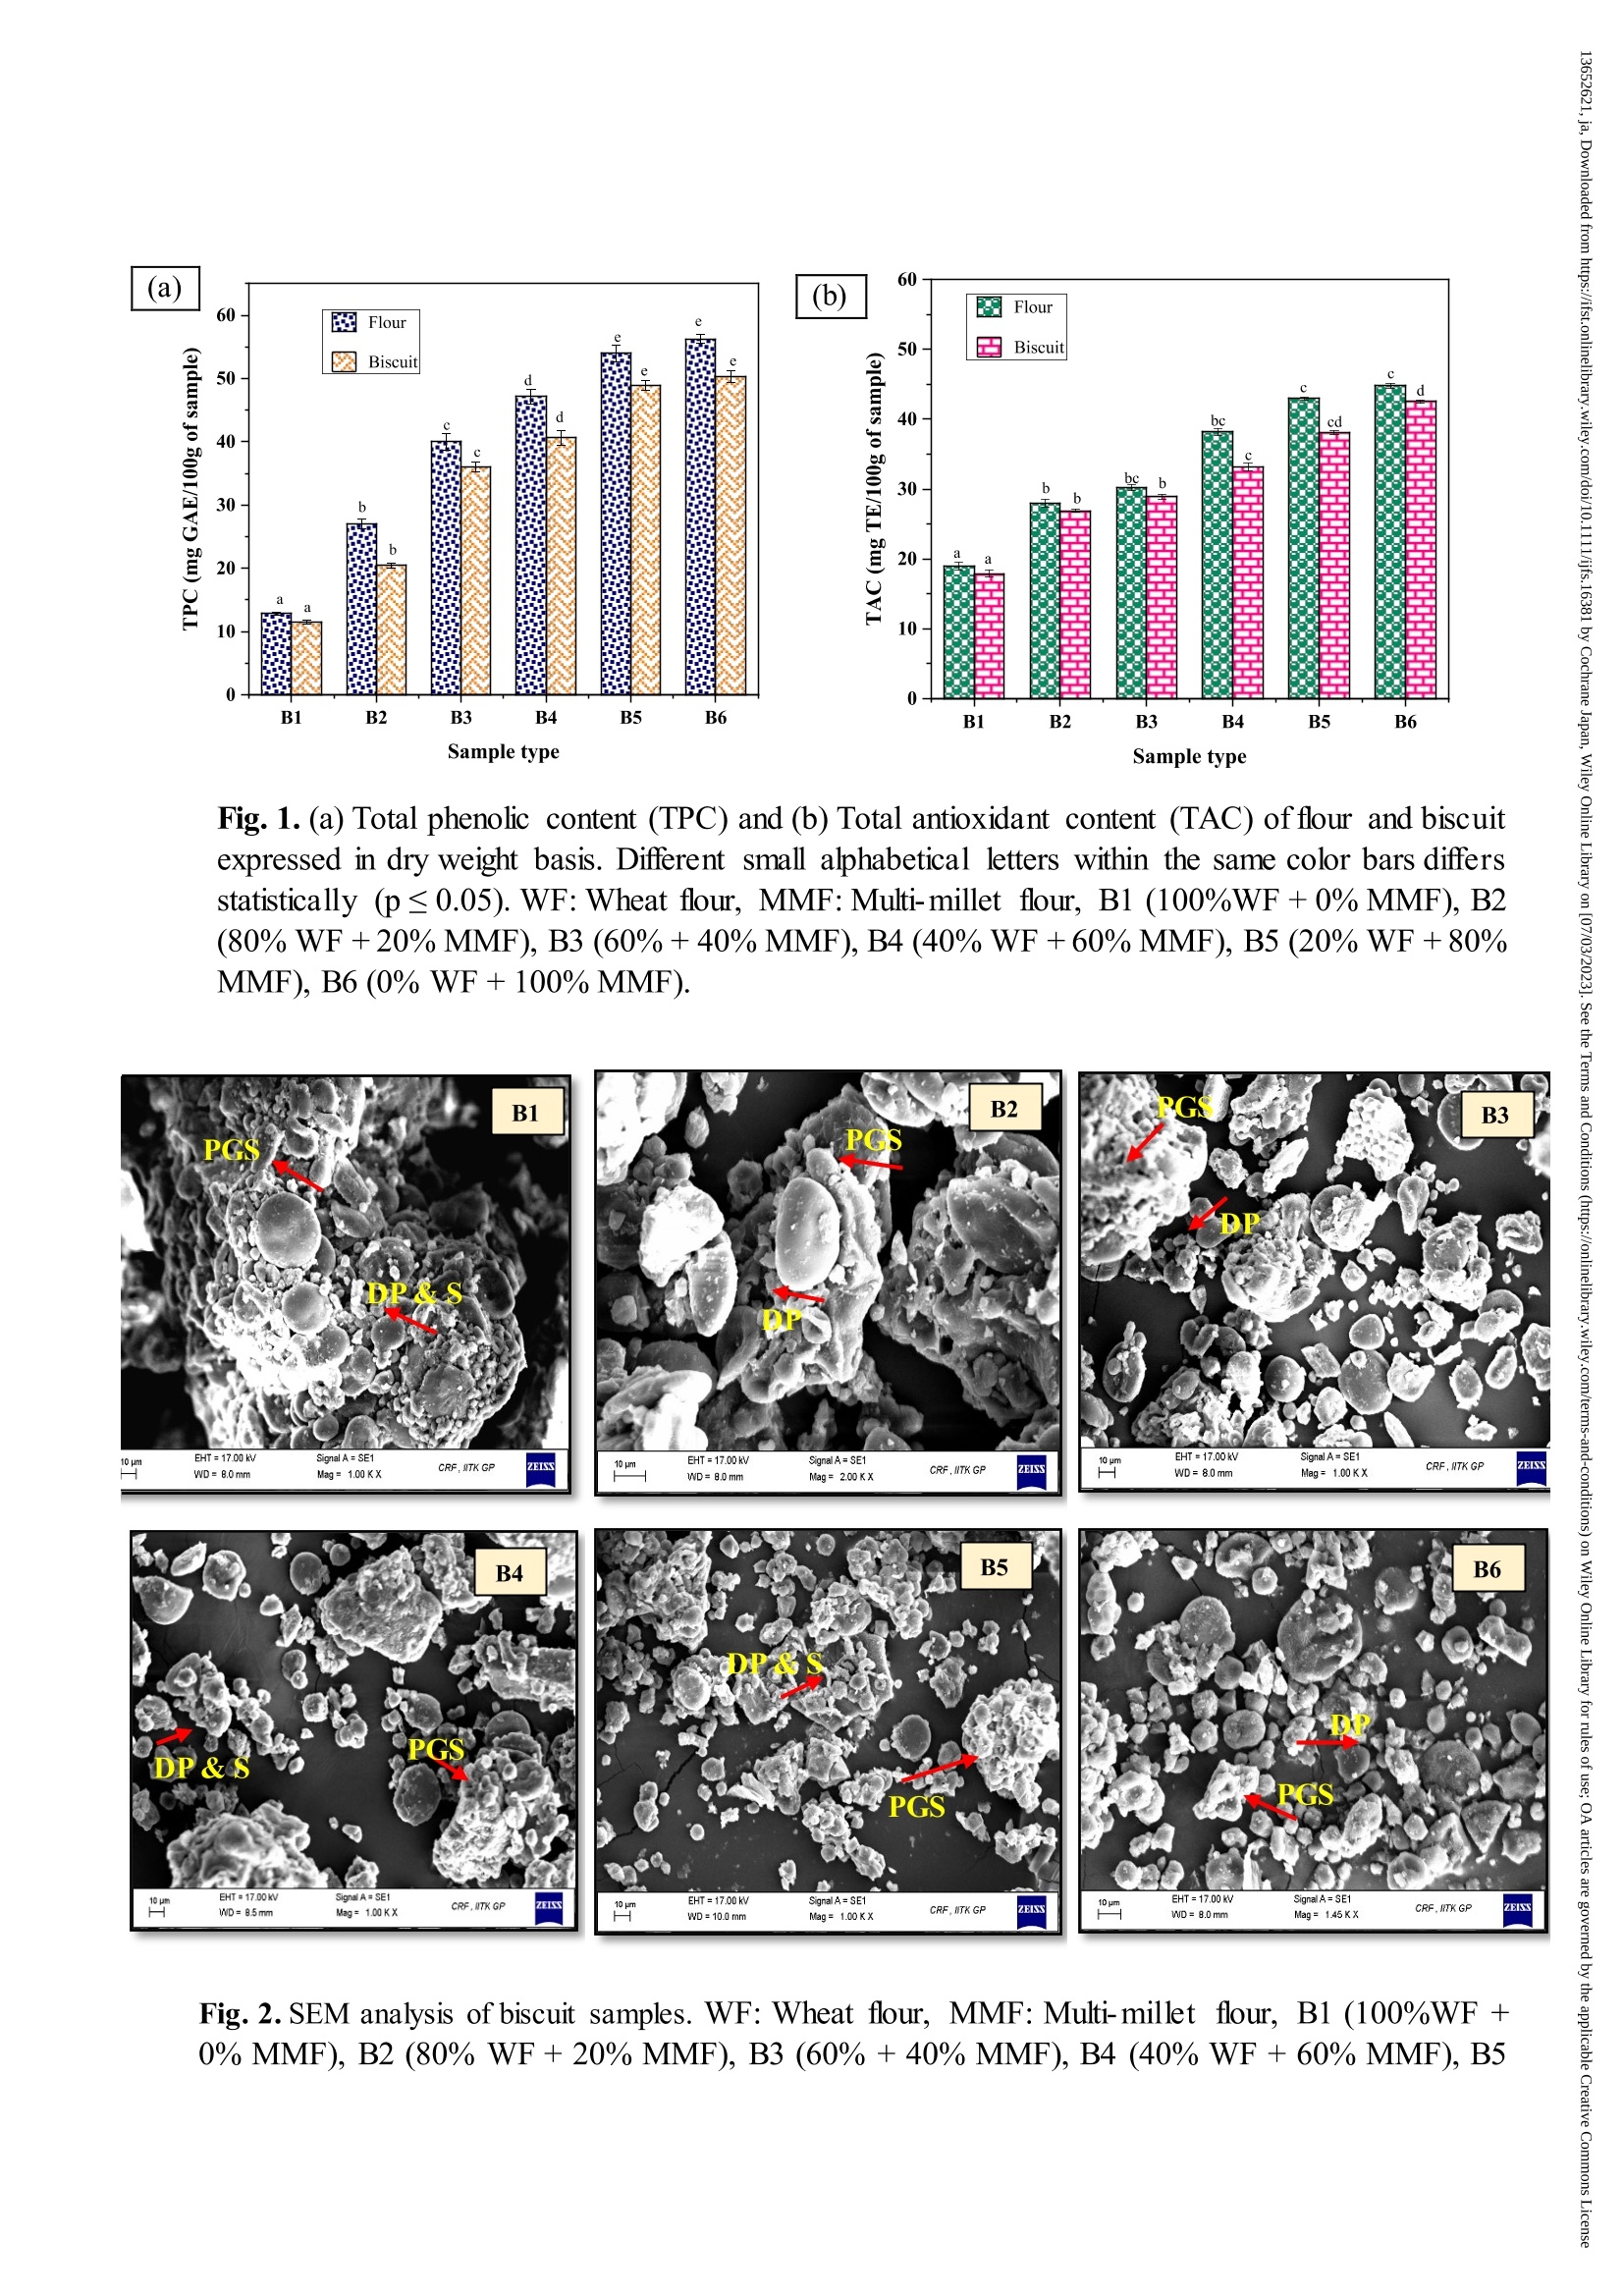
对加入多种小米的饼干功能性,物理化学性,质地性和感官性的评价Evaluation of functional, physicochemical, textural, and sensorial properties of multi-millet-based biscuit使用格哈特公司全自动凯氏定氮仪,全自动脂肪仪,全自动纤维仪检测加入多种小米的饼干的蛋白质、脂肪、纤维含量The peer review history for this article is available at https://publons.com/publon/10.1111/ijfs.16381 Arepally Divyasree (Orcid ID: 0000-0002-9821-6920)Coorey Ranil (Orcid ID: 0000-0002-5261-1300) 对加入多种小米的饼干功能性,物理化学性,质地性和感官性的评价 Evaluation of functional, physicochemical, textural, and sensorial propertiesSofmulti-millet-based biscuit DivyasreeArepallyl,2,RavulaSudharshanFReddy2, Ranil Cooreyl*,TridilbKKumarGoswami²* School of Molecular Life Sciences, Curtin University, Kent Street, Bentley, WesternAustralia, Australia. 2Agricultural and Food Engineering Department,IndianInstitute of Technology,Kharagpur, India - 721 302. 1,2*Corresponding author: R.Coorey@curtin.edu.au; tkg@agfe.iitk gp.ac.in Abstract Consumer desire for typical health-promoting snacks is on the rise. Millet is thought toprovidee consumerhealthhbenefitsand can be useddinLtreating celiac disease andgastrointestinal problems. In this study, wheat flour (WF) was substituted with multi-millet flour (MMF) at different levels (0, 20, 40, 60, 80, and 100%) in producing themulti-millet biscuit. MMFF was made by combining an equal proportion of barnyard,finger, kodo, and pearl millet. The functional, physicochemical, and sensorial propertiesof the biscuits were examined. The water holding and oil absorption capacity increasedby increasing the proportion of MMF to WF. Biscuits made from MMF had significantlymore fat, ash, and fibre (p <0.05) than the control (100% WF). In comparison to thecontrol biscuit, the 100% MMF-based biscuit had a higher total phenolic content (50.30十1.64 mg of GAE/100 g) and antioxidant activity (13.85± 0.33 mg of GAE/100 g).There was also a decrease in L* and b*, and an increase in a* on increasing proportion ofMMF, indicating that the biscuit colour darkened significantly (p <0.05). The sensoryanalysis indicated that biscuits with 40% MMF were most acceptable compared to therest of the samples. This study provides reference in usage of MMF for producingnutritional multi-millet-based biscuit. Keywords:Multi-millet flour, Proximate analysis,,Biscuit, Physical, Nutritional,Sensory. 1。Introduction This article has been accepted for publication and undergone full peer review but has notbeen through the copyediting, typesetting, pagination and proofreading process which maylead to differences between this version and the Version of Record. Please cite this articleas doi: 10.1111/ijfs.16381 New nutritious products have been developed by the food industry considering the healthand convenience of the consumer. Among them, bakery products especially biscuits holda significant position in the market as they are widely consumed by all age groups andhave a longer shelf life (Arepally et al, 2020). The major ingredients for preparingbiscuit dough include flour, fat, and sugar. Soft cereal flours which are high in starch,low dietary fibre, protein, and mineral content are used to produce biscuits. It is welldocumented that gluten should not be consumed by people suffering from IgE-mediatedwheat allergy and celiac disease as it causes villous atrophy (Punia Bangar et al, 2022;Di Cairano et al, 2018). Thus, there is an increase in the innovation of alternative foodproducts to gluten containing diets (Rachman et al, 2023). Research has focused on theproduction of biscuits and similar baked products from wheat alternatives to replacewheat portion partly or completely with gluten free flours. Various gluten-free flours used in producing biscuits include rice, maize, pseudo-cereals,pulses, and millets (Moss and McSweeney, 2022). Among them, rice and maize are thetraditionally used gluten-free floursthatare high in energy,but ackin nutrients.vitamins, and minerals compared to legumes and millets (Di Cairano et al, 2018).Although legumes provide nutritional value, they contain allergenic pproteiniss suchascupins,prolamins,and profilinsthat result incardiovascular, respiratory, andgastrointestinal tract problemss iinn some iindividuals(Foschia et al, 2017). Millets aregaining popularitybecausetheyarehighin macro anddnmicronutrients.such asphytonutrients,phenolic acids,dietaryfibre. vitamins,bbiicoactive compounds,andminerals (Sharma et al, 2022; Xiu et al, 2022). Despite this, the usage of millets inbiscuit production is scarce, even though it has been part of the traditional diet likeAppalu and millet porridge in countries like India, Russia, and China (Sharma et al,2021). Millets are a small-seeded staple food in India, Niger, Nigeria, China, Africa, and partsof Europe (Devisetti et al, 2015), a hardy plant that is drought resistant and does notcontain gluten making it suitable for celiac disease people. There are several types ofmillet, pearl millet, finger millett,, pprroossoo millet, foxtail millet, kodo millet, barnyardmillet, and little millet. Among them, finger millet, kodo millet, and pearl millet have ahigher concentration of starch (60-70%) while barnyard millet has a lower concentrationof nutritional fibre (13%). Barnyard millet contains Y-aminobutyric acid (GABA) andshows excellent blending properties with other grain flour without resulting in any off- flavour and aftertaste. In addition, it has the lowest carbohydrate content amongst othermillets at 58.56%., with 25.88% classified as slow digestible (Goswami et al, 2015).Despite all these benefits, lesSsStthan 2.5% of theebiscuitsSaavailabllee in the marketworldwide contain millet flour asan ingredient (Di Cairano et al, 2018)) aanndd moreresearch needs to be done to produce millet-based biscuits. Some of the studies on gluten-free biscuits include the flour blend of foxtail, barnyard,and Kodo millets (Sharma et al, 2016), barnyard, proso, and finger millet (Singh et al,2012). To garner the collective health benefits of millet, they are consumed as multi-grains. Multi-millet flour (MMF) is a combination of different millets mixed in equal, orunequal, proportion to each other. The amalgamation of MMF augments the nutritionalquality of flours which can be used to make biscuits. There are no published studies onthe possible use of barnyard, pearl, kodo, and finger millet for producing millet-basedbiscuits by replacing wheat flour. In this study, we prepared multi-millet flour using anamalgamation ofbarnyard, pearl, kodo, and finger millet flour and produced a multi-milletbiscuitthatissensory comparableto wheat-based biscuits. Accordingly, thefunctional, nutritional,physicochemical,andsensorial propertiesof theie1multi-milletbiscuits were investigated. 2. Materials and methods 2.1 Materials Wheat flour, barnyard millet flour, pearl millet flour, finger millet flour, and kodo milletflour (B & B organics company, India), common salt (Tata company, India), unsaltedbutter (Amul group, Gujarat, India), refined sugar, baking powder (WeikField Foods Pvt.Ltd., India) were purchased from a local market in Kharagpur, India. All the laboratorychemicals and reagents used were of analytical grade and procured from Hi-Media andSigma-Aldrich, Mumbai, India. 2.2 Preparation of multi-millet flour-based cookies The millet flours from finger, pearl, barnyard, and kodo were mixed in equal amounts tocreate multi-millet flour (MMF). The MMF was combined with wheat flour (WF) in thefollowing ratios: 0%, 20%, 40%, 60%, 80%, and 100%. Biscuits were prepared using thefollowing ingredients with slight modificationsin the AACC International ApprovedMethod 10-31.03 (AACC, 2010). The ingredients used per 100 g of flour were of salt (0.6 g), butter (30 g), sugar (35 g), baking powder (1.5 g), and water (13 mL). All theingredients were then combined in a bowl with a hand mixer, hand-kneaded and sheetedinto a uniform thickness of 3 mm and cut into circular shape of 47 mm in diameter usinga round biscuit cutter, then panned and baked at 180 ℃ for 11 min in preheated electricoven (Bajaj 2200 TMSS, India). Each batch consisted of 11 biscuits. The cooled biscuitswere placed in polythene zip lock bags and stored for 2 h in a vacuum desiccator untilfurther analysis. 2.3 Functional properties of multi-millet flour 2.3.1 Water holding capacity (WHC) Water holding capacity was measured following the methods of Cheng and Bhat (2016).The water holding capacity was calculated as 2.3.2 Oil absorption capacity (OAC) Oil absorption capacity was measured using the procedure followed by Vasanthakumariand Jaganmohan (2018) and was measured as 2.3.3 Swelling power and solubilitySwelling power was determined according to Yu et al. (2012) and calculated as Sediment weightSwelling power =Dry sample weight -Dried supernatant weightDried supernatant weightSolubility,%=-×100Dry sample weight 2.3.4 Emulsion activity and emulsion stability Emulsion activity wasSmeasured using the method by Sulieman et al. (2019) andWasmeasured as The emulsion stability was determined by heating the emulsion at 75 ℃ for 30 min in awater bath. The emulsion was cooled to room temperature and then centrifuged at 3000 gfor 20 min. The emulsion stability expressed in percentage was measured as the ratio ofthe height of the emulsified layer to the total height of the mixture. 2.4 Analysis of proximate composition The moisture content of flour and bbiissccuuiittss was determined according to Arepally andGoswami (2019). The protein content was determined by the Kjeldahl method (AOAC976.05, 2002). Fat content was estimated by the Soxhlet extractor (Soxtherm, Gerhardt)following the method described by Muzzafar and Sharma (2018). To determine the ashcontent, 5 g of sample was placed in a pre-weighed silica crucibles and heated at 550℃until constant weight in a muffle furnace. Ash content was calculated as Crude ffibre content WasdeterminedLusing the ddefatted sampleebbyy acidand2alkalidigestion followed by thee incineration and weight loss determination (AOAC, 2000)official method 962.09. Carbohydrate content was calculated using the difference methodby subtracting the total percentage of proteins, total ash, fat, and moisture content withthe sample which is represented as 100%. The energy was determined using the equationfollowed by Sulieman et al. (2019). Energy (kcal/100g) =4 x (protein in g +carbohydrate in g) +9 x(fat in g). 2.5 Extract preparation Flour (1 g) was added to 10 mL of acidified ethanol (1% HCl in ethanol), mixed for 2 to3min, and placed in a digital ultrasonic bath (Model: LMUC6, LABMAN ScientificInstruments, India) at 45 ±2℃ for 1 h. The samples were taken out, cooled to roomtemperature, and centrifuged at 7500 g for 20 min at 10 ℃. The supernatant was filteredthrough Whatman paper number 4 with a pore size of 20 to 25 um. The collected residueWass re-extracted as described above. The obtained supernatant was combined withprevious supernatant and made up to 25 mL in a volumetric flaskwith 80% aqueousethanol and stored in a freezer until analysis (Asadi et al, 2021). The same procedure isfollowed for biscuit sample ground to a fine powder. 2.6 Determination of total phenolic content The total phenolic content of flour and biscuits were determined following the Asadi etal. (2021) method with minor adjustments. From the extract, 1 mL of it was added to aborosilicate test tube with caps, to which 1.75 mL of distilled water was added andmixed. After that, 0.5 mL of Floine - Ciocalteu reagent was added, and the mixture wasallowed to equilibrate for 5 min. To this, 0.75 mL of 7.5% Na2CO3 solution was addedand mixed thoroughly. The absorbance of the mixture was measured using a UV-VISDoubleeBBeam spectrophotometer (Model:TS2090, Analytical TechnologiesLimited.India) at 760 nm after incubating at room temperature for 60 min. The data is presentedas mg of Gallic acid equivalent (GAE) after a standard curve containing gallic acid wascreated with a fit of R2=0.99. 2.7 Determination of antioxidant activity Total antioxidant content in terms of DPPH radical scavenging activity was determinedaccording to Jayawardana et al. (2022). Into a borosilicate test tube with caps, 1 mL ofthe extract was added and diluted with 2.05 mL of ethanol followed by the addition of0.95 mL of DPPH solution. The prepared solution was mixed and incubated in the darkfor 30 min at room temperature. After that, a UV-Vis double beam spectrophotometerwas used to measure the absorbance at 517 nm. For control, absorbance of ethanolsolution of DPPH without sample was measured at same wavelength at t= 0 min. TroloxWas usedd asSa standard and the resultsSwere calculated in terms of mg of Troloxequivalent (TE) per 100 g sample. 2.8 Physical properties of biscuit 2.8.1 Water activity The water activity of the crushed biscuit samples was measured at room temperatureusing2a water activity meter (Rotronic Hygrolab 3-HP23). Before measurement, theinstrument was calibrated with distilled water (Arepally et al. 2020). 2.8.2 Spread ratio and Weight loss The spread ratio (SR) of the biscuit was measured according to Asadi et al. (2021) by thefollowing equation. For the weight loss, biscuits were weighed before (WBB) and after baking (WAB) andcalculated by the below given formula. 2.8.3 Surface colour measurement The CIE (Commission Internationale de lEclairage) colour of flour and biscuit sampleswere measured using the Chroma Meter (CR-400/410 of Konica Minolta, Ramsey,USA). The L*, a, and b* values were measured in three different locations in randomlychosen five samples. The total colour difference between the sample B1 (100% WF) andsamples prepared with various proportions of MMF was measured as Where, L*, a*, and b* correspond to baked biscuits with MMF; (Lo, ao, and bo)correspond to biscuit prepared with wheat flour alone (B1). 2.8.4 Hardness The hardness of the biscuit was estimated using a texture analyzer (TA-XTplus, StableMicro Systems, Godalming, U.K.). A compression force was applied according to Maliket al (2022) by penetrating the cylinder probe of (6 mm diameter, P/6) with a 50 kg loadcell. The test conditions were maintained as pre-test speed at 0.5 mm/s, test speed at 1.5mm/s, the post-test speed at 10 mm/s, penetration distance at 3 mm, and trigger type asauto’ 2.8.5 Microstructural analysis Microstructural analysis of biscuit samples was done according to Kumar et al. (2015)using a Scanning electron microscope (SEM) (Carl ZEISS SMT, Germany) with slightmodification. For the preparation of samples to conduct SEM analysis, the ground biscuitsamples are defatted using hexane and oven dried. Later, dried samples are sputter coatedandSEManalysis iiss conducted under a high vacuum, operating at an acceleratingvoltage of 17 kV. 2.9 Sensory evaluation of biscuit BiscuitsamplesVwere assessed1fforappearance,colour.Ltaste. aroma.。 mouthfeel.crispiness, and overall acceptability. For sensory analysis, the biscuits were prepared theday before and stored in polythene zip lock pouches in a vacuum desiccator until the sensory evaluation was conducted. The untrained panellists were selected in accordancewith the method followed by Sugumar and Guha, (2022) and Staffolo et al. (2004). Apanel of 25 untrained institute affiliated panellists (aged 22-37 years) were provided withsix biscuit samples (5 samples prepared with MMF and 1 sample prepared with WF)served over a plate, a glass of water, a sensory score sheet, and a pen. Sensory evaluationwas performed in a sensory laboratory at room temperature (30 ℃) 3 h after their mid-day meal. The samples were labelled with random three-digit codes and presented inrandom order to the panellists. The panellists were instructed to rinse their mouth anddrink the water before and after tasting each sample to avoid carry-over the taste. Thepanellists were asked to score the sample and were allowed to give their opinion ofpreference according to a nine-point hedonic scale ranging from 1 (dislike extremely) to9 (like extremely) and they took 30 min to complete the evaluation process. 2.10 Statistical analysis The experiments were conducted in triplicate and results were presented as mean ±standard deviation. One-way ANOVA is performed with the Tukey HSD test at a 95%confidence level with a statistical significance of P < 0.05 using the software IBM SPSSStatistics of version 25.。For the sensory evaluation, sensory attributes scoreswerechecked for any statistical significance (P <0.05) by a non-parametric Kruskal-Walli'stest. 3. Results and discussion 3.1 Functional properties of biscuit flour 3.1.1 Water holding capacity and oil absorption capacity The WHC of the flour samples (F1 to F6) ranged between 104.17 ±0.11 to 135.85±0.11%. As the level of added MMF increased so too did the WHC (Table 1). This couldbe attributed to the presence off differentparticle sizes,shapes,hydrophiliccarbohydrates, protein, and fibre in the MMF (Singh et al, 2003). WHC can also beaffected by the three-dimensional structure of protein and fibre that imbibe the watermolecules. Higher WHC of F6 indicates that products manufactured with it could retainsofter texture resulting in degraded quality parameters such as crispiness and overallacceptability.Flour type F6 with high WHC results in less water available to dissolvethe sugar leading to a lower spread ratio. Similar results of higher WHC were reportedbyy Vasanthakumari and Jaganmohan (2018)Vwhere the functionality of multi-cereal- legume flourand wheat flourwere evaluateddffor biscuitpreparation. Theeauthorsobserved that the WHC of composite flour was significantly higher than that of wheatflour alone (p≤0.05). Oil absorption capacity (OAC) of flour is also one of the factors impacting quality as oilameliorates the mouthfeel, retains flavor, improves palatability, and extends the shelf lifeof food, particularly bakery products. Flour with higher OAC is suitable for its utilizationin confectionary and bakery products. The substitution of wheat flour with the MMFincreased the OAC from F1 (69.35±0.09%) to F6 (84.36±0.10%) (Table 1). This couldbedueto theeexistence of extended non-polar side chains of proteinsinMMF(Adebowale and Lawal, 2004). Also, the presence of hydrophobic groups on the surfaceof lipophilic amino acids such as methionine, leucine, isoleucine, valine, phenylalanine,and proline in millets binds the hydrocarbon side chains of oil might have influenced theoil absorption capacity in multi-millet flour (Anitha et al, 2020). Abioye et al. (2018)developed cookies by substituting wheat flour with 0, 10, 20, and 30% finger millet.They observed an increasing trend of OAC (91.70 and 96.8%) on increasing the fingermillet proportion. 3.1.2 Swelling power and solubility Swelling power is the ability of intra-granular portions of starch to hold water withintheir structure before and during gelatinization and solubility represents thesolubilization of starch granules. Sample F6 differs significantly from samples F1 to F5(Table 1). A higher swelling power (14.51± 0.16%) and solubility (14.33±0.23%) wasobserved for F6. The swelling power and solubility decreased from samples F1 to F3 andthen increased from F4 (40% WF + 60% MMF) to F6 on increasing the addition ofMMF proportion. This decrease in swelling power from F1 to F3 might be accredited tothe reduction of the gluten content in wheat flour that retains the water and increases thevolumee by absorbing thewater. Moreover, the increasedd proportion of millet flourincreases the presence of resistant starch. This causes greater resistance to swell becauseof their strong bonding forces among the granules. On the other hand, the increase inswelling power from F4 to F6 could be because of the chain length of the amylopectin ofmillet starch that binds the water molecules by hydrogen bonds (Zhu, 2014). An increasein solubility of samples from F4 to F6 might be associated with the weakening ofintragranular bonds leading to the leaching of amylose from the millet starch (Suma andUrooj, 2015). This is supported by Tumwine et al. (2019) who observed an increase in solubility (14% to 19%) due to swelling and bursting of starch granules at a temperatureof greater than 80 ℃ leading to the leaching of amylose into water. 3.1.3 Emulsion activity and emulsion stability Emulsion activity describesthe maximum amount of oil emulsified by protein whileShemulsion stabilitymeasureshowwellan1emulsifier (protein))can keep an oil-wateremulsion stable over time. The emulsion activity and emulsion stability of samples F1 toF6 ranged from 26.84±0.08% to 45.23±0.10 and 29.16 ±0.11 to 41.86±0.11%,respectively (Table 1). A significant decrease in emulsion activity and emulsion stabilitywas 1noticed with an increase in the proportion of MMF (p <0.05). This might bebecause of the dependency of the emulsion activity on the interfacial tension and surfacehydrophobicity of proteins.The substitution of wheat flourwithh multi-millet flourdecreased the quantity of protein aandllessened the electrostatic repulsion on the oildroplet surface (Kaushal et al, 2012). The present study results were supported byMudau et al. (2021) who observed a decrease in emulsion stability from 41.67% to30.22% with increasing the proportion of finger millet flour in wheat flour that decreasedthe protein content in the composite flour. 3.2 Proximate analysis The moisture, ash, fat, protein, carbohydrate, crude fibre contents, and energy valueswere significantly different among the flour samples (Table 2). The protein content offlour ranged from 9.06 ±0.05% to 9.81± 0.12% while the highest and lowest were foundfor sample F1 and F6, respectively. The carbohydrate content of flour ranged from 75.89±0.05% to 76.54±0.12% and varies significantly (p ≤0.05) for the samples F1 to F6.Except for F4andIF5, the carbohydrate content of all the flour samples differsstatistically (p ≤ 0.05) with F6. All the flour samples had significantly different ash, fat,and energy values, with sample F6 having the highest values. The energy content of thebiscuit samples gradually trended up from B1to B6with no statistically significantdifference except between B1 and B6 due to an increase in fat content of the MMF. Thecrude fibre of biscuits showed no difference (p > 0.05) among samples B1 to B4 andbetween samples B5 and B6. On increasing the proportion of MMF, there was nodifference in the moisture content of the biscuit samples which vary from 4.77± 0.21%to 5 ± 0.07%. There was an increase in the ash, fat, fibre, and energy content of biscuitsfrom B1 to B6. 3.3 Physical properties of biscuit 3.3.1 Water activity Initially, the water activity of various biscuit dough samples F1 to F6 was found to be0.78 ±0.01. Among the biscuit samples B1 to B6, there was no statistically significantvariation in the water activity of any of the biscuit samples (p>0.05). From Table 3, itwas noticed that the water activity of biscuits ranged from 0.47±0.10 to 0.39±0.09from B1 to B6. This could be due to the MMF's fibre, which can absorb and hold water,reducing the amount ofavailable water for any chemical reactions to take place. 3.3.2 Spread ratio and weight loss BiscuitsVwith a higher spread ratio are generally desirable by consumers. Except forbiscuit sample B5, biscuit samples Blto B4 had significantly different spread ratios frombiscuit sample B6. The spread ratio showed a decreasing trend from B1 (9.12 ±0.05) toB6 (7.67±0.25) (Table 3). Flour with high hydration properties reported to havehydrophilic sites that compete with limited water and resulted in a reduced spread ratio(Arepally et al, 2020). In the current study, as the water holding capacity increased forflour samples F1 to F6, there is a decrease in the spread ratio of the corresponding biscuitsamples. A similar observation was reported by Jayawardana et al. (2022) who producedbiscuits by replacing wheat flour with 25, 50, 75, and100% of finger millet. Theyreported a decreased spread ratio of biscuits from 7.56± 0.24 to 7.34 ± 0.20 because ofthe presence of high dietary fibre content in biscuits substituted with finger millet flour.The weight loss between biscuit sample B1 and B6 did not differ significantly when thequantity of MMF incorporation increased. The weight loss ranged from 16.87 ± 0.43%for biscuit sample B1 to 17.94 ±0.54% for B6. MMF-based biscuits lost more moistureduring baking, which caused the weight loss of cooked biscuits to be higher. This isfurther corroborated by the results of a biscuit moisture analysis, which show that biscuitsample B6 has less moisture than B1. 3.3.3 Colour The colour characteristics of the biscuit samples B1 to B6 are given in Table 3. The L*values reduced significantly from 78.27±0.98 to 61.63 ±.034 for the biscuit samples B1to B6 (p≤0.05). The biscuits became darker in colour as the amount of MMF increasedand this might be attributed to the dark colour of MMF as opposed to the white colour ofwheat flour. Moreover, the presence of high phenolic and mineral content in millet flourcontributed to its dark colour. The a values increased significantly from -0.26 ± 0.25 in the biscuit sample B1 to 4.73 ±0.08 in the B6. For biscuit samples B1 to B6, b* valuesranged from 22.05 ±0.87 to 15.97 ±0.39 were noted. The total colour difference (AE)>3usually indicates an obvious colour difference easily identified by the human eye(Goswami et al, 2015). From Table 3, it could identify that AE increased significantlyfrom 0.00 to 18.42 ±0.53 for the samples B1 to B6 with increasing the proportion ofMMF to WF. Therefore, there is a clear identification of colour difference among thesamples B1 to B6. 3.3.4 Hardness The biscuithardnessSsignificantly decreasedwith increasing multi-millet flour (MMF)proportion from B1 (5894.93±2.60 g) to B6 (3293.87±0.67 g) (Table 3). The decreasein hardness could be because of the dilution of gluten content with the incorporation ofan increased proportion of multi-millet flour. The decreased hardness is also affected bythe water holding capacity (WHC) of the flour. Flour (F6) with high WHC retains thesofter texture of the biscuits due to lower gluten content (Arepally et al, 2020). Like this,Hussain et al. (2020) findings on making biscuits with wheat and pearl millet flourshowed that as the amount of pearl millet flour was increased, the hardness of thebiscuits decreased from 5798 g to 4323 g. 3.4 Total phenolic and antioxidant activity of flour and biscuit The TPC content for 100% MMF is higher (56.25±1.14 mg/100 g of dry sample) ascompared to wheat flour (12.89 ± 0.41 mg/100 g of dry sample). With the addition ofMMF to the WF, the overall phenolic content of the flour was enhanced Fig. 1(a). Incomparison to the flour mix, biscuits had a significant reduction in total phenolic content(50.30± 1.64 for B6 to 11.49 ± 0.48 mg of GAE/100 g for B1) due to the loss ofphenolic compounds during baking (Kaur et al, 2017). Another reason could be thedilution of biscuits as they contain other incorporated ingredients such as fat and sugarwithhno OIleast phenolicactivity compared to pure flours. Similar findingswereobserved by Hussain et al. (2020) for pearl millet biscuits. They observed a decrease inTPC values biscuit (3.01 ± 0.05 mg GAE/g sample) compared to flour (6.41 ± 0.12 mgGAE/g sample). On the other hand, Adebiyi et al. (2017) observed inconsistent findingsregarding TPC in pearl millet biscuits. When compared to flour (70.34± 1.65), theyobserved that the biscuit samples had higher TPC values (151.21±1.11) which might beexplainedby the release of bound1phenolics ffrom millet flour during baking. The antioxidant activity of flour increased1 with an increase in the amount of MMF to thewheat flour as shown in Fig. 1(b). The flour sample F6 had the highest antioxidantactivity of 44.79 ±0.56 mg of TE/100 g of dry sample, whereas the F1 had the lowestantioxidant activity of 18.97 ± 0.92 mg of TE/100 g of dry sample. This is attributed tothe higher antioxidant activity of MMF compared to WF. Biscuits showed a decreasedantioxidant activity compared to the flour blends, which varied from 17.89±0.9 to 42.52±0.46 mg of TE/100 g. This is due to the degraded phenolic compounds during baking.Jayawardana et al. (2022) produced a finger millet biscuit by replacing wheat flour with25, 50, 75, and 100% of finger millet and observed an antioxidant activity of 25.36 ±0.58 mg of TE/100 g at 50% finger millet flour compared to wheat biscuit (11.70±0.17mg of TE/100 g). 3.5 Microstructural evaluation The microstructure of Sample B1 showed a larger granular structure intact with irregularsized gelatinized starch, denatured proteins, and sugars as represented in Fig. 2. Themicrostructure of biscuit samples B2 to B6 showed a partial gelatinization of starch anddisrupted protein matrix. This is due to the insufficient available water in MMF doughwith increase in high fibre content from B1 to B6. The higher water holding capacity offibre lowers the starch hydration and its gelatinization. This ultimately leads to the loosestructure of starch polymer as can be seen Fig. 2(B1 to B6) (Tomar et al, 2022). Thiscould be further supported by the obtained results of lower hardness values in our studyfor biscuit samples B1 to B6. Kumar et al. (2015) also observed a similar kind ofdistortion of granular structure and disruption of protein in multi-grain-based premixbiscuits due to the replacement of WF with high fibre. Also, the shape of granuleschanged from compact to spherical and polygonal by increasing the incorporation ofMMF into the WF. 3.6 Sensory evaluation of biscuits The sensoryevaluation Was conducted with 25 Uuntrained1panellists2accordingtoSugumar and Guha (2022) and Staffolo et al. (2004). As to the best of our knowledge,studies on preparation of multi-millet biscuit using amalgamated barnyard, kodo, finger,and pearl millet flour is scanty. The authors needed to first establish if a multi-milletbiscuit consisting of these floursSWaseven edible by a consumer before any furtherresearch work can be done. The study was able to establish the consumer acceptability ofthis type of biscuit. The average values of panel perceptions for biscuits prepared by the various proportion of MMF to the WF for distinct sensory attributes are presented in Fig.3. ItWasdepicted that the sensory score varied for biscuit samples B3and B6statistically (p <0.05) for all the attributes. Sample B1 was rated with the highest scorefor aroma and B1 and B2 for mouthfeel followed by sample B3. The highest score forappearance, colour, and crispiness was obtained for biscuit sample B3 with overaallacceptability of 8.25. The score for the colour of sample B1 (6.46) and B6 (5.38)changed significantly and sample B6 had dark colour due to its phenolic content, and ashcontent, andit is also somewhat gritty. The lowest score of 6.23 is obtained for thecrispiness of biscuit sample B6 because of the higher water holding capacity of flour(F6). Higher WHC of flour due to the presence of higher fibre content leads to lowercrispiness in a final product. As a result, panel sensory perceptions have deteriorated,resulting in lower scores for sensory qualities. Goswami et al. (2015) made cookies bycombining wheat flour with barnyard millet flour. They concluded that cookies madewith wheat flour received the highest overall acceptability score, followed by cookiesmadewith a 10% proportion of barnyard flour to wheat flour, while cookies madeentirely of barnyard millet flour received the lowest overall acceptability score. Similarfindings were observed by Sharma et al. (2016). The sensory evaluation of the biscuitsmade with various proportions of foxtail, barnyard, and Kodo millet (70:20:10) revealedthat they scored higher than the control cookies. 4. Conclusions The study illustrates that different levels of MMF addition had significant effects on thefunctional properties of biscuits, such as water holding capacity, oil absorption capacity,emulsion stability, and emulsion activity. Some physical properties of the biscuit variedwhere water activity and spread ratio did not change significantly with the level of MMFincorporation, while weight loss and AE increased significantly. The AE increased due tothe darker colour of biscuitsVwith the increase in the level of MMF incorporation.However, there was no statistical difference in terms of appearance among the biscuitsamples. The TPC and TAC of flour and biscuit increased with increasing amounts ofMMF. The sensory properties such as appearance, colour, taste, and overall acceptabilitywere higher for sample B3 (60% WF and 40% MMF). However, future research needs toconduct a consumer sensory analysis with a much larger panel to confirm the findings ofthe current work. Acknowledgment The first author is grateful to the Ministry of Human Resources and Development for herPh.D. scholarship. The first is thankful to Prof. P.P. Srivastav and Prof. H.N. Mishra forproviding lab facilities. She also likes to thank the Dual Ph.D. program between theIndian Institute of Technology Kharagpur, India, and Curtin University, Australia. Conflict of Interest The authors have no conflicts of interest. Funding This research study received no funding grants. Ethical Guidelines Ethical approval was not required for this research. Data availability Data may be made available upon request. References 1.Abioye, V.F., Olatunde, S.J. and Elias, G., 2018. Quality attributes of cookiesproduced from composite flours of wheat, germinated finger millet flour and Africanyam bean. International Journal ofResearch-Granthaalayah, 6(11), pp.172-183. 2.Adebiyi, J.A., Obadina, A.O., Adebo, O.A. and Kayitesi, E., 2017. Comparison ofnutritional1qqualityyaandsensoryacceptability of biscuitsobtainedfrom native.fermented. and malted pearl millet (Pennisetum glaucum) flour. Foodchemistry, 232,pp.210-217. 3. Adebowale, K.O. and Lawal, O.S., 2004. Comparative study of the functionalproperties of bambarra groundnut (Voandzeia subterranean), jack bean (Canavaliaensiformis) and mucuna bean (Mucuna pruriens) flours. Food ResearchInternational,37(4), pp.355-365. 4. AACC International, 2010. AACC International Approved Methods of Analysis(eleventh ed.). Method 10-31.03 (St. Paul, MN). 5. Anitha, S., Govindaraj, M. and Kane-Potaka, J., 2020. Balanced amino acid andhigher micronutrients in millets complementtssll6egumes for improved human dietarynutrition. Cereal Chemistry,97(1),pp.74-84. 6. AOAC 976.05 (2002). Protein (Crude) in Animal Feed (17th ed.). Oficial Methodsof Analysis of AOAC International, Arlington, Gaithersburg, MD, USA. 7. Arepally, D. and Goswami, T.K., 2019. Effect of inlet air temperature and gumArabicconcentration on encapsulation of probioticsby spray drying. Lwt-FoodScience and Technology, 99,pp.583-593. 8. Arepally, D., Reddy, R.S. and Goswami, T.K., 2020. Encapsulation of Lactobacillusacidophilus NCDC 016 cells by spray drying: characterization, survival after in vitrodigestion, and storage stability. Food & function,11(10),pp.8694-8706. 9. Asadi, S.Z., Khan, M.A. and Chamarthy, R.V., 2021. Development and qualityevaluation of cookies supplemented with concentrated fibre powder from chiku(Manilkara zapota L.). Journal of Food Science and Technology,58(5), pp.1839-1847. Annotation: It provides a methodology of preparing the extract and study of phenoliccontent. This reference is considered in preparation of extract in this paper. 10. AOAC 962.09 (2000). Oficial methods of analysis of the association of officialanalytical chemistry (17th ed.). Gaithersburg. 11. Cheng, Y.F. and Bhat, R., 2016. Functional, physicochemical and sensory propertiesof novel cookies produced by utilizing underutilized jering (Pithecellobium jiringaJack.) legume flour. Food Bioscience, 14, pp.54-61. 12. Devisetti, R., Ravi, R. and Bhattacharya, S., 2015. Effect of hydrocolloids on qualityof proso millet cookie. Food and Bioprocess Technology, 8(11),pp.2298-2308. 13. Di Cairano, M., Galgano, F., Tolve, R., Caruso, M.C. and Condelli, N., 2018. Focusongluten free biscuits: Ingredientsandissues. Trendsin FoodScience&Technology, 81, pp.203-212. 14. Foschia, M., Horstmann, S.W., Arendt, E.K. and Zannini, E., 2017. Legumes asfunctional ingredients in gluten-free bakery and pasta products. Annual review offood science and technology, 8,pp.75-96. 15. Goswami, D., Gupta, R.K., Mridula, D., Sharma, M. and Tyagi, S.K., 2015.Barnyard millet-based muffins: Physical, textural and sensory properties. LWT-FoodScience and Technology,64(1),pp.374-380. 16. Hussain, S., Mohamed, A.A., Alamri, M.S., Ibraheem, M.A., Abdo Qasem, A.A.,Serag El-Din, M.F. and Almaiman, S.A.M., 2020.Wheat-millet flour cookies:Physical, textural, sensory attributesand antioxidant potential. Food Science andTechnology International, 26(4), pp.311-320. 17. Jayawardana, S.A.S..SSamarasekera. J.K.R.R..FHettiarachchi. G.H.C.M. andGooneratne, J., 2022. Formulation and quality evaluation of finger millet (Eleusinecoracana (L.) Gaertn.) flour incorporated biscuits. Food Science and TechnologyInternational,28(5), pp.430-439. Annotation: It provides a procedure for the study of antioxidant activity section in thispaper. 18. Kaur, M., Singh, V. and Kaur, R., 2017. Effect of partial replacement of wheat flourwith varying levelIss ooff ffllaaxksseeeedd flour on physicochemical, antioxidant and sensorycharacteristics of cookies. Bioactive Carbohydrates and Dietary Fibre, 9,pp.14-20. 19. Kaushal,P.,Kumar.V.andSharma, H.K.,2012.Comparative study ofphysicochemical, functional, antinutritional and pasting properties of taro (Colocasiaesculenta), rice (Oryza sativaa))fflour, pigeonpea (Cajanus cajan) flour an irblends. LWT-Food Science and Technology,48(1), pp.59-68. 20. Kumar, K.A., Sharma, G.K., Khan, M.A., Govindaraj, T. and Semwal, A.D., 2015.Development of multigrain premixes-its effect on rheological, textural and micro-structural characteristics of dough and quality of biscuits. Journal of food scienceand technology, 52(12), pp.7759-7770. Annotation: This study explored the microstructural changes in multi-grain based biscuitdue to the replacement of wheat flour providing a reference for our research in analysingthe microstructural changes in biscuit. 21. Malik,R.A., Srivastava,,SS..2and Shahi,N.C.,2022.Formulation(of quinoaincorporatedprotein-rich biscuits and numerical optimizationCof its processparameters. Journal ofFood Processing and Preservation, 46(1), p.e16209. 22. Moss, R. and McSweeney, M.B., 2022. Effect of quinoa, chia and millet addition onconsumer acceptability of gluten-free bread. International Journal of Food Science& Technology, 57(2), pp.1248-1258. 23. Mudau, M.. Ramashia. S.E.. Mashau. M.E. and Silungwe, H.. 2021.PhysicochemicalcharacteristicsSCof breadpartiallysubstitutedwithfinger millet(Eleusine corocana) flour. Brazilian Journal of Food Technology,24. 24. Muzzafar.1A.and Sharma,V.,2018 Microencapsulation of probiotics forincorporation in cream biscuits. Journal of Food Measurement anaCharacterization, 12(3),pp.2193-2201. 25. Punia Bangar, S., Sharma, N., Singh, A., Phimolsiripol, Y. and Brennan, C.S., 2022.Glycaemic response of pseudocereal-based gluten-free food productsS:a review.International Journal of Food Science & Technology, 57(8), pp.4936-4944. 26. Rachman, A., Brennan, M.A., Morton, J., Torrico, D. and Brennan, C.S., 2023. In-vitro digestibility, protein digestibility corrected amino acid, and sensory propertiesof banana-cassava gluten-free pasta with soy protein isolate and egg white proteinaddition. Food Science and Human Wellness, 12(2), pp.520-527. 27. Sharma, S., Saxena, D.C. and Riar, C.S., 2016. Nutritional, sensory and in-vitroantioxidant characteristics of gluten free cookiesprepareddffrom flour blendsofminor millets. Journal of Cereal Science, 72, pp.153-161. 28. Sharma, R., Sharma, S., Dar, B.N. and Singh, B., 2021. Millets as potential nutri-cereals: a revieeww of nutrient composition,phytochemical profileand techno-functionality. International Journal of Food Science & Technology,56(8), pp.3703-3718. 29. Sharma, S., Sharma, R. and Singh, B., 2022. Influence of bioprocessing treatmentson phytochemical and functional properties, in vitro digestibility, protein secondarystructure andmorphologicalcharacteristics of Indianbarnyardmillet flour.International Journal of Food Science & Technology, 57(8), pp.4744-4753. 30. Singh, J., Singh, N., Sharma,T.R. andSaxena, S.K., 2003. Physicochemical,rheological1and cookiemakingpropertiesSQof corn and potato01flours. Foodchemistry,83(3),pp.387-393. 31. Singh, K.P., Mishra, A. and Mishra, H.N., 2012. Fuzzy analysis of sensory attributesof bread prepared from millet-based composite flours. LWT-Food Science andTechnology, 48(2),pp.276-282. 32. Sugumar, J.K. and Guha, P., 2022. Comparative study on the hedonic and fuzzylogic based sensory analysis of formulated soup mix. Future Foods, 5,p.100115. 33. Tumwine, G., Atukwase, A., Tumuhimbise, G.A., Tucungwirwe, F. and Linnemann,A.. 2019..Production of nutrient-enhanced millet-based compositeeflour usingskimmed milk powder and vegetables. Food Science & Nutrition, 7(1), pp.22-34. 34. Sulieman, A.A., Zhu, K.X., Peng, W., Hassan, H.A., Obadi, M., Siddeeg, A. andZhou, H.M., 2019. Rheological and quality characteristics of composite gluten-freedoughand biscuitssupplementedwithftermented and unfermentedAgaricusbisporus polysaccharide flour. Food Chemistry, 271,pp.193-203. 35. Suma P, F. and Urooj, A., 2015. Isolation and characterization of starch from pearlmillet (Pennisetum typhoidium) flours. International Journal of FoodProperties, 18(12),pp.2675-2687. 36. Staffolo, M.D., Bertola, N. andMartino, M., 2004. Influence of dietary fiberadditionion sensory andrheological properties of yogurt. International DairyJournal, 14(3),pp.263-268. 37. Vasanthakumari. P. and Jaganmohan, R.,2018. Processdevelopmentandformulation of multi-cereal and legume cookies. Journal of Food Processing andPreservation, 42(12), p.e13824. Annotation: This study investigated thewaterr holding capacity of compositeefloursamples and compared with wheat flour alone. This helps in analysing our results onsubstitution of wheat flour with millet flour. 38. Xiu, T., Liu, P., Zhang, S., Du, D., Xue, C., Hu, Y., Yang, S., Dongye, Z., Kang,M.,Li, z. and Wang, L., 2022. Polyphenol nanoparticles of millet, rice and wheat:extraction, identification, functional and morphological characteristics. InternationalJournal ofFood Science & Technology,57(8), pp.4973-4984. 39. Yu, S., Ma, Y., Menager, L. and Sun, D.W., 2012. Physicochemical properties ofstarch and flour from different rice cultivars. Food and bioprocess technology,5(2),pp.626-637. 40. Zhu, F., 2014. Structure, physicochemical properties, and uses of millet starch. FoodResearch International, 64,pp.200-211. 41. Tomar, M., Bhardwaj, R., Verma, R., Singh, S.P., Krishnan, V., Kansal, R., Yadav,V.K., Praveen, S. and Sachdev, A., 2022. Interactome of millet-based food matrices:A review. Food Chemistry, p.132636. F6 (0% WF + 100% MMF). Mean ± standard deviation values with differentsuperscript letters within the column differs statistically (p ≤0.05). WF, Wheatflour, MMF, Multi-millet flour WHC,Water holding capacity; OAC, Oilabsorption capacity; EA, Emulsion activity; SP, Swelling power; ES, Emulsionstability; S, Solubility. 45. Table 1. Functional properties of multi-millet flour Sample type WHC (%) OAC(%) SP S(%) EA(%) ES (%) F1 104.17±0.11a 69.35±0.09a 13.33±0.07° 14.21±0.13° 49.23±0.15° 45.63±0.09 F2 111.56±0.10° 75.49±0.15° 11.75±0.19* 10.66±0.23° 45.23±0.10° 41.86±0.11° F3 114.70±0.18° 77.64±0.13° 11.46±0.12 9.27±0.19* 42.87±0.11° 38.68±0.12° F4 119.35±0.07 79.89±0.13° 13.44±0.13° 11.21±0.24° 40.19±0.17° 36.93±0.07° F5 130.14±0.11° 81.65±0.09° 13.11±0.10° 12.68±0.27° 38.16±0.17 30.32±0.07° F6 135.85±0.11 84.36±0.10 14.51±0.16° 14.33±0.23 26.84±0.08 29.16±0.11 F represents the flour. F1 (100%WF +0% MMF), F2 (80% WF + 20%MMF), F3 (60%+40% MMF), F4 (40% WF + 60% MMF), F5 (20% WF+80% MMF), F6 (0% WF +100% MMF). Mean ± standard deviation values with different superscript letters withinthe column differs statistically (p ≤0.05). WF, Wheat flour, MMF, Multi-millet flourWHC, Water holding capacity; OAC, Oil absorption capacity; EA, Emulsion activity; SP,Swelling power; ES, Emulsion stability; S, Solubility. Table 2. Proximate composition of formulated flour and biscuit Sample type Moisture content,% Ash,% Fat,% Protein,% Carbohydrate,% Crude fibre,% Energy,kcal/g Flour F1 12.59±0.91 0.54±0.03a 0.33±0.02a 9.81±0.12 76.54±0.12 1.28±0.25a 348.37±0.18a F2 11.93±0.57ba 0.71±0.02° 0.95±0.13° 9.65±0.13dc 77.02±0.13° 1.39±0.10a 355.97±1.16° F3 11.61±0.29a 0.94±0.01° 1.18±0.07° 9.41±0.04cb 77.73±0.04 1.41±0.17a 359.14±0.61° F4 11.10±0.75ba 1.38±0.02 1.80±0.08 9.36±0.11b 75.57±0.11a 1.53±0.30a 355.94±0.69° F5 10.66±0.11ba 1.56±0.03° 2.07±0.07° 9.27±0.04ba 75.88±0.04 2.50±0.44 359.23±0.63° F6 10.55±0.13a 1.73±0.02 2.48±0.03 9.06±0.05a 75.89±0.05° 2.63±0.22b 362.15±0.28 Biscuit B1 5.00±0.07a 0.52±0.11a 13.35±0.50a 5.42±0.25a 75.68±0.42° 1.10±0.12a 444.55±0.27a B2 4.93±0.10a 0.61±0.13a 14.07±0.08° 5.30±0.19a 75.09±0.36° 1.33±0.19a 448.17±0.36° B3 4.87±0.34 0.89±0.06° 14.45±0.03° 5.78±0.16° 74.12±0.33° 1.39±0.15a 449.63±0.75° B4 4.85±0.18a 1.34±0.03cd 14.62±0.09° 5.37±0.10aD 73.88±0.13ba 1.44±0.14a 448.59±0.76° B5 4.81±0.33a 1.52±0.07de 14.95±0.11 5.25±0.16* 73.36±0.39ba 2.29±0.51bc 448.95±0.70° B6 4.77±0.21a 1.71±0.06° 15.39±0.12° 5.07±0.05a 73.14±0.14 2.50±0.43° 451.38±0.66° 含 Mean ± standard deviation values with different superscript letters within the column differs statistically (p≤ 0.05). WF: Wheat flour, MMF:Multi-millet flour, F: Flour, B: Biscuit, F1 (100%WF + 0% MMF), F2 (80% WF + 20% MMF), F3 (60%+40%MMF),F4 (40% WF +60%MMF), F5 (20% WF+80%MMF), F6 (0% WF+100%MMF). B1 (100%WF+0%MMF), B2 (80% WF+20%MMF), B3 (60%+40%MMF),B4 (40% WF+60% MMF), B5 (20% WF+80% MMF), B6 (0% WF+100%MMF). n三 Table 3. Various physical parameters of biscuit samples Sample Water activity Spread ratio L* a* b* AE Weight loss,% Hardness,g B1 0.47±0.10a 9.12±0.05° 78.27±0.98 -0.26±0.25 22.05±0.87° 0.00 16.87±0.43a 5894.93±2.60 0.45±0.09a 8.91±0.18dc 75.59±0.57° 1.83±0.04 18.34±0.45° 5.29±0.32 17.22±0.28 5167.57±1.57 0.44±0.09a 8.89±0.01dc 70.28±0.68 3.23±0.26° 17.87±0.36° 9.93±0.51° 17.31±0.46a 4625.23±0.55° 0.42±0.06a 8.59±0.24C 67.14±0.23° 4.17±0.16 17.14±0.22ba 13.13±0.04° 17.47±0.72 4265.33±0.93 0.41±0.04a 8.27±0.05ba 64.06±0.36° 4.43±0.15de 16.22±0.15a 16.09±0.44 17.84±0.35a 3756.93±0.59° B6 0.39±0.08a 7.97±0.25a 61.63±0.34 4.73±0.08° 15.97±0.39a 18.42±0.53° 17.94±0.54a 3293.87±0.67 Mean ± standard deviation values with different superscript letters within the column differs statistically (p≤0.05). WF: Wheat flour, MMF:Multi-millet flour, B: Biscuit, B1 (100%WF+0% MMF), B2 (80% WF+20%MMF), B3 (60%+40%MMF), B4 (40% WF+60%MMF),B5(20% WF +80%MMF), B6 (0% WF + 100% MMF). Fig. 1. (a) Total phenolic content (TPC) and (b) Total antioxidant content (TAC) of flour and biscuitexpressed in dry weight basis. Different small alphabetical letters within the same color bars differsstatistically (p≤0.05). WF: Wheat flour, MMF: Multi-millet flour, B1 (100%WF+0%MMF), B2(80% WF +20%MMF), B3 (60%+40%MMF), B4 (40% WF+60%MMF), B5 (20% WF+80%MMF), B6 (0% WF +100%MMF). Fig. 2. SEM analysis of biscuit samples. WF: Wheat flour, MMF: Multi-millet flour, B1 (100%WF +0% MMF), B2 (80% WF + 20%MMF), B3 (60%+40%MMF), B4 (40% WF + 60%MMF), B5 (20% WF + 80% MMF), B6 (0% WF +100% MMF). PGS: Partially gelatinized1:starch; DP & S:Denatured protein and sugar. Fig. 3. Sensory evaluation of various sensory attributes of biscuit samples. WF: Wheat flour, MMF:Multi-millet flour, B1 (100%WF+0% MMF), B2 (80% WF +20% MMF), B3 (60%+40% MMF),B4 (40% WF + 60%MMF), B5 (20% WF +80%MMF), B6 (0% WF +100%MMF).
确定
还剩23页未读,是否继续阅读?

产品配置单


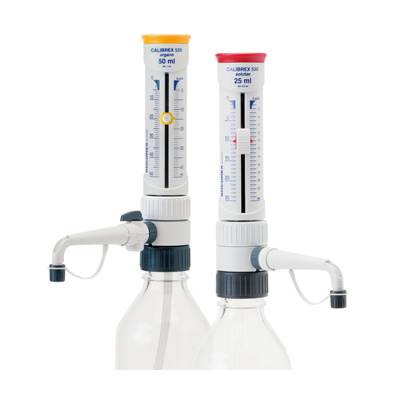
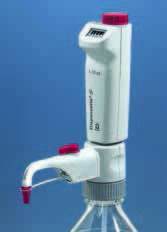
中国格哈特为您提供《加入多种小米的饼干的蛋白质、脂肪、纤维含量检测》,该方案主要用于饼干中营养成分检测,参考标准--,《加入多种小米的饼干的蛋白质、脂肪、纤维含量检测》用到的仪器有格哈特全自动超级总脂肪测定系统HT6+SOX416、格哈特凯氏消化系统KT8S、格哈特维克松废气实验室废物处理系统涤气VS、格哈特全自动型纤维分析仪FT12、格哈特带自动进样器凯氏定氮仪VAP500C、德国加液器MM


相关方案
更多
该厂商其他方案
更多