


使用Gerhardt格哈特公司Vapodest维普得 全自动凯氏定氮仪测量普通芦苇和玉米青贮生物质燃料中总凯氮含量。
方案详情

使用Gerhardt格哈特公司Vapodest维普得 全自动凯氏定氮仪测量普通芦苇和玉米青贮生物质燃料中总凯氮含量。MDPIenergies 2 of 26Energies 2023, 16,695 Energies 2023, 16, 695. Received: 29 November 2022 Revised: 22 December 2022 Accepted: 28 December 2022 Published: 6 January 2023 Copyright: C 2023 by the authors. Li-censee MDPI, Basel, Switzerland.This article is an open access articledistributed under the terms and con-ditions of the Creative Commons At-tribution (CC BY) license (https://cre-ativecommons.org/licenses/by/4.0/). 1Faculty of Civil Engineering and Environmental Sciences, Bialystok University of Technology, Wiejska 45A Str.,15-351 Bialystok,Poland 2Partners in the Greifswald Mire Centre, Succow Foundation and Greifswald University, Ellernholzstrase 1,17489 Greifswald, Germany 3Faculty of Production Engineering, University of Life Sciences in Lublin, Gleboka 28 Str.,20-950 Lublin, Poland * Correspondence: a.wysocka@pb.edu.pl Abstract: The key factor in sustainable biogas production is a feedstock whose production has noadverse impact on the environment. Since maize cultivation harms the environment, biogas plantoperators seek a more sustainable feedstock. Common reed is an invasive species mown as part ofwetland conservation measures, or it can be harvested from paludiculture. This study aimed to in-vestigate wet co-digestion of maize silage with 10%, 30%, and 50% content of common reed silageusing the biochemical methane potential (BMP) test. In addition, the potential energy generated andavoided greenhouse gas (GHG) emissions were calculated. The substitution of maize silage with10%, 30%, and 50% content of reed silage reduced the methane (CH4) yield by 13%, 28%, and 35%,respectively. A disadvantage of reed silage addition was increased ammonia (NHs) and hydrogensulfide (HzS) concentrations in biogas.Although substituting maize silage with reed silage decreasesthe CH4 yield, the co-digestion of maize and reed biomass from conservation or paludiculture maypositively affect environmental aspects of energy generation. The substitution of maize with reed inbiogas plants decreases the area used for maize cultivation and reduces GHG emissions. Keywords: biogas; specific methane yield; paludiculture; electricity; heat; greenhouse gasesemissions 1. Introduction Biogas has a strong potential for transforming the global energy system into a moresustainable one. In the last 20 years, biogas production has increased globally from ~11billion m3 to 62.3 billion m3, with an annual growth rate of 9%. Europe is the leader inbiogas production, with 30.6 billion m3 of biogas generated in 2019 [1]. In Europe, biogasis produced mainly from energy crops, crop residues, sequential crops (8 Mtoe), and ani-mal manure (6 Mtoe). Two other main groups of feedstocks are municipal solid waste (3Mtoe) and municipal wastewater (1 Mtoe) [2]. Feedstock is a critical factor in the produc-tivity of biogas plants. Sustainable biogas production has been shifting from using energycrops to waste and agricultural residues. The high prices of energy crops force biogasplant operators to seek cheap and more sustainable waste that could, at least partially,replace maize silage (MS) without lowering the profitability of biogas production. At thesame time, providers of green energies are currently intensively searching for biogasplants that could change their substrates from feeding maize to biomass sourced frompaludiculture, seeking to deliver methane (CH4) into the grid in order to be able to sellpaludi-gas" to end consumers [3]. However, as the German example shows, MS still prevails as a feedstock in agricultural biogas plants, constituting almost 70% of all energycrops [4]. Globally, maize is the leading staple cereal, with its annual production exceeding 1billion metric tons [5], with the United States, China, Brazil, and the European Union asthe leading producers [6]. The global maize area for dry grain increased from 105 millionha in 1961 to over 200 million ha in 2020, while the green maize area expanded from 760thousand ha in 1961 to over 1 million ha in 2020. The intensification of crop productionalso increased maize yield in the same period [6]. Maize is an important food crop, espe-cially in sub-Saharan Africa, Asia, as well as several countries in Latin America, where itcontributes over 20% of total food calories [7]. It is also a versatile multi-purpose crop usednot only for human food production but also as a livestock feed crop [8] and, recently, forthe production of biofuels, chemical compounds, pseudo-plastics, and other materials [5].Maize grain is used as one of the main sources of bioethanol, an alcohol made from thefermentation of carbohydrates present in starch crops. Globally, the top ethanol producersare the United States and Brazil. In the US, maize is the primary feedstock, while in Brazil,biofuel is produced from sugarcane [9]. The production of ethanol from maize generatessignificant quantities of by-products such as distillers' dried grains with solubles, corngluten feed, and corn gluten meal, which are used in livestock feed [10]. Maize is also theleading energy crop used as a feedstock for biogas production. The increase in the biogassector resulted in the expansion of maize monocultures in large areas. In Germany, theshare of maize in the total arable land increased from 5% in 2005 to 12% in 2013, strength-ening the competition for land use in some regions and negatively impacting the land-scape [11-13]. Another disadvantage of the production of biogas from energy crops, espe-cially MS, is the competition with food production. High-yield agricultural production is a consequence of the greater use of syntheticagrochemicals such as fertilizers and pesticides, irrigation, and mechanization in someregions. These technological advancements have many negative impacts on the environ-ment. Life cycle assessment (LCA) of maize production revealed that fertilization has themost detrimental impact on the ecosystem, followed by harvest [14]. Large-area maizemonocultures, cultivated without proper crop rotation and phytomelioration treatments,contribute to increased wind and water erosion. Heavy equipment is one of the main rea-sons for severe soil compaction, while intensive fertilization and the use of plant protec-tion products result in the progressive acidification of soils and the contamination ofground and surface waters. The environmental risk associated with cultivation increaseson light and permeable soils [15]. The increasing area of maize cultivated both for foodand energy has a significant negative impact on the landscape, leading to its "maizifica-tion" [16] and decreasing biodiversity, resulting in reduced natural and aesthetic valuesof rural areas [17,18]. Maize cultivation harms the environment due to greenhouse gas (GHG) emissionsfrom cultivation, land use change, the loss of biodiversity, the risk of erosion, nitrous oxide(N2O) emissions, eutrophication, and, in some regions, a high irrigation demand [19-22].Particularly alarming is the cultivation of maize for biogas production, frequently prac-ticed on drained peatlands or organic soils. In such cases, due to drainage and soil culti-vation, the amounts of GHG released are many times higher than those ultimately miti-gated by biogas production. If site-specific emissions of biomass fuels produced on peat-lands are considered, the total emissions exceed those of fossil fuels by a multiple [23]. Fur-thermore, the increasing area of maize cultivated for energy purposes lowers the public ac-ceptance of biogas production [11]. Therefore, the anaerobic digestion (AD) of waste andby-products is now considered a sustainable pathway for biogas production [13,24,25]. Both economic and environmental impacts force biogas production to turn towardsthe pathway of transition to more sustainable feedstocks. Using a single substrate maycreate an imbalance in the process; however, such a problem does not occur in the case ofmono-digestion of feedstocks such as maize silage. Since maize should be utilized for foodproduction, its substitution in biogas production is challenging. Numerous studies comparing the mono- and co-digestion of various feedstocks revealed an increase in CH4yield through co-digestion [26-32], which increased biogas yield due to the optimum C:Nratio, balanced pH, and reduced hydraulic retention time [33]. The co-digestion of poultrymanure with alkali-treated corn stover increases the production of biogas by ensuring nu-trient balance [34]. Adding grass clippings at a 10% rate to food waste enhances the buff-ering capacity in AD [35]. According to a study by Velasquez Pinas et al. [36], the optimumproportions of MS and grass silage for co-digestion systems with cattle manure are in theranges of 22-65% and 18-54%, respectively. The substitution of MS with corn stover in co-digestion with pretreated poultry manure has no negative impact on the CH4 yield [37].Kalamars and Kotsopoulos [38] studied MS substitution with agricultural materials suchas sorghum silage, cardoon silage, bedding straw from cattle farms, and naturally or me-chanically dried, thermally or thermo-chemically pretreated milk thistle. These substi-tutes were co-digested with cattle manure. The results revealed that MS could be success-fully substituted with most of the proposed materials. The best results were obtained forcardoon silage and thermo-chemically pretreated, naturally sun-dried milk thistle. How-ever, the co-digestion of maize residues with poultry blood revealed inhibitory problemsin semi-continuous operation due to the high content of volatile fatty acids (VFA) whenthe reactor operated at a low organic load rate [39], while the substitution of MS with 20%of either ultrasonicated or untreated microalgae led to significantly lower biogas yields,even though the decreased viscosity had a beneficial effect on the process and the econ-omy of a biogas plant [40]. According to Agostini et al. [20,41], replacing MS with sorghum as a co-substrate inbiogas plants based on manure and 30% of energy crops provides GHG savings and gen-erates economic profits. In contrast, AD emissions of maize or sorghum alone are compa-rable to those of the Italian electricity mix and generate financial losses. The environmen-tal assessment of wild plant mixtures as AD feedstock and comparisons of their perfor-mance with MS revealed that MS is a more profitable feedstock for biogas production.Additionally, wild plant mixtures require a substantially larger area, which can lead toadditional GHG emissions. However, increased carbon sequestration in such a system, inaddition to sustainable management of marginal land, can be the advantage of wild plantmixtures [42]. Studies by De Vries et al. [43] comparing the mono- and co-digestion ofswine manure with MS, beet tails, wheat yeast concentrate, and grass residues from vergesrevealed that the co-digestion of MS with grass residues appeared to be the most environ-mentally sustainable option. Another source of feedstock is biomass from conservation measures on wetlands andpaludiculture such as Phragmites australis, Typha spp., and sedges [44]. Biomass harvestedfrom these habitats varies depending on the species composition, habitat fertility, and har-vest time. Wetland biomass yield ranges from3 tpm ha-1 (Phragmitetum australis, mossy var-iants of Caricetum elatae) to 16 tpm ha-1 (Phragmitetum australis, Phalaridetum arundinacea)[45-51]. Biomass harvested from paludiculture ranges from 8 tpm ha-1 to 20 tpM ha-1 [52].The advantage of biomass from paludiculture is its huge, almost infinite, potential. Ulti-mately, all currently drained peatlands [53,54] must be rewetted to reduce the GHG emis-sions from the land use sector and to comply with the Paris Climate Agreement of 2015[55]. Some of them, after rewetting, will be given to natural succession, while others maybe sustainably used under wet conditions (paludiculture). Either material (production ofinsulation materials, construction panels, substrates) or cascade use of biomass from palu-diculture is preferable to energy recovery. Although it can be assumed that, due to thelarge number of degraded peatlands, which have to be rewetted, at least in Central Europe[56], the area potential for the production of biomass for biogas or for maize substitutionshould be sufficient [57]. Common reed is a highly competitive invasive plant capable of rapid growth andspread, often threatening the biodiversity of natural and rewetted wetlands. Reed formsdense monospecific stands and reduces flood retention by decreasing microtopography[58,59]. Reed ecosystems may be characterized by remarkably high biomass, depending on the local conditions and genetic differences [46]. In natural wetlands, invasive reedstands are managed mainly by mowing, generating large amounts of biomass waste thatis difficult to utilize [60]. At present, there are limited management options for reed bio-mass harvested from natural stands, as part of conservation measures, or from paludicul-ture. Common reed is mainly used for raw material extraction or energy generation, usu-ally through direct combustion [50,61]. However, reed biomass is characterized by a mois-ture conent that is too high for direct combustion; hence, it needs to be dried before use,generating demand for external energy. Therefore, biogas production seems to be an in-teresting option for energy generation from common reed; however, the CH4 potential hasto be considered since "green" energy should be sustainable, feasible, and profitable. The existing literature data reveals that wetland biomass’s specific methane yield(SMY) is relatively low and depends on the species and the harvest time [62,63].Moststudies show that the CH4 potential of various wetland species or communities rangesfrom 102 NL CH4 kgvs-1 to 275 NL CH4 kgvs-1[49,63-65]. Miiller et al. [66] investigated theAD of Juncus effuses, which produced, on average, 399.02 NL kgvs-1 of biogas with 60.7%of CH4. This yield is only 59% of the biogas potential of MS. Results of SMY determinationsfor common reed are contradictory. According to Roj-Rojewski et al. [63], depending onthe harvest time, SMY ranged from 102 NL kgvs- to 148 NL kgvs-1. Similar findings werereported by Baute et al. [67], who obtained a CH4 yield of 172.4 NL kgvs-l and 107.6NLkgvs-l for common reeds harvested in July and October, respectively. Contrary to thesefindings, Ohlsson et al. [68] showed that SMY for common reed from the Baltic Sea areawas 400 NL kgvs-1. Literature data concerning studies focused on the co-digestion of wet-land plants with other feedstocks is limited. Hartung et al. [52] investigated co-digestionof MS with 10%, 20%,30%, and 40% contents of Typha latifolia or Phalaris arundinacea basedon volatile solids. The results showed that an addition of as little as 10% of Typha latifoliareduced biogas production, whereas an addition of Phalaris arundinacea of up to 30% didnot influence biogas yield. The anaerobic co-digestion of common reed with feces andkitchen waste, with an addition of zeolite, revealed that a 10% addition of clinoptiloliteinhibited the acidification of the digestion liquid and increased the amount of VFA, re-sulting in biogas production of 308 L kgvs-l with an increased CH4 content of up to 65.30%[69]. The co-digestion of the seaweed Laminaria digitata with common reed gave a similarCH4 potential of ~170 L kgvs-1 for mono-digestion, while co-digestion was characterizedby process instability [68]. The aim of this study was to evaluate the suitability of using common reed silage forco-digestion with maize silage in biogas production. The biochemical methane potential(BMP) test was performed at a temperature of 38 ℃ on maize silage (100%), reed silage(100%), and maize silage with 10%, 30%, and 50% additions of reed silage on a freshweight basis. Based on the obtained results, the amount of energy generated in a biogasplant using mono-digestion of maize silage or reed silage and co-digestion of combina-tions of reed and maize silages were calculated as well as the avoided GHG emissions. 2. Materials and Methods 2.1. Substrates and Inoculum The studied common reed (Phragmites australis (Cav.) Trin. ex Steud.) was harvestedfrom a natural wetland in late autumn of 2020. The plant material was cut into 2-4 cmpieces and ensiled without additives. MS was collected from the original feedstock silo ina biogas plant. Digestate from an agricultural biogas plant that treats MS with 10-20%content of food and agricultural waste in mesophilic conditions was used as the inoculum.After collecting, the inoculum was degassed at a temperature of 38℃. 2.2. Experimental Setup The SMY was measured using the batch test. The test involved MS, reed silage (RS),and the mixtures of MS with 10%, 30%, and 50% contents of RS on a fresh weight basis.The BMP test was conducted using eudiometers. Bottles with a total volume of 1 L and aworking volume of 300 mL were incubated in a water bath at 38±1℃. These were filledwith 200 g of inoculum, and substrates were added to achieve an inoculum-to-substrateratio of 2:1 based on volatile solids (VS). Distilled water was added to obtain the reactors’total solids (TS) of 5%. Bottles containing 200 mL of inoculum and water were used as acontrol. They were flushed with nitrogen for 2 min. to remove oxygen. The CH4 yield ofeach substrate was assessed in triplicate using three eudiometers. The volume of the pro-duced biogas was measured by confining liquid displacement, while the portable biogasanalyzer, the DP-28BIO (Nanosens, Wysogotowo, Poland), was used to determine thechemical composition of biogas. The batch test was conducted until the daily CH4 produc-tion was less than 1% of the total cumulative volume of CH4 observed over three consec-utive days. The total cumulative CH4 yield was calculated at the end of the BMP test. Themodified Gompertz model [70] was used to determine the kinetics of CH4 production: where: G(t)-cumulative methane production at a specific time t(mL) Go-methane production potential (mL) Rmx-maximum daily methane production rate (mL day-1) 入-duration of lag phase (minimum time to produce methane) (days) t-cumulative time for methane production (days) e-mathematical constant (2.71828) All the gas volumes are reported for standard conditions (0°℃ and 1.013 bar) per kgof vs. added (NL CH4 kgvs-1). The times (given in days) when 50% (T50) and 95% (T95) ofthe possible CH4 were reached were determined based on plotted curves. 2.3. Chemical Analyses Before starting the batch test, total solids (TS), volatile solids (VS), total Kjeldahl ni-trogen (TKN) content, total phosphorus (TP) content, potassium (K) content, and total or-ganic carbon (TOC) content in the inoculum, MS, and RS were analyzed. TS was deter-mined by drying the sample at 105 ℃ until the constant weight could be measured. Inaccordance with standard methods, vs. content was determined after dried material wasincinerated at 550℃ for 5 h in a muffle furnace [71]. TKN was determined for fresh sam-Vapodest 50 s analyzer (Gerhardt, Konigswinter, Germany) using the Kjeldahlmethod. The oven-dried samples were ground and used for further analyses. After nitricacid/hydrogen peroxide microwave digestion in the ETHOS One (Milestone s.r.l., Milan,Italy), the content of P was determined using ammonium metavanadate method with theUV-1800 spectrophotometer (Shimadzu, Kyoto, Japan) and the content of K was analyzedusing flame photometry (BWB Technology, Newbury, UK). TOC content was determinedin the TOC-L analyzer with the SSM-5000A Solid Sample Combustion Unit (Shimadzu,Kyoto, Japan). The analyses were performed in triplicate, and the results were given on adry-weight basis. 2.4. Calculations and Statistical Analyses The SMY values determined during laboratory tests were used to calculate the po-tential energy generated from biogas in a biogas plant fed with MS and RS. The biogaswas converted to electricity and heat in the combined heat and power (CHP) unit. TheCHP unit's electrical and thermal conversion efficiency was assumed to be 38% and 43%, respectively. The thermal energy consumption in the biogas plant was assumed to be 30%,and the electric power use was considered to be 9% of the produced energy. Energy production per 1 hectare for maize and reed was calculated based on the BMPresults and crop yields. Maize yields were taken from [72], and reed yield was measuredduring biomass harvest and was equal to 8.59 tpm ha-1. The amount of energy obtained from the reed as a result of its direct combustion wascalculated based on its net calorific value (NCV) expressed in GJ tom and the measuredyield. The calorific value was measured using the LECO AC600 (St. Joseph, Michigan,USA). To calculate the calorific value at operating moisture (optimal for biomass combus-tion), the following formula was used [73]: where: Qnet, OM-the net calorific value as received (at operating moisture) (MJkg-) Qnet, DM-the net calorific value in dry matter (MJkg-) OM-the operating moisture content (w-%, wet basis) 0.02443-the correction factor of the enthalpy of vaporization for water at 25 ℃ (MJkg-l per 1% of moisture) The reduction of CO2 emissions was calculated based on the electricity and heat pro-duction in the biogas plant fed with MS and RS. The emission factors for coal wereadopted from [74]. In this study, the emission factor for maize cultivation, i.e., 3.38 t CO2ha-l, was taken from Hryniewicz and Grzybek [75], who determined COz emissions frommaize cultivation for Polish conditions. The results of the chemical analyses of the substrate and of the BMP test results wereprocessed using Statistica 13.3 (TIBCO Software Inc., Palo Alto, CA, USA). One-way var-iance analysis (ANOVA; single factor) was used to find the significant differences amongthe chemical compositions of inoculum, MS, and RS, as well as SMY and the lag time offive tested mono- and co-digested substrates. When a significant F-test was obtained, mul-tiple mean comparisons were carried out with Tukey’s Honest Significant Difference(HSD) test. The normality was checked with the Shapiro-Wilk test, and the homogeneityof variance was evaluated with the Levene test. When the data failed the Levene test, theWelch test and Tukey's HSD test were used to assess the significant differences amongthe values of each parameter. A significance level of 95% was used throughout all thestatistical analyses 3. Results 3.1. Feedstock and Inoculum Characteristics RS had significantly (p<0.05) higher TS compared to MS, while the difference in vs.was less pronounced even though it was significant (p <0.05). Both silages were charac-terized by similar TKN values. Other chemical parameters differed significantly (p<0.05)in both silages and were higher in the case of MS. The C:N ratio in both silages was similar(Table 1). The inoculum was characterized by significantly (p<0.05) lower TS and vs. val-ues and much higher TKN, TP, and K contents. Table 1. Chemical composition of feedstock and inoculum. Parameter Maize Silage Reed Silage Inoculum Total solids (TS),% 31.66±0.32a* 62.85±0.99b 5.28±0.03c Volatile solids (VS),%TS 95.51±0.53a 91.16±0.27b 75.62±0.02c Total Kjeldahl Nitrogen (TKN), gkgpM-1 13.88±0.16a 14.60±0.53a 94.50±0.18b Total phosphorus (TP),g kgDM-1 1.98±0.02a 1.26±0.07b 8.29±0.18c Total potassium (K), gkgDM-1 9.56±0.20a 2.68±0.16b 62.59±1.15c Total organic carbon (TOC) gkgDM-1 396.04±5.45 a 379.11±7.81b368.03±5.61b C:N 29:1 26:1 4:1 * Lowercase letters-statistical differences at p<0.05 among silages and inoculum. The initial TS was similar in all the reactors since the experiment assumption was tostart the BMP test with a TS content of~5%. The lowest final TS was observed in the reactorcontaining MS (Figure 1). This indicates that MS has the best digestibility; however, thefinal TS content in the digester containing RS was slightly higher. The overall differencesbetween the initial and final TS values were around 1%. More pronounced differenceswere observed in the case of vs. content. The initial vs. content in all the reactors wassimilar in accordance with the experimental setup. MS was characterized by the lowestfinal VS, while the highest vs. content was found in the reactor containing RS. The in-creased amounts of RS in co-digested mixtures slightly raised the contents of the final VS. Figure 1. Variations of organics content for co-digestion of maize and reed silage under differentcombinations: (a) TS and (b) VS. MS-maize silage, 10 RS-maize silage with 10% content of reedsilage, 30 RS-maize silage with 30% content of reed silage, 50 RS-maize silage with 50% contentof reed silage and RS-reed silage. 3.2. Methane Yield from Mono- and Co-Digestion of Maize and Reed Silages The biodegradability of MS was much faster than that of RS. Almost complete bio-degradation of MS took only 30 days, while CH4 production from RS mono-digestionstopped after 48 days. Partial substitution of MS with RS influenced CH4 yield from co-digestion. The addition of RS in the amounts of 10%, 30%, and 50% on a fresh matter basisdecreased the CH4 yield by 13%, 28%, and 35%, respectively (Table 2). The CH4 yield fromRS mono-digestion was lower by 44% compared to the CH4 yield from MS. Table 2. Methane production and lag time of mono- and co-digestion of maize and reed silages. Feedstock Methane Production Maximum Daily Me- Lag Time NL kgvs-1 NL kgvs-1 Days MS 241.42±1.97 a* 27.26±1.09a 1.36±0.06a 10 RS 208.92±4.91b 19.69±2.02b 1.03±0.06b 30 RS 173.87±2.26c 14.39±0.72c 0.99±0.15b 50 RS 155.18±4.59d 11.24±0.43d 0.38±0.07c RS 135.22±3.42e 5.54±0.40e 2.23±0.10d * Lowercase letters-statistical differences at p < 0.05 among co-digested combinations and mono-digested silages. MS-maize silage, 10 RS-maize silage with 10% content of reed silage, 30 RS-maize silage with 30% content of reed silage, 50 RS-maize silage with 50% content of reed silage,and RS-reed silage. RS was characterized by the lowest CH4 production rate with a different distributioncompared to MS and all three combinations. The characteristics of daily CH4 productionwere similar for MS mono-digestion and co-digestion of MS with RS in all combinations(Figure 2). The daily CH4 yield was high for the first 10 days and then decreased signifi-cantly and stabilized at a low value. For MS and 10 RS, two peaks of CH4 production weredetected on days 2 and 7, while for 30 RS and 50 RS, only one peak was observed. For 30RS, the highest daily CH4 production occurred on day 6, which was similar to the secondpeak in MS mono-digestion and in the 10 RS combination. For 50 RS, the most significantincrease in daily CH4 production was observed on day 3, which is similar to the first peakdetected for MS and the 10 RS combination. For RS, a sharp increase of CH4 yield was seenon day 3 followed by a plateau and a slight decrease to very low values after 18 days ofthe experiment. The increasing addition of RS in all combinations lowered the daily CH4production, which was very pronounced in days of maximum daily production. Figure 2. Daily methane production from mono- and co-digestion of maize and reed silages. MS-maize silage, 10 RS-maize silage with 10% content of reed silage, 30 RS-maize silage with 30%content of reed silage, 50 RS-maize silage with 50% content of reed silage, and RS-reed silage.Standard errors are shown as vertical bars. As expected, the lower SMY of RS reduced the cumulative CH4 production with in-creasing substitution of MS with RS. For 10%, 30%, and 50% of RS contents in co-digestedfeedstock, the cumulative CH4 yield decreased by 28%, 47%, and 57%, respectively. Theaddition of RS influenced the CH4 yield and affected the lag phase. In contrast, the RS lag phase lasted more than 2 days and was significantly (p<0.05) longer than the lag time forMS, substituting the latter with an increasing share of RS shortened this period, and for50 RS, biogas production started almost immediately. The addition of RS, however, only partially affected the indicators that indicate thetime after which the analyzed combinations and mono-digested feedstocks produced 50%(T50) and 95%(T95) of potential CH4. T50 did not differ between all the combinations andMS and ranged from 8 days for MS and 10 RS to 11 days for 50 RS (Figure 3). The additionof RS had a more pronounced effect on T95, which was similar for MS and 10 RS andequaled 17 days and 19 days, respectively. The higher RS share resulted in T95 equal to23 days for 30 RS and 29 days for 50 RS. As expected, the T50 and T95 values for RS werethe longest and equaled 17 days and 46 days, respectively. In this case, a low daily CH4production was significantly extended, mainly the time needed to reach 95% of the poten-tial CH4 yield. 250 Figure 3. Cumulative methane production from mono- and co-digestion of maize and reed silages.MS-maize silage, 10 RS-maize silage with 10% content of reed silage, 30 RS-maize silage with30% content of reed silage, 50 RS-maize silage with 50% content of reed silage,and RS-reed silage.The green squares and yellow diamonds mean T50 and T95, respectively. Standard errors are shownas vertical bars. 3.3. Concentration of Hydrogen Sulphide and Ammonia in Biogas from Mono- and Co-Digestionof Maize and Reed Silages The addition of RS also influenced the hydrogen sulfide (HzS) content in the biogasproduced from analyzed combinations compared to mono-digestion of MS. While in thecase of MS and the 10 RS combination, the content of this compound was almost identicalthroughout the experiment, an increased share of RS in the co-digestion experimentscaused a nearly two-fold increase in the concentration of HS in biogas (Figure 4a). A sim-ilar effect produced by increasing MS substitution with RS was observed for ammonia(NHs) concentrations in biogas (Figure 4b). High HS and NHs concentrations were ob-served in the biogas produced from RS mono-digestion; hence, adding this feedstock in-creased the contents of the analyzed inhibitors in all the studied combinations. Figure 4. The concentration of (a) hydrogen sulfide (H2S) and (b) ammonia (NH) in biogas pro-duced from mono- and co-digestion of maize and reed silages. MS-maize silage, 10 RS-maizesilage with 10% content of reed silage, 30 RS-maize silage with 30% content of reed silage, 50 RS-maize silage with 50% content of reed silage, and RS-reed silage. Standard errors are shown asvertical bars (where absent, bars fall within symbols). 3.4. Energy Balance and GHG Emissions The differences in the CH4 yield produced from mono-digestion of MS and RS andco-digestion of the three combinations influenced the energy generation (expressed as perton DM) from biogas produced in a theoretical biogas plant fed with the studied feed-stocks. A biogas plant fed with RS only would generate the lowest amount of energy. Themost efficient would be a biogas plant based on the MS mono-digestion. The substitutionof MS with 10%, 30%, and 50% contents of RS would decrease the generated energy by14%, 28%, and 37%, respectively (Table 3). Table 3. Electricity and heat generation from biogas produced by mono- and co-digestion of maizeand reed silages. Feedstock Electricity Generation Heat Generation kWh tDM-1 kWh tFM-1 GJ tDM-1 GJ tFM-1 MS 731 231 2.29 0.73 10 RS 630 219 1.97 0.69 30 RS 519 213 1.63 0.67 50 RS 459 217 1.44 0.68 RS 391 246 1.22 0.77 MS-maize silage, 10 RS-maize silage with 10% content of reed silage, 30 RS-maize silage with30% content of reed silage, 50 RS-maize silage with 50% content of reed silage, and RS-reed silage. An analysis of the data on electricity and heat generation presented in Table 3 andthe share of the energy generated by MS and RS in every co-digested combination of feed-stock reveals that the proportion of energy generated from RS in the total energy producedfrom mono-digestion of MS was 9%,21%, and 31% for 10 RS, 30 RS, and 50 RS, respec-tively (Figure 5). Figure 5. Electricity (a) and heat (b) produced by MS and RS in the analyzed combinations. MS-maize silage, 10 RS-maize silage with 10% content of reed silage, 30 RS-maize silage with 30%content of reed silage, 50 RS-maize silage with 50% content of reed silage, and RS-reed silage. Reed is a promising biofuel used for energy generation through incineration. Thebasic parameters influencing the efficiency of reed incineration in biomass furnaces arepresented in Table 4. Table 4. Combustion heat and calorific values of reed related to the dry weight, fresh weight, andmoisture required for the biomass furnace. Combustion Heat Calorific Value Calorific Value * Calorific Value ** Ash HHV LHV LHV LHV GJ tDM-1 GJ tDM-1 GJ tFM-1 GJ tom-1 % 18.250±0.079 16.903±0.079 9.716±0.05 13.034±0.050 7.38±0.08 * calorific value of reed with moisture of 37.15%.** calorific value of reed with the moisture of 20%(average biomass moisture required for a furnace burning biomass). The calorific value relative to the area equaled 145.36 GJ ha-l and was estimated basedon reed yield from natural stands expressed in DM. If the biomass moisture required forthe proper operation of the furnace is included in the calculations, the calorific value perhectare decreases to 140.11 GJ ha-1. In addition, if the furnace efficiency of 90% is includedin the calculations, the calorific value per hectare decreases to 126.10 GJ ha-1. Heat generation from reed incineration and from the biogas was compared based onthe reed biomass needed for biogas production in all three co-digestion combinations. Acomparison of the incineration efficiency and the heat generation from the biogas pro-duced from the same amount of reed reveals that direct incineration is a much more effi-cient method for heat generation than biogas (Table 5). Table 5. Heat generation from reed direct incineration and biogas produced from reed. Share of Reed Silage in Co- Digested Combinations of Reed and Maize Silages Electric Power Installed in a Biogas Plant (kWel) 50 100 200 500 1000 B BP B BP B BP B BP B BP GJ 1677 23 3354 45 6709 90 16.772 226 33,544 452 5174 172 10,348 345 20,695 689 51,738 1723 103,476 3446 8464 415 16,928 831 33,857 1662 84,641 4154 169,283 8308 30% 50% B-the burning of biomass, BP-heat production in a biogas plant. Although the substitution of MS with RS reduces the CH4 yield, the co-digestion ofenergy crops with organic feedstock from conservation measures or with reed biomassfrom paludiculture may positively affect other environmental aspects of energy genera-tion. These include land use, since substituting MS with 10% of RS reduces the area ofmaize crop by 5; MS substitution with 30% of RS reduces the area of this energy crop by24%; while the substitution of half of the maize feedstock with RS decreases the maizecrop area by 47% (Table 6). Table 6. The area required for the cultivation of maize and reed depending on the studied maizeand reed silage combinations and the electric power installed in the biogas plant. Feedstock Electric Power Installed in a Biogas Plant (kWel) 50 100 200 500 1000 Area Required for Maize and Reed Cultivation (ha) Maize Reed Maize Reed1 Maize Reed Maize Reed 1Maize Reed MS 39 79 157 394 787 10 RS 37 13 75 27 150 53 374 133 749 267 30 RS 30 41 60 82 120 164 299 411 599 822 50 RS 21 67 42 135 84 269 210 673 420 1345 MS-maize silage, 10 RS-maize silage with 10% content of reed silage, 30 RS-maize silage with30% content of reed silage, 50 RS-maize silage with 50% content of reed silage,and RS-reed silage. At the same time, the harvested reed area increases significantly with increasing sub-stitution of MS with the biomass in question. For a biogas plant with an electrical powerof 100 kWel, an increase of RS from 10% to 50% expands the harvested area from 20 ha to140 ha (Figure 6). Figure 6. The area required for maize and reed cultivation based on the example of a biogas plantwith an installed electrical power of 100 kWel. MS-maize silage, 10 RS-maize silage with 10%content of reed silage, 30 RS-maize silage with 30% content of reed silage, 50 RS-maize silagewith 50% content of reed silage. The substitution of MS with RS reduces GHG emissions related to maize cultivation.The calculations of GHG emissions, including the emission factor for maize cultivation(3.38 t CO2 ha-1), maize yield, and the area of maize needed for the assumed energy gen-eration, revealed that GHG emissions related to maize cultivation equaled 2.63 t CO2 eq.kWer-1. This means that GHG emissions from the cultivation of maize as a feedstock for abiogas plant with a power of 50 kWei are equal to 131.66 t COz eq., while in the case of abiogas plant with a capacity of 1000 kWel, these emissions increase to 2633.26 t COz eq.This could be avoided by substituting maize with reed as a feedstock. However, the com-plete substitution of maize with the reed in biogas production is not viable due to the verylow SMY of the reed, which is why only partial substitution should be considered. In thiscase, the electrical power installed in the biogas plant is significant. In large installations,the amount of the emitted GHG will be lower by over 1200 t (Table 7). Table 7. COz eq. emissions avoided by reducing the area for maize cultivation. Electric Power Installed in a Biogas Plant (kWei) Feedstock 50 100 200 500 1000 t CO2 eq. 10 RS 6.45 12.89 25.78 64.46 128.92 30 RS 31.52 63.04 126.07 315.19 630.37 50 RS 61.45 122.90 245.80 614.49 1228.98 10 RS-maize silage with 10% content of reed silage, 30 RS-maize silage with 30% content of reedsilage, and 50 RS-maize silage with 50% content of reed silage. RS co-digestion enables the avoidance of GHG emissions from energy generationfrom fossil fuels. RS used as feedstock in biogas production would reduce the area formaize cultivation as an energy crop and the GHG emissions from coal burning. A higherCOz reduction is made possible due to electricity generated from the biogas producedfrom the co-digestion of RS and MS (Table 8). Table 8. COzemissions avoided by using reed as a co-substrate in a biogas plant. Share of Reed Silage in Co-Digested Electric Power Installed in a Biogas Plant (kWel) 50 100 200 500 1000 Combinations of Reed and Maize Si- E H E H E H E H E H t CO2 10% 27.8 11.7 55.6 23.4 111.3 46.7 278.2 116.8 556.4 233.5 30% 83.5 35.0 166.9 70.1 333.9 140.1 1391.0 350.3 1669.3 700.6 50% 139.1 58.4 278.2 116.8 556.4 233.5 1391.0 583.8 2782.111167.7 E-electricity production, H-heat production. 4. Discussion 4.1. Feedstock Characteristics MS is one of the primary energy crops used in biogas plants. Its cultivation methodand ensilage process are well-known and commonly used in agricultural practices. How-ever, the soil and weather conditions, fertilization, harvest date, maturity, and the varietyof maize may influence the chemical composition of the feedstock in question [76-81]. TheTS of maize depends on the variety and the maturity during harvest. In general, the TScontent in milk ripeness is lower compared to wax ripeness and, depending on the variety,may range from 23.32% to 88.43% [77]. However, Seppala et al. [82] reported a TS of maizeas low as 16%. The results of this study agree with the data provided by Hartung et al.[52] as well as the mean value for the milk ripeness stage reported by Gao et al. [77]. Thevs. content obtained in this study is similar to that reported by Hartung et al. [52] andSeppala et al. [82]. The N, P, and K contents in maize vary between the plant parts anddepend on the maturity and fertilization. The N content ranges from 3.8 g kg-1 in stems inthe tasseling stage to 12.1 g kg-1 in leaves in the 7-8th leaf stage and in the milk-doughstage, depending on fertilization [79]. Skowronska and Filipek [83] also reported a widerange of N concentrations in the different maize parts, from 3.08 g kg-1 in cobs to 15.96 gkg- in grain. Seppala et al. [82] and Zhao et al. [84] reported a higher N content (~15 gkg-) in the whole plant. The result obtained in this study is above the range given byNenova et al. [79], within the range reported by Skowronska and Filipek [83], and lowerthan the data given by Seppala et al. [82] or Zhao et al. [84]. The P content obtained in thisstudy remains in the range provided by Nenova et al. [79], who reported relatively narrowlimits of TP, i.e., from 1.5 g kg-on average during the milk-dough stage to 4.9 gkg-during the 7-8th leaf growth stage. A more comprehensive range was given by Skow-ronska and Filipek [83], who observed a K content ranging from 0.4 g kg-1 in roots andcobs to 6.2 g kg-1 in grains. The K content of dry biomass of maize varied the most instudies by Nenova et al. [79], i.e., from 7 g kg- in the stems during the milk-dough stageto 54 g kg- during the 7-8th leaf growth stage. The result obtained in this study is closeto the lower limit of the K content reported by Nenova et al. [79]. The chemical composition of reed biomass is influenced by biotopes [85], geograph-ical location [86], climatic and weather conditions,and harvest time [63,87]. The TS contentin RS (62.85±0.99%) is much higher than the results reported in the previous study. TheTS content of RS prepared from plants harvested in late autumn of 2019 from the samenatural wetland was 44.76± 0.90% [65]. However, Roj-Rojewski et al. [63] reported ahigher TS, ranging from 59.9± 1.6% to 86.1±0.3%, depending on the harvest time, whileOhlsson et al. [68] reported a TS of 68%. The vs. content of RS was similar to the valuesreported in the literature [63,65,68,88]. The TKN content (14.60±0.53 g kg-l) was similarto those reported by Borin et al. [89], Ohlsson et al. [68], and Van Tran et al. [90]; however,much lower values, i.e., in the range from 0.53 g kg-1 to 6.68 gkg-, can be found in theliterature [91,92]. Roj-Rojewski et al. [63] reported high variability in this parameter, rang-ing from 14±2gkg-1 to 36±4gkg-l, depending on the harvest time. The result obtainedin this study is also much lower than the values obtained in our previous study [65]. The TP content in RS found in literature ranged from 0.04 gkg-1to 2.2gkg-[63,68,91-93]. Theresult of this study (1.98±0.02gkg-) remains in the quoted range and is comparable tothe TP reported by Baran et al. [93] and Roj-Rojewski et al. [63] as well as the authors'previous study [65]. The K content (2.68±0.16 gkg-l) remains in the range given in theliterature, i.e., from 0.2 g kg-1 to 10.90 g kg-[91-93], and is similar to the result reportedby López-Gonzalez et al. [92]. However, the K content in the authors' earlier study wasalmost twice as high [65]. The TOC content (379.11±7.81gkg-l)islower than that obtainedin our previous study [65] and similar to the results given by Lopez-Gonzalez et al. [92]and Roj-Rojewski et al. [63]; however, literature reports higher values in a range from443.4g kg-1to 870.5 gkg-1[89-91,93]. The C:N ratio of feedstock is one of the essential parameters indicating effective di-gestion. Kwietniewska and Tys [94] reported an optimal C:N ratio for AD of organic wasteas 20-35. The C:N ratio of MS obtained in this study is 29:1; thus, mono-digestion of MScan be an effective process with a high degradation rate. RS was characterized by a lowerC:N ratio, i.e., 26:1, but this value could still be considered valuable for process efficiency. 4.2. Methane Yield from Mono- and Co-Digestion of Maize and Reed Silages In an extensive literature review, Hermann and Rath [95] reported that the SMY ofmaize feedstock might vary significantly and range from 181 NL kgvs-1 for fresh andchopped maize harvested in the dough stage to 581 NL kgvs-1 for ensiled maize also har-vested in the dough stage. The CH4 yield depends on many factors, such as harvest time,growth stage, maize variety, ensilage, and particle size. Ensiling increases the rate of CH4formation, also increasing the SMY [95]; however, results reported by Kreuger et al. [96]were contradictory since ensiling had no significant effect on the SMY of maize. Herrmannet al. [97] reported that chemical additives and microbiological inoculants increase theaerobic stability of ensiled maize and thus increase the SMY after the exposure of MS toair, compared to maize ensiled without any additives. Although CH4 production maybenefit from a smaller particle size through better silage quality and higher specific sur-face area, resulting in faster digestion through an increase in the feedstock’s availabilityto microorganisms, the hydrolysis of cross-linkages between lignin and other cell wallcompounds is a rate-limiting step which is unlikely to be overcome by a decrease in par-ticle size. The result of this study is in the lower limit of the range of SMY reported byHerrmann and Rath [95]. Acidity is an efficient qualifying parameter of the silage process,and the pH, as a function of TS, is a good indicator of silage quality. The pH of MS (TS-31.66%) was 3.94, indicating a pH below the value of 4.4, which is considered an indicatorof a very good quality of silage [98]. Nevertheless, ensilage had no significant effect on theCH4 yield. The low SMY value may result from the maturity of the harvested biomass andthe weather conditions persisting through the vegetation period. Several studies have investigated biogas production from common reed. The com-mon reed has significant intraspecific variability, including highly different growth rates[99] reflected in biomass production ranging from 3-10 tpM ha-1[45,46,50] in natural habi-tats to 16 tpm ha-1 when harvested from paludiculture [52]. The intraspecific variability isalso reflected in the nutrient uptake efficiency and tissue properties. However, this differ-entiation has less impact on SMY, which did not differ significantly between the four gen-otypes collected from Romania, Italy, the Netherlands, and Denmark. The CH4 yield isalso significantly affected by the harvest time and the part of the plant. The SMY of leavesis markedly higher than that of stems [62]. The SMY obtained for RS in this study is lowerthan that reported by Eller et al. [99] and Lizasoain et al. [88] but similar to the valuesobtained by Roj-Rojewski et al. [63] for reed harvested in three seasons from natural hab-itat and the results reported by Czubaszek et al. [65]. These discrepancies may be due tothe genotype, the weather conditions, the trophic status of the habitat, or the ensiling qual-ity. In this study, the ensiled material was characterized by a high TS, i.e., 62.85%, and apH of 6.68, which indicates a relatively poor ensiling performance. The material was harvested in late autumn, with a very high TS content after a relatively dry summer. Thelack of additives may also have negatively influenced the ensilage. The co-digestion of different feedstocks has two advantages. Firstly, it may optimizethe C:N ratio; secondly, it can help balance the amounts of trace elements, such as cobalt,molybdenum, or nickel, used by the trophic chain in enzyme production, which is im-portant for methanogenesis [100]. Moreover, Chakraborty et al. [35] reported that addinggrass clippings to food waste regulated sudden pH changes and enhanced the productionof value-added biochemicals. However, improper feedstock selection or excessive co-di-gestion may introduce inhibitory compounds, imbalance the C:N ratio, or overload theorganic ratio, suppressing the AD process [101]. A proper selection of the co-substrate andbalance are essential parameters in co-digestion which can improve the CH4 yield and sta-bilize the process to avoid the risk of acidification. A balanced distribution between carbo-hydrates, proteins, and lipids should also be considered in co-substrate selection [29]. Although maize is an excellent feedstock for biogas production with a relatively highSMY and the possibility of ensiling, MS as a feedstock for biogas plants is under socio-economic pressure as a type of biomass that competes with food for cultivation area [40].Therefore, substituting MS with other organic materials in biogas production has beenintensively studied recently. A study on substituting MS co-digested with pig slurry withmicroalgae biomass revealed that adding this type of biomass led to a significantly lowerbiogas yield [40]. The co-digestion of bedding straw with cattle manure was characterizedby a similar CH4 yield as MS while substituting maize with cardoon, or naturally sun-dried milk thistle stalks thermo-chemical pretreated with NaOH gave the highest CH4yield values [38]. Wetland vegetation and paludi-biomass have received attention lately as attractive,sustainable feedstock for co-digestion. Chuanchai and Ramaraj [27] investigated the effectof co-digestion of buffalo grass with buffalo manure at various ratios on biogas produc-tion. Adding meadow grass also enhanced the CH4 yield from the AD of cattle manure[102]. In this study, the co-digestion of maize and reed silages with increasing substitutionof maize with RS decreased the SMY significantly compared to the mono-digestion of MS.Since both feedstocks were characterized by similar C:N ratios, the inhibitory effect of theimbalanced amounts of N and C was not the reason for the decreasing CH4 yield. A muchlower SMY of RS was probably the main reason for the lower CH4 production from co-digestion. These results are in line with studies by Hartung et al. [52] on the co-digestionof Typha latifolia with maize. An addition of 10% of Typha latifolia significantly reduced thespecific biogas yield of MS. However, the substitution of maize with Phalaris arundinaceaof up to 30% did not significantly reduce biogas yield since the specific biogas yield of thisspecies was comparable to that of maize [52]. In turn, Ohlsson et al. [68] reported no effectof reed addition on the SMY of Laminaria digitata. The common reed used in this study was chopped, increasing the area exposed forconversion by microorganisms; however, such pretreatment seems insufficient for en-hancing biogas production. Similar findings have been reported by Pelegrin and Holzem[103]. Thus, the optimization of the pretreatment step in mono- or co-digestion of RS isnecessary to increase the methane yield. There are several methods of biomass pretreat-ment, which can be categorized as physical, chemical, or biological. The simplest methodof pretreatment of lignocellulosic raw materials is milling, which reduces the crystallinityand particle size of the material. Milling pretreatment of raw lignocellulosic materials fol-lowed by solid-state anaerobic digestion increases the kinetics of the AD process [104].Extrusion leads to a significant increase in CH4 production but requires a high energyinput [105]. A significant increase in biogas yield can also be obtained using chemical pre-treatment methods. A study by Shah and Tabassum [106] showed a twofold increase inbiogas production from corn cob with the use of alkaline pretreatment. Amnuaycheewaet al. [107], on the other hand, showed the beneficial effect of organic acids on sugar pro-duction and, thus also, on the production of biogas. However, chemical pretreatmentsmay introduce hazardous substances to the environment and should be used carefully. A more environmentally friendly method of pretreatment is the steam explosion process.Lizasoain et al. [88] observed a 22% increase in the CH4 yield from corn stover after thesteam explosion pretreatment, although inhibitors of biogas production may be formedin this process. Pelegrin and Holzem [103] investigated several pretreatment methodswith the common reed, including shredding, grinding, heating to 190 °C for 1 h, sonicationat 20 kHz for 4 h, soaking in 2% sodium hydroxide for 60 min at 120 ℃, soaking in 2%hydrochloric acid for 60 min at 120C, aeration, and shaking in anaerobic conditions at150 rpm and 35 ℃ for 4 h. The results of this study have revealed a significant increase inbiogas and CH4 yields resulting from pretreatments, apart from the chemical methods.Mechanical shredding performed the best, followed by the thermal method and grinding.All these methods require additional energy, and therefore, the trade-off between me-thane yield and the additional energy demand for biogas production should be carefullyanalyzed to achieve a profitable biogas plant 4.3. Concentration of Hydrogen Sulfide and Ammonia in Biogas from Mono- and Co-Digestionof Maize and Reed Silages The inhibition of the AD process is one of the most important disadvantages of biogasproduction. Inhibitors such as pesticides, antibiotics, or heavy metals may be introducedwith feedstock or generated during one of the stages of the AD process. In addition to CH4and CO2, biogas contains nitrogen (N2), hydrogen (H2), carbon monoxide (CO), oxygen(O2), hydrogen sulfide (HzS), and ammonia (NH3). The last two compounds may have aninhibitory effect on biogas production. Sulfate is a typical component of several types of industrial wastewater [108,109];other feedstocks, such as animal manure, may also contain high amounts of sulfur com-pounds. Thus, the HS concentration in biogas may vary from 2 ppm to 12,000 ppm [110-112]. H2S forms a corrosive condensate with water in biogas, damaging the combined heatand power (CHP) units and pipes; moreover, it is toxic to living organisms. Furthermore,the combustion of biogas containing H2S releases sulfur oxides (SOx) into the atmosphere[113,114], which can harm trees and plants by damaging foliage and decreasing growth,contributing to acid rains and hurting the respiratory system of living organisms. Hence,the H2S content in biogas should be low; however, the threshold value depends on furtherapplications. The highest HzS content (<70,000 ppm) is acceptable in biogas used in micro-turbines, but if biogas is upgraded for the substitution of natural gas, the HzS contentshould not exceed 4-10 ppm [115]. CHP units can operate on biogas with a maximum HzScontent between 100 and 500 ppm [114,116]. As mentioned above, since the H2S concen-tration in biogas may reach as much as 12,000 ppm [110], removal technologies such asabsorption into a liquid (either water or caustic solution), adsorption on a solid (such asiron oxide-based materials, activated carbon or impregnated activated carbon) and bio-logical conversion (by which sulfur compounds are converted into elemental sulfur bysulfide oxidizing microorganisms with the addition of air or oxygen) are used [111]. This study's highest daily concentrations slightly exceeded 500 ppm for biogas pro-duced from 50 RS and 30 RS. The maximum daily HS concentration is much lower thanthat for biogas from mono-digestion of cow manure. However, the value is similar to themono-digestion of cow manure with the addition of waste iron powder to suppress theHzS concentration [117]. The daily HS concentration for biogas from 10 RS is similar tothe values reported for semi-continuous AD of swine manure and corn stover [118] andthe AD of mixed fruit and fruit with vegetables [119]. The results of this study agree withthose provided by Herout et al. [120], who reported a low H2S content in biogas producedfrom liquid beef manure with the addition of MS, grass haylage, and rye grain; however,the addition of MS only did not prevent the increase of H2S up to 1000 ppm at the end ofthe experiment. The mono-digestion of MS produced biogas with an HzS concentrationsimilar to that reported by Hutnan [121]. NHs is another inhibitor produced in the digester by degrading nitrogen-containingcompounds, primarily proteins, urea, and nucleic acids [109,122]. The inhibitory effect is manifested by total cessation of methanogenic activity and indicated by a decrease in CH4production and an increase in the VFA concentration [122]. According to Theuerl et al. [123], the generally accepted threshold value for NH3ranges from 80 ppm to 400 ppm; however, the toxicity limits given in the literature differsignificantly and range from 60 ppm to 14,000 ppm [109,124]. In this study, the maximumdaily NH3 concentration ranged between 106 ppm and 138 ppm and is close to the lowerlimit of the threshold value given by Theuerl et al. [123]. Since NHs inhibition may cause a failure of the AD process, several strategies forcontrolling NHs concentrations are adopted in biogas production, i.e., (i) acclimation ofmicroflora, especially methanogens, to high NHs concentration; (ii) proper control of pH[125]; (iii) dilution of feedstock containing high amounts of nitrogen-rich compounds, oradjustment of the feedstock’s C:N ratio by co-digestion of a feedstock with a high N con-tent with a substrate rich in C;(iv) addition of inert packing materials such as zeolite orclay minerals; (v) optimization of the concentration of trace elements [122]; and (vi) bio-augmentation [124]. 4.4. Energy Balance and GHG Emissions In Poland, in 2018, the electricity consumption per floor area of residence was 27.32kWh m-2, and the consumption of heat generated from coal was equal to 0.77 GJ m-2[126].An analysis of the energy generated in biogas plants based on the studied co-digestioncombinations revealed that depending on the size of the biogas plant, from 146 to 2917residences with an area of 100 m² could be supplied with electricity and from 16 to 324residences with an area of 100 m² could be supplied with heat (Table 9). Table 9. The number of residences with an area of 100 m² supplied with electricity and heat depend-ing on the size of the biogas plant. Electric Power Installed in Electricity Generation Heat Generation kWel Number of residences with an area of 100 m² 50 146 16 100 292 32 200 584 65 500 1459 162 1000 2918 324 The large number of households that can be supplied with energy from the analyzedbiogas plants results from the AD of MS. If the calculations were only based on the shareof RS added to MS, the results would be much lower. Electricity sourced from RS only,co-digested in combinations with MS, can supply from 1 to 729 households, while fromless than 1 to 108 houses can be supplied with heat (Table 10). Table 10. The number of residences supplied with energy generated only from RS used as co-sub-strate depending on the size of a biogas plant. Share of Reed Silage in Co-Digested Electric Power Installed in a Biogas Plant (kWel) 50 100 200 500 1000 Combinations of Reed and Maize Si- E H E H E H F H E H Number of Residences with an Area of 100 m² 10% 1 0 3 1 6 1 15 3 29 6 30% 13 2 26 4 53 9 131 22 263 45 50% 36 5 73 11 146 22 365 54 729 108 E-electricity production, H-heat production. In this study, the calorific value of reed (16.903±0.079 GJ tpm-1) is slightly lower thanthe values reported by Demko et al. [127] and Dahms et al. [128]. However, the calorificvalue per hectare of reed is significantly lower compared to the data from the study byDemko et al. [127] since, in this research, the reed yield used for calculations were basedon values from natural habitats and was thus much lower than that used by Demko et al.[127]. This study result is close to the value for the medium reed yield reported by Dahmset al. [128]. However, direct incineration of reed generates much more heat than CHPunitsin the analyzed biogas plants. Therefore, the number of households supplied with heatfrom reed incineration would be much higher than those supplied from biogas (Table 11).Nevertheless, incineration of reed requires drying the biomass to a moisture level thatwould meet the requirements for biomass furnaces. Table 11. The number of households supplied with heat from the incineration of reed biomass har-vested from the area which should be harvested to supply biogas plants of various electric powerinstalled and operating on different combinations of maize and reed silages. Share of Reed Silage in Co-Digested Combinations Electric Power Installed in a Biogas Plant (kWel) 50 100 200 500 1000 10% 22 44 87 218 436 30% 67 134 269 672 1344 50% 110 220 440 1099 2198 100% 194 388 777 1942 3885 20% of biomass moisture was assumed for calculation. Since the CH4 yield for RS is significantly lower than that for MS, reed biomass shouldonly be considered a co-substrate in a biogas plant. The results of this study have revealedthat reed could replace MS in the amount of only up to 10% of the feedstock. However,substituting MS with RS may decrease the area used for maize cultivation and, simulta-neously, reduce the competition for land and open up a sensible utilization path for thebiomass produced in paludiculture. This can lead to a lowering of the market prices ofmaize. The other advantage is the reduction of GHG emissions from maize cultivationwhich are proven to contribute significantly to the overall GHG emissions from biogasproduction [129]. Additionally, if drained peatlands are rewetted, and reed is cultivatedon them for harvesting biogas substrates or other purposes, this is associated with largereductions in GHG emissions from the peatland site, due to the change to anaerobic con-ditions, minimizing the decomposition of peat. Depending on the site conditions, espe-cially water levels before and after rewetting, GHG emission savings of up to over 20 tCOz eq. per hectare per year can be achieved [130]. The LCA of electricity and heat generation from agricultural residues and MSthrough the AD process revealed that regardless of the feedstock, energy generation frombiogas has a lower impact in at least nine environmental categories [25]. Hijazi et al. [131]concluded their review on the LCA assessment for biogas production in Europe that thefeedstock type is a determining factor for the environmental impact of biogas production.Indeed, the addition of MS to cattle slurry significantly influenced GHG emissions, pho-tochemical oxidants formation, particulate matter formation, land use, and water deple-tion [25]. Agostini et al. [41] concluded that the mono-digestion of energy crops appearedenvironmentally detrimental. A similar finding was revealed by Tonini et al. [132], whoreported that land-use changes in GHG emissions related to energy production from an-nual crops exceed any GHG savings generated from the replacement of fossil fuels. Theresults of this study also revealed that even a low share of MS substitution with reed mightsignificantly decrease GHG emissions. In contrast, the GHG reduction increases with theincreasing size of the biogas plant. 5. Conclusions Due to the rising prices of maize and the decreasing social acceptance of maize as asustainable feedstock, biogas plant operators seek inexpensive feedstocks that could sub-stitute MS. Reed biomass is a lignocellulosic material that is inexpensive, not competingwith food production and, in some cases, also considered a waste that it is challenging toutilize. This study has revealed that the CH4 yield from RS is much lower than that fromMS. Therefore, the share of reed as an MS substitution can reach 10%; otherwise, a signif-icant decrease in the CH4 yield is observed. Both silages are characterized by the properC:N ratio; however, an addition of reed may increase NH3 and HzS concentrations, thusimpairing the AD process or increasing the operating costs. Adding reed as a maize substitution may significantly impact the environmental per-formance of biogas plants since reed does not require additional new land for cultivation.Even if the CH4 yield per hectare or ton of fresh matter is lower for reed than maize, reedcan be competitive due to lower or zero demand for agrochemical input. Reed harvestedin natural habitats or from paludiculture also performs much better in terms of GHG emis-sions. Author Contributions: Conceptualization, R.C., A.W.-C., P.B. and W.W.; methodology, R.C. andA.W.-C.; formal analysis, R.C. and A.W.-C.; investigation, R.C, A.W.-C. and G.Z.; writing-originaldraft preparation, R.C., A.W.-C. and P.B.; writing-review and editing, P.B., W.W. and G.Z.; visu-alization, R.C. and A.W.-C.; project administration, P.B. and W.W; funding acquisition, W.W. Allauthors have read and agreed to the published version of the manuscript. Funding: This research was funded by the Interreg Baltic Sea Region project DESIRE (Developmentof sustainable (adaptive) peatland management by restoration and paludiculture for nutrient reten-tion and other ecosystem services in the Neman River catchment), index number R3071 and projectnumber #R091, implemented in the framework of the Interreg Baltic Sea Region Program, co-fundedby the European Regional Development Fund. Institutional Review Board Statement: Not applicable. Informed Consent Statement: Not applicable. Data Availability Statement: Not applicable. Conflicts of Interest: The authors declare no conflict of interest. The funders had no role in thedesign of the study; in the collection, analyses, or interpretation of data; in the writing of the manu-script; or in the decision to publish the results. References 1 World Bioenergy Association. Global Bioenergy Statistics 2021. Available online: https://www.worldbioenergy.org/up-loads/211214%20WBA%20GBS%202021.pdf (accessed on 2 November 2022). 2 InternationalEEnergy Agency. Biogas Production by Region and bby FFeeedstock Type, 2018. Available online:https://www.iea.org/data-and-statistics/charts/biogas-production-by-region-and-by-feedstock-type-2018 (accessed on 2 No-vember 2022). 3. Green Planet Energy. Paludicultur Und Biomethan-Nachhaltige Landnutzung; 1st ed.; Green Planet Energy: Hamburg, Germany,2022. 4 Fachagentur Nachwachsende Rohstoffe e.V., 2020. Bioenergy in Germany Facts and Figures 2020. Available online:https://www.fnr.de/fileadmin/allgemein/pdf/broschueren/broschuere_basisdaten_bioenergie_2020_engl_web.pdf (accessed on3 November 2022). 5. Garcia-Lara, S.; Serna-Saldivar, S.O. Chapter 1-Corn History and Culture. In Corn, 3rd ed.; Serna-Saldivar, S.O., Ed.; AACCInternational Press: Oxford, UK, 2019; pp. 1-18, ISBN 978-0-12-811971-6. 6. FAOSTAT Crops and Livestock Products. Available online: https://www.fao.org/faostat/en/#data/QCL (accessed on 16 Decem-ber 2022). 7. Shiferaw, B.; Prasanna, B.M.; Hellin, J;Banziger, M. Crops That Feed the World 6. Past Successes and Future Challenges to theRole Played by Maize in Global Food Security. Food Sec. 2011, 3, 307-327. https://doi.org/10.1007/s12571-011-0140-5. 8. Erenstein, O.; Jaleta, M.; Sonder, K.; Mottaleb, K.; Prasanna, B.M. Global Maize Production, Consumption and Trade: Trendsand R&D Implications. Food Sec. 2022, 14, 1295-1319. https://doi.org/10.1007/s12571-022-01288-7. 9. Xu, J.; Li, M.; Ni, T. Feedstock for Bioethanol Production from a Technological Paradigm Perspective. BioResources 2015, 10,6285-6304. https://doi.org/10.15376/biores.10.3.Xu. 10. Mumm, R.H.; Goldsmith, P.D.; Rausch, K.D.; Stein, H.H. Land Usage Attributed to Corn Ethanol Production in the UnitedStates: Sensitivity to Technological Advances in Corn Grain Yield, Ethanol Conversion, and Co-Product Utilization. Biotechnol.Biofuels 2014, 7, 61. https://doi.org/10.1186/1754-6834-7-61. 11. Dobers, G.M. Acceptance of Biogas Plants Taking into Account Space and Place. Energy Policy 2019, 135,110987.https://doi.org/10.1016/j.enpol.2019.110987. 12. Wicki, L.; Naglis-Liepa, K.; Filipiak, T.; Parzonko, A.; Wicka, A. Is the Production of Agricultural Biogas EnvironmentallyFriendly? Does the Structure of Consumption of First- and Second-Generation Raw Materials in Latvia and Poland Matter?Energies 2022, 15,5623. https://doi.org/10.3390/en15155623. 13. Martinez-Gutierrez, E. Biogas Production from Different Lignocellulosic Biomass Sources: Advances and Perspectives.3 Biotech2018,8, 233. https://doi.org/10.1007/s13205-018-1257-4. 14. Kumar, R.; Bhardwaj, A.; Singh, L.P.; Singh, G. Environmental Impact Assessment of Maize Production in Northern India. IOPConf. Ser. Earth Environ. Sci. 2022, 1084,012042. https://doi.org/10.1088/1755-1315/1084/1/012042. 15. Rode, M.; Schneider, C.; Ketelhake, G.; Reifshauer, D. Naturschutzvertrigliche Erzeugung Und Nutzung von Biomasse Zur Wirme-Und Stromgewinnung, 1st ed; BfN-Skripten: Bonn, Germany, 2015. (In German) 16. Vergara, F.; Lakes, T.M. Maizification of the Landscape for Biogas Production? Identifying the Likelihood of Silage Maize for Biogas inBrandenburg from 2008-2018;FORLand-Working Paper; Humboldt-Universitat zu Berlin: Berlin, Germany, 2019. 17. Fahrig, L.; Baudry, J.; Brotons, L.; Burel, F.G.; Crist, T.O.; Fuller, R.J.; Sirami, C.; Siriwardena, G.M.; Martin, J.-L. FunctionalLandscape Heterogeneity and AnimalBiodiversity inAgriculturalLandscapes. EcolL..Lett.2011,14, 101-112.https://doi.org/10.1111/j.1461-0248.2010.01559.x. 18. Kleijn, D.; Rundlof, M.; Scheper, J.; Smith, H.G.; Tscharntke, T. Does Conservation on Farmland Contribute to Halting the Bio-diversity Decline? Trends Ecol. Evol. 2011, 26, 474-481. https://doi.org/10.1016/j.tree.2011.05.009. 19. Banaszuk, P.; Wysocka-Czubaszek, A.; Czubaszek, R.; Roj-Rojewski, S. Skutki energetycznego wykorzystania biomasy. Wies IRol. 2015, 4, 139-152. (In Polish) 20. Agostini, A.; Battini, F.; Padella, M.; Giuntoli, J.; Baxter, D.;Marelli, L.; Amaducci, S. Economics of GHG Emissions Mitigationvia Biogas Production from Sorghum, Maize and Dairy Farm Manure Digestion in the Po Valley. Biomass Bioenergy 2016, 89,58-66.https://doi.org/10.1016/j.biombioe.2016.02.022. 21. Liiker-Jans, N.; Simmering, D.;Otte, A. The Impact of Biogas Plants on Regional Dynamics of Permanent Grassland and MaizeArea-The Example of Hesse, Germany (2005-2010). Agric. Ecosys. Environ. 2017. 241. 24-38.https://doi.org/10.1016/j.agee.2017.02.023. 22. Markou, G.; Brule, M.; Balafoutis, A.; Kornaros, M.; Georgakakis, D.; Papadakis, G. Biogas Production from Energy Crops inNorthern Greece: Economics of Electricity Generation Associated with Heat Recovery in a Greenhouse. Clean. Techn. Environ.Policy 2017, 19, 1147-1167. https://doi.org/10.1007/s10098-016-1314-9. 23..Couwenberg, J. Biomass Energy Crops on Peatlands: On Emissions and Perversions. Int. Mire Conserv. Group (IMCG) Newsl.Issue 2007, 3,12-14. 24. Bacenetti, J.; Sala, C.; Fusi, A.; Fiala, M. Agricultural Anaerobic Digestion Plants: What LCA Studies Pointed out and What CanBe Done to Make Them More Environmentally Sustainable. Appl. Energy 2016, 179, 669-686. https://doi.org/10.1016/j.apen-ergy.2016.07.029. 25. Balcioglu, G.; Jeswani, H.K.; Azapagic, A. Evaluating the Environmental and Economic Sustainability of Energy from AnaerobicDigestion of Different Feedstocks in Turkey. Sustain. Prod. Consum. 2022, 32, 924-941. https://doi.org/10.1016/j.spc.2022.06.011. 26. Mu, H.; Zhao, C.; Zhao, Y.; Li, Y.; Hua, D.; Zhang, X.; Xu, H. Enhanced Methane Production by Semi-Continuous MesophilicCo-Digestion of Potato Waste and Cabbage Waste:Performance and Microbial Characteristics Analysis. Bioresour. Technol. 2017,236, 68-76. https://doi.org/10.1016/j.biortech.2017.03.138. 27. Chuanchai, A.; Ramaraj, R. Sustainability Assessment of Biogas Production from Buffalo Grass and Dung: Biogas Purificationand Bio-Fertilizer. 3 Biotech 2018, 8,151. https://doi.org/10.1007/s13205-018-1170-x. 28. Vats, N.; Khan, A.A.; Ahmad, K. Options for Enhanced Anaerobic Digestion of Waste and Biomass-A Review.J. Biosyst. Eng.2020, 45,1-15. https://doi.org/10.1007/s42853-019-00040-y. 29. Miramontes-Martinez, L.R.; Rivas-Garcia, P.; Albalate-Ramirez, A.; Botello-Alvarez, J.E.; Escamilla-Alvarado, C.; Gomez-Gon-zalez, R.; Alcala-Rodriguez, M.M.; Valencia-Vazquez, R.; Santos-Lopez, I.A. Anaerobic Co-Digestion of Fruit and VegetableWaste: Synergyand Process Stability Analysis. J. Air Waste Manag8.· Assoc. 2021, 71. 620-632.https://doi.org/10.1080/10962247.2021.1873206. 30. Riau, V.; Burgos, L.; Camps, F.; Domingo, F.; Torrellas, M.; Anton, A.; Bonmati, A. Closing Nutrient Loops in a Maize Rotation.Catch Crops to Reduce Nutrient Leaching and Increase Biogas Production by Anaerobic Co-Digestion with Dairy Manure.Waste Manag. 2021, 126,719-727.https://doi.org/10.1016/j.wasman.2021.04.006. 31. Wilinska-Lisowska, A.; Ossowska, M.; Czerwionka, K. The Influence of Co-Fermentation of Agri-Food Waste with PrimarySludge on Biogas Production andComposition of theILiquid1Fraction of Digestate.EEnergies22021,14, 1907.https://doi.org/10.3390/en14071907. 32. Vijin Prabhu, A.; Sivaram, A.R.; Prabhu,N.; Sundaramahalingam, A. A Study of Enhancing the Biogas Production in AnaerobicDigestion. Mater. Today Proc. 2021, 45,7994-7999.https://doi.org/10.1016/j.matpr.2020.12.1009. 33. Atelge, M.R.; Krisa, D.; Kumar, G.; Eskicioglu, C.; Nguyen, D.D.; Chang, S.W.; Atabani, A.E.; Al-Muhtaseb, A.H.; Unalan, S.Biogas Production from Organic Waste: Recent Progress and Perspectives. Waste Biomass. Valori. 2020, 11, 1019-1040.https://doi.org/10.1007/s12649-018-00546-0. 34. Aklilu, E.G.; Waday, Y.A. Optimizing the Process Parameters to Maximize Biogas Yield from Anaerobic Co-Digestion of Alkali-Treated Corn Stover and Poultry Manure Using Artificial Neural Network and Response Surface Methodology. Biomass Conv.Bioref. 2021. https://doi.org/10.1007/s13399-021-01966-0. 35. Chakraborty, D.;Palani, S.G.; Ghangrekar, M.M.; Anand, N.; Pathak, P. Dual Role of Grass Clippings as Buffering Agent andBiomass during Anaerobic Co-Digestionwith FoodWaste. CleanTechn. Environ.Policy20222,, 24, 2787-2799.https://doi.org/10.1007/s10098-022-02355-5. 36. Velasquez Pinas, J.A.; Venturini, O.J.; Silva Lora, E.E.; Calle Roalcaba, O.D. Technical Assessment of Mono-Digestion and Co-Digestion Systems for the Production of Biogas from Anaerobic Digestion in Brazil. Renew. Energy 2018,117,447-458.https://doi.org/10.1016/j.renene.2017.10.085. 37. Bojti, T.; Kovacs, K.L.; Kakuk, B.; Wirth, R.;Rakhely, G.;Bagi, Z. Pretreatment of Poultry Manure for Efficient Biogas Productionas Monosubstrateor Co-Fermentation with MaizeSilageandCornStover. Anaerobe 2017. 46, 138-145.https://doi.org/10.1016/j.anaerobe.2017.03.017. 38. Kalamaras, S.D.; Kotsopoulos, T.A. Anaerobic Co-Digestion of Cattle Manure and Alternative Crops for the Substitution ofMaize in South Europe. Bioresour. Technol. 2014, 172, 68-75. https://doi.org/10.1016/j.biortech.2014.09.005. 39. Cuetos, M.J.; Gomez, X.; Martinez, E.J.; Fierro, J.; Otero, M. Feasibility of Anaerobic Co-Digestion of Poultry Blood with MaizeResidues. Bioresour. Technol. 2013,144,513-520.https://doi.org/10.1016/j.biortech.2013.06.129. 40)..CGruber-Brunhumer, M.R.; Montgomery, L.F.R.;Nussbaumer, M.; Schoepp, T.;Zohar, E.; Muccio, M.; Ludwig, I; Bochmann, G.;Fuchs, W.; Drosg, B. Effects of Partial Maize Silage Substitution with Microalgae on Viscosity and Biogas Yields in ContinuousAD Trials. J. Biotechnol. 2019, 295,80-89. https://doi.org/10.1016/j.jbiotec.2019.02.004. 41. Agostini, A.; Battini, F.; Giuntoli,J.; Tabaglio, V.;Padella, M.; Baxter, D.; Marelli, L.; Amaducci, S. Environmentally SustainableBiogas??The KeyRole of ManureeCo-Digestion with Energy Crops. Energies 2015, 8, 5234-5265.https://doi.org/10.3390/en8065234. 42. Lask, J.; Martinez Guajardo, A.; Weik, J.; von Cossel, M.; Lewandowski, I.; Wagner, M. Comparative Environmental and Eco-nomic Life Cycle Assessment of Biogas Production from Perennial Wild Plant Mixtures and Maize (Zea mays L.) in SouthwestGermany. Glob. Change Biol. Bioenergy 2020, 12,571-585.https://doi.org/10.1111/gcbb.12715. 43. De Vries, J.W.; Vinken, T.M.W.J; Hamelin, L.; De Boer, I.J.M. Comparing Environmental Consequences of Anaerobic Mono-and Co-Digestion of Pig Manure to Produce Bio-Energy-A Life Cycle Perspective. Bioresour. Technol. 2012, 125,239-248.https://doi.org/10.1016/j.biortech.2012.08.124. 44. Tanneberger, F.; Wichtmann, W. Land Use Options for Rewetted Peatlands. In Carbon Credits from Peatland Rewetting. Climate-Biodiversity-Land Use, 1st ed.;Tanneberger, F.,Wichtmann,W., Eds.;Schweizerbart Science Publishers: Stuttgart, Germany, 2011;Pp. 107-132. 45. Graneli, W. Reed Phragmites australis (Cav.) Trin. Ex Steudel as an Energy Source in Sweden. Biomass 1984, 4,183-208.https://doi.org/10.1016/0144-4565(84)90056-8. 46. Brix, H.; Sorrell, B.K.; Lorenzen, B. Are Phragmites-Dominated Wetlands a Net Source or Net Sink of Greenhouse Gases? Aquat.Bot. 2001, 69,313-324. 47. Hallam, A.; Anderson, I.C.; Buxton, D.R. Comparative Economic Analysis of Perennial, Annual, and Intercrops for BiomassProduction. Biomass Bioenergy. 2001, 21, 407-424. https://doi.org/10.1016/S0961-9534(01)00051-4. 48. Jasinskas, A.; Zaltauskas, A.; Kryzeviciene, A. The Investigation of Growing and Using of Tall Perennial Grasses as EnergyCrops. Biomass Bioenergy 2008, 32, 981-987.https://doi.org/10.1016/j.biombioe.2008.01.025. 49. Masse, D.; Gilbert, Y.; Savoie, P.; Belanger, G.; Parent, G.; Babineau, D. Methane Yield from Switchgrass and Reed CanarygrassGrown in Eastern Canada. Bioresour. Technol. 2011, 102, 10286-10292. https://doi.org/10.1016/j.biortech.2011.08.087. 50.KKobbing, J.F.; Thevs, N.;Zerbe, S. The Utilisation of Reed (Phragmites australis): A Review. Mires Peat 2013, 13,1-14. 51L..PPociene, L.; Sarunaite, L.; Tilvikiene, V.;ǒlepetys, J.;Kadziuliene,2. The Yield and Composition of Reed Canary Grass Biomassas Raw Material for Combustion. Biologija 2013,59, 195-200. https://doi.org/10.6001/biologija.v59i2.2752. 52. Hartung, C.; Andrade,D.;Dandikas, V.;Eickenscheidt, T.; Drosler, M.; Zollfrank, C.; Heuwinkel, H. Suitability of PaludicultureBiomass as Biogas Substrate-Biogas Yield and Long-Term Effects on Anaerobic Digestion. Renew. Energy 2020, 159, 64-71.https://doi.org/10.1016/j.renene.2020.05.156. 53. Geurts, J.J.M.; Duinen, G.-J.A.; van; Belle, J. van; Wichmann, S.; Wichtmann, W.; Fritz, C. Recognize the High Potential of Palu-diculture on Rewetted Peat Soils to Mitigate Climate Change. Landbauforsch. J. Sustain. Org. Agric. Syst. 2019, 69,5-8.https://doi.org/10.3220/LBF1576769203000. 54. United Nations Environment Programme Global Peatlands Assessment: The State of the World’s Peatlands. Available online:http://www.unep.org/resources/global-peatlands-assessment-2022 (accessed on 27 November 2022). 55. Humpenoder, F.; Karstens, K.; Lotze-Campen, H.; Leifeld, J.; Menichetti, L.; Barthelmes, A.; Popp, A. Peatland Protection andRestoration Are Key for Climate Change Mitigation. Environ. Res. Lett. 2020, 15, 104093. https://doi.org/10.1088/1748-9326/abae2a. 56. Joosten, H.; Tanneberger, F.; Moen, A. (Eds.) Mires and Peatlans of Europe. Status. Distribution and Conservation, 1st ed.;Schweizerbart Science Publishers: Stuttgart, Germany, 2017. 57. Tanneberger, F.; Appulo, L.; Ewert, S.; Lakner, S.; O Brolcháin, N.; Peters, J.; Wichtmann, W. The Power of Nature-Based Solu-tions: How Peatlands Can Help Us to Achieve Key EU Sustainability Objectives. Ado. Sustain. Syst. 2021, 5,2000146.https://doi.org/10.1002/adsu.202000146. 58. Raichel, D.L.; Able, K.W.; Hartman, J.M. The Influence of Phragmites (Common Reed) on the Distribution, Abundance, andPotential Prey of a Resident Marsh Fish in the Hackensack Meadowlands, New Jersey. Estuaries 2003, 26, 511-521.https://doi.org/10.1007/BF02823727. 59. Cotana, F.; Cavalaglio, G.; Pisello, A.; Gelosia, M.; Ingles, D.; Pompili, E. Sustainable Ethanol Production from Common Reed(Phragmites australis) through Simultaneuos Saccharification andFermentation. Sustainability 22015,7,12149-12163.https://doi.org/10.3390/su70912149. 60. Banaszuk, P.; Kamocki, A.K.; Wysocka-Czubaszek, A.; Czubaszek, R.; Roj-Rojewski, S. Closing the Loop-Recovery of Nutri-ents and Energy from Wetland Biomass. Ecol. Eng. 2020, 143, 105643.https://doi.org/10.1016/j.ecoleng.2019.105643. 61. Gomez-Sánchez, M.D.; Sánchez, R.; Espinosa, E.;Rosal, A.; Rodriguez, A. Production of Cellulosic Pulp from Reed (PhragmitesAustralis) to Produce Paper and Paperboard. Bioprocess Eng. 2017, 1, 65. https://doi.org/10.11648/j.be.20170103.11. 62. Dragoni, F.; Giannini, V.; Ragaglini, G.; Bonari, E.; Silvestri, N. Effect of Harvest Time and Frequency on Biomass Quality andBiomethane Potential of Common Reed (Phragmites australis) Under Paludiculture Conditions. Bioenergy Res. 2017,10,1066-1078. https://doi.org/10.1007/s12155-017-9866-z. 636..Roj-Rojewski, S.; Wysocka-Czubaszek, A.; Czubaszek, R.; Kamocki, A.;Banaszuk, P. Anaerobic Digestion of Wetland Biomassfrom Conservation Management for Biogas Production. Biomass Bioenergy 2019, 122, 126-132. https://doi.org/10.1016/j.biom-bioe.2019.01.038. 64. Jagadabhi, P.S.; Kaparaju, P.; Rintala, J. Two-Stage Anaerobic Digestion of Tomato, Cucumber, Common Reed and Grass Silagein Leach-Bed Reactors and Upflow Anaerobic Sludge Blanket Reactors. Bioresour.Technol. 2011, 102,4726-4733.https://doi.org/10.1016/j.biortech.2011.01.052. 65. Czubaszek, R.; Wysocka-Czubaszek, A.; Wichtmann, W.; Banaszuk, P. Specific Methane Yield of Wetland Biomass in Dry andWet Fermentation Technologies. Energies 2021, 14,8373.https://doi.org/10.3390/en14248373. 66. Muller, J.; Jantzen, C.; Wiedow, D. The Energy Potential of Soft Rush (Juncus effusus L.) in Different Conversion Routes. EnergySustain. Soc. 2020, 10, 26. https://doi.org/10.1186/s13705-020-00258-1. 67. Baute, K.; Van Eerd, L.; Robinson, D.; Sikkema, P.; Mushtaq,M.;Gilroyed, B. Comparing the Biomass Yield and Biogas Potentialof Phragmites Australis with Miscanthus x Giganteus and Panicum virgatum Grown in Canada. Energies 2018, 11, 2198.https://doi.org/10.3390/en11092198. 68. Ohlsson, L.-O.; Karlsson, S.; Rupar-Gadd, K.; Albers, E.; Welander, U. Evaluation of Laminaria digitata and Phragmites australisfor Biogas Production andNutrienttRecycling.BiomasslBioenergy2020,140,105670. https://doi.org/10.1016/j.biom-bioe.2020.105670. 69. Wang, X.; Zhang, L.; Xi, B.; Sun, W.; Xia, X.; Zhu, C.; He, X.; Li, M.; Yang, T.; Wang, P.; et al. Biogas Production Improvementand C/N Control by Natural Clinoptilolite Addition into Anaerobic Co-Digestion of Phragmites australis, Feces and KitchenWaste. Bioresour. Technol. 2015, 180,192-199. https://doi.org/10.1016/j.biortech.2014.12.023. 70. Wang, K.; Yun, S.; Xing, T.; Li, B.; Abbas, Y.; Liu, X. Binary and Ternary Trace Elements to Enhance Anaerobic Digestion of Cattle Manure: Focusing on Kinetic Models for Biogas Production and Digestate Utilization. Bioresour. Technol. 2021, 323,124571.71. APHA. Standard Methods: For the Examination of Water and Wastewater,20th ed.; American Public Health Association, American Water Works Association, Water Pollution Control Federation: Washington, DC, USA, 1998; ISBN 978-0-87553-235-6. 72. Statistics Poland. Production of Agricultural and Horticultural Crops in 2021, 1st ed.; Zaklad Wydawnictw Statystycznych: Warsaw,Poland, 2022. ).European Biomass Association. Statistical Report 2017; European Biomass Association: Brussels, Belgium, 2017. The National Centre for Emissions Management. Emission Factors for COz, SOz, NOx and Total Particulate Matter for Electrical Energy on the Basis of Information in National Database on Emissions of Greenhouse Gases and Other Substances for 2020; The NationalCentre for Emissions Management: Warsaw, Poland, 2020. (In Polish) 75)..上Hryniewicz, M.; Grzybek, A. Estimation of Greenhouse Gases Emission from Maize for Silage Crop by LCA Method. Probl.Agric. Eng. 2016, 1, 63-73. (in Polish) 76. Schittenhelm, S. Chemical Composition and Methane Yield of Maize Hybrids with Contrasting Maturity. Eur. J. Agron. 2008,29, 72-79. https://doi.org/10.1016/j.eja.2008.04.001. 77. Gao,R.; Yuan, X.; Zhu, W.; Wang, X.; Chen, S.; Cheng, X.; Cui, Z. Methane Yield through Anaerobic Digestion for Various MaizeVarieties in China. Bioresour. Technol. 2012, 118, 611-614. https://doi.org/10.1016/j.biortech.2012.05.051. 78. Gasiorowska, B.; Plaza, A.; Rzazewska, E.; Waranica, M. Effect of Weather Conditions on the Content of Sugars in Plants ofEuropean Maize Cultivars Grown for Silage. Acta Agroph. 2020,26,57-64. https://doi.org/10.31545/aagr/115217. 79. Nenova, L.; Benkova, M.; Simeonova, Ts.; Atanassova, I. Nitrogen, Phosphorus and Potassium Content in Maize Dry Biomassunder theEffectof Different Levels of Mineral Fertilization. Agric. Sci. Technol. 2019, 11, 311-316.https://doi.org/10.15547/ast.2019.04.052. 80. Bojtor, C.; Mousavi, S.M.N.; Illes, A.; Golzardi, F.; Szeles, A.; Szabó, A.; Nagy, J.; Marton, C.L. Nutrient Composition Analysisof Maize Hybrids Affected by Different Nitrogen Fertilisation Systems. Plants 2022, 11, 1593.https://doi.org/10.3390/plants11121593. 81L..LLin, S.; Pi, Y.; Long, D.; Duan, J; Zhu, X.; Wang, X.; He,J.; Zhu, Y. Impact of Organic and Chemical Nitrogen Fertilizers on theCrop Yield andFFertilizer Use Efficiency ofSoybean-Maize Intercropping Systems.Agriculture 2022,12,11428.https://doi.org/10.3390/agriculture12091428. 82. Seppala, M.; Pyykkonen, V.; Vaisanen, A.; Rintala, J. Biomethane Production from Maize and Liquid Cow Manure-Effect ofSharee ofMaize, Post-Methanation Potential and Digestate Characteristics. Fuel 2013. 107. 209-216.https://doi.org/10.1016/j.fuel.2012.12.069. 83. Skowronska, M.; Filipek, T. Accumulation of Nitrogen and Phosphorus by Maize as a Result of a Reduction in the PotassiumFertilization Rate. Ecol. Chem. Eng. S 2010, 17,83-88. 84. Zhao, X.; Liu, J; Liu, J; Yang, F.; Zhu, W.; Yuan, X.; Hu, Y.; Cui, Z.; Wang, X. Effect of Ensiling and Silage Additives on BiogasProduction and Microbial Community Dynamics during Anaerobic Digestion of Switchgrass. Bioresour. Technol. 2017,241,349-359. https://doi.org/10.1016/j.biortech.2017.03.183. 85. Herrmann, C.; Prochnow, A.; Heiermann, M.; Idler, C. Biomass from Landscape Management of Grassland Used for BiogasProduction: Effects of Harvest Date and Silage Additives on Feedstock Quality and Methane Yield. Grass Forage Sci. 2014, 69,549-566. https://doi.org/10.1111/gfs.12086. 86. Mosier, N. Features of Promising Technologies for Pretreatment of Lignocellulosic Biomass. Bioresour. Technol. 2005,96,673-686. https://doi.org/10.1016/j.biortech.2004.06.025. 87. Wenzel, M.; Kabengele, G.; Dahms, T.; Barz, M.; Wichtmann, W. Bioenergie Aus Nassen Mooren. Thermische Verwertung von Halm-gutartiger Biomasse Aus Paludikultur, 1st ed.; Institut fur Botanik und Landschaftsokologie, Universitat Greifswald, GreifswaldMoor Centrum: Greifswald, Germany, 2022. (In German) 88. Lizasoain, J.; Rincon, M.; Theuretzbacher,F.; Enguidanos, R.; Nielsen, P.J.; Potthast, A.; Zweckmair, T.; Gronauer, A.; Bauer, A.Biogas Production from Reed Biomass: Effect of Pretreatment Using Different Steam Explosion Conditions. Biomass Bioenergy2016, 95,84-91. https://doi.org/10.1016/j.biombioe.2016.09.021. 89. Borin, M.;Florio, G.; Barbera, A.; Cirelli, G.L.;Albergo,R.; Palazzo,S. Preliminary Evaluation of Macrophyte Wetland Biomassesto Obtain Second Generation Ethanol. In Proceedings of the 19th European Biomass Conference and Exhibition, Berlin, Ger-many, 6-10 June 2011. 90. Van Tran, G.; Unpaprom, Y.;Ramaraj, R. Methane Productivity Evaluation of an Invasive Wetland Plant, Common Reed. Bio-mass Conv. Bioref. 2020,10, 689-695. https://doi.org/10.1007/s13399-019-00451-Z. 91. Wohler-Geske, A.; Moschner, C.R.; Gellerich, A. Provenances and Properties of Thatching Reed (Phragmites australis). Appl.Agric. For. Res. 2016, 86,1-10. https://doi.org/10.3220/LBF1457686750000. 92. López-Gonzalez, D.; Avalos-Ramirez, A.; Giroir-Fendler, A.; Godbout, S.; Fernandez-Lopez, M.; Sanchez-Silva, L.; Valverde,J.L. Combustion Kinetic Study of Woody and Herbaceous Crops by Thermal Analysis Coupled to Mass Spectrometry. Energy2015,90,1626-1635.https://doi.org/10.1016/j.energy.2015.06.134. 93. Baran, M.; Varadyova, Z.; Kracmár, S.; Hedvabny, J. The Common Reed (Phragmites australis) as a Source of Roughage in Ru-minant Nutrition. Acta Vet. Brno 2002, 71, 445-449. https://doi.org/10.2754/avb200271040445. 94. Kwietniewska, E.; Tys, J. Process Characteristics, Inhibition Factors and Methane Yields of Anaerobic Digestion Process, withParticularFocus on Microalgal Biomass Fermentation. Renew. Sust. Energy Rev. 2014. 34, 491-500.https://doi.org/10.1016/j.rser.2014.03.041. 95. Herrmann, A.; Rath, J. Biogas Production from Maize: Current State, Challenges, and Prospects. 1. Methane Yield Potential.Bioenergy Res. 2012, 5, 1027-1042.https://doi.org/10.1007/s12155-012-9202-6. 96. Kreuger, E.; Nges, I.;Bjornsson, L. Ensiling of Crops for Biogas Production: Effects on Methane Yield and Total Solids Determin.Biotechnol. Biofuels 2011, 4, 44. 97. Herrmann, C.; Idler, C.; Heiermann, M. Improving Aerobic Stability and Biogas Production of Maize Silage Using Silage Addi-tives. Bioresour. Technol. 2015, 197, 393-403. https://doi.org/10.1016/j.biortech.2015.08.114. 98. Gross, F.; Riebe, K. Gairfutter: Betriebswirtschaft, Erzeugung, Verfiitterung, 1st ed.; UlmeVerlag Eugen: Stuttgart, Germany, 1974;ISBN 978-3-8001-4321-4.(In German) 99. Eller, F.; Ehde, P.M.; Oehmke, C.; Ren, L.; Brix, H.; Sorrell, B.K.; Weisner, S.E.B. Biomethane Yield from Different EuropeanPhragmites australis genotypes, compared with other herbaceous wetland species grown at different fertilization regimes. Re-sources 2020, 9,57.https://doi.org/10.3390/resources9050057. 100. Bareha,Y.;Faucher,J.-P.; Michel, M.;Houdon, M.; Vaneeckhaute,C. Evaluating the Impact of Substrate Addition for AnaerobicCo-Digestion on Biogas Production and Digestate Quality: The Case of Deinking Sludge. J. Environ. Manag. 2022,319,115657.https://doi.org/10.1016/j.jenvman.2022.115657. 101. Wickham, R.; Galway, B.; Bustamante, H.; Nghiem, L.D. Biomethane Potential Evaluation of Co-Digestion of Sewage Sludgeand Organic Wastes. Int. Biodeterior. Biodegrad.2016,113,3-8. https://doi.org/10.1016/j.ibiod.2016.03.018. 102. Feng, L.; Wahid, R.; Ward, A.J; Moller, H.B. Anaerobic Co-Digestion of Cattle Manure and Meadow Grass: Effect of SerialConfigurations of Continuous Stirred Tank Reactors (CSTRs). Biosyst. Eng. 2017, 160,1-11. https://doi.org/10.1016/j.biosystem-seng.2017.05.002. 103. Pelegrin, J.; Holzem, R.M. Evaluating the Impacts of Phragmites australis Pretreatment Methods on Biogas and Methane. MJUR2017,7,244-259. 104. Motte, J.-C.; Escudie, R.; Hamelin, J.; Steyer, J.-P.; Bernet, N.; Delgenes, J.-P.; Dumas, C. Substrate Milling Pretreatment as a KeyParameter for Solid-State Anaerobic Digestion Optimization. Bioresour. Technol. 2014. 173, 185-192.https://doi.org/10.1016/j.biortech.2014.09.015. 105. Wahid, R.;Hjorth, M.; Kristensen, S.; Moller, H.B. Extrusion as Pretreatment for Boosting Methane Production: Effect of ScrewConfigurations. Energy Fuels 2015, 29, 4030-4037. https://doi.org/10.1021/acs.energyfuels.5b00191. 106. Shah, T.A.; Tabassum, R. Enhancing Biogas Production from Lime Soaked Corn Cob Residue. Int. J. Renew. Energy Res. 2018, 8,761-766. 107. Amnuaycheewa, P.; Hengaroonprasan, R.; Rattanaporn, K.; Kirdponpattara, S.; Cheenkachorn, K.; Sriariyanun, M. EnhancingEnzymatic Hydrolysis and Biogas Production from Rice Straw by Pretreatment with Organic Acids. Ind. Crops Prod. 2016, 87,247-254. https://doi.org/10.1016/j.indcrop.2016.04.069. 108. Czatzkowska, M.; Harnisz, M.; Korzeniewska, E.; Koniuszewska, I. Inhibitors of the Methane Fermentation Process with Par-ticular Emphasis on the Microbiological Aspect: A Review. Energy Sci. Eng. 2020, 8, 1880-1897. https://doi.org/10.1002/ese3.609. 109. Chen, Y.; Cheng, J.J; Creamer, K.S. Inhibition of Anaerobic Digestion Process: A Review. Bioresour. Technol. 2008,99,4044-4064.https://doi.org/10.1016/j.biortech.2007.01.057. 110. Fortuny, M.; Baeza, J.A.; Gamisans, X.; Casas, C.; Lafuente, J.; Deshusses, M.A.; Gabriel, D. Biological Sweetening of EnergyGases Mimics in Biotrickling Filters. Chemosphere 2008,71,10-17. https://doi.org/10.1016/j.chemosphere.2007.10.072. 111. Mamun, M.R.A.; Torii, S. Removal of Hydrogen Sulfide (HzS) from Biogas Using Zero-Valent Iron. J. Clean Energy Technol. 2015,3, 428-432. https://doi.org/10.7763/JOCET.2015.V3.236. 112. Calbry-Muzyka, A.; Madi, H.; Risch-Pfund, F.; Gandiglio, M.; Biollaz, S. Biogas Composition from Agricultural Sources andOrganic Fraction of Municipal Solid Waste. Renew. Energy 2022, 181,1000-1007. https://doi.org/10.1016/j.renene.2021.09.100. 113. Zarczynski, A.; Rosiak, K.; Anielak, P.; Wolf, W. Practical Methods of Cleaning Biogas from Hydrogen Sulphide. Part 1. Appli-cation of Solid Sorbents. Acta Innov. 2014,12,24-34. 114. Aita, B.C.; Mayer, F.D.; Muratt, D.T.; Brondani, M.; Pujol, S.B.; Denardi, L.B.; Hoffmann, R.; da Silveira, D.D. Biofiltration ofH2S-Rich Biogas Using Acidithiobacillus thiooxidans. Clean. Techn. Environ. Policy 2016, 18, 689-703. https://doi.org/10.1007/s10098-015-1043-5. 115. Jung, H.; Kim, D.; Choi, H.; Lee, C. A Review of Technologies for In-Situ Sulfide Control in Anaerobic Digestion. Renew. Sust.Energy Rev. 2022, 157,112068. https://doi.org/10.1016/j.rser.2021.112068. 116. Moreno-Andrade, I.; Moreno, G.; Quijano, G. Theoretical Framework for the Estimation of H2S Concentration in Biogas Pro-duced from Complex Sulfur-Rich Substrates. Environ. Sci. Pollut. Res. 2020, 27,15959-15966. https://doi.org/10.1007/s11356-019-04846-3. 117. Farghali,M.; Andriamanohiarisoamanana, F.J.; Ahmed, M.M.; Kotb, S.; Yamamoto, Y.; Iwasaki, M.; Yamashiro, T.; Umetsu, K.Prospects for Biogas Production and H2S Control from the Anaerobic Digestion of Cattle Manure: The Influence of MicroscaleWaste Iron Powder and Iron Oxide Nanoparticles. Waste Manag. 2020,101,141-149. https://doi.org/10.1016/j.was-man.2019.10.003. 118. Arias, D.E.; Veluchamy, C.; Habash, M.B.; Gilroyed, B.H. Biogas Production, Waste Stabilization Efficiency, and HygienizationPotential of a Mesophilic Anaerobic Plug Flow Reactor Processing Swine Manure and Corn Stover. J. Environ. Manag. 2021, 284,112027. https://doi.org/10.1016/j.jenvman.2021.112027. 119. Tahir, M.S.; Shahzad, K.; Shahid, Z.; Sagir, M.; Rehan, M.;Nizami, A. Producing Methane Enriched Biogas Using Solvent Ab-sorption Method. Chem. Eng. Trans. 2015,45,1309-1314. https://doi.org/10.3303/CET1545219. 120. Herout, M.; Malatak, J.; Kucera, L.; Dlabaja, T. Biogas Composition Depending on the Type of Plant Biomass Used. Res. Agric.Eng. 2011, 57, 137-143. https://doi.org/10.17221/41/2010-RAE. 121. Hutnan, M.Maize Silage as Substrate for Biogas Production. In Advances in Silage Production and Utilization; da Silva, T., Santos,E.M., Eds.; IntechOpen: London, UK, 2016. 122. Rajagopal, R.;Masse, D.I.; Singh, G. A Critical Review on Inhibition of Anaerobic Digestion Process by Excess Ammonia. Biore-sour. Technol. 2013, 143, 632-641. https://doi.org/10.1016/j.biortech.2013.06.030. 123. Theuerl, S.; Klang, J.; Prochnow, A. Process Disturbances in Agricultural Biogas Production-Causes, Mechanisms and Effectson the Biogas Microbiome: A Review. Energies 2019, 12, 365. https://doi.org/10.3390/en12030365. 124. Krakat, N.; Demirel, B.; Anjum, R.; Dietz, D. Methods of Ammonia Removal in Anaerobic Digestion: A Review. Water Sci.Technol. 2017, 76, 1925-1938. https://doi.org/10.2166/wst.2017.406. 125. Fernandes, T.V.; Keesman, K.J.; Zeeman, G.; van Lier, J.B. Effect of Ammonia on the Anaerobic Hydrolysis of Cellulose andTributyrin. Biomass Bioenergy 2012, 47, 316-323. https://doi.org/10.1016/j.biombioe.2012.09.029. 126. Statistics Poland. Energy Consumption in Households in 2018; Zakfad Wydawnictw Statystycznych: Warsaw, Poland, 2019. 127. Demko,J; Machava, J.; Saniga, M. Energy Production Analysis of Common Reed -Phragmites australis (Cav.) Trin. Folia Oeco-logica 2017, 44,107-113. 128. Dahms, T.; Oehmke, C.; Kowatsch, A.; Abel, S.; Wichmann, S.; Wichtmann, W.; Schroder, C. Halmgutartige Festbrennstoffe AusNassen Mooren, 1st ed.; Universitat Greifswald, Greifswald Moor Centrum: Greifswald, Germany, 2017. (In German) 129. Czubaszek,R.; Wysocka-Czubaszek, A.; Banaszuk, P. GHG Emissions and Efficiency of Energy Generation through AnaerobicFermentation of Wetland Biomass. Energies 2020, 13, 6497. https://doi.org/10.3390/en13246497. 130. Tanneberger, F.; Birr, F.; Couwenberg, J.; Kaiser, M.; Luthardt, V.; Nerger, M.; Pfister, S.; Oppermann, R.; Zeitz, J.; Beyer, C.; etal. Saving Soil Carbon, Greenhouse Gas Emissions, Biodiversity and the Economy: Paludiculture as Sustainable Land Use Op-tion in German Fen Peatlands. Reg. Environ. Change 2022,22,69. https://doi.org/10.1007/s10113-022-01900-8. 131. Hijazi, O.; Munro, S.; Zerhusen, B.; Effenberger, M. Review of Life Cycle Assessment for Biogas Production in Europe. Renew.Sust. Energy Rev. 2016,54,1291-1300. https://doi.org/10.1016/j.rser.2015.10.013. 132. Tonini, D.; Hamelin, L.; Alvarado-Morales, M.; Astrup, T.F. GHG Emission Factors for Bioelectricity, Biomethane, and Bioeth-anol Quantified for 24 Biomass Substrates with Consequential Life-Cycle Assessment. Bioresour. Technol. 2016, 208,123-133.https://doi.org/10.1016/j.biortech.2016.02.052. Disclaimer/Publisher's Note: The statements, opinions and data contained in all publications are solely those of the individual au-thor(s) and contributor(s) and not of MDPI and/or the editor(s). MDPI and/or the editor(s) disclaim responsibility for any injury topeople or property resulting from any ideas, methods, instructions or products referred to in the content.
确定


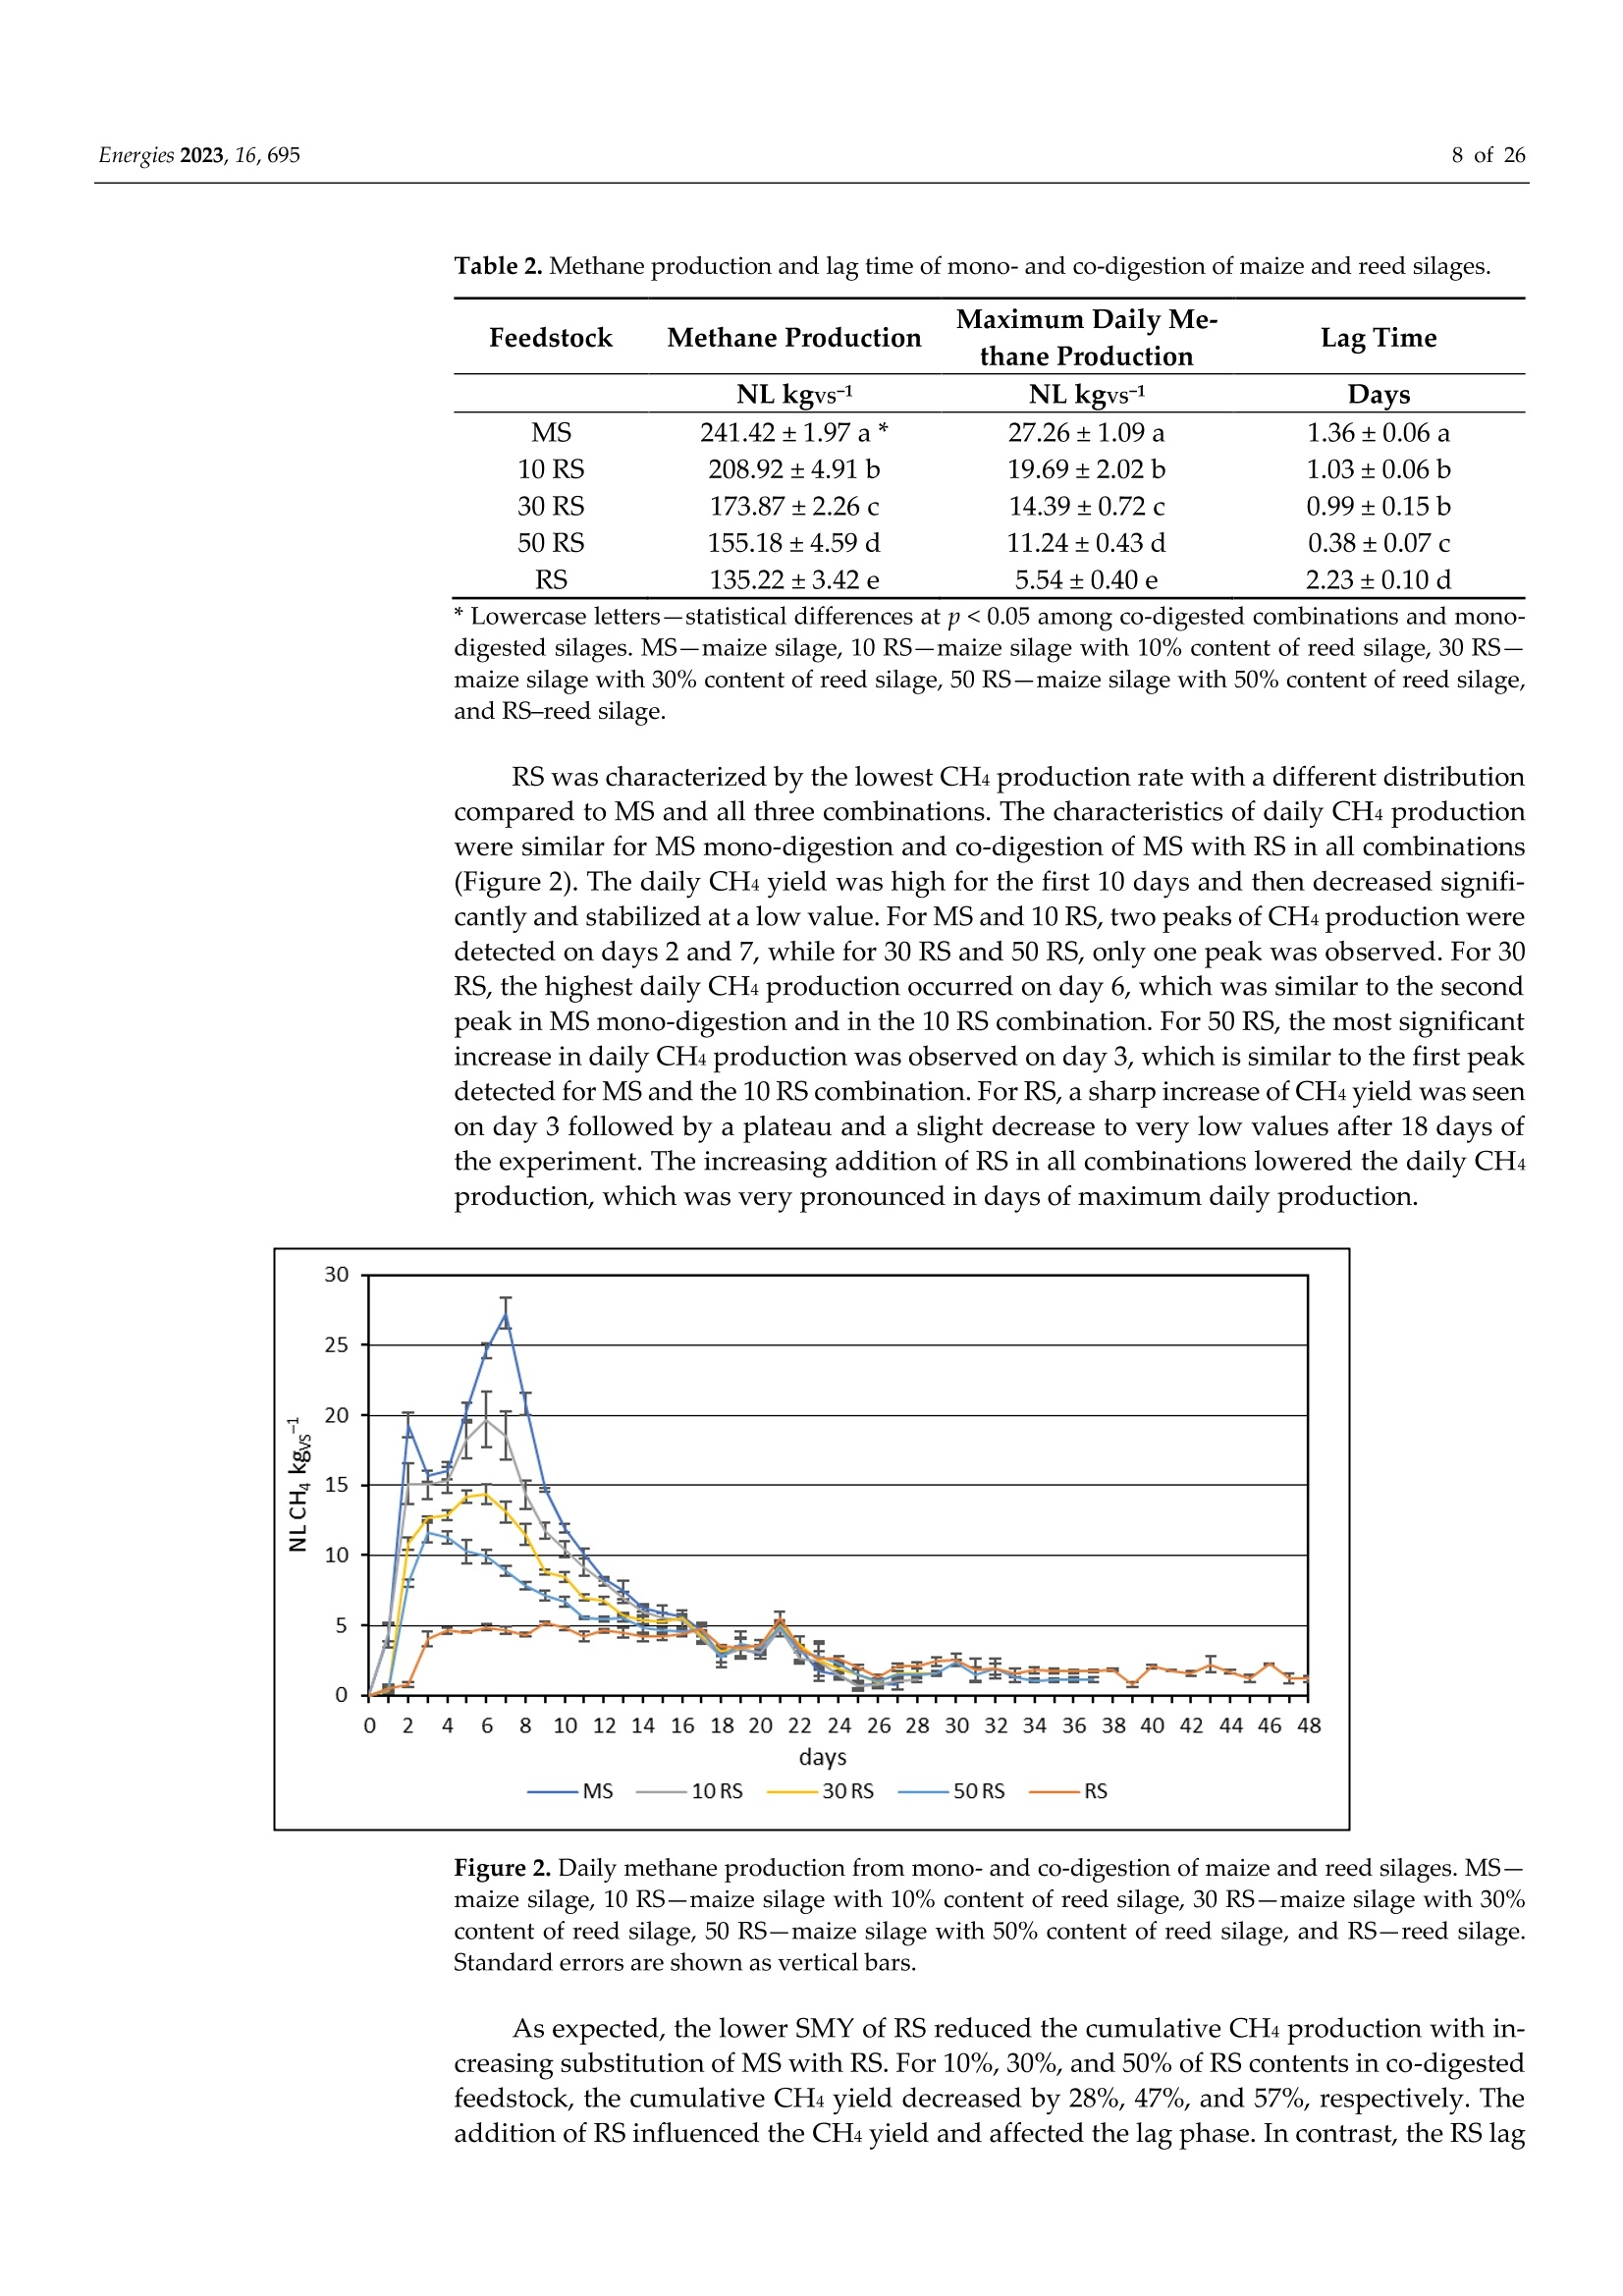
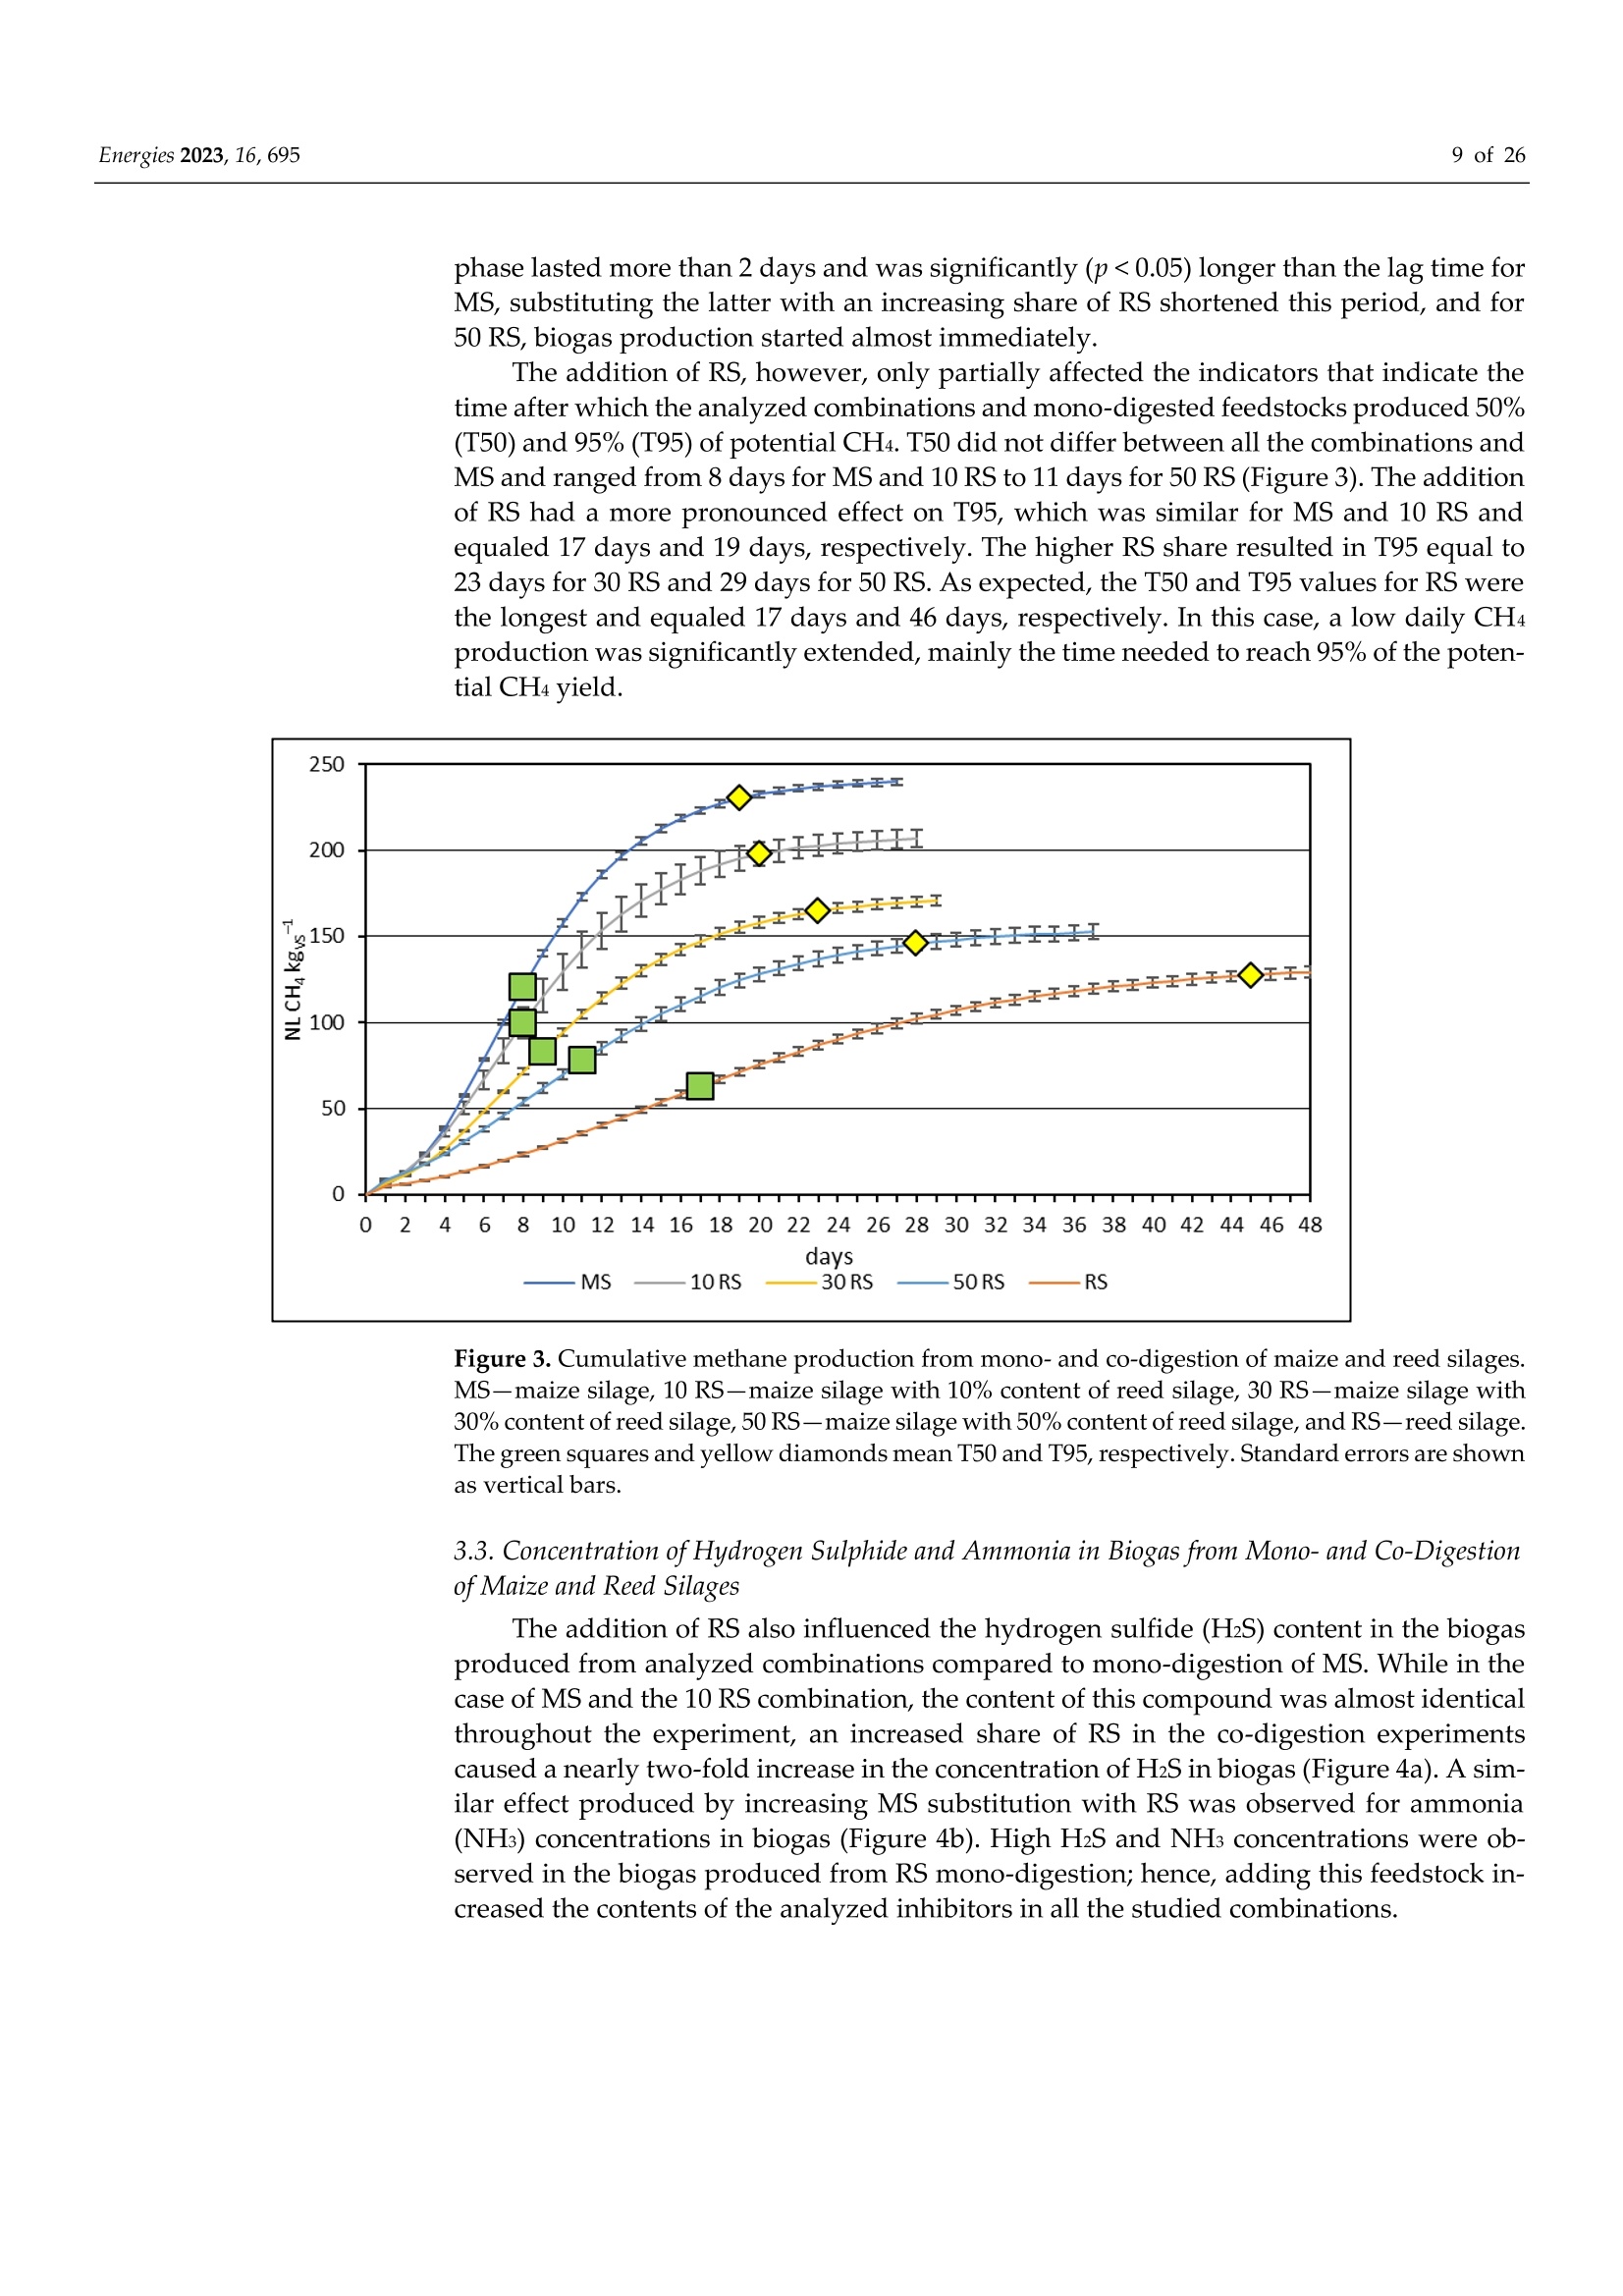
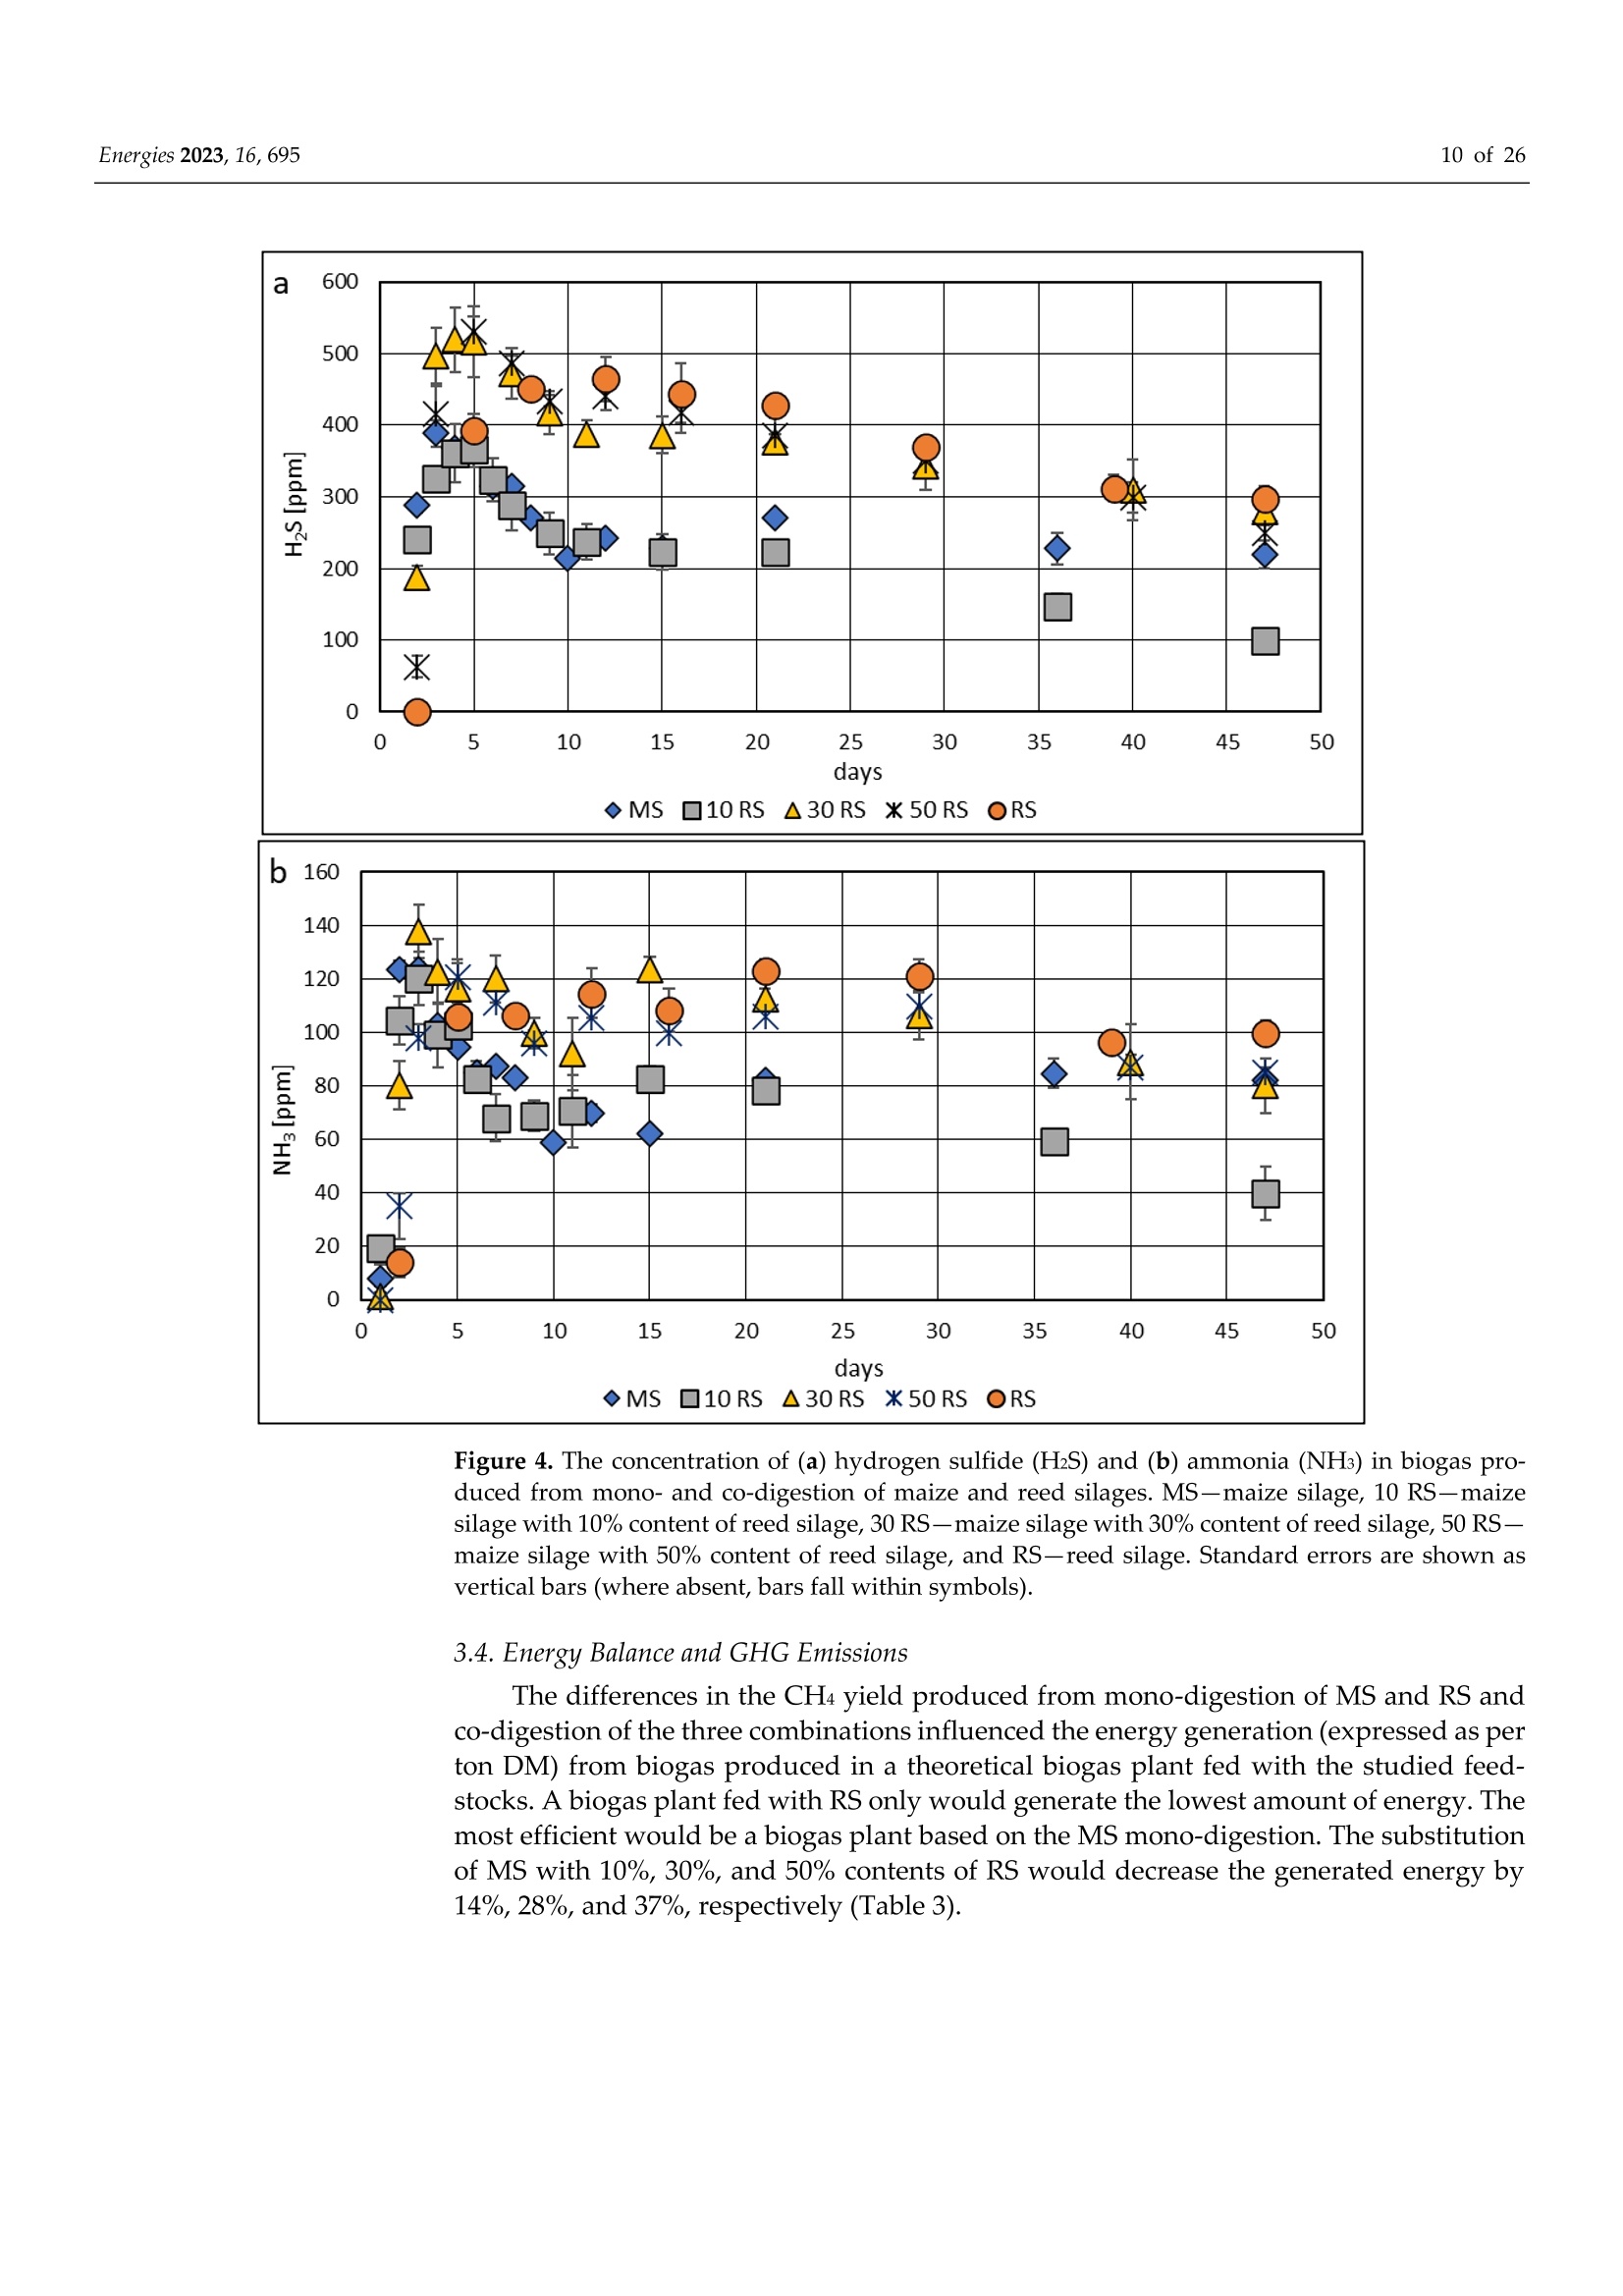
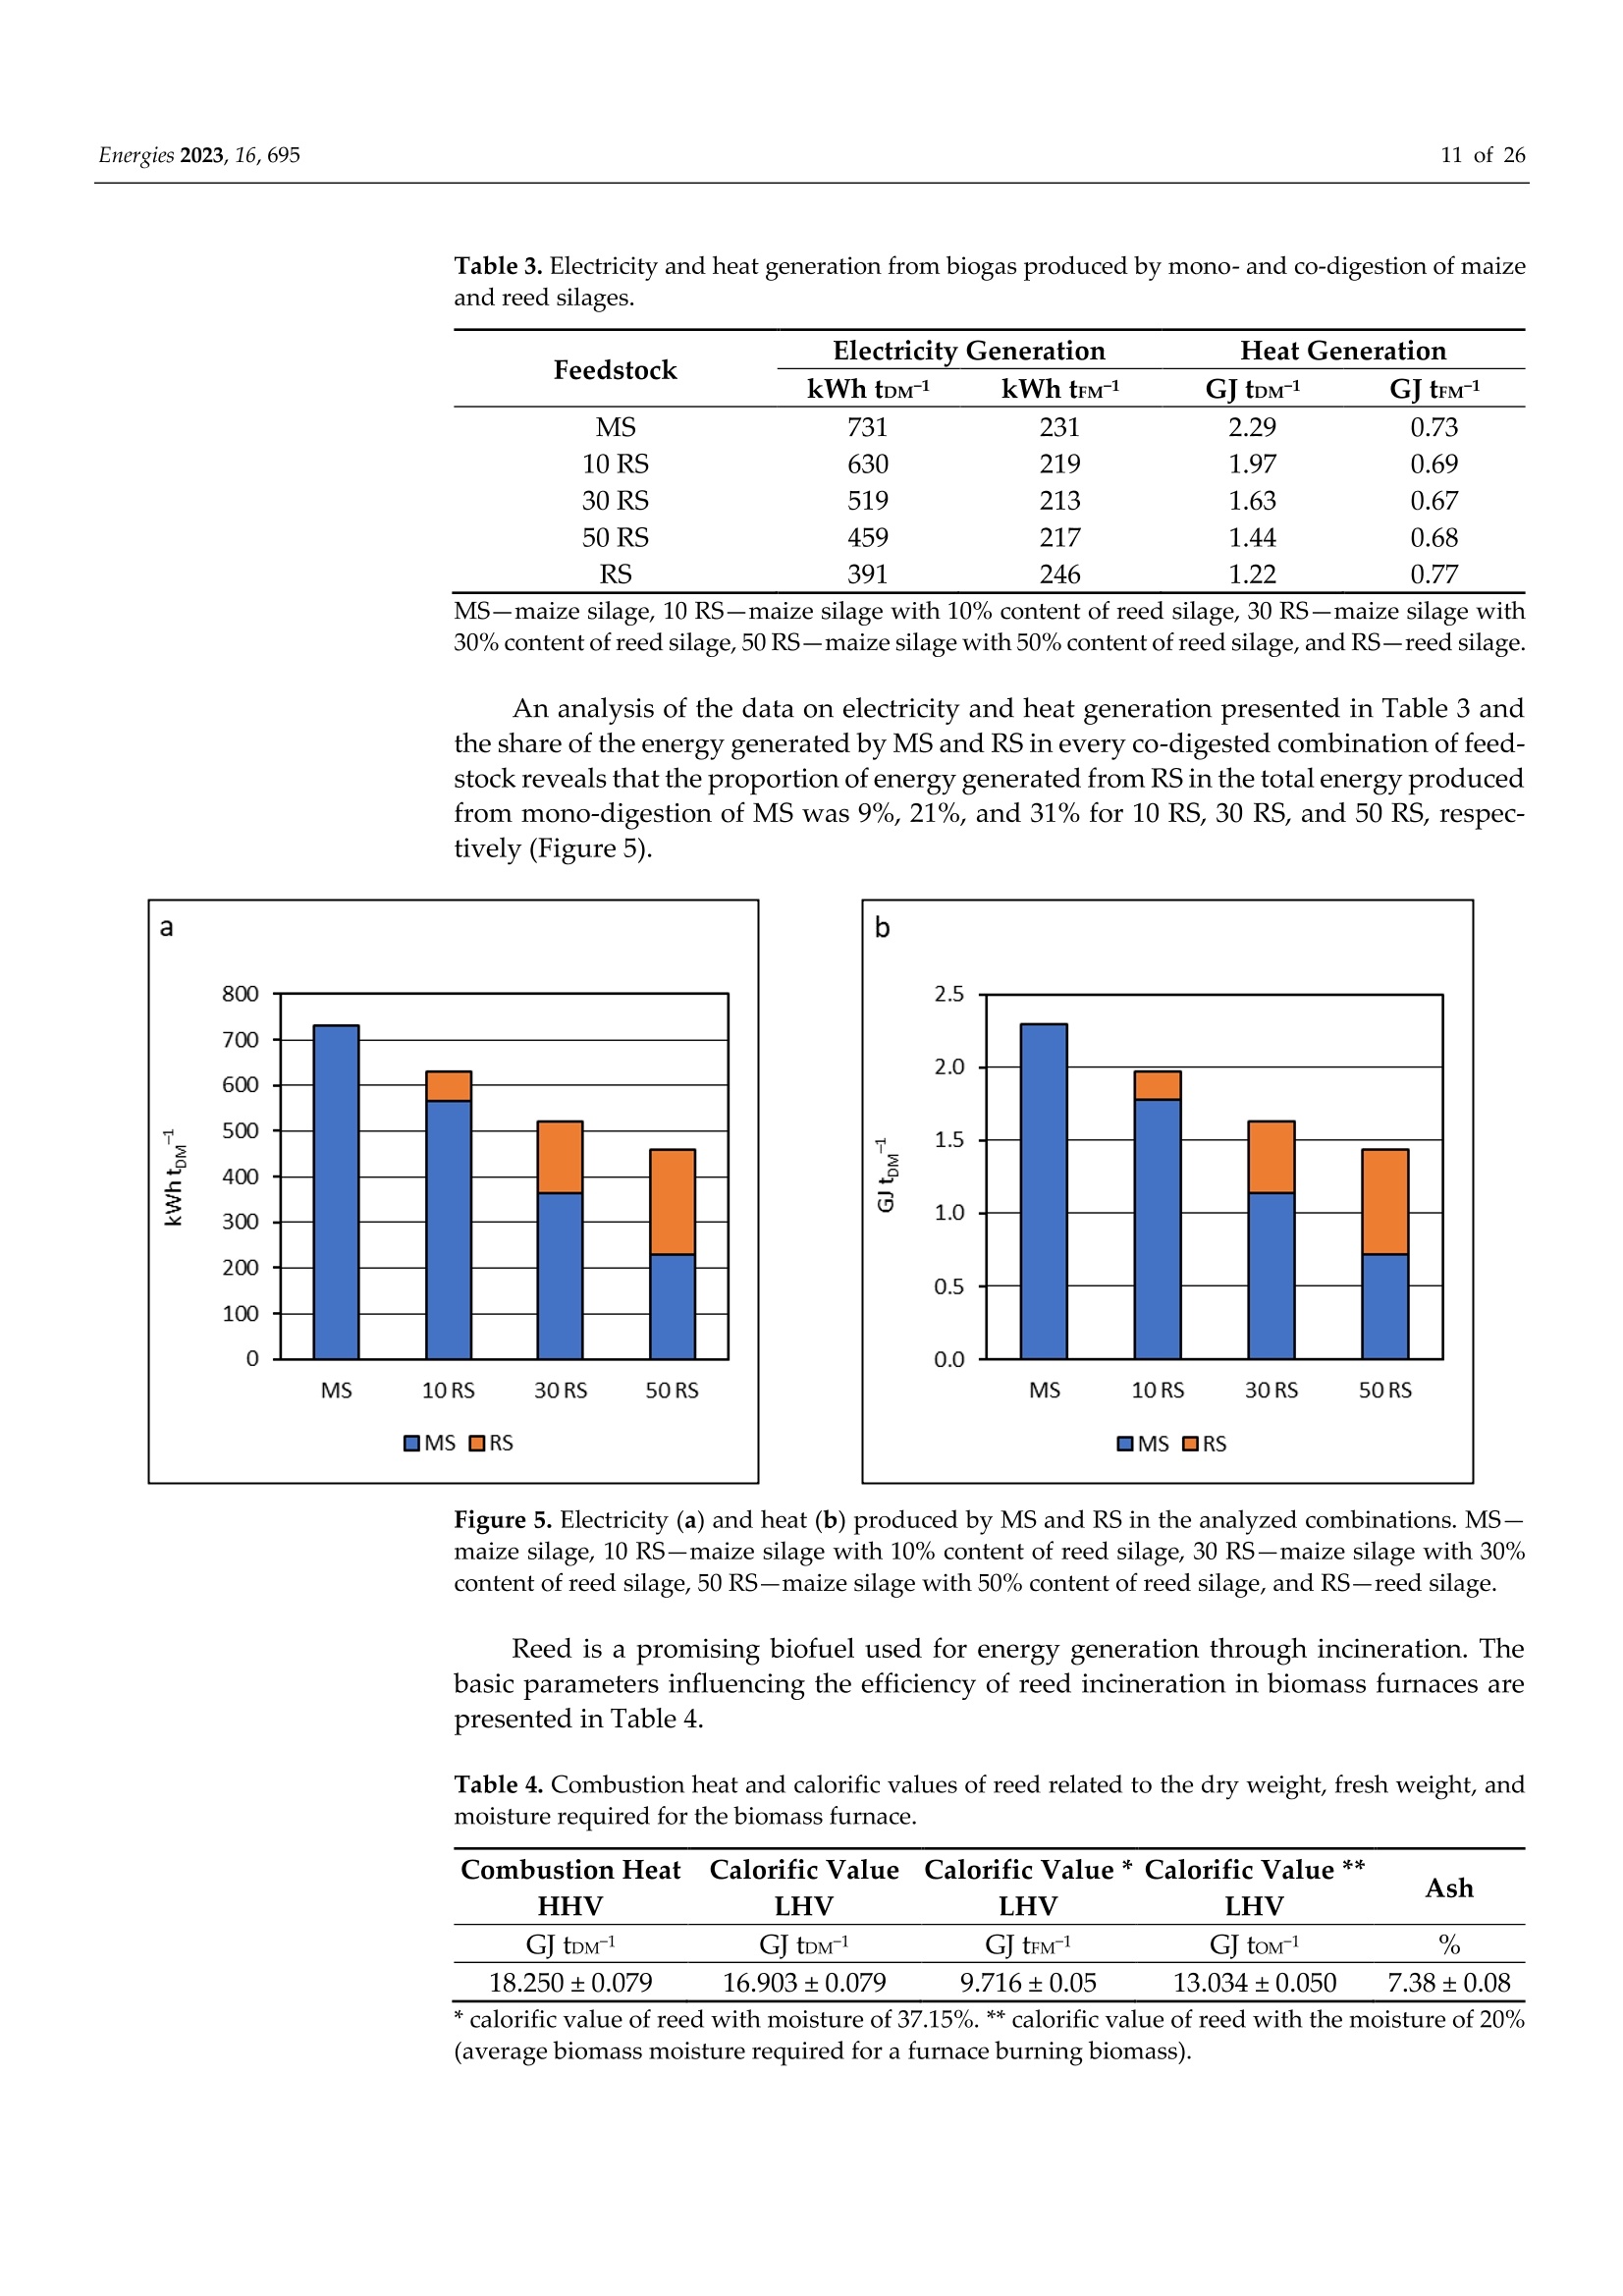
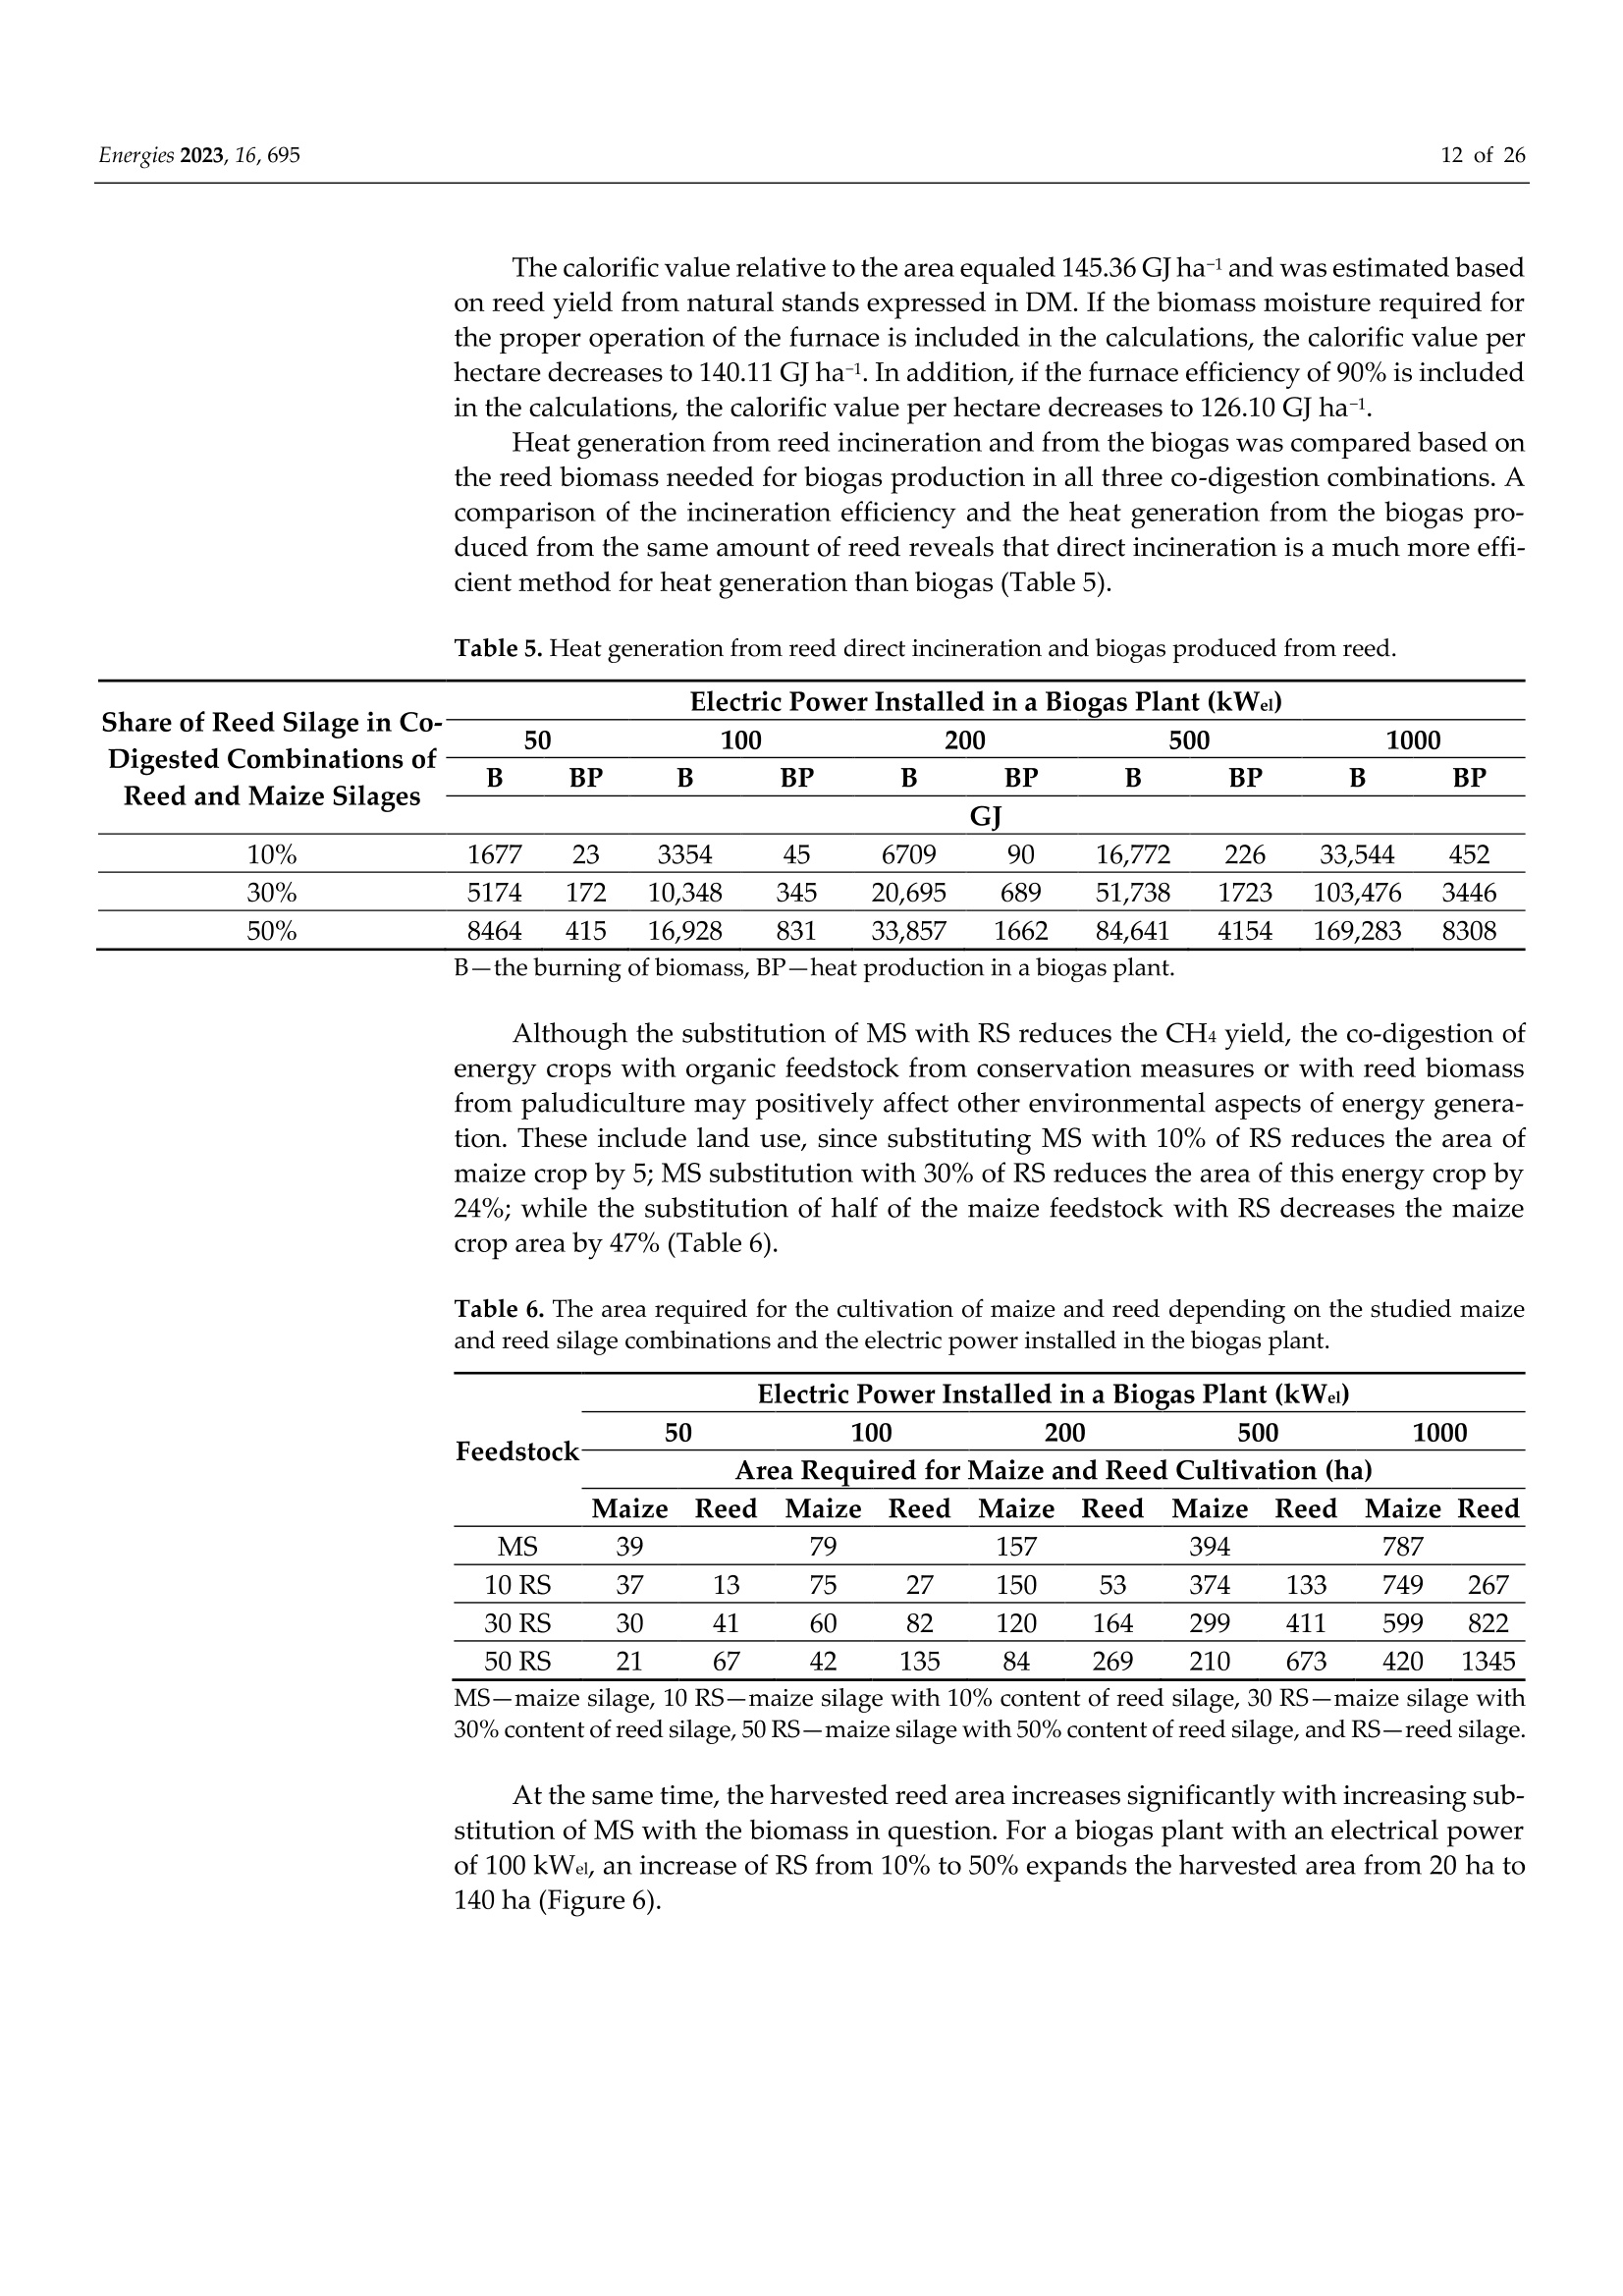
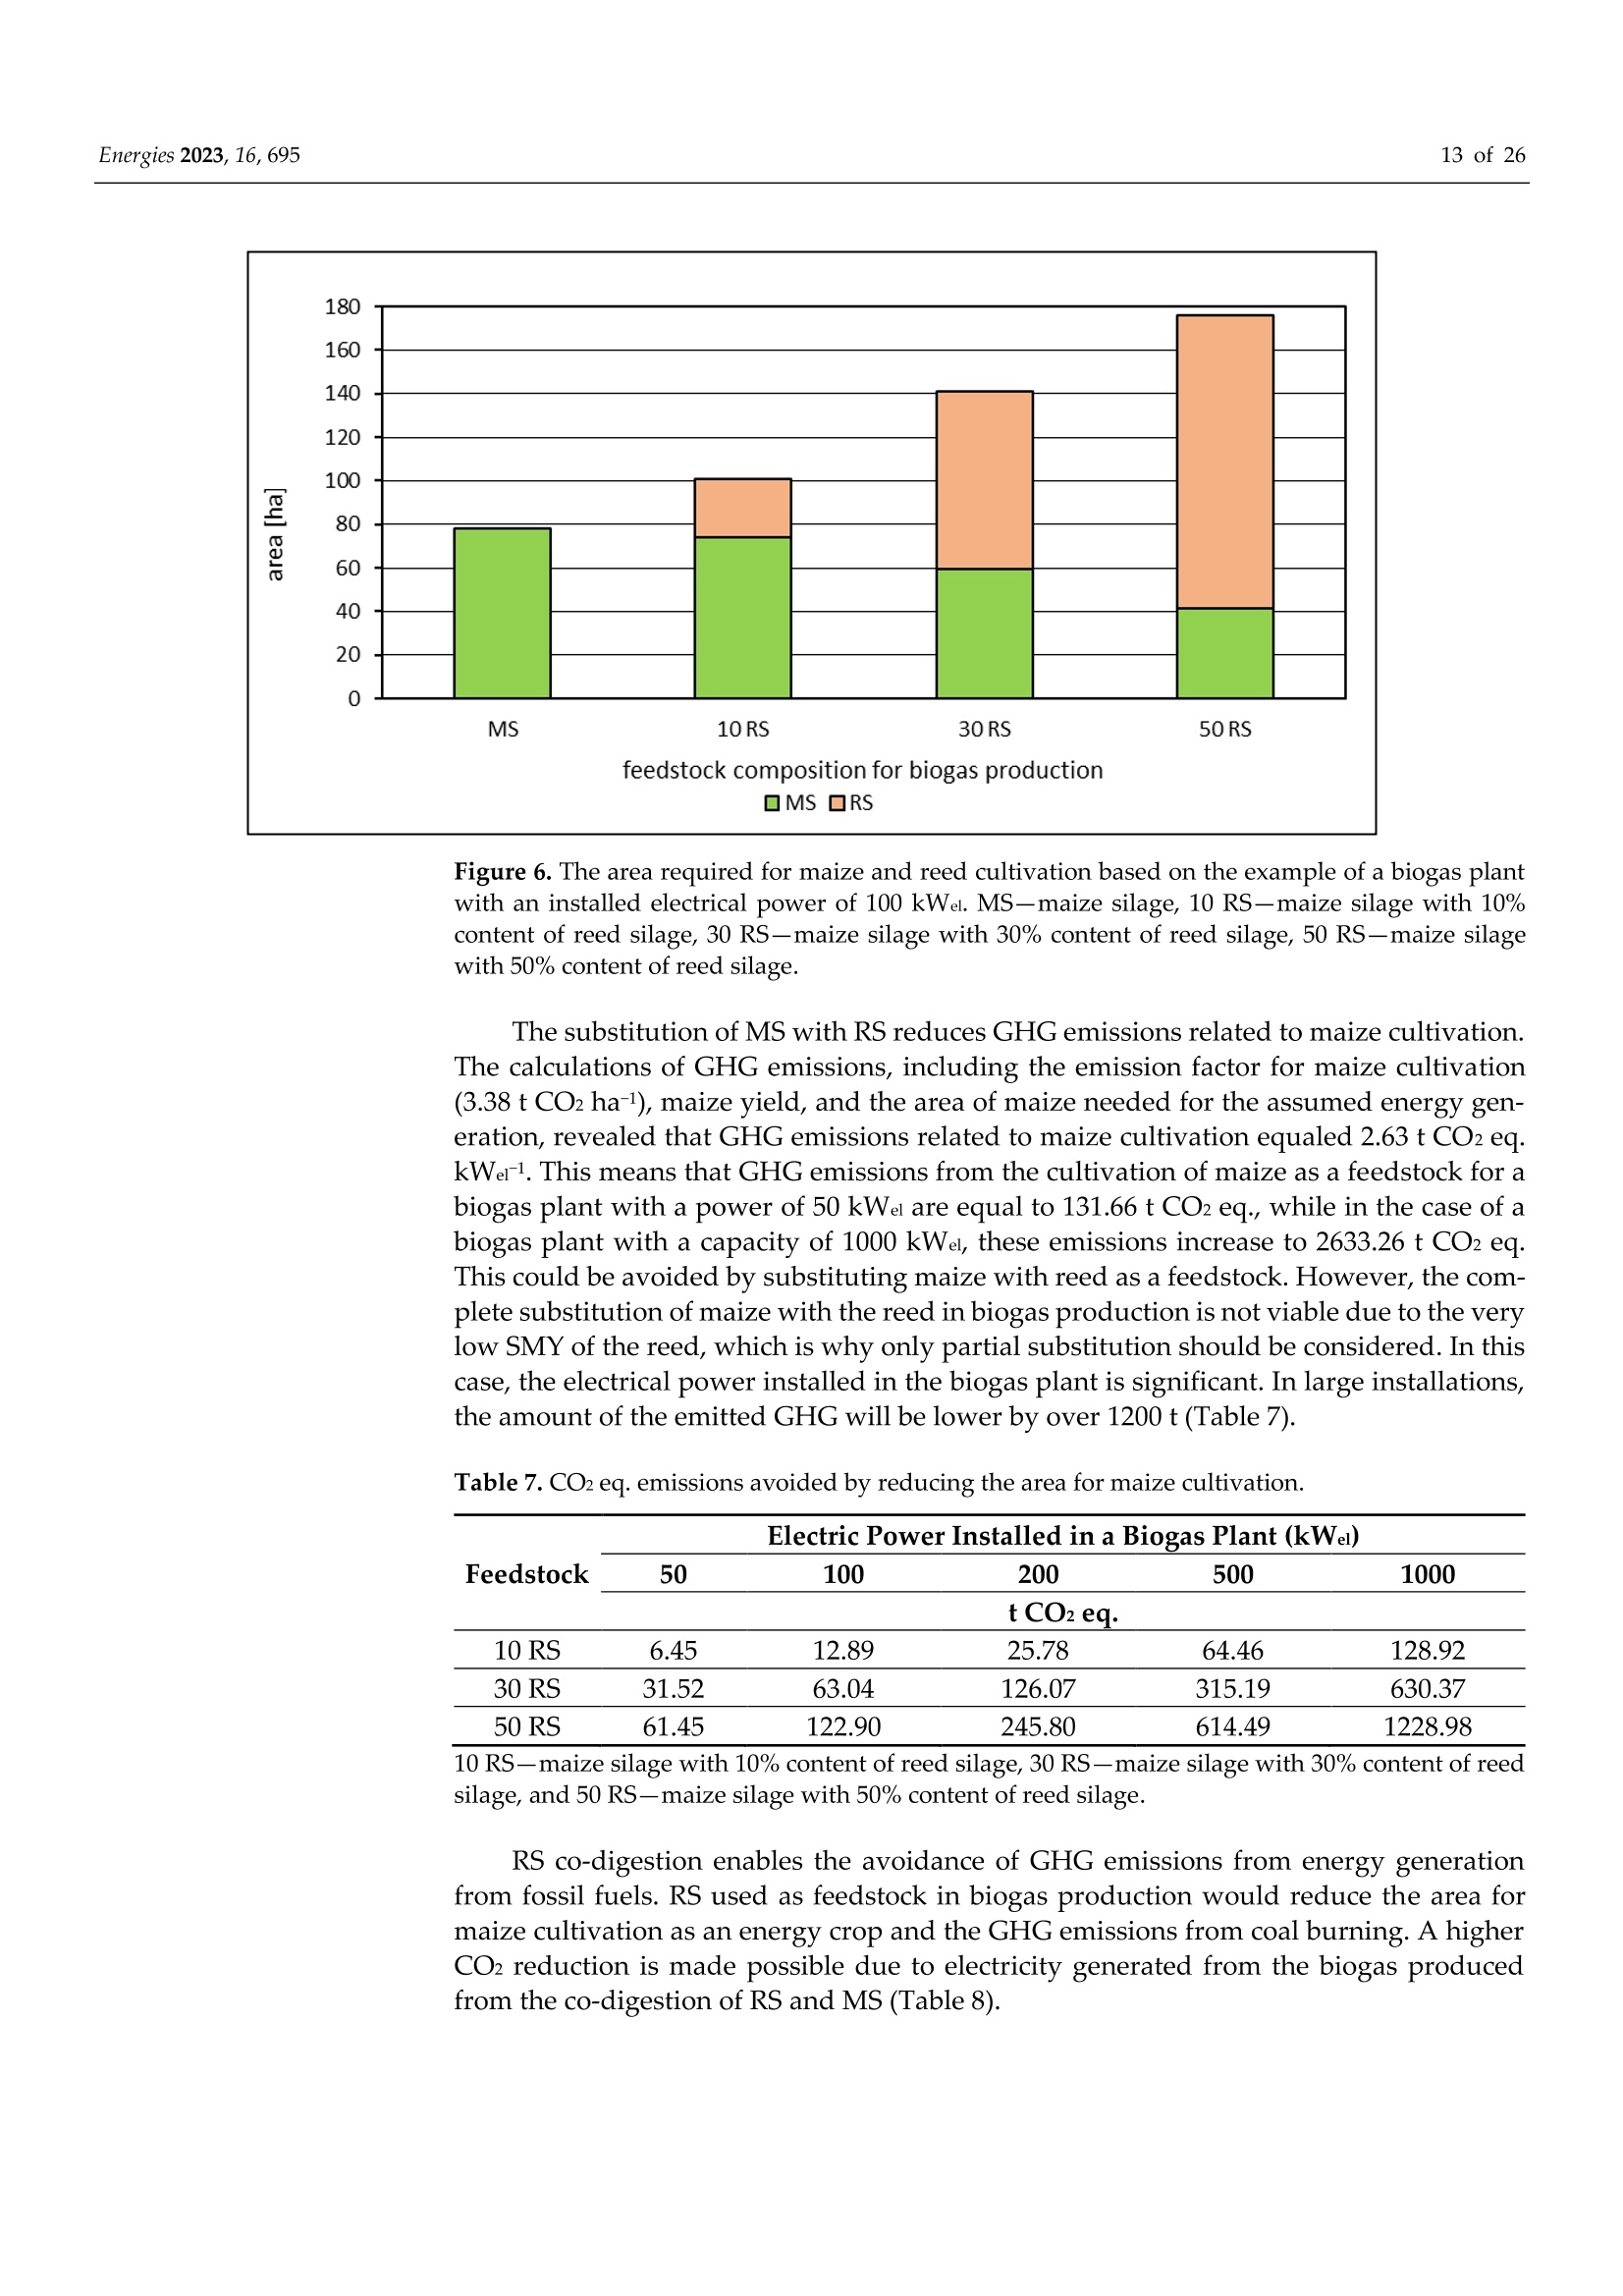
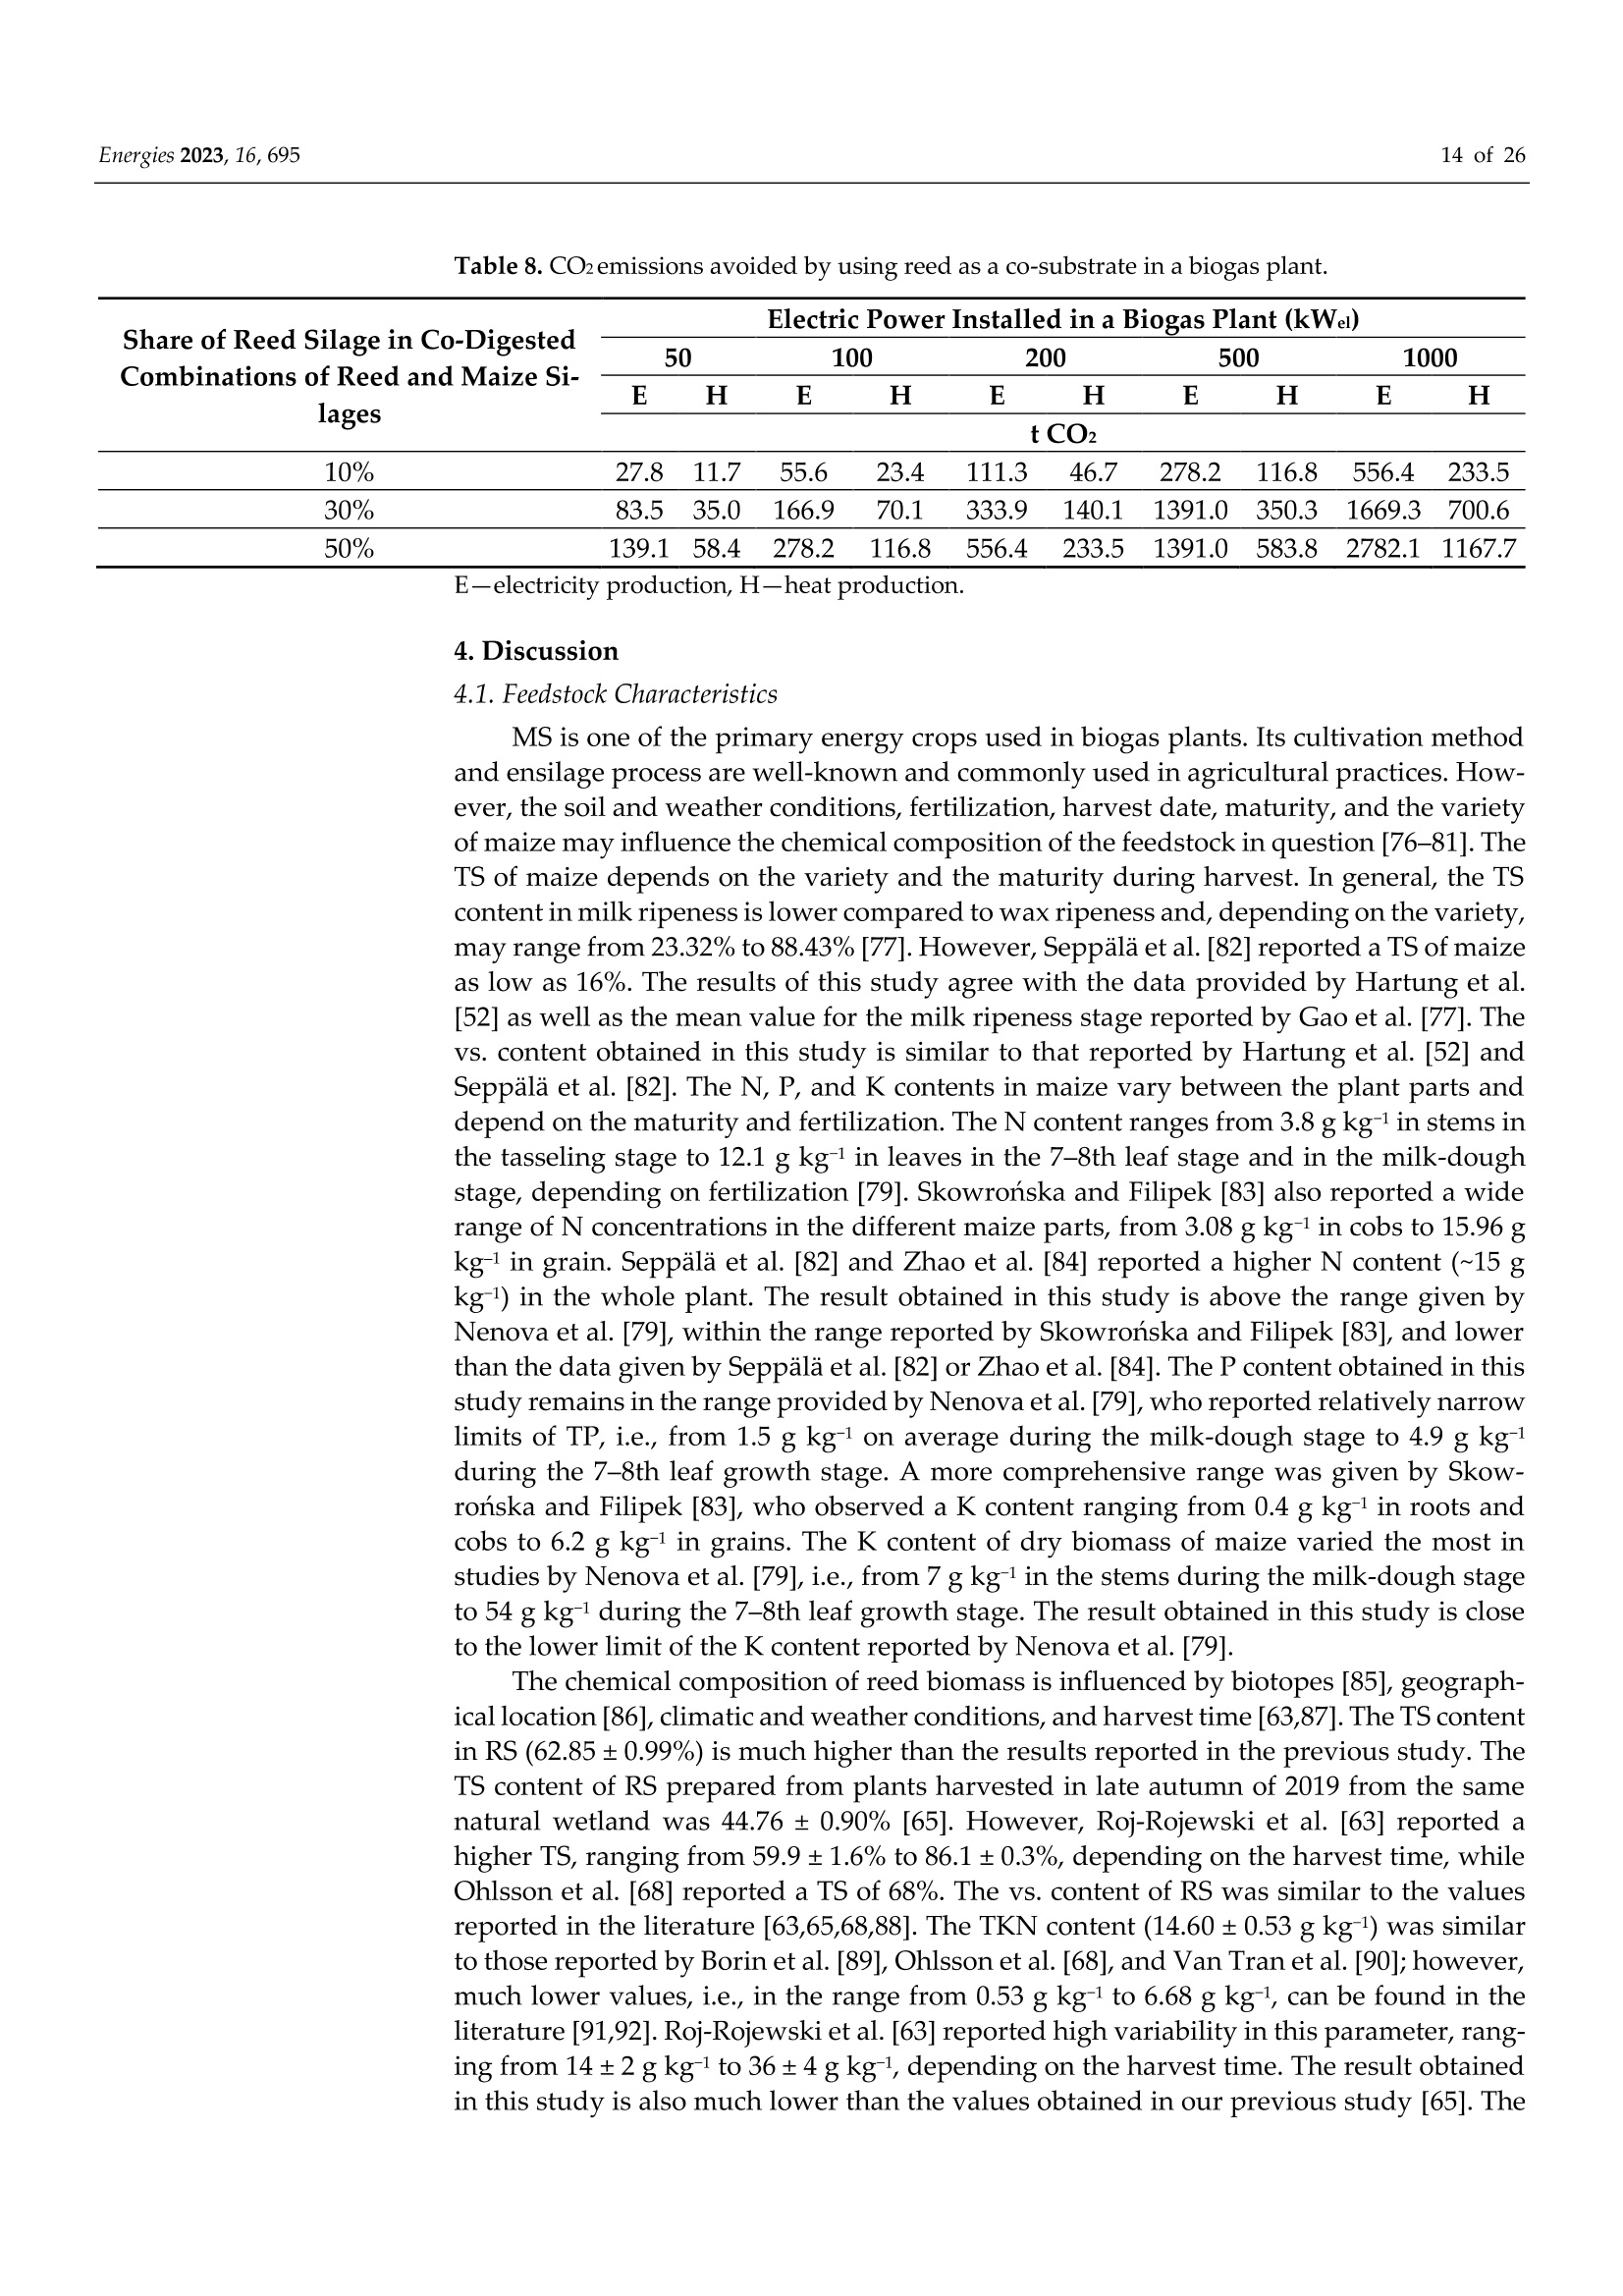
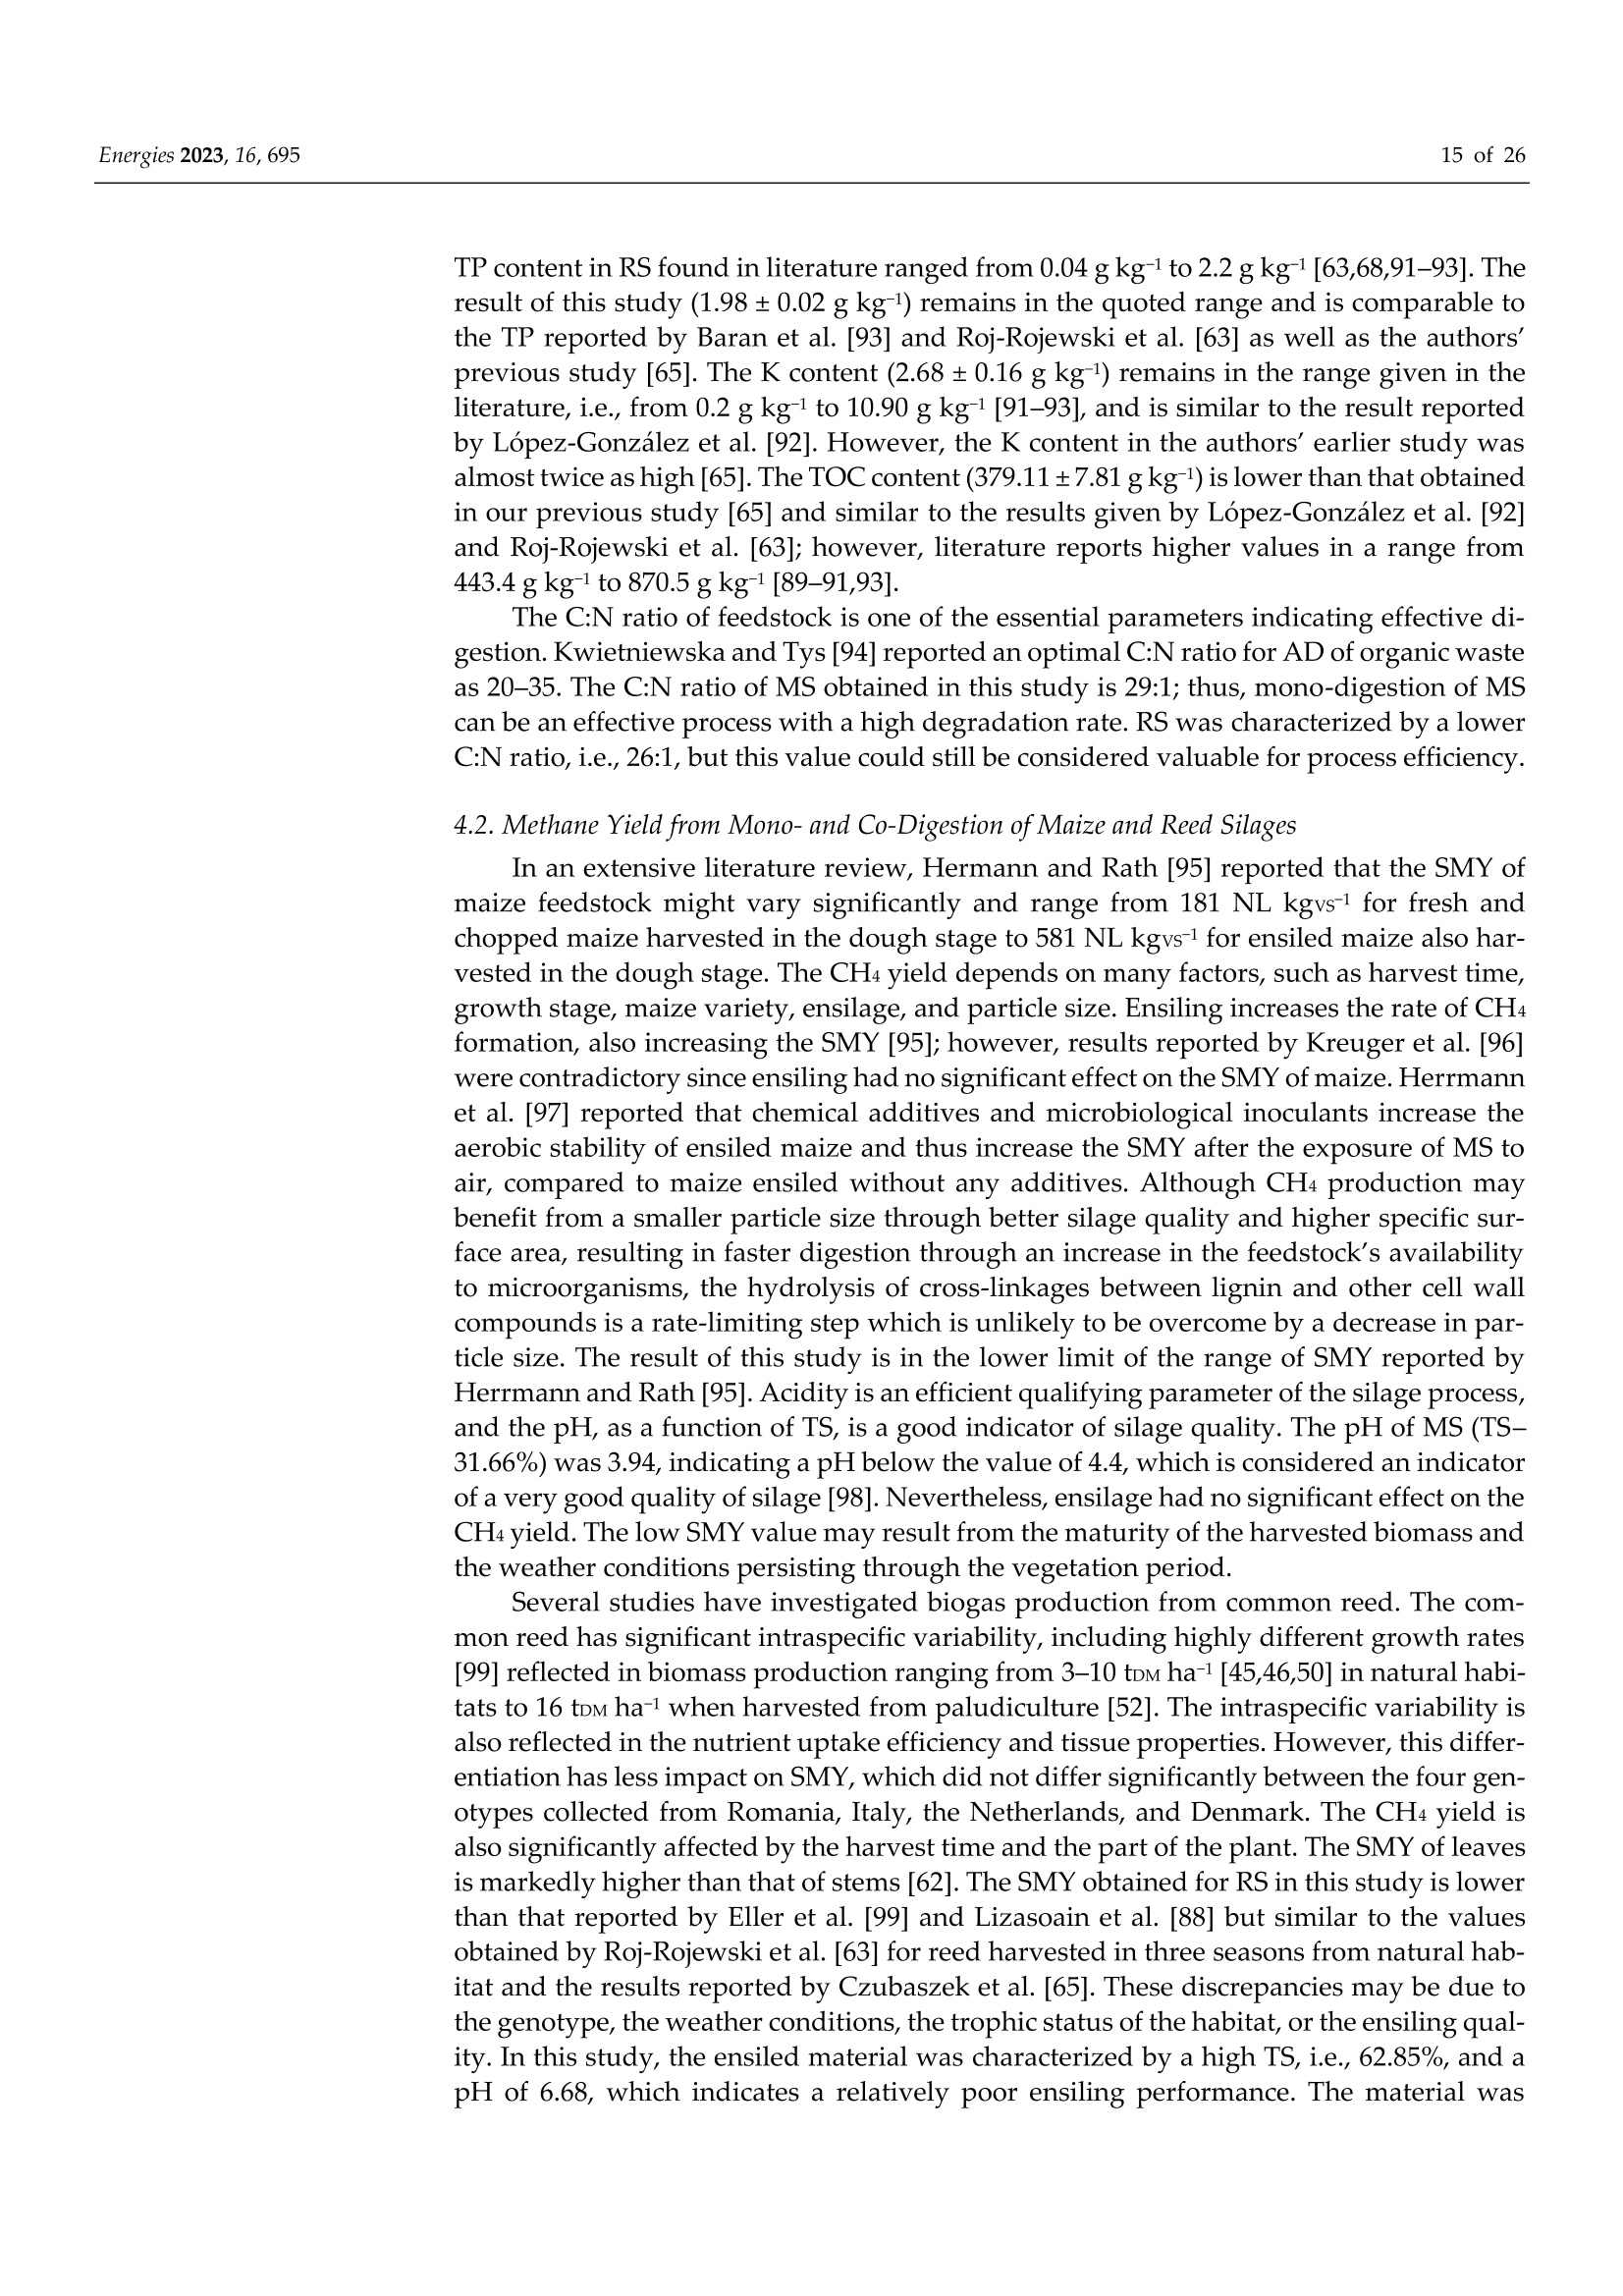
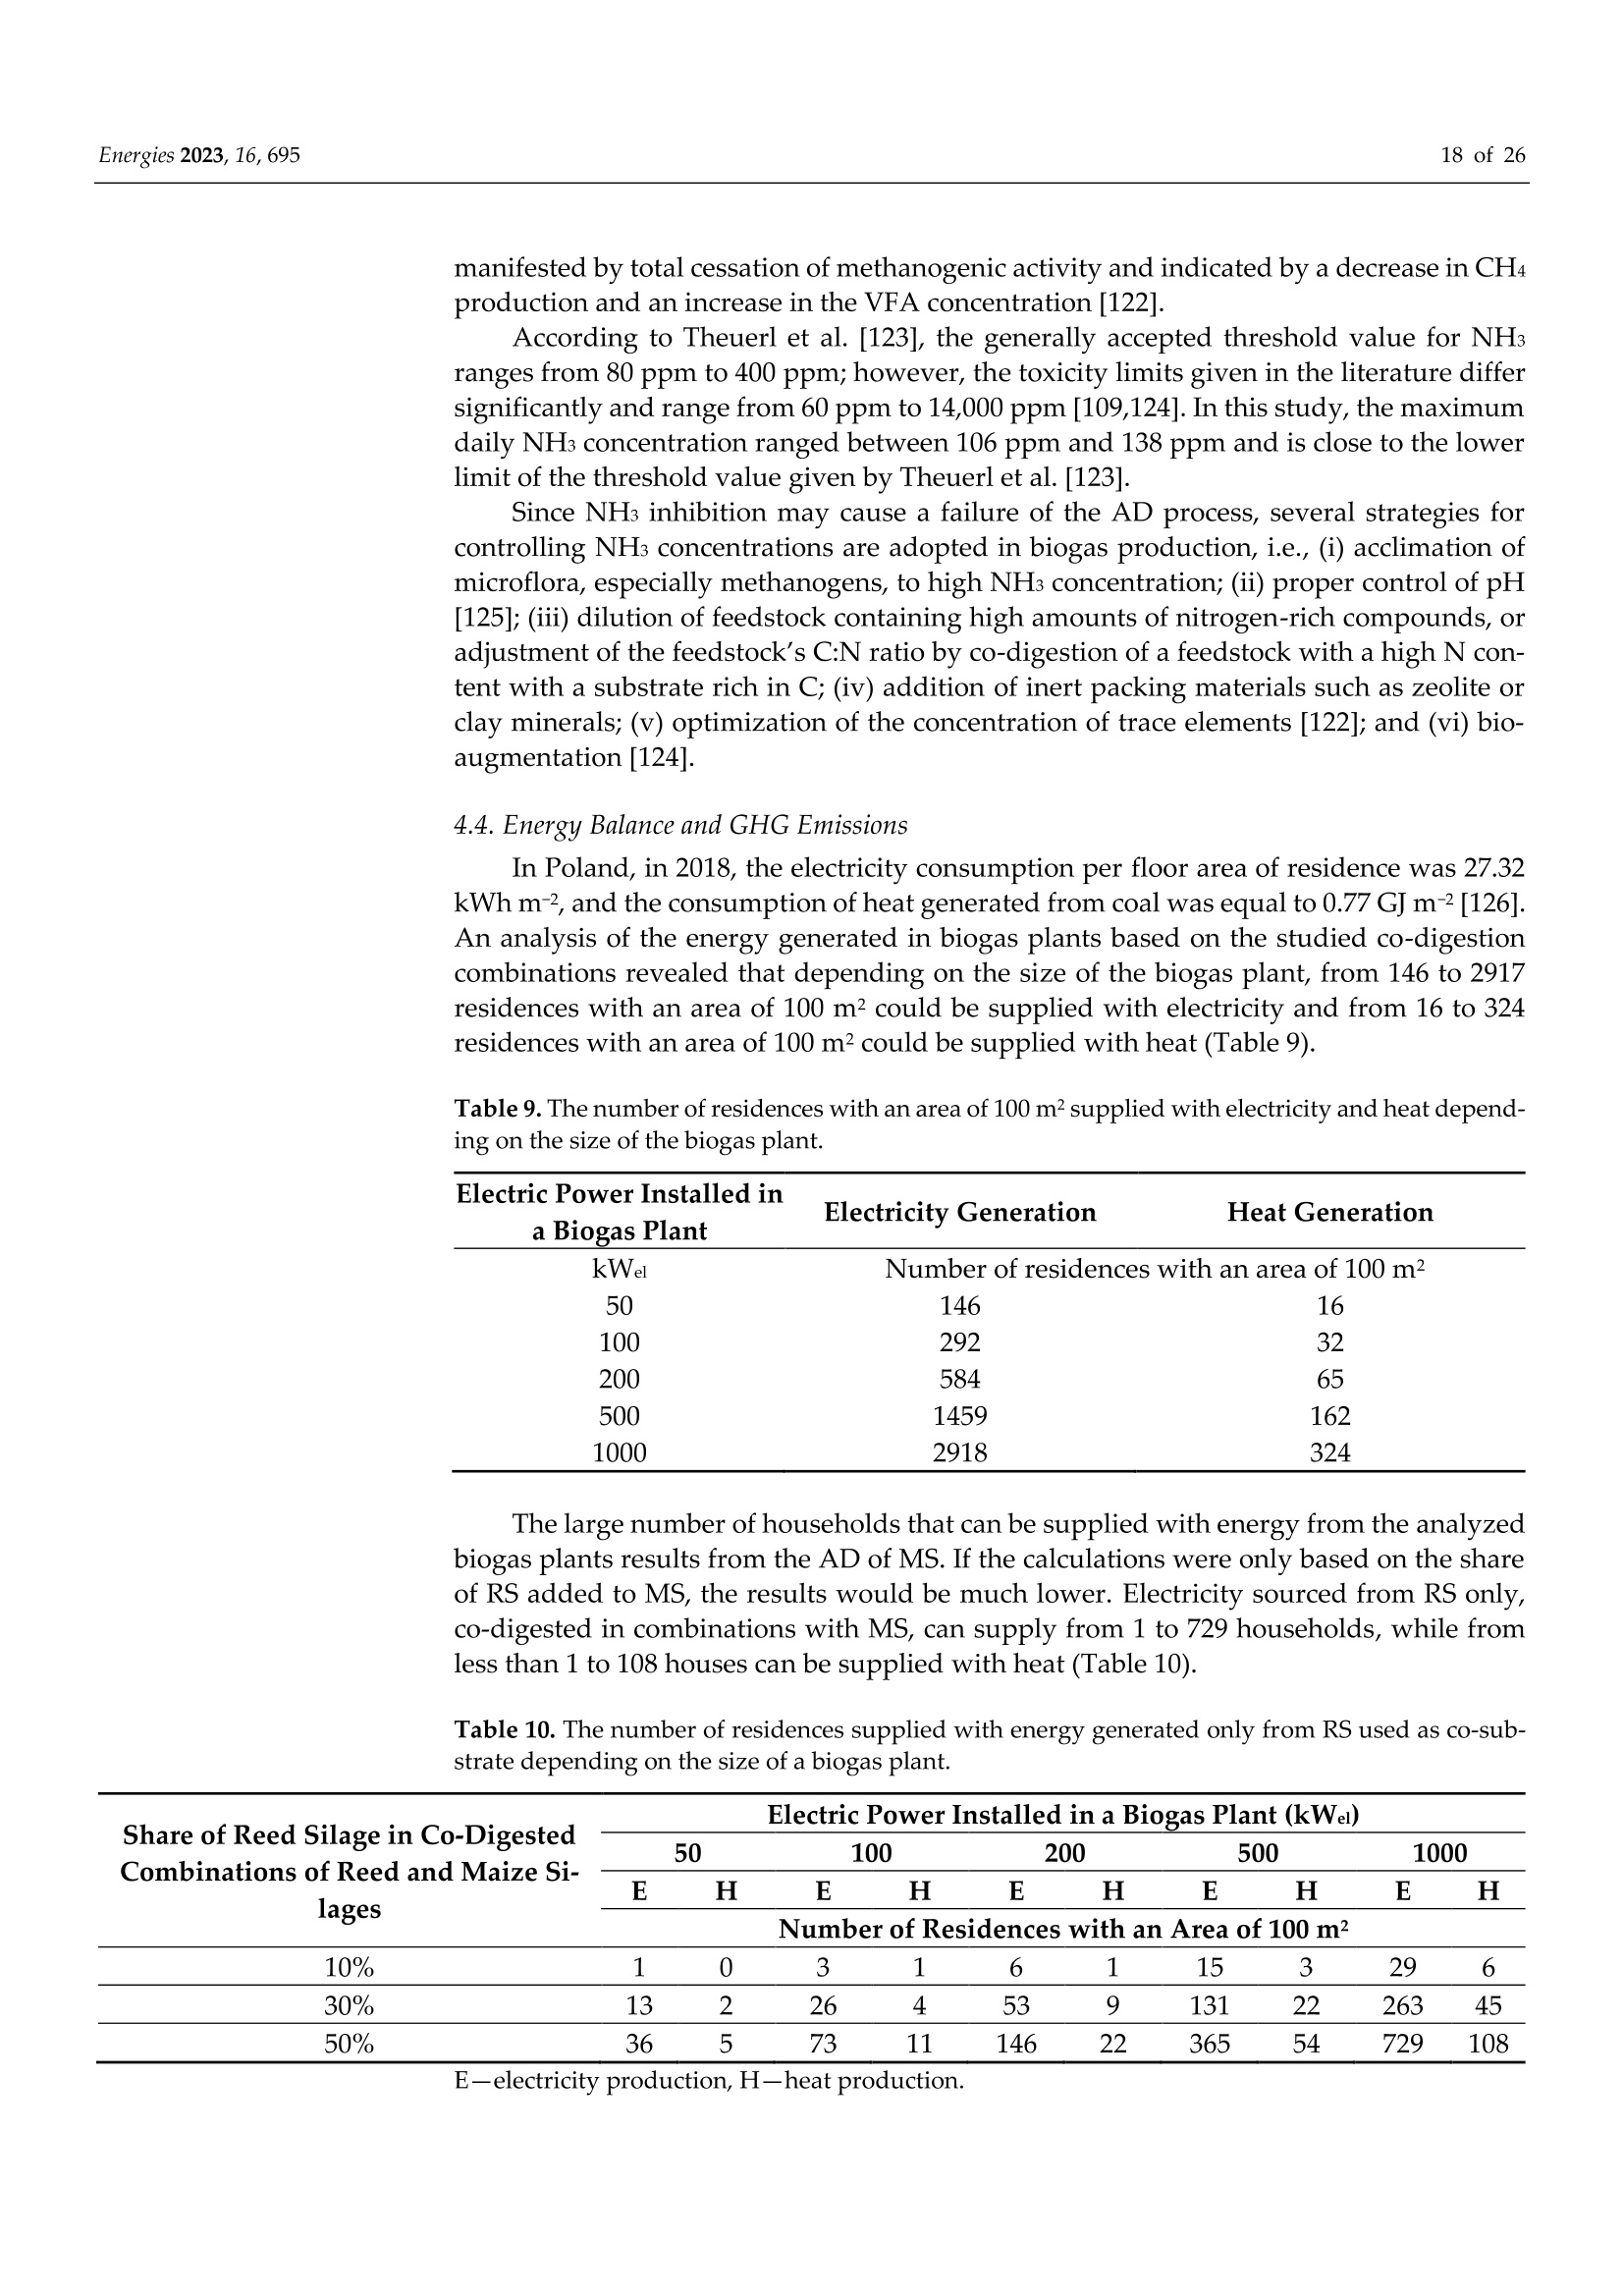
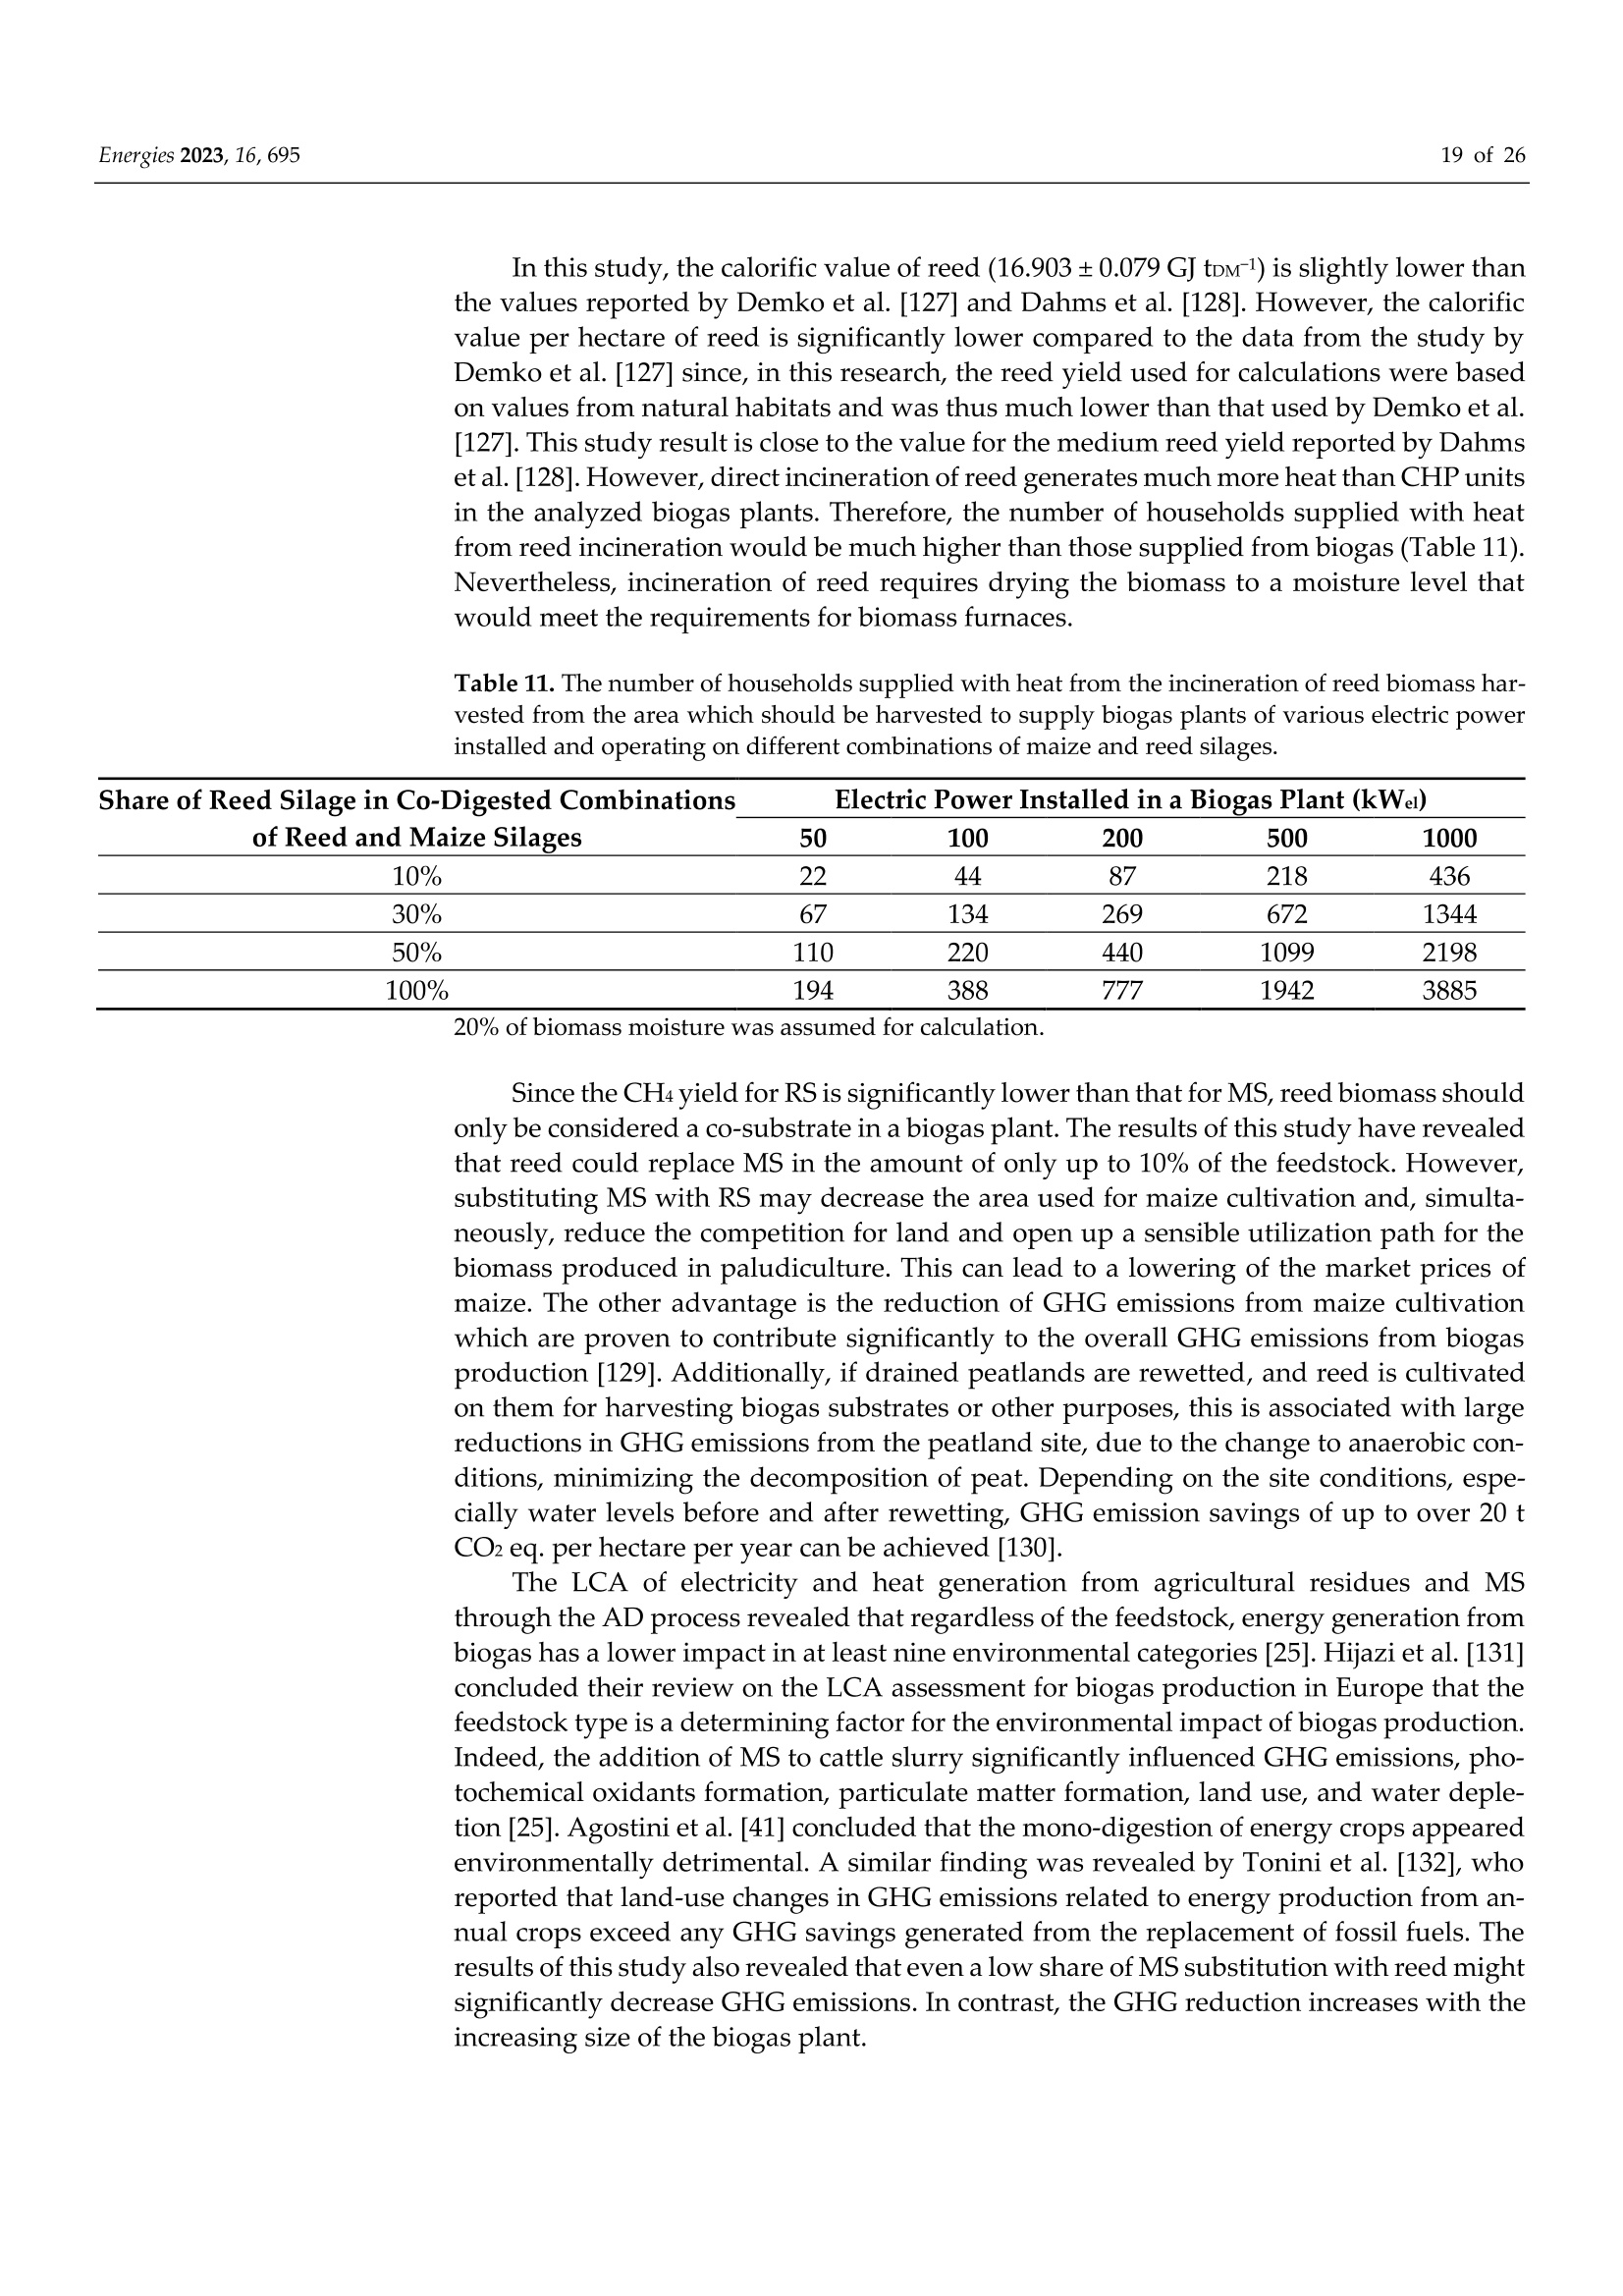

还剩24页未读,是否继续阅读?

产品配置单


中国格哈特为您提供《普通芦苇和玉米青贮生物质燃料中总凯氮的检测》,该方案主要用于生物质能中氮含量检测,参考标准--,《普通芦苇和玉米青贮生物质燃料中总凯氮的检测》用到的仪器有格哈特带自动进样器凯氏定氮仪VAP500C、格哈特凯氏消化系统KT8S、格哈特维克松废气实验室废物处理系统涤气VS、德国加液器MM、凯氏定氮催化片
推荐专场
定氮仪、凯氏定氮仪、Dumas定氮仪
更多

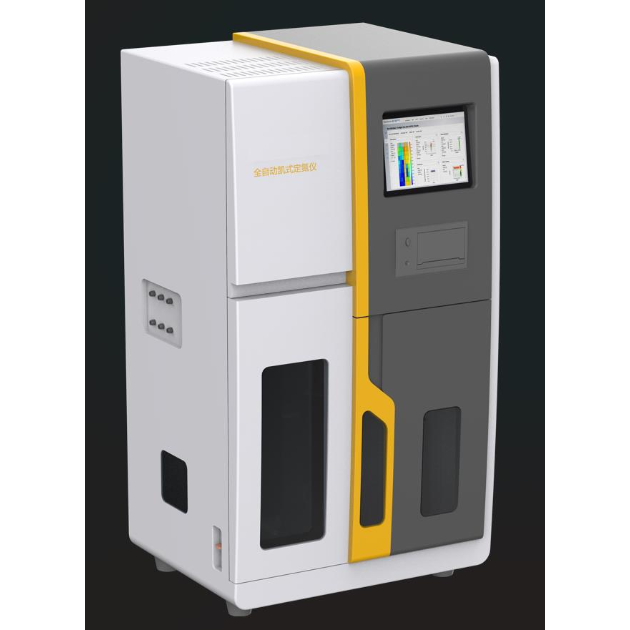
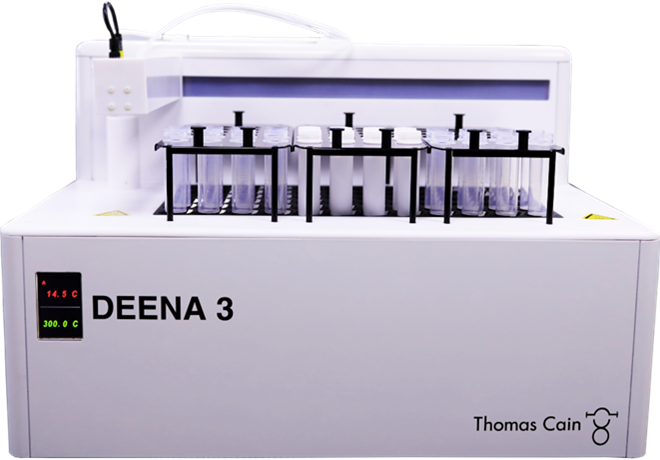
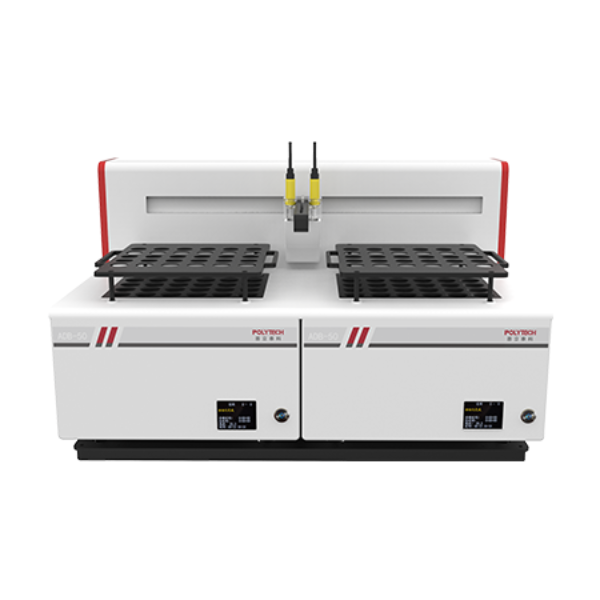
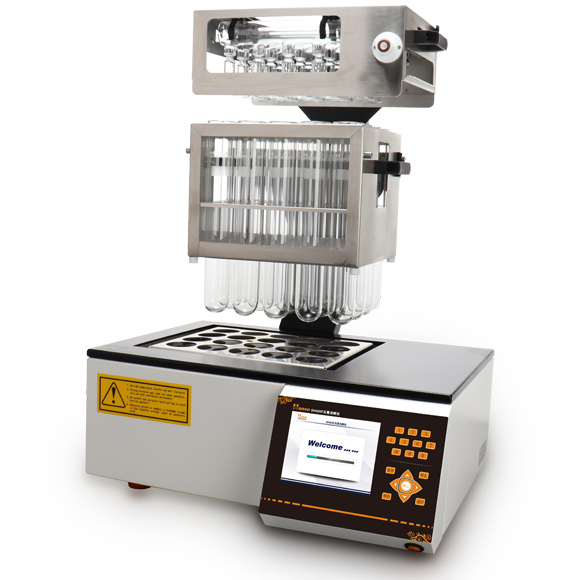
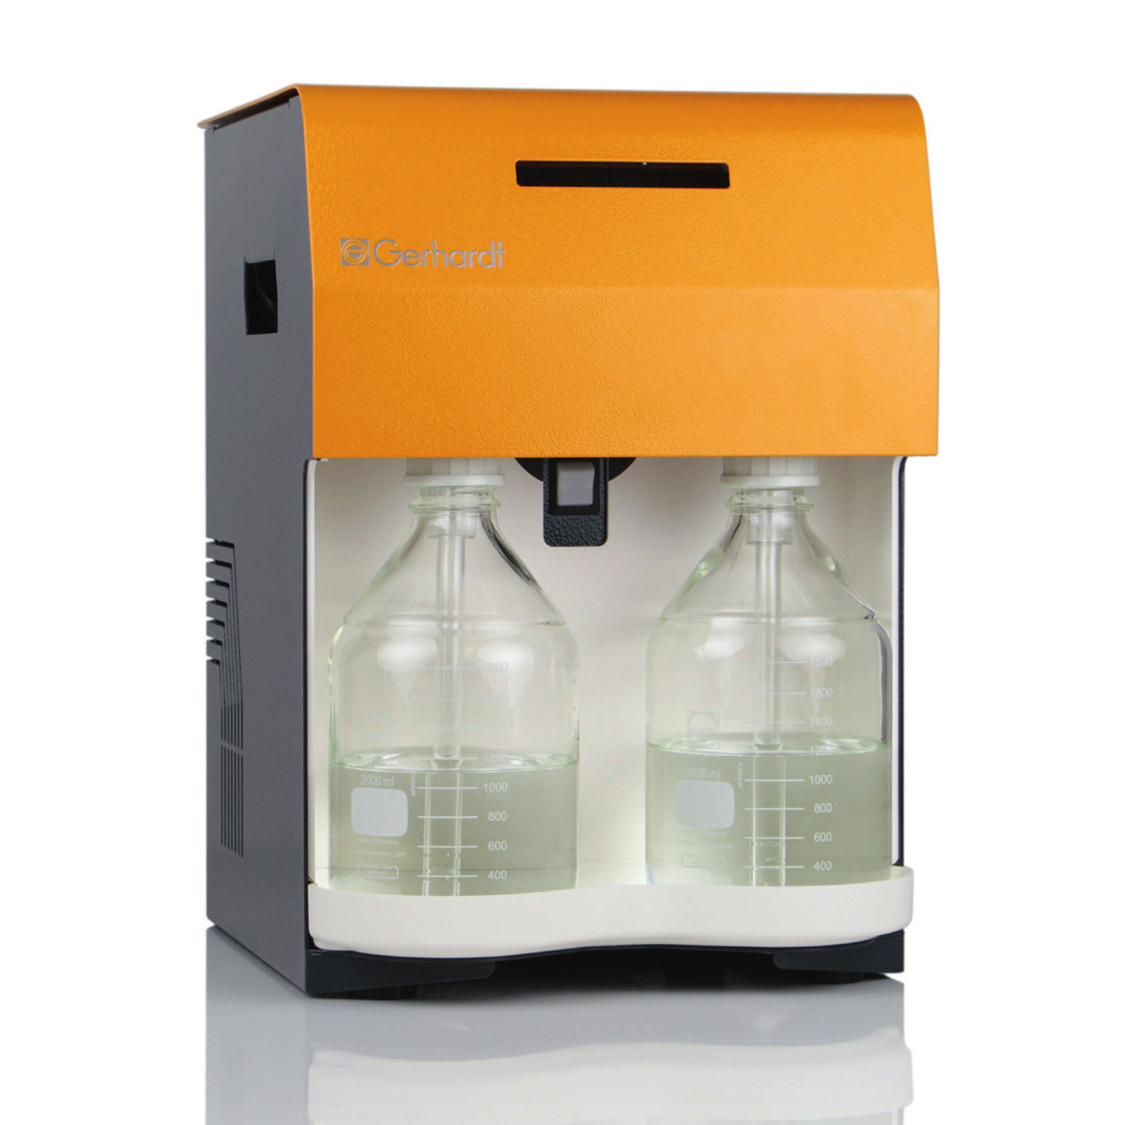
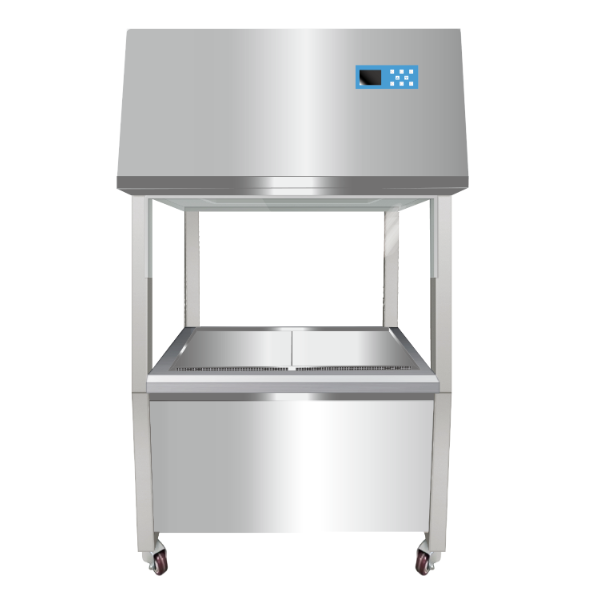
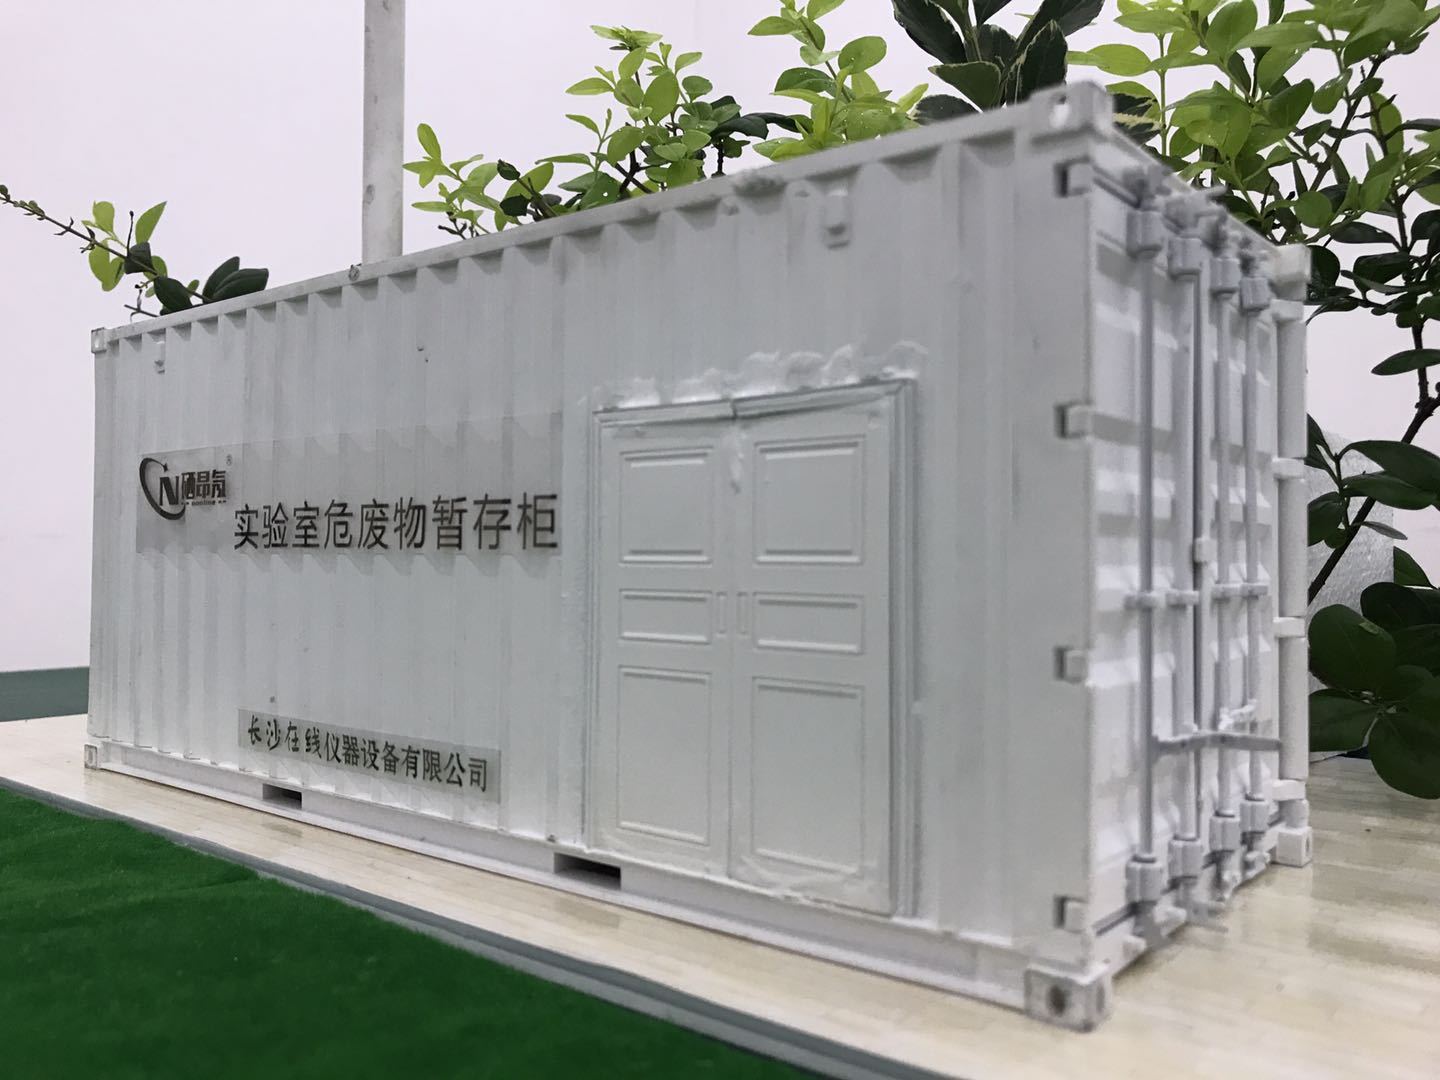
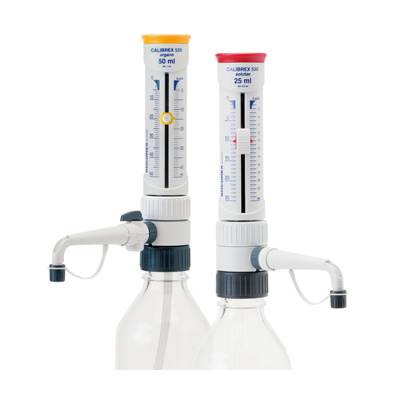

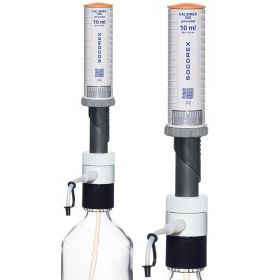
相关方案
更多