


方案详情
文
本研究提出了一种跟踪水稻品质差异的协同策略将深度学习和机器学习理论相结合,提高融合系统的检测性能。与传统的特征挖掘和识别方法相比,CNN提取融合特征有效,基于GEELM的分类性能达到98.07%。总之,CNN-GE-ELM被证明是一种有效的分析技术,以改善融合系统的检测性能,实现了对质量差异的高精度识别大米。
方案详情

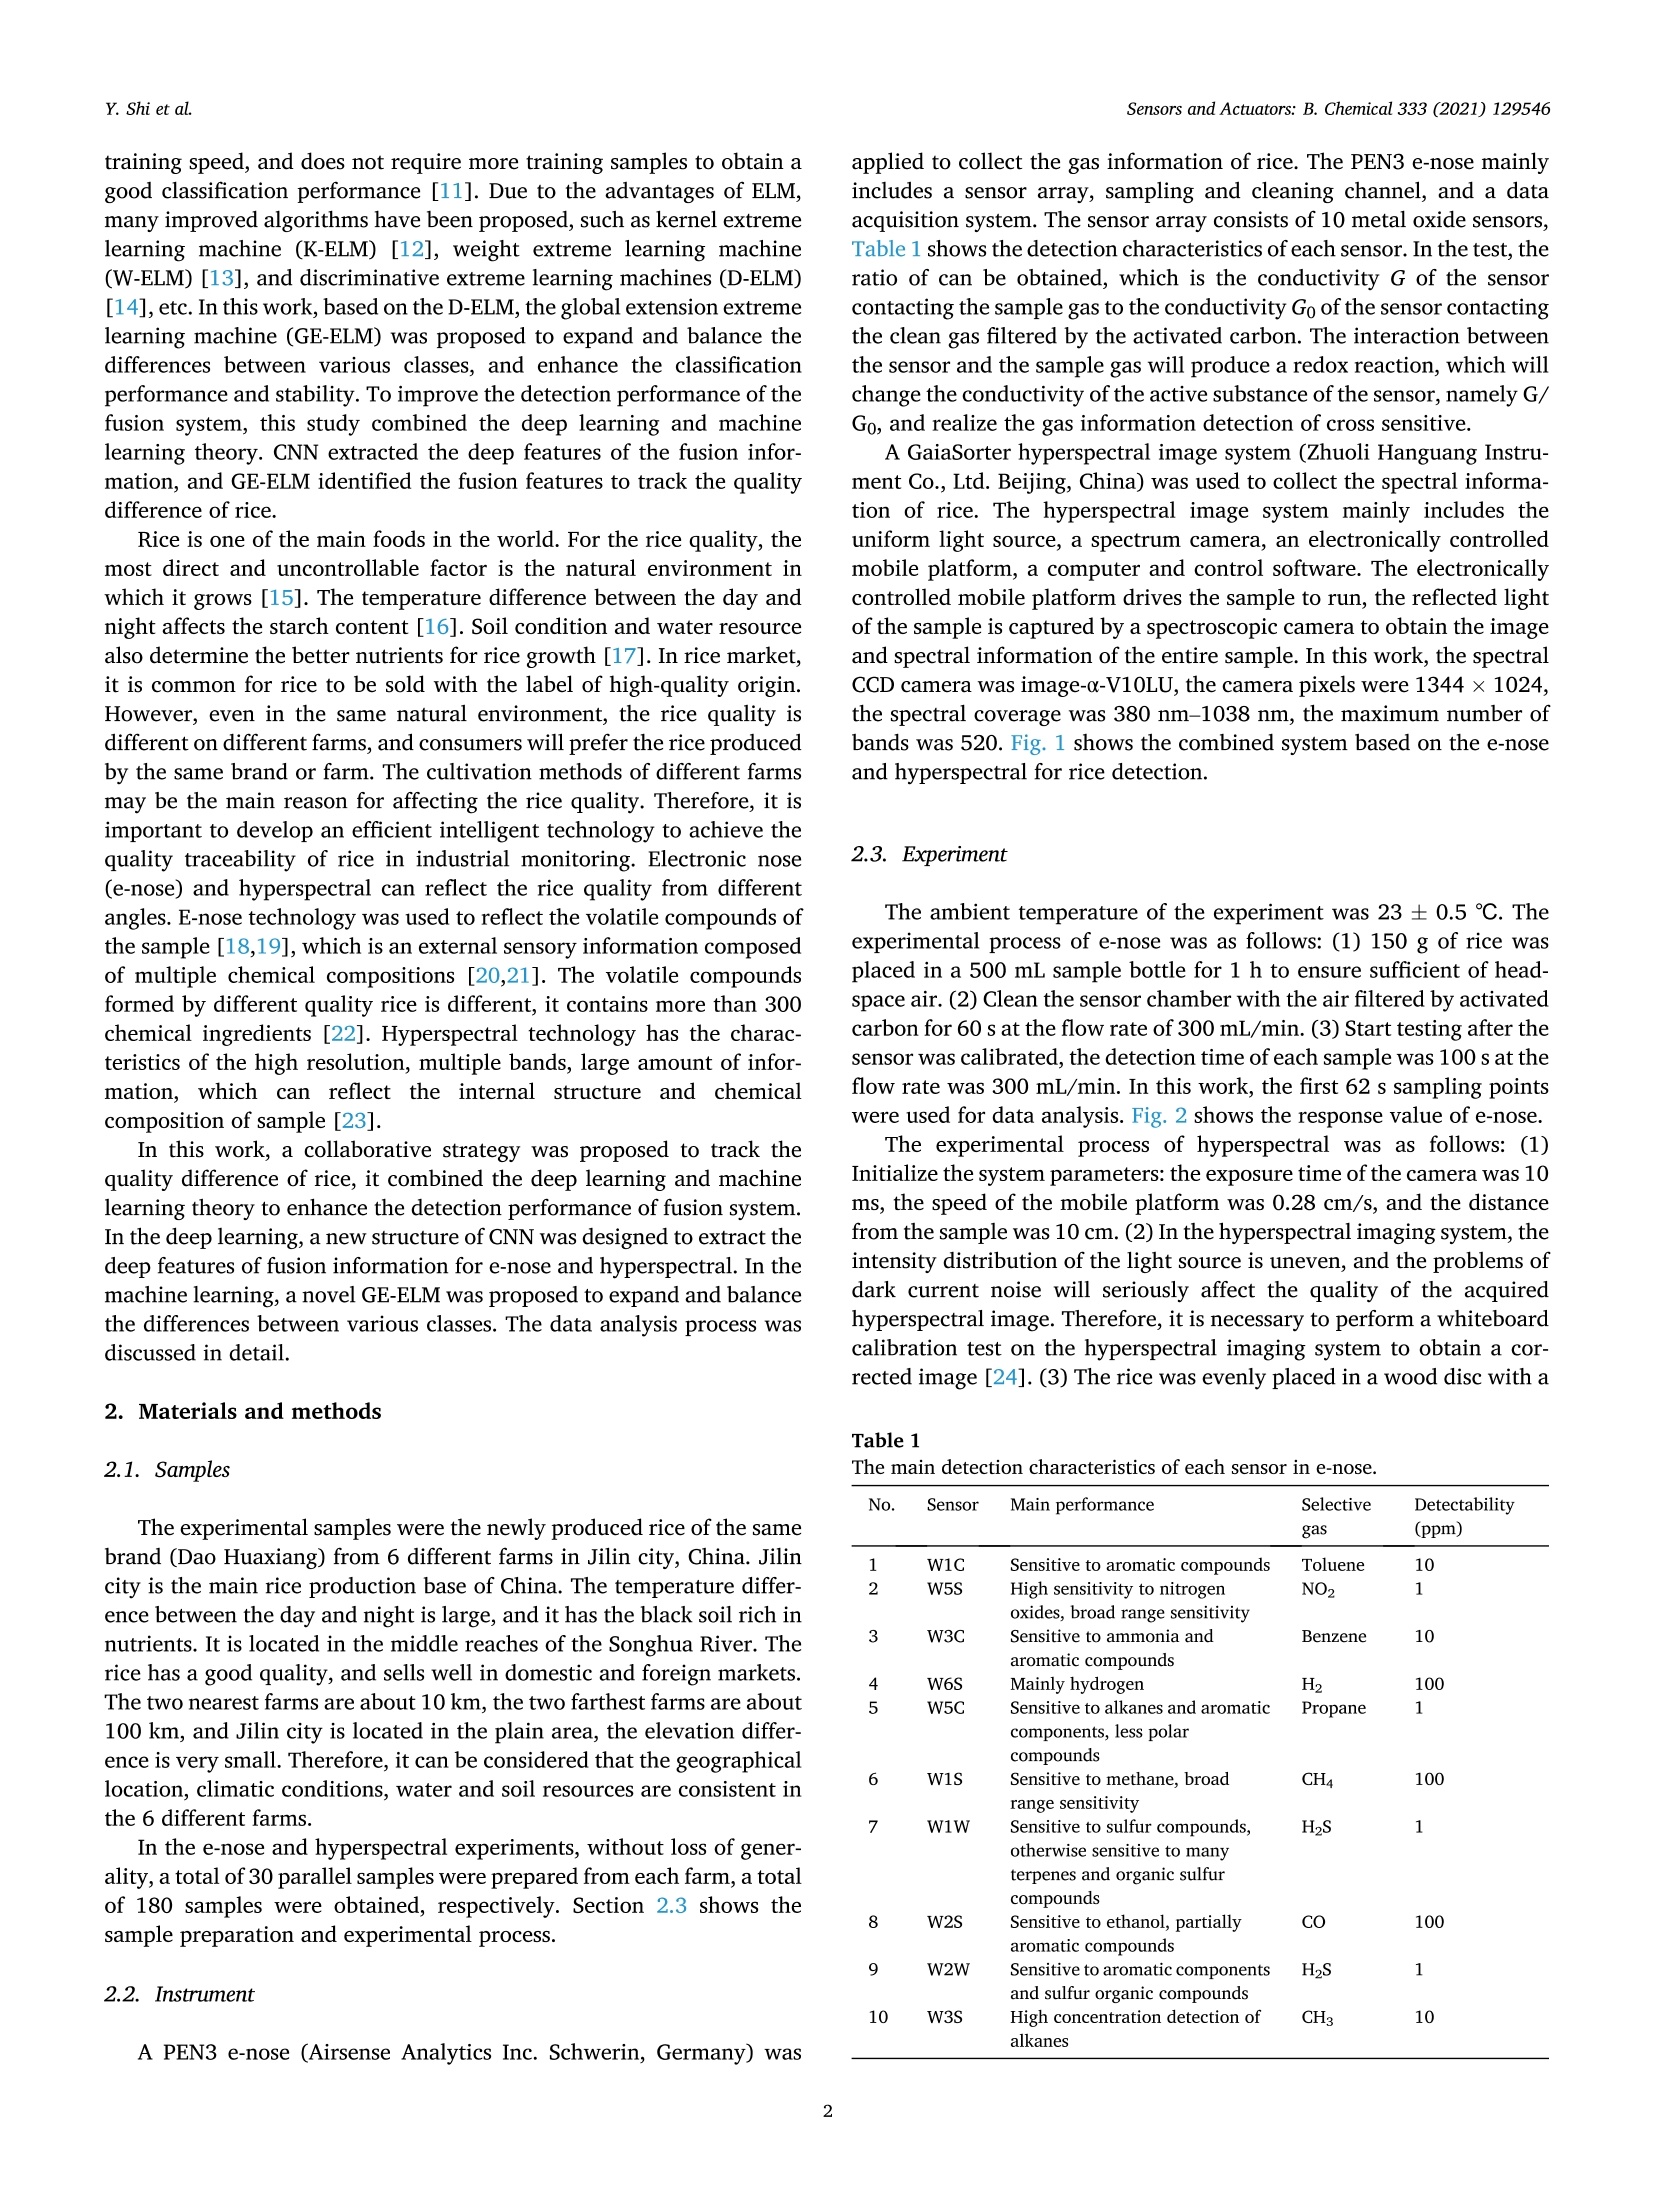
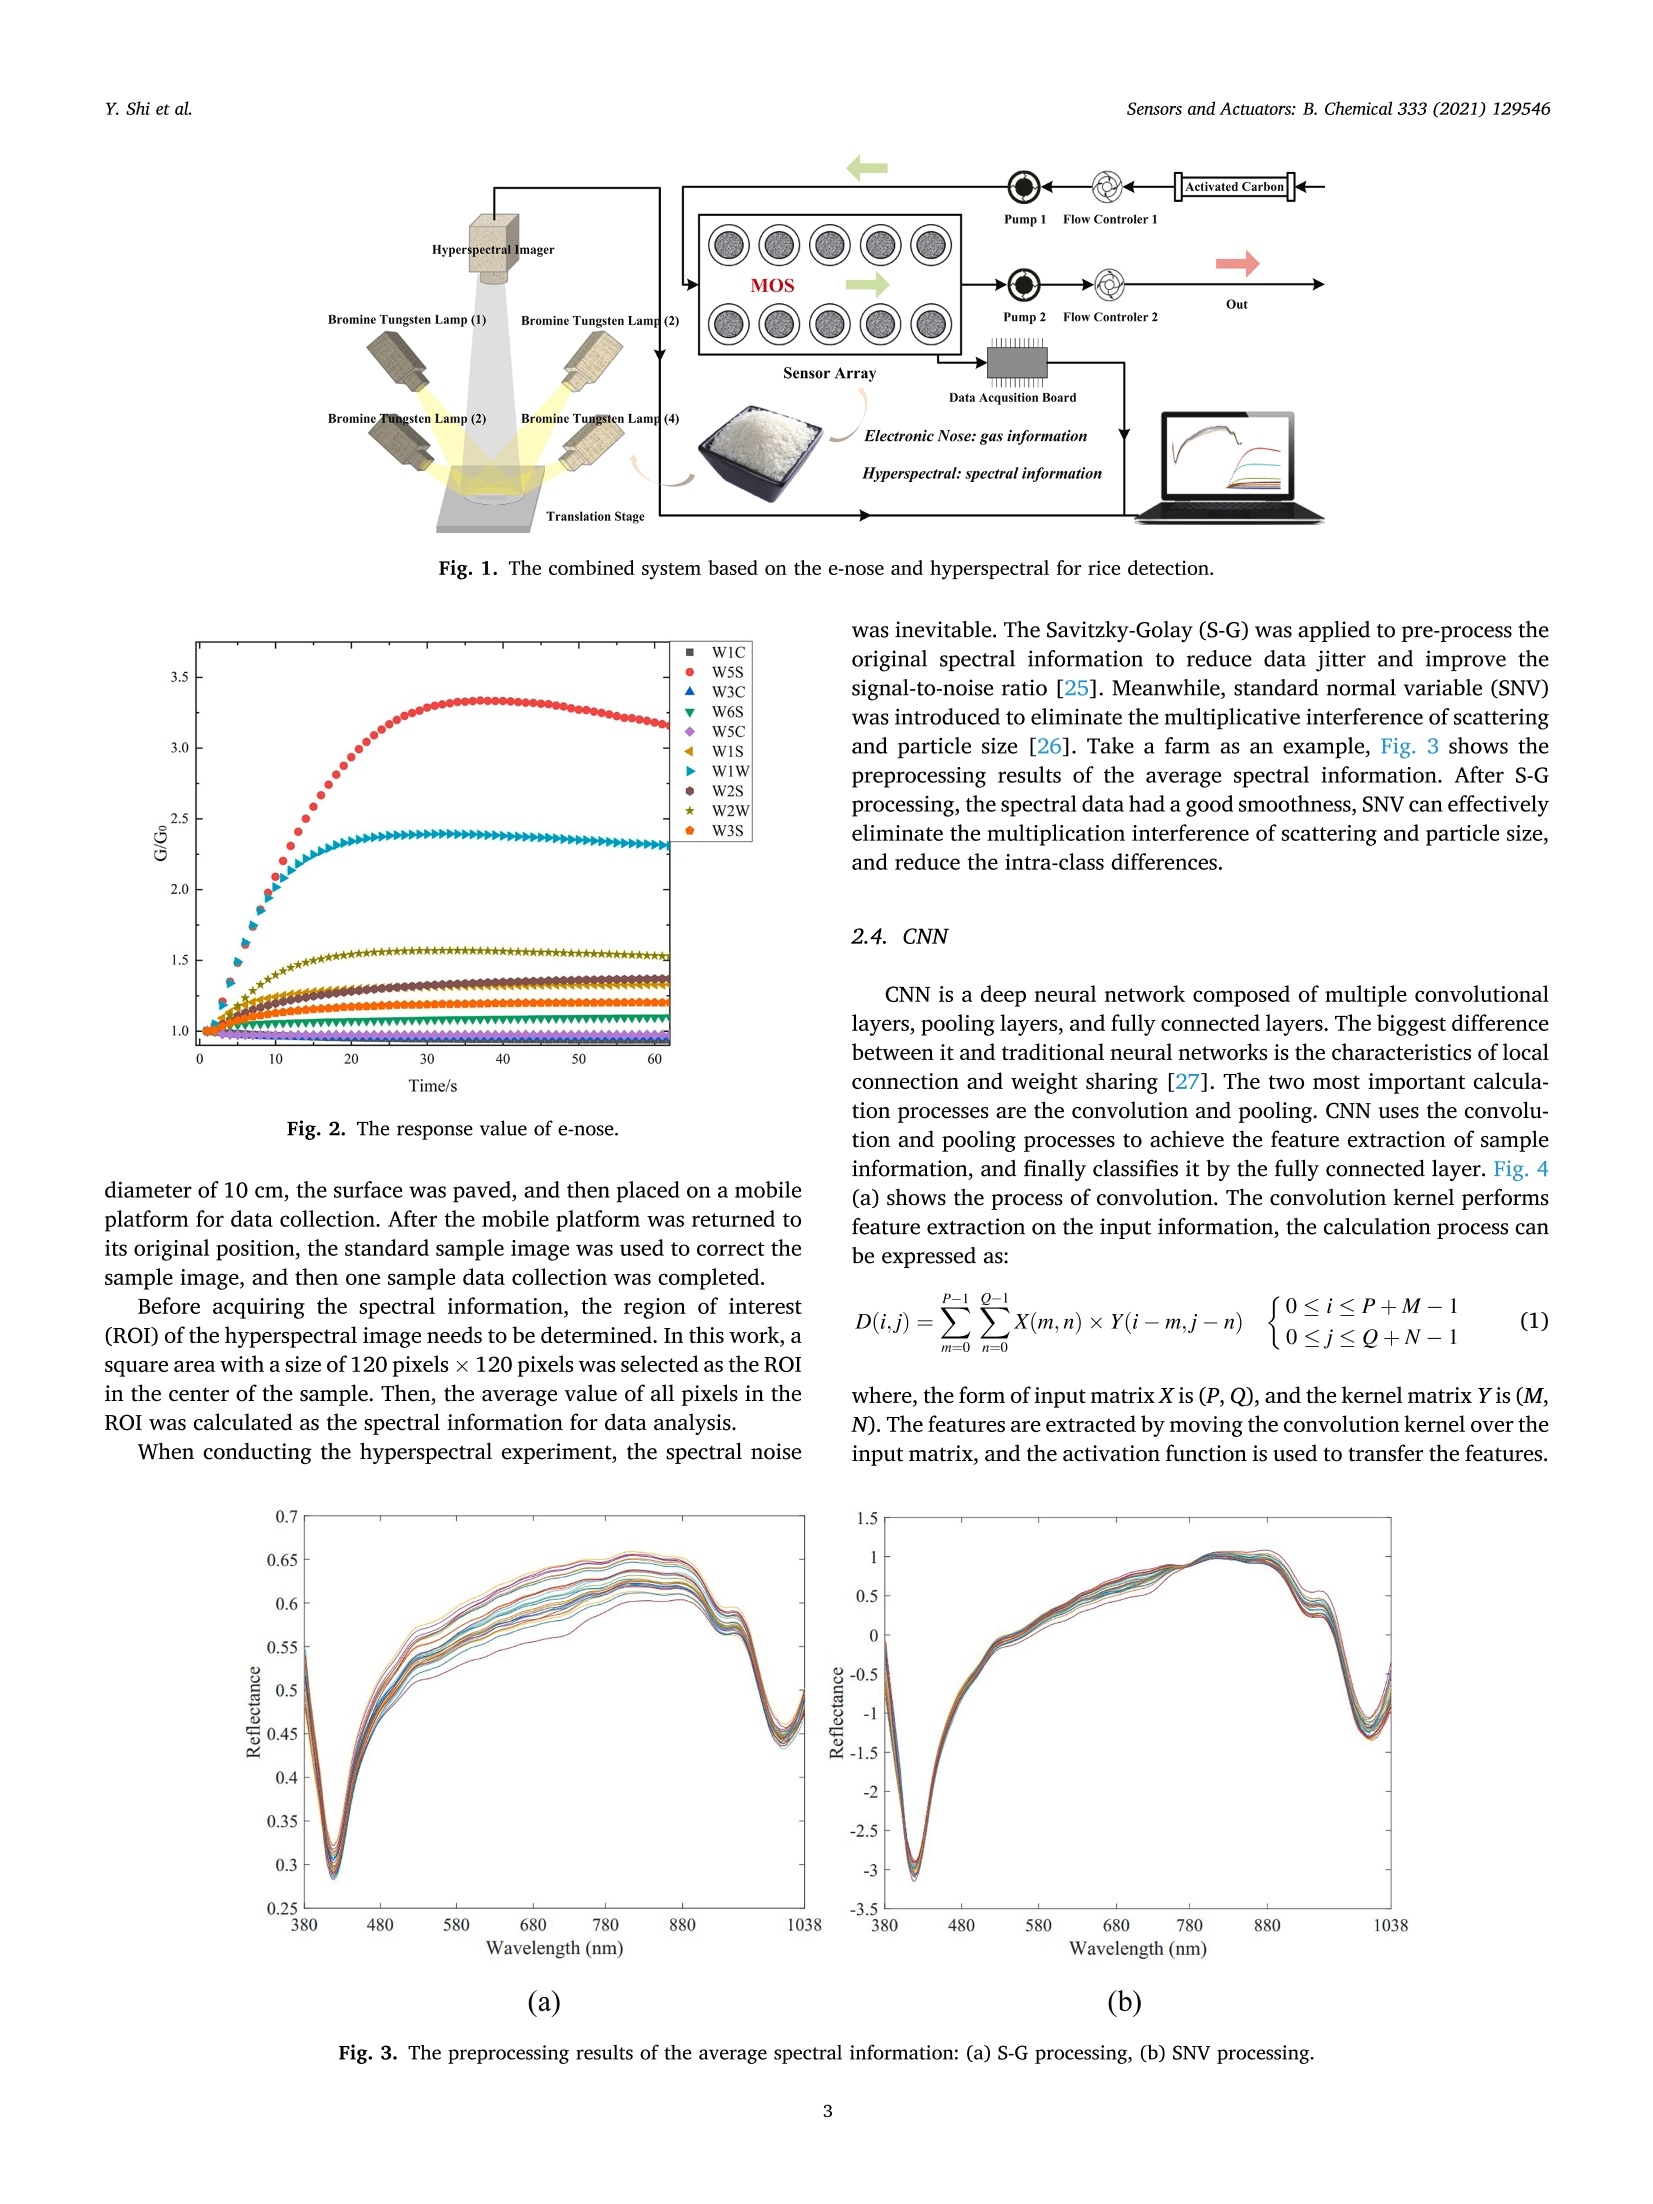
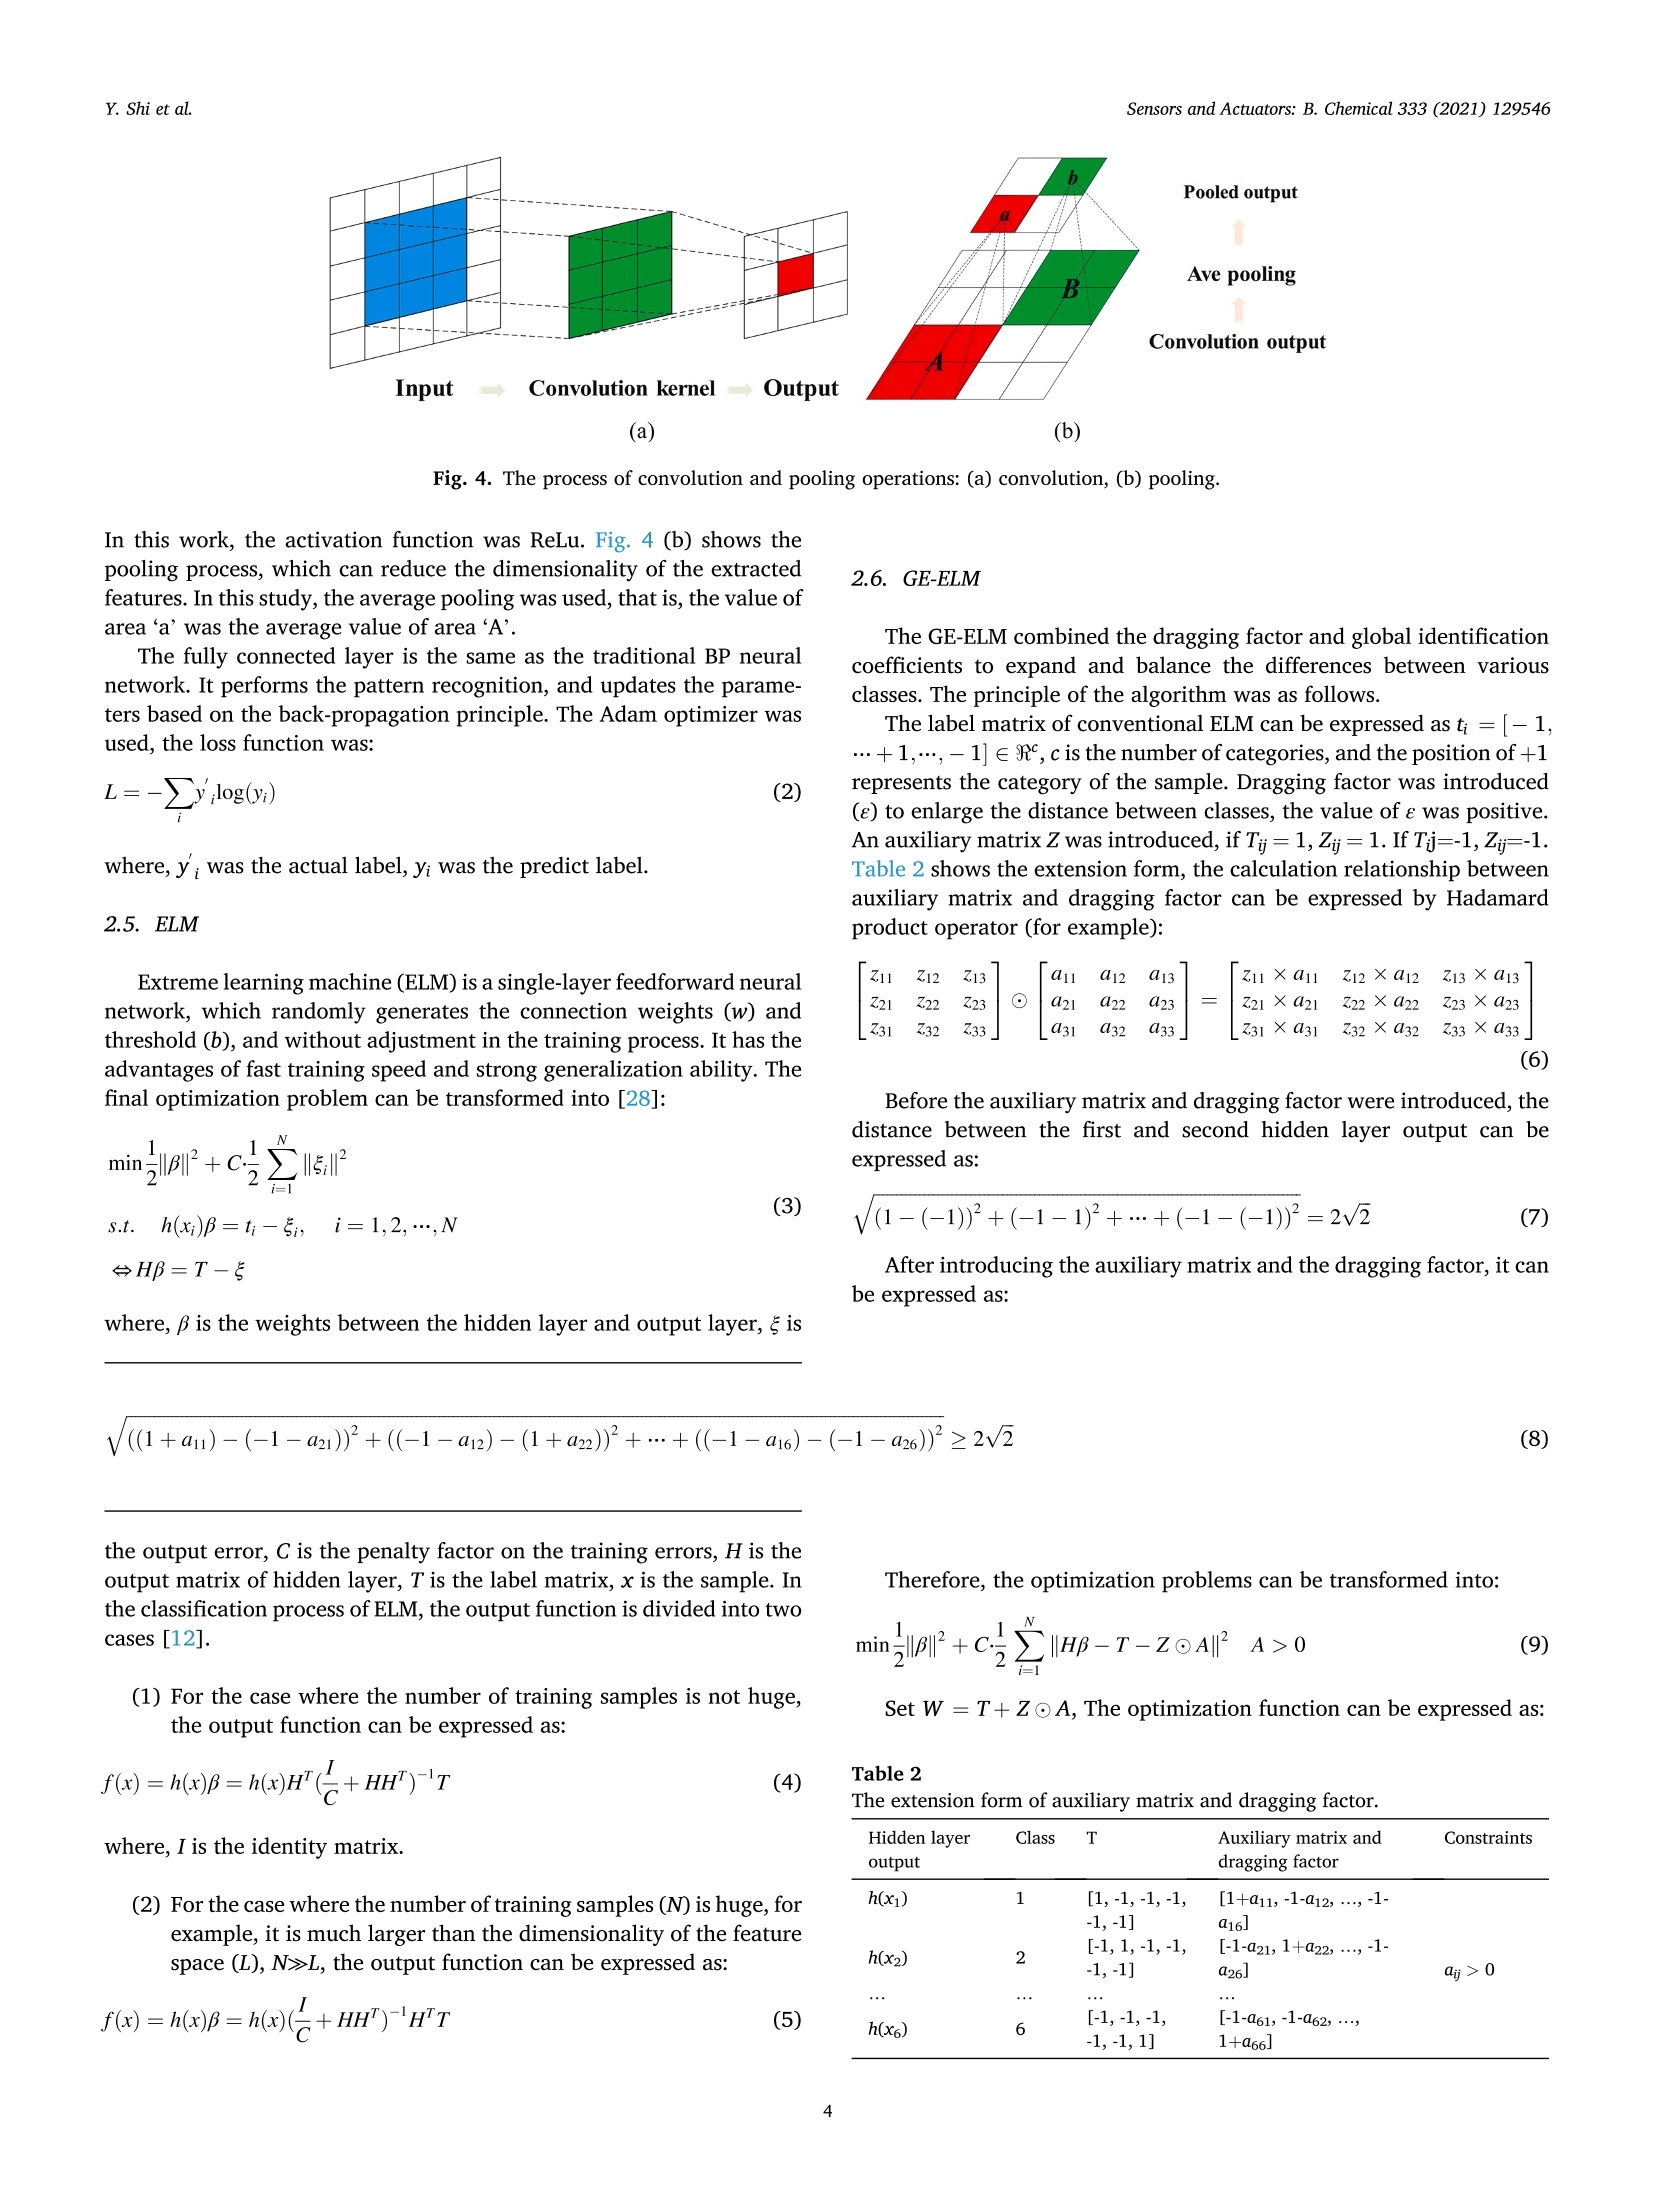
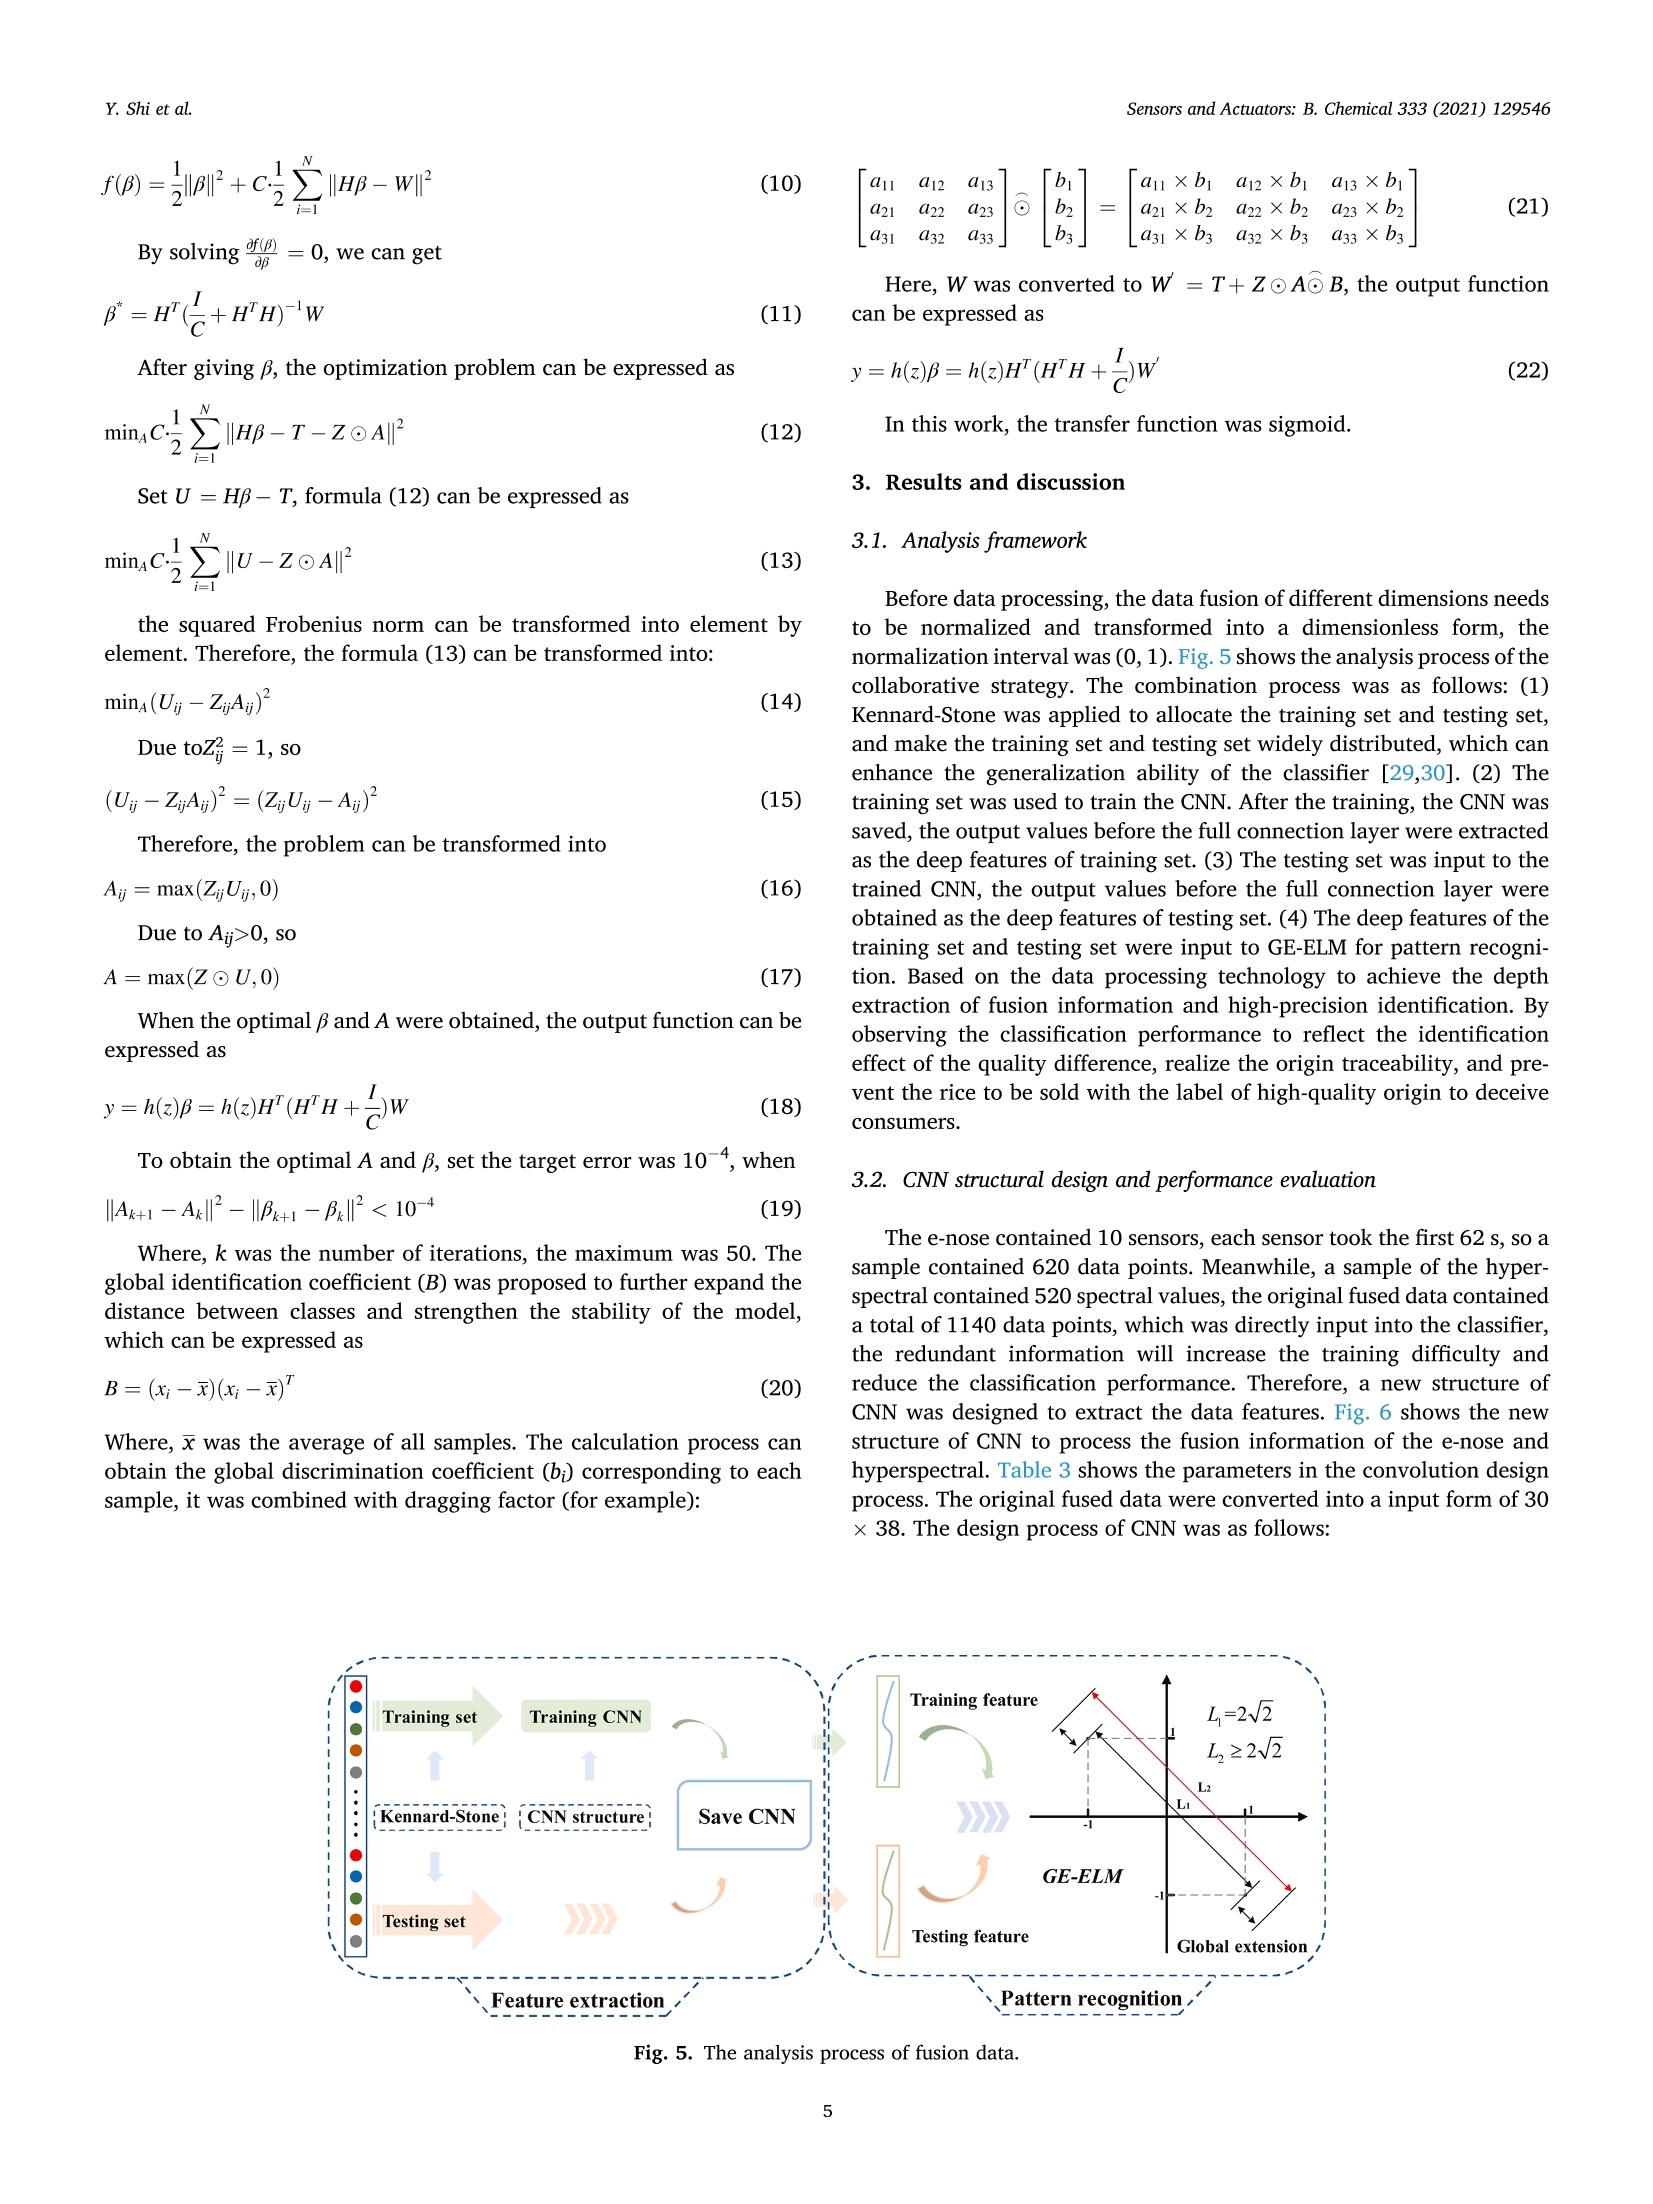
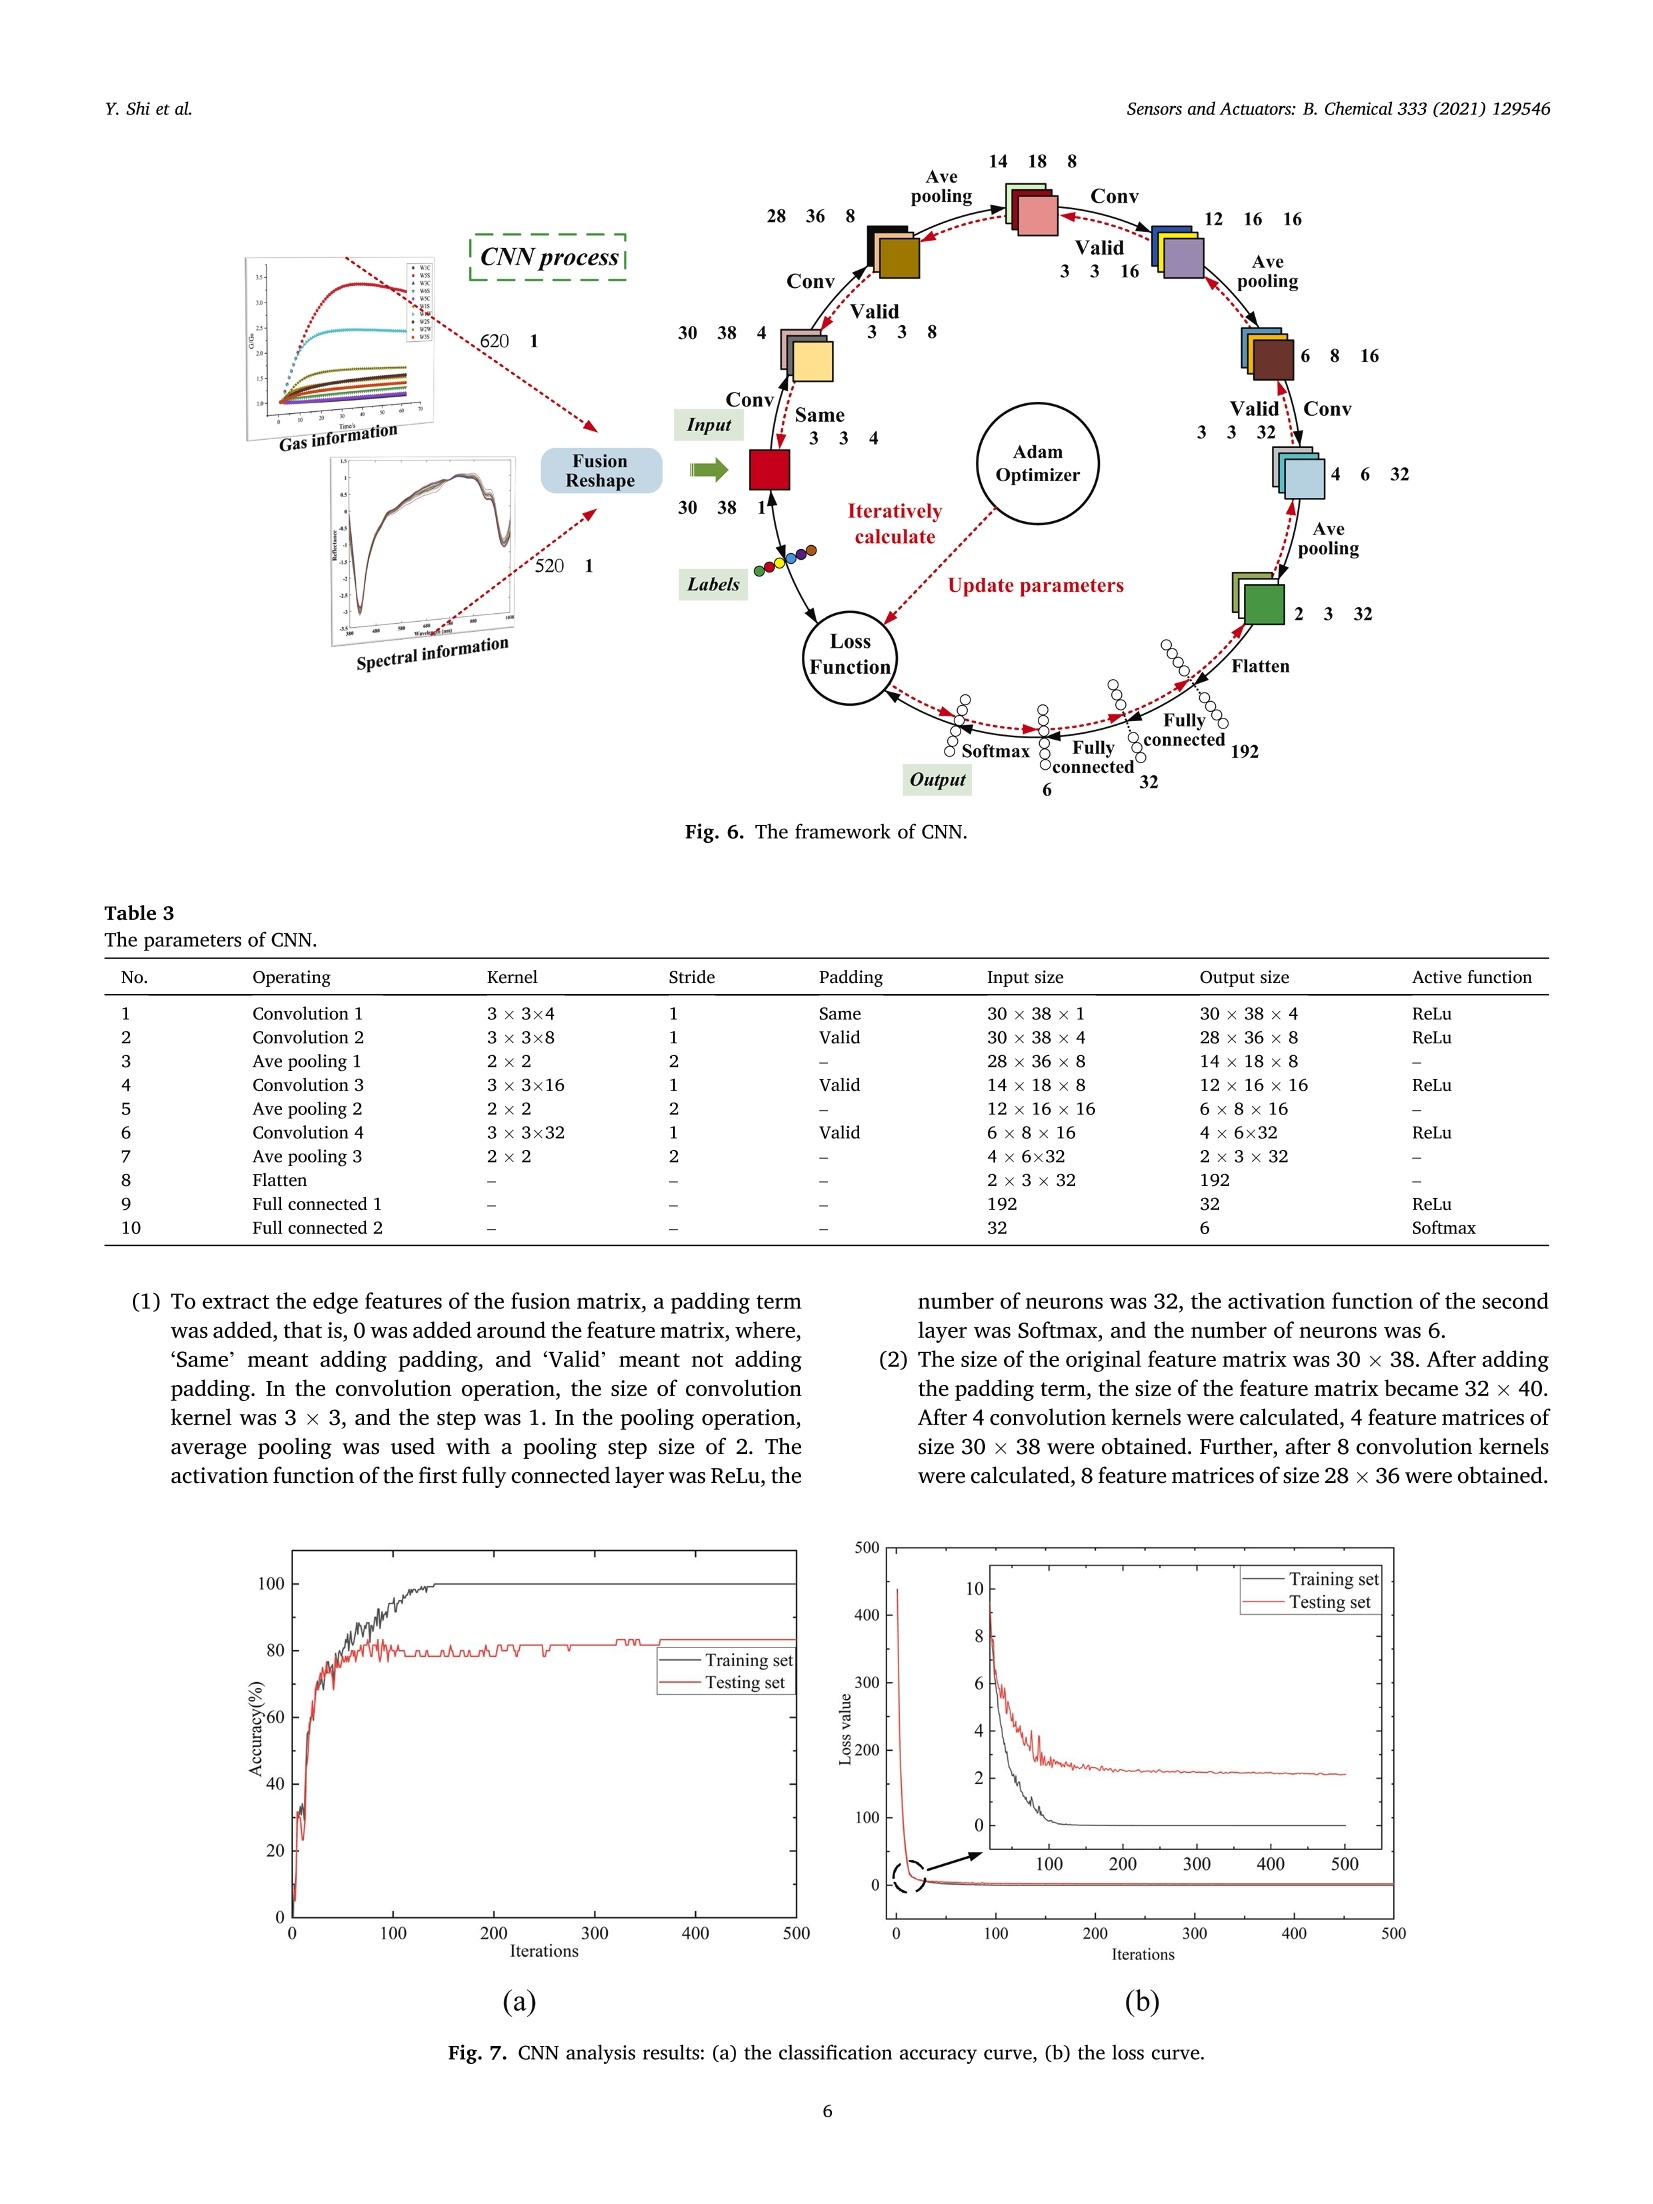
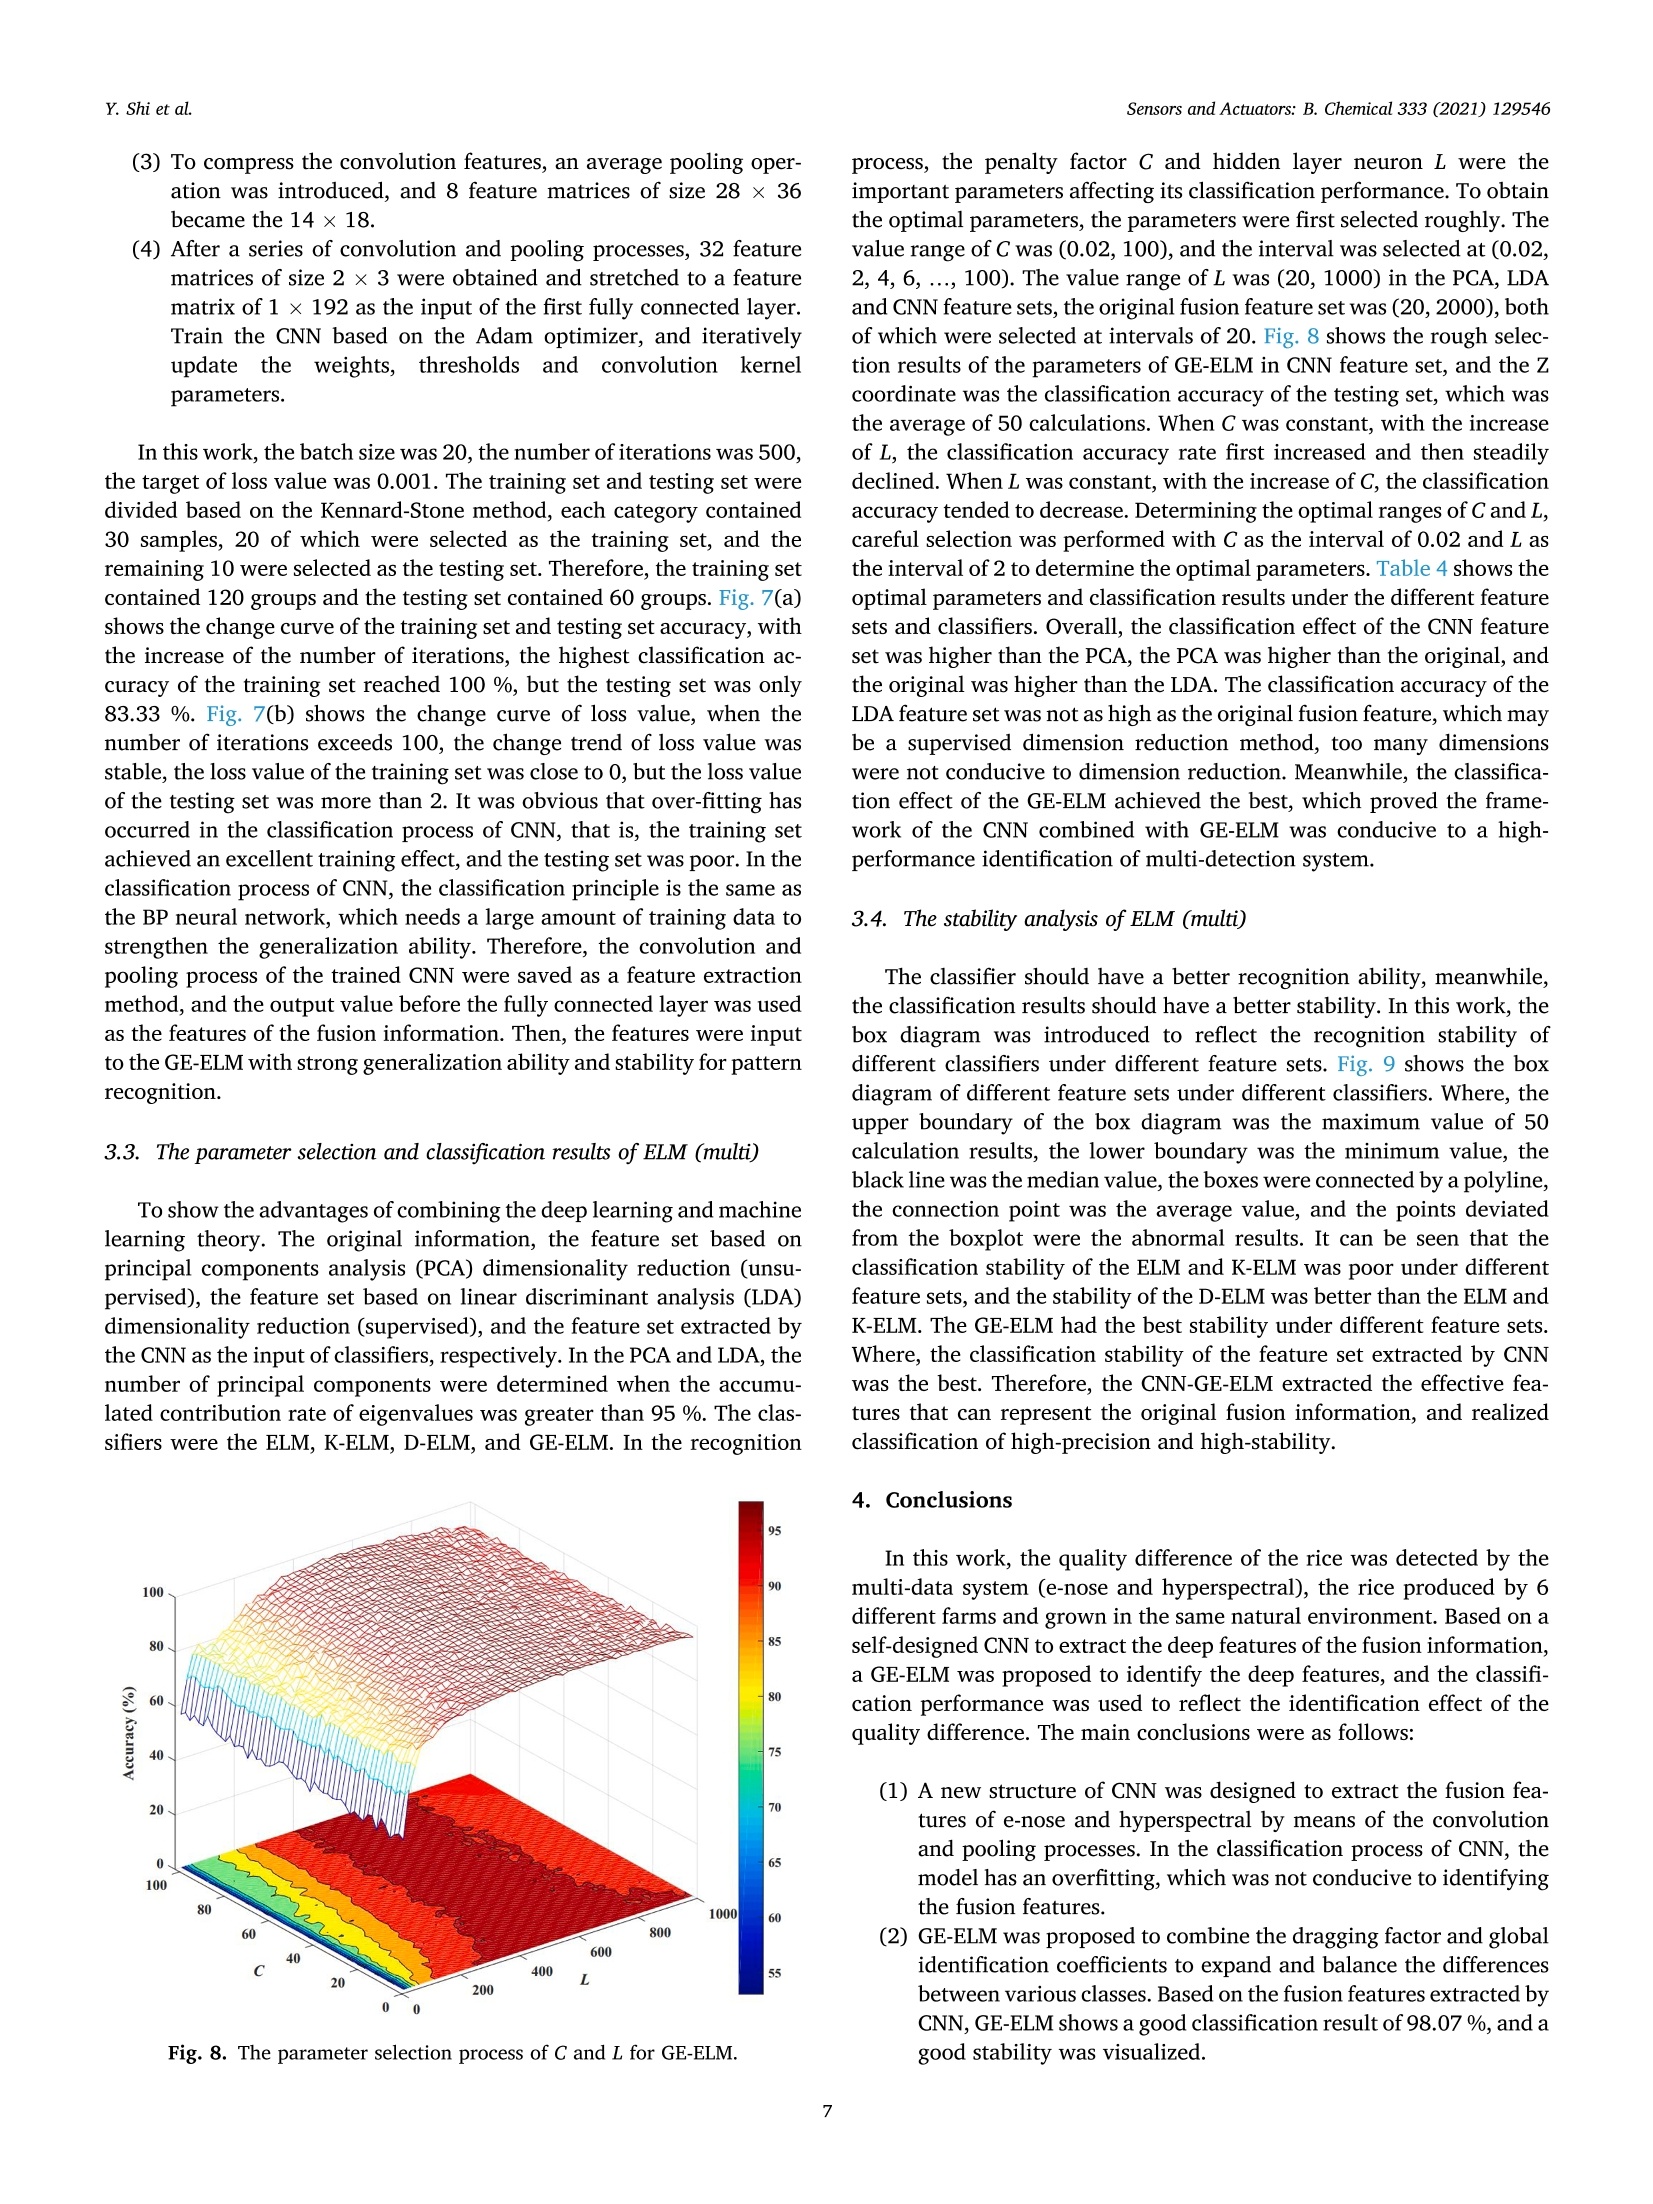
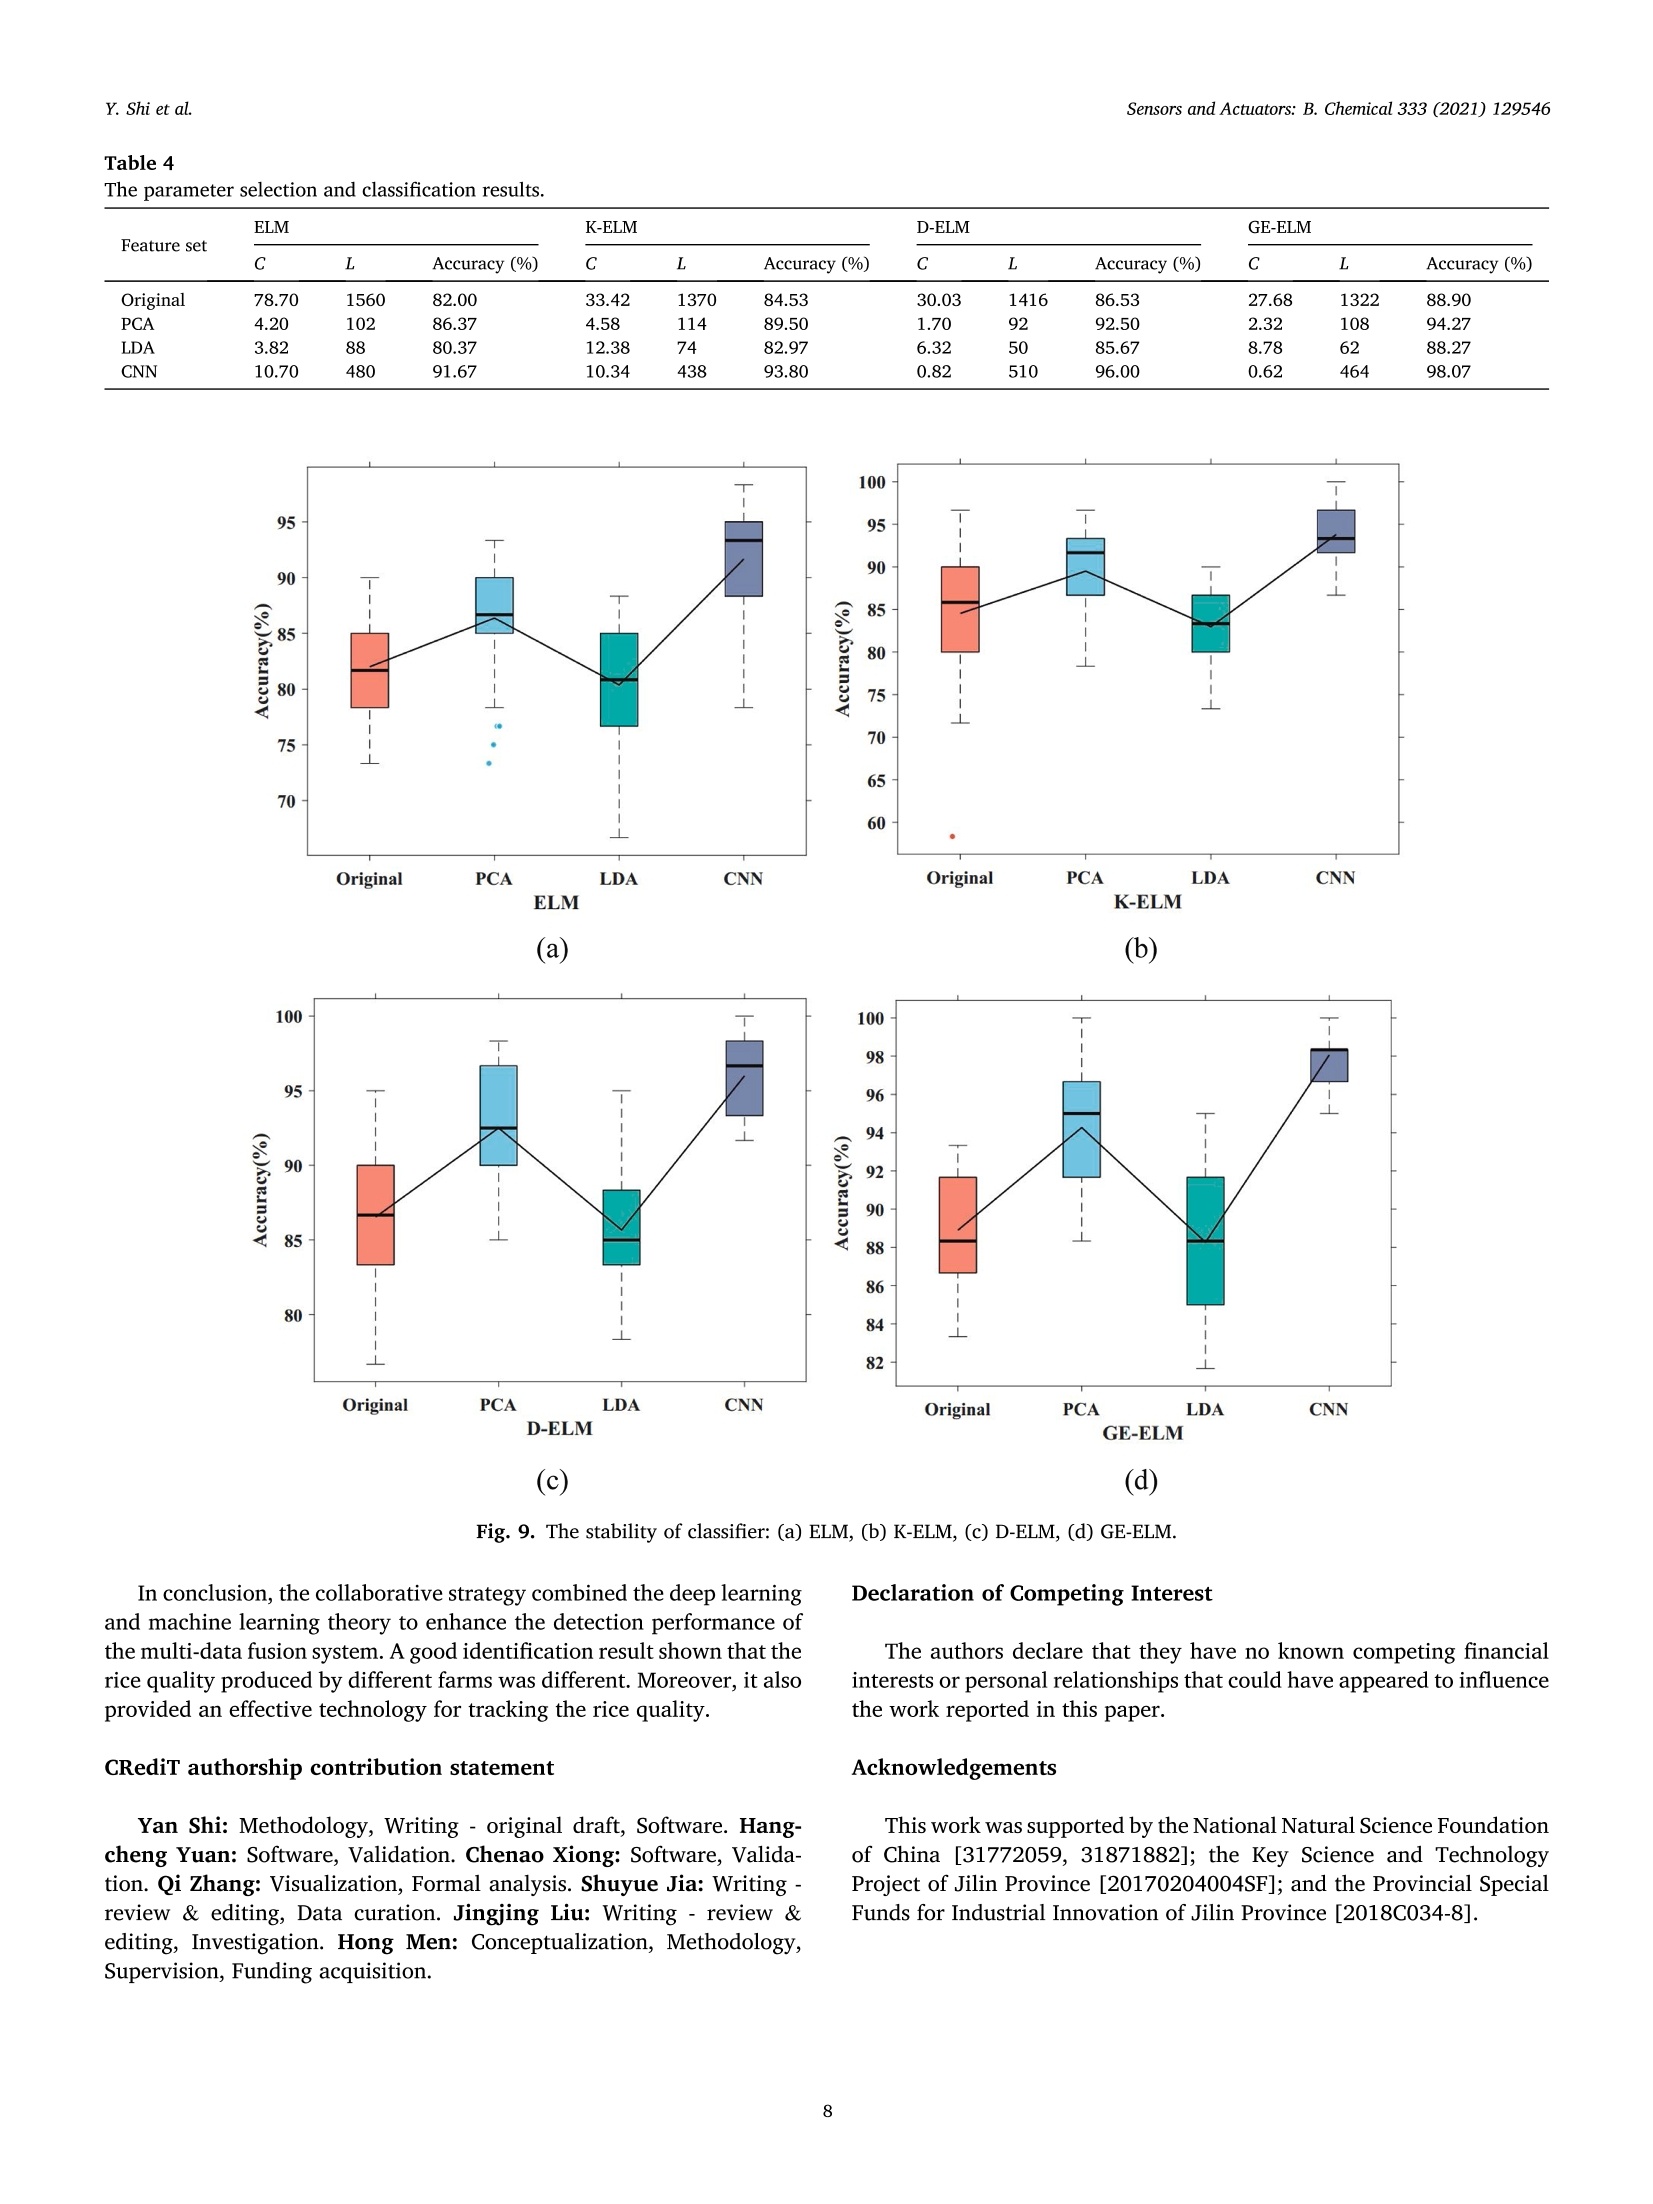
Sensors & Actuators: B. Chemical 333 (2021)129546Sensors and Actuators: B. Chemicaljournal homepage: www.elsevier.com/locate/snb Y. Shi et al.Sensors and Actuators: B. Chemical 333 (2021)129546 Contents lists available at ScienceDirect Improving performance: A collaborative strategy for the multi-data fusionof electronic nose and hyperspectral to track the quality difference of rice Yan Shi, Hangcheng Yuan, Chenao Xiong , Qi Zhang , Shuyue Jia , Jingjing Liu, Hong Men* School of Automation Engineering, Northeast Electric Power University, Jilin, 132012, China Faculty of Electrical and Electronic Engineering, University of Nottingham, Nottingham, NG7 2RD, United Kingdom ° School of Precision Instrument and Optoelectronic Engineering, Tianjin University, Tianjin, 300072, China “ School of Computer Science, Northeast Electric Power University, Jilin, 132012, China ARTICLEINFO A BSTRACT Keywords:Electronic noseHyperspectralData fusionConvolutional neural networkGlobal extension extreme learning machineRice Although multi-sensor system can obtain the comprehensive information of detected object from different in-formation sources, the direct fusion of multi-data contains a lot of redundant information, which will reduce thedetection accuracy. In this work, a collaborative strategy was proposed to track the quality difference of rice, itcombined the deep learning and machine learning theory to improve the detection performance of fusion system.Firstly, the quality information of rice was collected based on the electronic nose (e-nose) and hyperspectralimaging system. Secondly, a new structure of convolutional neural network (CNN) was designed to extract thefeatures of fusion data based on the convolution and pooling processes. Finally, a novel global extension extremelearning machine (GE-ELM) was proposed, which combined the dragging factor and global identification co-efficients to expand and balance the differences between classes, thereby improving the identification ability andenhancing the stability. Compared with the traditional feature mining and recognition methods, CNN extractedthe fusion features effectively, an excellent classification performance of 98.07 % was obtained based on the GE-ELM. In conclusion, CNN-GE-ELM was demonstrated as an effective analytical technique to improve thedetection performance of fusion system and achieve the high-precision recognition for the quality difference ofrice. 1. Introduction To obtain the overall properties of sample from different informationsources, and improve the detection accuracy, the combination of mul-tiple detection instruments has been used widely [1-3]. Two importantissues are being concerned:(1) information fusion of multiple detectionsignals, (2) decision of fusion information. In the process of informationfusion, it is mainly divided into data level, feature level and decisionlevel fusion [4]. Data level directly fuses the original detection infor-mation for pattern recognition. Obviously, the fused data contains a lotof redundant information which is not conducive to pattern recognition.Feature level and decision level are both feature extraction and thenfusion, the process is complicated. In the process of informationdecision-making, the two most important properties of the classifier arethe generalization ability and stability. Convolutional neural network (CNN) belongs to the category of deepneural network [5]. It uses the convolution and pooling processes toextract the deep feature of object [6].Compared with the general featureextraction process, it does not need to transform the data into domains,and make the statistical analysis. It has no restrictions on the data form,and can automatically extract the depth feature. At present, CNN hasbeen widely used in the fields of computer vision [7,8] and naturallanguage processing [9], etc. In the field of sensor detection, CNN israrely used, and have not been found for the feature extraction of fusioninformation. Meanwhile, the classification process of CNN is similar totraditional back propagation (BP) neural network, which requires alarge amount of training data to enhance the generalization ability andstability [10], it is also one of the reasons why CNN is not used widely.Extreme learning machine (ELM) is a typical feed-forward neuralnetwork, it has a simple structure, strong generalization ability, fast ( * Corresponding author. ) ( E-mail addresses: shi ya n@ne ep u. e d u.cn ( Y. Shi), 2201900499@n ee p u .edu.cn (H . Yuan), aly cx1@nottingham.ac.uk ( C . X iong), zhan g 1qi0@tju.e d u .cn (Q. Z hang), s huyuej . m l@gm a il.co m (S . Ji a ), j i ngji n g_ l iu@ ne ep u .e du.cn (J . Liu), m en h ong@n e e p u . edu.cn (H . M e n). ) ( https: // doi.org / 10 . 1016/j . snb.2021 . 129546 ) ( Received 4 A pril 2020; Received in revised form 4 December 2020; Accepted 1 8 January 2021 ) ( Available online 28 January 2021 ) training speed, and does not require more training samples to obtain agood classification performance [11]. Due to the advantages of ELM,many improved algorithms have been proposed, such as kernel extremelearning machine (K-ELM) [12], weight extreme learning machine(W-ELM) [13], and discriminative extreme learning machines (D-ELM)[14],etc. In this work, based on the D-ELM, the global extension extremelearning machine (GE-ELM) was proposed to expand and balance thedifferences between various classes, and enhance the classificationperformance and stability. To improve the detection performance of thefusion system, this study combined the deep learning and machinelearning theory.CNN extracted the deep features of the fusion infor-mation, and GE-ELM identified the fusion features to track the qualitydifference of rice. Rice is one of the main foods in the world. For the rice quality, themost direct and uncontrollable factor is the natural environment inwhich it grows [15].The temperature difference between the day andnight affects the starch content [16]. Soil condition and water resourcealso determine the better nutrients for rice growth [17]. In rice market,it is common for rice to be sold with the label of high-quality origin.However, even in the same natural environment, the rice quality isdifferent on different farms, and consumers will prefer the rice producedby the same brand or farm. The cultivation methods of different farmsmay be the main reason for affecting the rice quality. Therefore, it isimportant to develop an efficient intelligent technology to achieve thequality traceability of rice in industrial monitoring. Electronic nose(e-nose) and hyperspectral can reflect the rice quality from differentangles. E-nose technology was used to reflect the volatile compounds ofthe sample [18,19], which is an external sensory information composedof multiple chemical compositions [20,21]. The volatile compoundsformed by different quality rice is different, it contains more than 300chemical ingredients [22]. Hyperspectral technology has the charac-teristics of the high resolution, multiple bands, large amount of infor-mation, which can reflect theinternalstructure ;and chemicalcomposition of sample [23]. In this work, a collaborative strategy was proposed to track thequality difference of rice, it combined the deep learning and machinelearning theory to enhance the detection performance of fusion system.In the deep learning, a new structure of CNN was designed to extract thedeep features of fusion information for e-nose and hyperspectral. In themachine learning, a novel GE-ELM was proposed to expand and balancethe differences between various classes. The data analysis process wasdiscussed in detail. 2. Materials and methods 2.1. Samples The experimental samples were the newly produced rice of the samebrand (Dao Huaxiang) from 6 different farms in Jilin city, China. Jilincity is the main rice production base of China. The temperature differ-ence between the day and night is large, and it has the black soil rich innutrients. It is located in the middle reaches of the Songhua River. Therice has a good quality, and sells well in domestic and foreign markets.The two nearest farms are about 10 km, the two farthest farms are about100 km, and Jilin city is located in the plain area, the elevation differ-ence is very small. Therefore, it can be considered that the geographicallocation, climatic conditions, water and soil resources are consistent inthe 6 different farms. In the e-nose and hyperspectral experiments, without loss of gener-ality, a total of 30 parallel samples were prepared from each farm, a totalof 180 samples were obtained, respectively. Section 2.3 shows thesample preparation and experimental process. 2.2. Instrument A PEN3 e-nose (Airsense Analytics Inc. Schwerin, Germany) was applied to collect the gas information of rice. The PEN3 e-nose mainlyincludes a sensor array, sampling and cleaning channel, and a dataacquisition system. The sensor array consists of 10 metal oxide sensors,Table 1 shows the detection characteristics ofeach sensor. In the test, theratio of can be obtained, which is the conductivity G of the sensorcontacting the sample gas to the conductivity Go of the sensor contactingthe clean gas filtered by the activated carbon. The interaction betweenthe sensor and the sample gas will produce a redox reaction, which willchange the conductivity of the active substance of the sensor, namely G/Go, and realize the gas information detection of cross sensitive. A GaiaSorter hyperspectral image system (Zhuoli Hanguang Instru-ment Co., Ltd. Beijing, China) was used to collect the spectral informa-tion of rice. The hyperspectral image system mainly includes theuniform light source, a spectrum camera, an electronically controlledmobile platform, a computer and control software. The electronicallycontrolled mobile platform drives the sample to run, the reflected lightof the sample is captured by a spectroscopic camera to obtain the imageand spectral information of the entire sample. In this work, the spectralCCD camera was image-o-V10LU,the camera pixels were 1344×1024,the spectral coverage was 380 nm-1038 nm, the maximum number ofbands was 520. Fig. 1 shows the combined system based on the e-noseand hyperspectral for rice detection. 2.3. Experiment The ambient temperature of the experiment was 23 ±0.5℃. Theexperimental process of e-nose was as follows: (1) 150 g of rice wasplaced in a 500 mL sample bottle for 1 h to ensure sufficient of head-space air. (2) Clean the sensor chamber with the air filtered by activatedcarbon for 60 s at the flow rate of 300 mL/min. (3) Start testing after thesensor was calibrated, the detection time of each sample was 100 s at theflow rate was 300 mL/min. In this work, the first 62 s sampling pointswere used for data analysis. Fig. 2 shows the response value of e-nose. The experimental process of hyperspectral was as follows: (1)Initialize the system parameters: the exposure time of the camera was 10ms, the speed of the mobile platform was 0.28 cm/s, and the distancefrom the sample was 10 cm. (2) In the hyperspectral imaging system, theintensity distribution of the light source is uneven, and the problems ofdark current noise will seriously affect the quality of the acquiredhyperspectral image. Therefore, it is necessary to perform a whiteboardcalibration test on the hyperspectral imaging system to obtain a cor-rected image [24]. (3) The rice was evenly placed in a wood disc with a Table 1The main detection characteristics of each sensor in e-nose. No. Sensor Main performance Selective Detectability gas (ppm) 1 W1C Sensitive to aromatic compounds Toluene 2 W5S High sensitivity to nitrogen NO2 oxides, broad range sensitivity 3 W3C Sensitive to ammonia and Benzene 10 aromatic compounds 4 W6S Mainly hydrogen H2 100 5 W5C Sensitive to alkanes and aromatic Propane components, less polar compounds 6 WIS Sensitive to methane,broad CH4 100 range sensitivity 7 W1W Sensitive to sulfur compounds, H2S otherwise sensitive to many terpenes and organic sulfur compounds 8 W2S Sensitive to ethanol, partially CO 100 aromatic compounds 9 W2W Sensitive to aromatic components H2S and sulfur organic compounds 10 W3S High concentration detection of CH3 10 alkanes Fig. 1. The combined system based on the e-nose and hyperspectral for rice detection. Fig.2. The response value of e-nose. diameter of 10 cm, the surface was paved, and then placed on a mobileplatform for data collection. After the mobile platform was returned toits original position, the standard sample image was used to correct thesample image, and then one sample data collection was completed. Before acquiring the spectral information, the region of interest(ROI) of the hyperspectral image needs to be determined. In this work, asquare area with a size of 120 pixels ×120 pixels was selected as the ROIin the center of the sample. Then, the average value of all pixels in theROI was calculated as the spectral information for data analysis. When conducting the hyperspectral experiment, the spectral noise was inevitable. The Savitzky-Golay (S-G) was applied to pre-process theoriginal spectral information to reduce data jitter and improve thesignal-to-noise ratio [25]. Meanwhile, standard normal variable (SNV)was introduced to eliminate the multiplicative interference of scatteringand particle size [26]. Take a farm as an example, Fig. 3 shows thepreprocessing results of the average spectral information. After S-Gprocessing, the spectral data had a good smoothness, SNV can effectivelyeliminate the multiplication interference of scattering and particle size,and reduce the intra-class differences. 2.4. CNN CNN is a deep neural network composed of multiple convolutionallayers, pooling layers, and fully connected layers. The biggest differencebetween it and traditional neural networks is the characteristics of localconnection and weight sharing [27]. The two most important calcula-tion processes are the convolution and pooling. CNN uses the convolu-tion and pooling processes to achieve the feature extraction of sampleinformation, and finally classifies it by the fully connected layer. Fig. 4(a) shows the process of convolution. The convolution kernel performsfeature extraction on the input information, the calculation process canbe expressed as: where, the form of input matrix X is (P,Q), and the kernel matrix Y is (M,N). The features are extracted by moving the convolution kernel over theinput matrix, and the activation function is used to transfer the features. Fig. 4. The process of convolution and pooling operations: (a) convolution, (b) pooling. In this work, the activation function was ReLu. Fig. 4 (b) shows thepooling process, which can reduce the dimensionality of the extractedfeatures. In this study, the average pooling was used, that is, the value ofarea ‘a’was the average value of area ‘A’. The fully connected layer is the same as the traditional BP neuralnetwork. It performs the pattern recognition, and updates the parame-ters based on the back-propagation principle. The Adam optimizer wasused, the loss function was: where, yiwas the actual label, yi was the predict label. 2.5. ELM Extreme learning machine (ELM) is a single-layer feedforward neuralnetwork, which randomly generates the connection weights (w) andthreshold (b), and without adjustment in the training process. It has theadvantages of fast training speed and strong generalization ability. Thefinal optimization problem can be transformed into [28]: where, is the weights between the hidden layer and output layer,is 2.6. GE-ELM The GE-ELM combined the dragging factor and global identificationcoefficients to expand and balance the differences between variousclasses. The principle of the algorithm was as follows. The label matrix of conventional ELM can be expressed as ti=[-1,…+1,…,-1]E I, c is the number of categories, and the position of +1represents the category of the sample. Dragging factor was introduced(e) to enlarge the distance between classes, the value of e was positive.An auxiliary matrix Z was introduced, if Tij=1,Zij=1. If Tj=-1,Zij=-1.Table 2 shows the extension form, the calculation relationship betweenauxiliary matrix and dragging factor can be expressed by Hadamardproduct operator (for example): Before the auxiliary matrix and dragging factor were introduced, thedistance between the first and second hidden layer output can beexpressed as: After introducing the auxiliary matrix and the dragging factor, it canbe expressed as: √((1+au)-(-1-a21))+((-1-a12)-(1+a22)) +…+((-1-416)-(-1-a26))"≥ 2v2 the output error, C is the penalty factor on the training errors, H is theoutput matrix of hidden layer, T is the label matrix, x is the sample. Inthe classification process of ELM, the output function is divided into twocases [12]. (1) For the case where the number of training samples is not huge,the output function can be expressed as: where, I is the identity matrix. (2) For the case where the number of training samples (N) is huge, forexample, it is much larger than the dimensionality of the featurespace (L), N>L, the output function can be expressed as: Therefore, the optimization problems can be transformed into: Set W=T+ZoA, The optimization function can be expressed as: Table 2The extension form of auxiliary matrix and dragging factor. Hidden layer Class T Auxiliary matrix and Constraints output dragging factor h(xi) 1 [1,-1,-1,-1, [1+a11,-1-a12,...,-1- 2 -1,-1] a16] aigj>0 h(x2) [-1,1,-1,-1, [-1-a21,1+a22,...,-1- -1,-1] a26] 6 .. .. ... h(x6) [-1,-1,-1, [-1-a61,-1-a62,…, -1,-1,1] 1+a66] By solving ':f()=0, we can get the squared Frobenius norm can be transformed into element byelement. Therefore, the formula (13) can be transformed into: When the optimal p and A were obtained, the output function can beexpressed as Where, k was the number of iterations, the maximum was 50. Theglobal identification coefficient (B) was proposed to further expand thedistance between classes and strengthen the stability of the model,which can be expressed as Where, x was the average of all samples. The calculation process canobtain the global discrimination coefficient (b;) corresponding to eachsample, it was combined with dragging factor (for example): Fig.5. The analysis process of fusion data. Here, W was converted to W=T+ZoAoB, the output functioncan be expressed as In this work, the transfer function was sigmoid. 3. Results and discussion 3.1. Analysis framework Before data processing, the data fusion of different dimensions needsto be normalized and transformed into a dimensionless form, thenormalization interval was (0,1). Fig. 5 shows the analysis process of thecollaborative strategy. The combination process was as follows: (1)Kennard-Stone was applied to allocate the training set and testing set,and make the training set and testing set widely distributed, which canenhance the generalization ability of the classifier [29,30]. (2) Thetraining set was used to train the CNN. After the training, the CNN wassaved, the output values before the full connection layer were extractedas the deep features of training set. (3) The testing set was input to thetrained CNN, the output values before the full connection layer wereobtained as the deep features of testing set. (4) The deep features of thetraining set and testing set were input to GE-ELM for pattern recogni-tion. Based on the data processing technology to achieve the depthextraction of fusion information and high-precision identification. Byobserving the classification performance to reflect the identificationeffect of the quality difference, realize the origin traceability, and pre-vent the rice to be sold with the label of high-quality origin to deceiveconsumers. 3.2. CNN structural design and performance evaluation The e-nose contained 10 sensors, each sensor took the first 62 s, so asample contained 620 data points. Meanwhile, a sample of the hyper-spectral contained 520 spectral values, the original fused data containeda total of 1140 data points, which was directly input into the classifier,the redundant information will increase the training difficulty andreduce the classification performance. Therefore, a new structure ofCNN was designed to extract the data features. Fig. 6 shows the newstructure of CNN to process the fusion information of the e-nose andhyperspectral. Table 3 shows the parameters in the convolution designprocess. The original fused data were converted into a input form of 30x 38. The design process of CNN was as follows: 14 18 8 Fig.6. The framework of CNN. Table 3The parameters of CNN. No. Operating Kernel Stride Padding Input size Output size Active function 1 Convolution 1 3×3×4 1 Same 30×38×1 30×38×4 ReLu 2 Convolution 2 3×3×8 Valid 30 x38×4 28×36×8 ReLu 3 Ave pooling 1 2×2 2 28×36×8 14×18×8 4 Convolution 3 3×3×16 1 Valid 14×18×8 12×16×16 ReLu 5 Ave pooling 2 2×2 2 12×16×16 6×8×16 6 Convolution 4 3×3×32 1 Valid 6×8×16 4 x6×32 ReLu 7 Ave pooling 3 2x2 2 4x 6x32 2×3×32 8 Flatten 一 2x3x32 192 一 9 Full connected1 - 192 32 ReLu 10 Full connected 2 32 6 Softmax (1) To extract the edge features of the fusion matrix, a padding termwas added,that is, 0 was added around the feature matrix, where,‘Same’meant adding padding, and ‘Valid’ meant not addingpadding. In the convolution operation, the size of convolutionkernel was 3 ×3, and the step was 1. In the pooling operation,average pooling was used with a pooling step size of 2. Theactivation function of the first fully connected layer was ReLu, the number of neurons was 32, the activation function of the secondlayer was Softmax, and the number of neurons was 6. (2) The size of the original feature matrix was 30 ×38. After addingthe padding term, the size of the feature matrix became 32 ×40.After 4 convolution kernels were calculated, 4 feature matrices ofsize 30 × 38 were obtained. Further, after 8 convolution kernelswere calculated,8 feature matrices of size 28×36were obtained. Fig. 7. CNN analysis results: (a) the classification accuracy curve, (b) the loss curve. (3) To compress the convolution features, an average pooling oper-ation was introduced, and 8 feature matrices of size 28 ×36became the 14× 18. (4) After a series of convolution and pooling processes, 32 featurematrices of size 2 x 3 were obtained and stretched to a featurematrix of 1 × 192 as the input of the first fully connected layer.Train the CNN based on the Adam optimizer, and iterativelyupdatetheweights,,thresholdsandconvolutionkernelparameters. In this work, the batch size was 20,the number of iterations was 500,the target of loss value was 0.001. The training set and testing set weredivided based on the Kennard-Stone method, each category contained30 samples, 20 of which were selected as the training set, and theremaining 10 were selected as the testing set. Therefore, the training setcontained 120 groups and the testing set contained 60 groups. Fig. 7(a)shows the change curve of the training set and testing set accuracy, withthe increase of the number of iterations, the highest classification ac-curacy of the training set reached 100 %, but the testing set was only83.33 %. Fig. 7(b) shows the change curve of loss value, when thenumber of iterations exceeds 100, the change trend of loss value wasstable, the loss value of the training set was close to 0, but the loss valueof the testing set was more than 2. It was obvious that over-fitting hasoccurred in the classification process of CNN, that is, the training setachieved an excellent training effect, and the testing set was poor. In theclassification process of CNN, the classification principle is the same asthe BP neural network, which needs a large amount of training data tostrengthen the generalization ability. Therefore, the convolution andpooling process of the trained CNN were saved as a feature extractionmethod, and the output value before the fully connected layer was usedas the features of the fusion information. Then, the features were inputto the GE-ELM with strong generalization ability and stability for patternrecognition. 3.3. The parameter selection and classification results of ELM (multi) To show the advantages of combining the deep learning and machinelearning theory. The original information, the feature set based onprincipal components analysis (PCA) dimensionality reduction (unsu-pervised), the feature set based on linear discriminant analysis (LDA)dimensionality reduction (supervised), and the feature set extracted bythe CNN as the input of classifiers, respectively. In the PCA and LDA, thenumber of principal components were determined when the accumu-lated contribution rate of eigenvalues was greater than 95 %. The clas-sifiers were the ELM, K-ELM, D-ELM, and GE-ELM. In the recognition Fig.8. The parameter selection process of C and L for GE-ELM. process, the penalty factor C and hidden layer neuron L were theimportant parameters affecting its classification performance. To obtainthe optimal parameters, the parameters were first selected roughly. Thevalue range of C was (0.02, 100), and the interval was selected at (0.02,2, 4,6,...,100). The value range of L was (20, 1000) in the PCA, LDAand CNN feature sets, the original fusion feature set was (20, 2000), bothof which were selected at intervals of 20. Fig. 8 shows the rough selec-tion results of the parameters of GE-ELM in CNN feature set, and the Zcoordinate was the classification accuracy of the testing set, which wasthe average of 50 calculations. When C was constant,with the increaseof L, the classification accuracy rate first increased and then steadilydeclined. When L was constant, with the increase of C, the classificationaccuracy tended to decrease. Determining the optimal ranges of C and L,careful selection was performed with C as the interval of 0.02 and L asthe interval of 2 to determine the optimal parameters. Table 4 shows theoptimal parameters and classification results under the different featuresets and classifiers. Overall, the classification effect of the CNN featureset was higher than the PCA, the PCA was higher than the original, andthe original was higher than the LDA. The classification accuracy of theLDA feature set was not as high as the original fusion feature, which maybe a supervised dimension reduction method, too many dimensionswere not conducive to dimension reduction. Meanwhile, the classifica-tion effect of the GE-ELM achieved the best, which proved the frame-work of the CNN combined with GE-ELM was conducive to a high-performance identification of multi-detection system. 3.4.The stability analysis ofELM (multi) The classifier should have a better recognition ability, meanwhile,the classification results should have a better stability. In this work, thebox diagram was introduced to reflect the recognition stability ofdifferent classifiers under different feature sets. Fig. 9 shows the boxdiagram of different feature sets under different classifiers. Where, theupper boundary of the box diagram was the maximum value of 50calculation results, the lower boundary was the minimum value, theblack line was the median value, the boxes were connected by a polyline,the connection point was the average value, and the points deviatedfrom the boxplot were the abnormal results. It can be seen that theclassification stability of the ELM and K-ELM was poor under differentfeature sets, and the stability of the D-ELM was better than the ELM andK-ELM. The GE-ELM had the best stability under different feature sets.Where, the classification stability of the feature set extracted by CNNwas the best. Therefore, the CNN-GE-ELM extracted the effective fea-tures that can represent the original fusion information, and realizedclassification of high-precision and high-stability. 4. Conclusions In this work, the quality difference of the rice was detected by themulti-data system (e-nose and hyperspectral), the rice produced by 6different farms and grown in the same natural environment. Based on aself-designed CNN to extract the deep features of the fusion information,a GE-ELM was proposed to identify the deep features, and the classifi-cation performance was used to reflect the identification effect of thequality difference. The main conclusions were as follows: (1) A new structure of CNN was designed to extract the fusion fea-tures of e-nose and hyperspectral by means of the convolutionand pooling processes. In the classification process of CNN, themodel has an overfitting, which was not conducive to identifyingthe fusion features. (2) GE-ELM was proposed to combine the dragging factor and globalidentification coefficients to expand and balance the differencesbetween various classes. Based on the fusion features extracted byCNN, GE-ELM shows a good classification result of 98.07 %, and agood stability was visualized. Feature set ELM K-ELM D-ELM GE-ELM C L Accuracy (%) C L Accuracy (%) C L Accuracy (%) C L Accuracy (%) Original 78.70 1560 82.00 33.42 1370 84.53 30.03 1416 86.53 27.68 1322 88.90 PCA 4.20 102 86.37 4.58 114 89.50 1.70 92 92.50 2.32 108 94.27 LDA 3.82 88 80.37 12.38 74 82.97 6.32 50 85.67 8.78 62 88.27 CNN 10.70 480 91.67 10.34 438 93.80 0.82 510 96.00 0.62 464 98.07 Fig. 9. The stability of classifier: (a) ELM, (b) K-ELM, (c) D-ELM, (d) GE-ELM. Declaration of Competing Interest In conclusion, the collaborative strategy combined the deep learningand machine learning theory to enhance the detection performance ofthe multi-data fusion system. A good identification result shown that therice quality produced by different farms was different. Moreover, it alsoprovided an effective technology for tracking the rice quality. CRediT authorship contribution statement Yan Shi: Methodology, Writing - original draft, Software. Hang-cheng Yuan: Software, Validation. Chenao Xiong: Software, Valida-tion. Qi Zhang: Visualization, Formal analysis. Shuyue Jia: Writing -review & editing, Data curation. Jingjing Liu: Writing - review &editing, Investigation. Hong Men: Conceptualization, Methodology,Supervision, Funding acquisition. The authors declare that they have no known competing financialinterests or personal relationships that could have appeared to influencethe work reported in this paper. Acknowledgements This work was supported by the National Natural Science Foundationof China [31772059,31871882]; the Key Science and TechnologyProject of Jilin Province [20170204004SF]; and the Provincial SpecialFunds for Industrial Innovation of Jilin Province [2018C034-8]. ( [1] H . Men, Y. Shi, S. F u , M i ning feature of data fusion in the classification of beer f lavor information using E-Tongue and E-Nose, Sensors 17 (2017) 1656-1672, h t tp s : // d o i . o rg / 1 0 .3 3 9 0 /s 17 0 7 1 656. ) ( [2] S . Qiu,J. Wang, C. Tang, D. D u, C omparison of ELM, RF, and SVM on E-n o se and E- t ongue to trace the quality status of mandarin (Citrus unshiu Marc.), J. Food Eng. 166 (2015)1 9 3-2 0 3, ht tps: //d oi . o rg/ 1 0.1016/ j . j foodeng . 2015.06.007 . ) ( [3] M . Xu, J. W ang, S . Gu, Rapid i d entification o f tea quality by E-nose and computer vision combining with a synergetic data fusion st r ategy, J. F o od En g . 241 (2019) 1 0- 1 7, h ttps: / / d oi.org/ 1 0.1 0 16/j . j f ooden g .2018 . 07. 0 2 0. ) ( [4] A .R. Di R o sa, F . Leone, F . Cheli, V. Chiofalo, Fusion o f electronic nose, electronic t ongue and computer vi s ion fo r animal source fo o d au t hentication and quality a ssessment - a r eview, J . Food E ng. 2 10 (2017) 62-7 5 , ht tps:/ / do i.o r g/1 0 . 10 1 6/ j . j f oo de ng. 2 017.04. 0 24. ) ( [5 ] R . K ang, B. P ark, M . Eady, Q. Ouyang, K. Chen, Si n gle-cell c l assification of f oodborne pathogens using h yperspectral microscope imaging coupled with deep l earning f rameworks, S e ns. A c tuators B C h em. 309 (2020) 127789, http s ://d oi. org/1 0 .10 1 6/ j . snb.2020.127 7 89 . ) ( [6] P . Nie, J . Zhang, X. Feng, C. Yu, Y. He, Classification o f hybrid seeds using n e ar- i nfrared h yperspectral i maging technology combined wit h dee p learning, Sen s . A ctuators B C hem. 296 (2019) 12 6 630, htt p s: / / doi .or g /10 . 101 6 /j. s nb. 2 019.1 2 6630. ) ( [7] A .S.Garea, D.B. Heras, F. Argiello, Ca f fe CNN-based classification of hyperspectral i mages on GPU, J . Supercomput.3 (2018)1 - 13, h tt p s : / / d o i . o rg / 1 0 . 1 007 /s 1 1 2 2 7- 0 18 - 2300-2 . ) ( [8 | ] R. He, W. Xiang, S. Z he, T.T i eniu, Wasserstein CNN: learning invariant feat u res for N IR-VIS face recognition, I EEE Trans. P attern Anal. Mach. I ntell. 41 (2018) 1 761-1773, h t tps: / / doi . or g / 10 .1 109 / T PAMI. 2 018.2842770. ) ( [9] H . Li, Deep learning for n atural language processing:advantages and challenges, S ci. Rev. 5 (2018) 28-30, h t tp s: / / doi.or g/1 0 . 1 093/n s r /nw x1 1 0. ) ( [10] H . W u, Q . H uang, L. D a W ang, Gao, A CNN-SVM combined model for patternrecognition of knee motion using mechanomyography signals, J . Electromyogr. K inesiol. 42 (2018) 136-1 4 2, h t t ps: // d o i. o rg /1 0 . 1 016 / j . je lek i n . 2 018. 07 . 0 0 5. ) ( [11] H . M e n, C. Yin, Y. Shi, X . Liu, H. Fang, X. Han,J. Liu, Quantification of acrylonitrilebutadiene styrene o d or intensity b a sed on a no v el od o r assessment system with a s ensor array, IEEE Access 8 (2020) 33237 - 33249, http s:// d o i. o r g/ 10. 11 09 / ) ACCESS.2020.2973665. ( [12 ] G .B. H uang, H. Zhou, X. D ing, R. Zhang, Extreme learning machine for regressionand multiclass classification, EEE Trans. S y st. Man Cybern. Part B 42 (2012) 513-529, h ttps : / / doi . or g / 10 . 1 109 / TSMCB.2011.2 1 68604. ) ( [13] Z . Liu, D. Tang, Y. Cai , R. Wang, F. Chen, A hybrid method based on ensembleWELM fo r handling multi c l ass imbalance in cancer microarray data, N eurocomputing 266 (2017) 641-650, ht t ps:/ / d o i.org/1 0 .1 0 16/j . ) neucom.2017.05.066. ( [14] T . Guo, L . Zhang, X. Tan, Neuron pruning-based d iscriminative extreme learning machine for pattern c l assification, Cognit. Comput. 9 (2017) 581-595, htt ps:// d o i . o rg /1 0.100 7 / s 12559-017- 9 474- 4 . ) ( [ 1 5] N . K akar, S .H. Jumaa, E.D. Redona, M .L. Warburton, K . R. Reddy, Evaluating rice f or salinity using pot-culture p rovides a systematic t o lerance assessment at t heseedling s tage, Rice 1 (2019) 57, https: // doi.or g / 1 0. 1 186/s 1 2284-01 9 -0317-7 . ) ( [16] U . G l a u b itz, X . L i , K . I . K ohl, J . T . V. D o ngen, E. Z u t her, Di f fe r en t i a l physiological r e sp o n ses o f d i fferent ric e ( Oryz a s a ti v a) c u l ti v a r s t o el e v at e d n i g h t t e m p e r a tu r e d uring v egetati v e g rowth , F unct. P l a nt B i o l . 41 (201 4 ) 437- 4 4 8. ) ( [17] Y . Z hu , D . W a ng , W . Li , Y. Y a n g , P . S h i , S p a tia l d is tr ib ution of s o il tra c e e le m en t c o n ce n t rati o n s a l o ng an ur b an- r ur a l tran s i tion zon e i n t he bla c k so i l reg i o n of n ort h east e rn C h ina, J . So il s Sediments 19 (20 19 ) 2945 - 2956. ) ( [18] P . J ia, F. Meng, H. Cao, S. D uan, X. Peng, M . Xu, Training te c hnique of electronic n ose using l abeled and u nlabeled samples b a sed o n multi-kernel L a pSVM, Sens.Actuators B Chem. 294 (2 0 19) 98-105, htt p s:/ / d o i. org/ 1 0. 10 16/j. s nb.2019.05 . 03 4 . ) ( [19] Y . Shi, F . Gong, M. Wang, J. Liu, Y. Wu, H. M e n, A deep feature mining method of e lectronic nose sensor data for identifying beer olfactory information, J. Food Eng. 2 63 (2019) 437-445, h t tps: //d oi.org/ 1 0. 1 016/ j .jfoodeng.2019.07.023. ) ( [20] J. Shi, Y . Nian, D. Da, X. Xu, G . Z h ou, D. Zhao, C. Li, Ch a racterization of flavor volatile compounds in sauce spareribs by gas chromatography-mass spectrometryand e lectronic nose, Lwt 1 24 (2020) 109182, h t t p s :/ / d o i.org/ 1 0 .1 0 16/j. l wt . 20 2 0 .109182 . ) ( [21] S . Q iu, L. Gao, J . Wang, Classification and regression of ELM, L V Q and SVM for E - n ose data of strawberry juice, J. F ood Eng. 144 (2015) 77-85, htt p s ://d oi. org / 1 0 . 1 016/ j . j foo d eng . 201 4 .07.01 . ) [22] X. Hu, L. Lu, Z. Guo, Z. Zhu, Volatile compounds, affecting factors and evaluationmethods for rice aroma: a review,Trends Food Sci. Technol. 97 (2020) 136-146,https://doi.org/10.1016/j.tifs.2020.01.003. ( [23] N. C aporaso, M.B. Whitworth, S. Grebby, I. D . F i sk, N on-destructive analysis ofsucrose, c affeine and trigonelline on single green coffee beans by h y perspectral i maging, Food Res. Int. 1 06 (2018) 1 9 3-203,htt p s :/ / d o i . o rg/1 0 . 1 016/j. f o odr e s . 2017 . 12.031 . ) ( [ 2 4] L .G u o, Y. Y u , H. Yu, Y. T a ng, J. L i , Y . D u, Y. C hu, S. M a, Y. M a, X. Zeng, R a pidquantitative analysis o f adulterated rice with partial least squares re g ression usinghyperspectral imaging s y stem, J . Sci. Food Agric. 9 9 (2019) 5558-55 6 4, htt ps:/ / do i . o rg/1 0 .1 0 0 2 / js fa . 9824 . ) [25] Zimmermann Boris, Kohler Achim, Optimizing Savitzky-Golay parameters forimproving spectral resolution and quantification in infrared spectroscopy, Appl.Spectrosc.: Ociety Appl. 67 (2013) 892-902, https://doi.org/10.1366/12-06723. [26] Y. Yu, H. Yu, L. Guo, J. Li, Y. Chu, Y. Tang, S. Tang, F. Wang, Accuracy and stabilityimprovement in detecting Wuchang rice adulteration by piece-wise multiplicativescatter correction in the hyperspectral imaging system, Anal. Methods 10 (2018)3224-3231, https://doi.org/10.1039/c8ay00701b. ( [ 27] W . Tang, D. Zou, S. Yang, J. Shi, G. Song, A two-stage approach for automatic liver s egmentation with f aster R-CNN and D eepLab, Neural C omput. Appl.(2020), h ttps :// d oi . or g /1 0 .1007 / s005 2 1 - 01 9 - 0 4700- 0 . ) ( [ 28] Z . Lei, Z. D avid, Evolutionary cost-sensitive extreme learning, IEEE Trans. Neu r al N etw. Learn. S yst. 28 (2017) 3045-3060, h t t p s : / / d o i .o rg / 10 . 1 109 / T NN L S.2016.2607757. ) ( [29] Y .Li, J. Zhang, T. L i , H. Liu, J. Li, Y. Wang, G eographical traceability o f wild B oletus e dulis based o n data fusion o f F T-MIR a n d ICP-AES co u pled with dat a mining methods ( S VM), Spectrochimica Acta Part A , M o l. Biomol. Spectrosc. 1 77 ( 2017) 20-27, h t tp s : / /d oi. or g/ 1 0.1 0 16/j .s aa . 2 017.0 1 . 0 29. ) ( [ 30] H. Men, Y. Sh i , Y. Jiao, S. Fu, J. Liu, Electronic n o se sensors data fe a ture mi n ing: asynergetic strategy f o r the classifcation of beer, Analatical M e thods. 10 (20 1 8) 2016-2025,ht t ps: //d oi. o rg / 1 0 . 1 039/ c 8 ay0 0 280k. ) Yan Shi, he is a doctorial student at the School of Automation Engineering, NortheastElectric Power University, Jilin, China. His research interests are the machine sensingtechnologies such as electronic nose, electronic tongue, hyperspectral, multi-sensor datafusion and pattern recognition. ( Hangcheng Yuan, he is a graduate s t udent at t he School of Automation E ngineering, N ortheast Electric P ower University, J i lin, C hina. H i s r e search interests a r e t h e deeplearning, machine perception technology, and the development and application of instruments. ) ( Chenao Xiong, he is a g raduate student at t he Faculty of Electrical and Electronic Engi-neering, University of Nottingham, Nottingham, U nited Kingdom. His research i nterestsare the design and d evelopment of electronic i nstruments and t he d ata processing ofdetection s ignals. ) ( Q i Z hang, he is a graduate s t udent a t t h e School of Precision Instrument and Optoelec- t ronic E ngineering, Tianjin Un i versity, Tianjin, China. His research interests are the in-dustrial image processing and a lgorithm research. ) Shuyue Jia, he is a candidate for a graduate student at the Faculty of Engineering, theUniversity of Sydney, Sydney, Australia.He is studying for his bachelor’s degree at theSchool of Computer Science, Northeast Electric Power University, Jilin, China. Hisresearch interests are the deep learning and pattern recognition. Jingjing Liu, she is an associate professor at the School of Automation Engineering,Northeast Electric Power University, Jilin, China. She received his Ph.D. in 2013 from JilinUniversity, Changchun, China. Her research interests are the sensor development andapplication, machine sensing technology and multi-sensor data fusion. Hong Men, he is a professor at the School of Automation Engineering, Northeast ElectricPower University, Jilin, China. He received his Ph.D. in 2005 from Zhejiang University,Hangzhou, China. His research interests are the machine sensing technology for electronicnose, hyperspectral, electronic tongue, and electronic eye, multi-sensor data fusion andpattern recognition. 本研究提出了一种跟踪水稻品质差异的协同策略将深度学习和机器学习理论相结合,提高融合系统的检测性能。首先,利用电子鼻和高光谱技术采集水稻品质信息成像系统。其次设计了一种新的卷积神经网络(CNN)结构来提取基于卷积和池化过程的融合数据特征。最后,一个新颖的全局扩展极限提出了一种基于拖拽因子和全局识别系数的学习机(GE-ELM),该学习可以扩展和平衡类之间的差异,从而提高识别能力和识别能力提高稳定性。与传统的特征挖掘和识别方法相比,CNN提取融合特征有效,基于GEELM的分类性能达到98.07%。总之,CNN-GE-ELM被证明是一种有效的分析技术,以改善融合系统的检测性能,实现了对质量差异的高精度识别大米。风味检测设备:德国AIRSENSE电子鼻pen3文章信息:Improving performance_ A collaborative strategy for the multi-data fusion of electronic nose and hyperspectral to track the quality difference of rice
确定
还剩7页未读,是否继续阅读?

产品配置单

北京盈盛恒泰科技有限责任公司为您提供《水稻中品质差异的协同策略研究检测方案(感官智能分析)》,该方案主要用于其他中品质差异的协同策略研究检测,参考标准--,《水稻中品质差异的协同策略研究检测方案(感官智能分析)》用到的仪器有德国AIRSENSE品牌PEN3电子鼻
推荐专场
感官智能分析系统(电子鼻/电子舌)

相关方案
更多
该厂商其他方案
更多