


方案详情
文
采用微波辅助水热和煅烧相结合的方法生产系列介孔氧化镁@碳(MgO@C)混合纳米复合材料,并通过TEM、XPS、XRD和拉曼光谱进行研究和验证。通过TEM、XPS、XRD和拉曼光谱的研究和验证。煅烧后的MgO@C纳米复合材料具有较高的比表面积和较小的晶粒尺寸,在优化制备后具有较强的降解对苯二酚能力。在室温下,MgO@C-600分解的对氨基苯酚毒素量约为55.65mg/g@90min。此外,拟二阶动力学模型(R2>0.99)更适合实验降解数据。MgO@C-600的强化降解机制制得到了验证,使用氯化硝基蓝四唑(NBT)作为探针来检测更多的超氧自由基(-O2-)活性点的产生。光热效。与非辐照样品相比,在808纳米的近红外(NIR)辐射下,去除效率提高了8倍。由于它们易于制造,成本低,而且去除效率高。MgO@C纳米复合材料可以作为一种合适的吸附剂,用于消除有机磷危险污染物。
方案详情

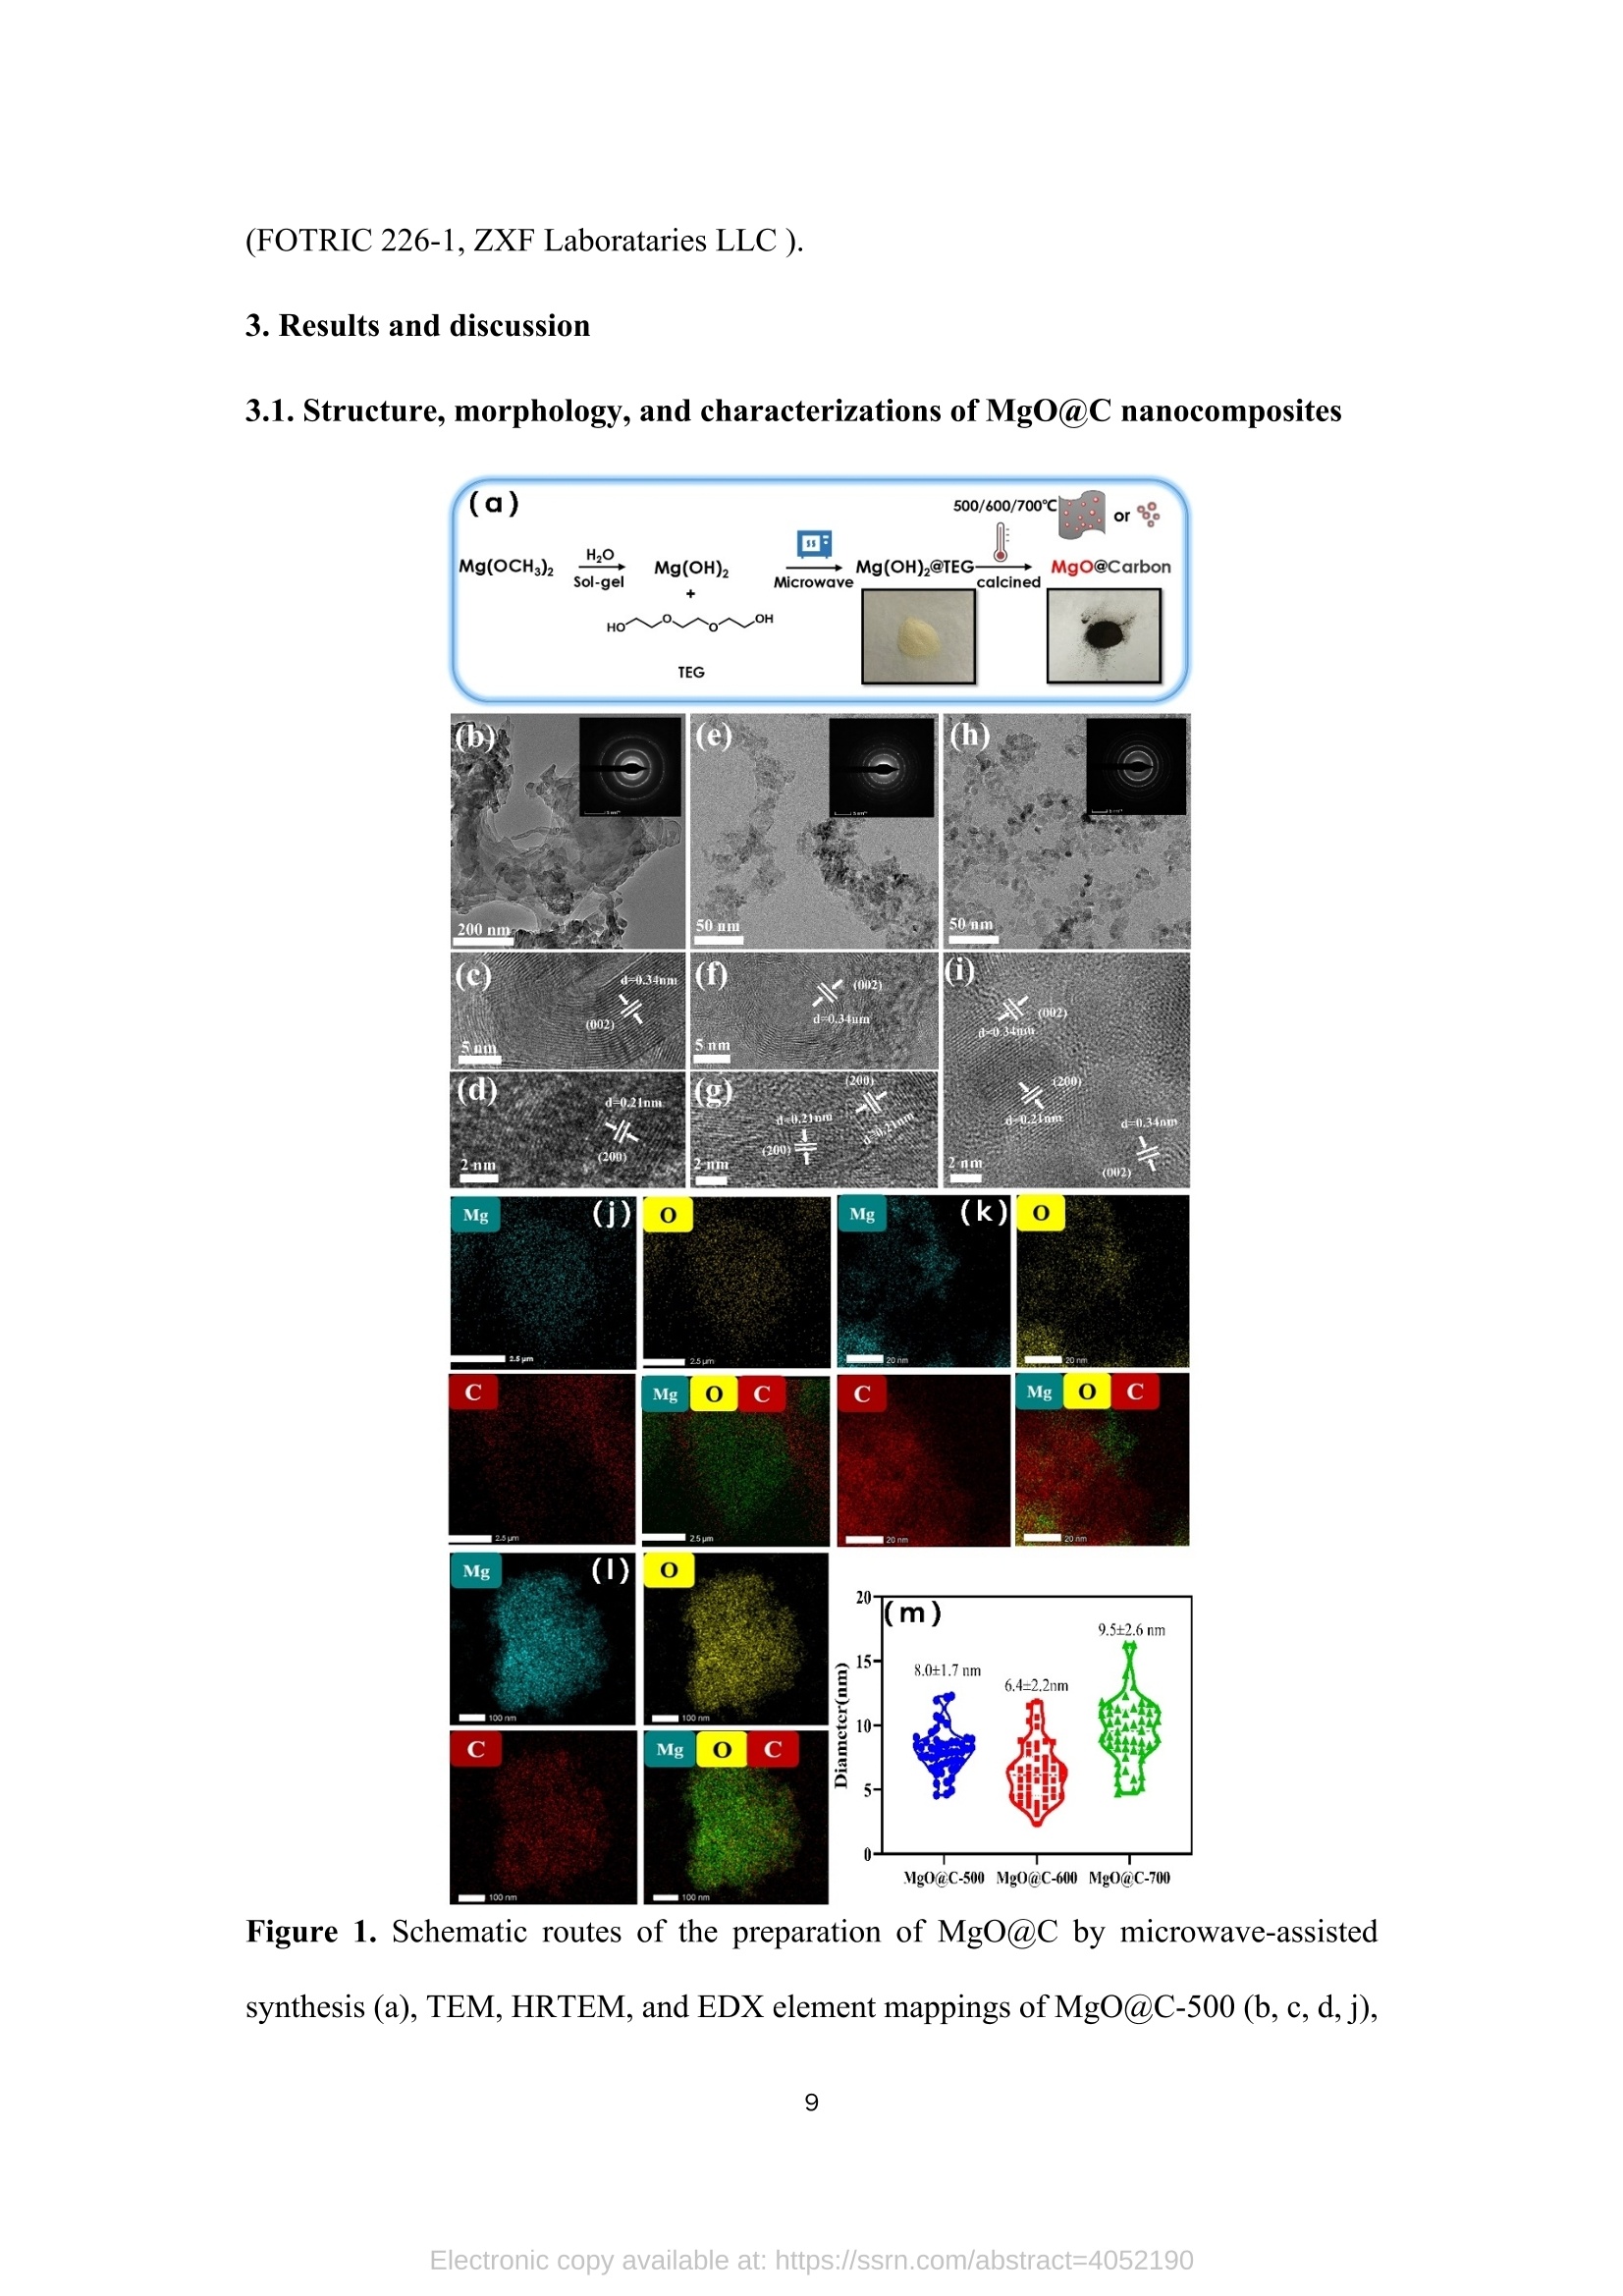
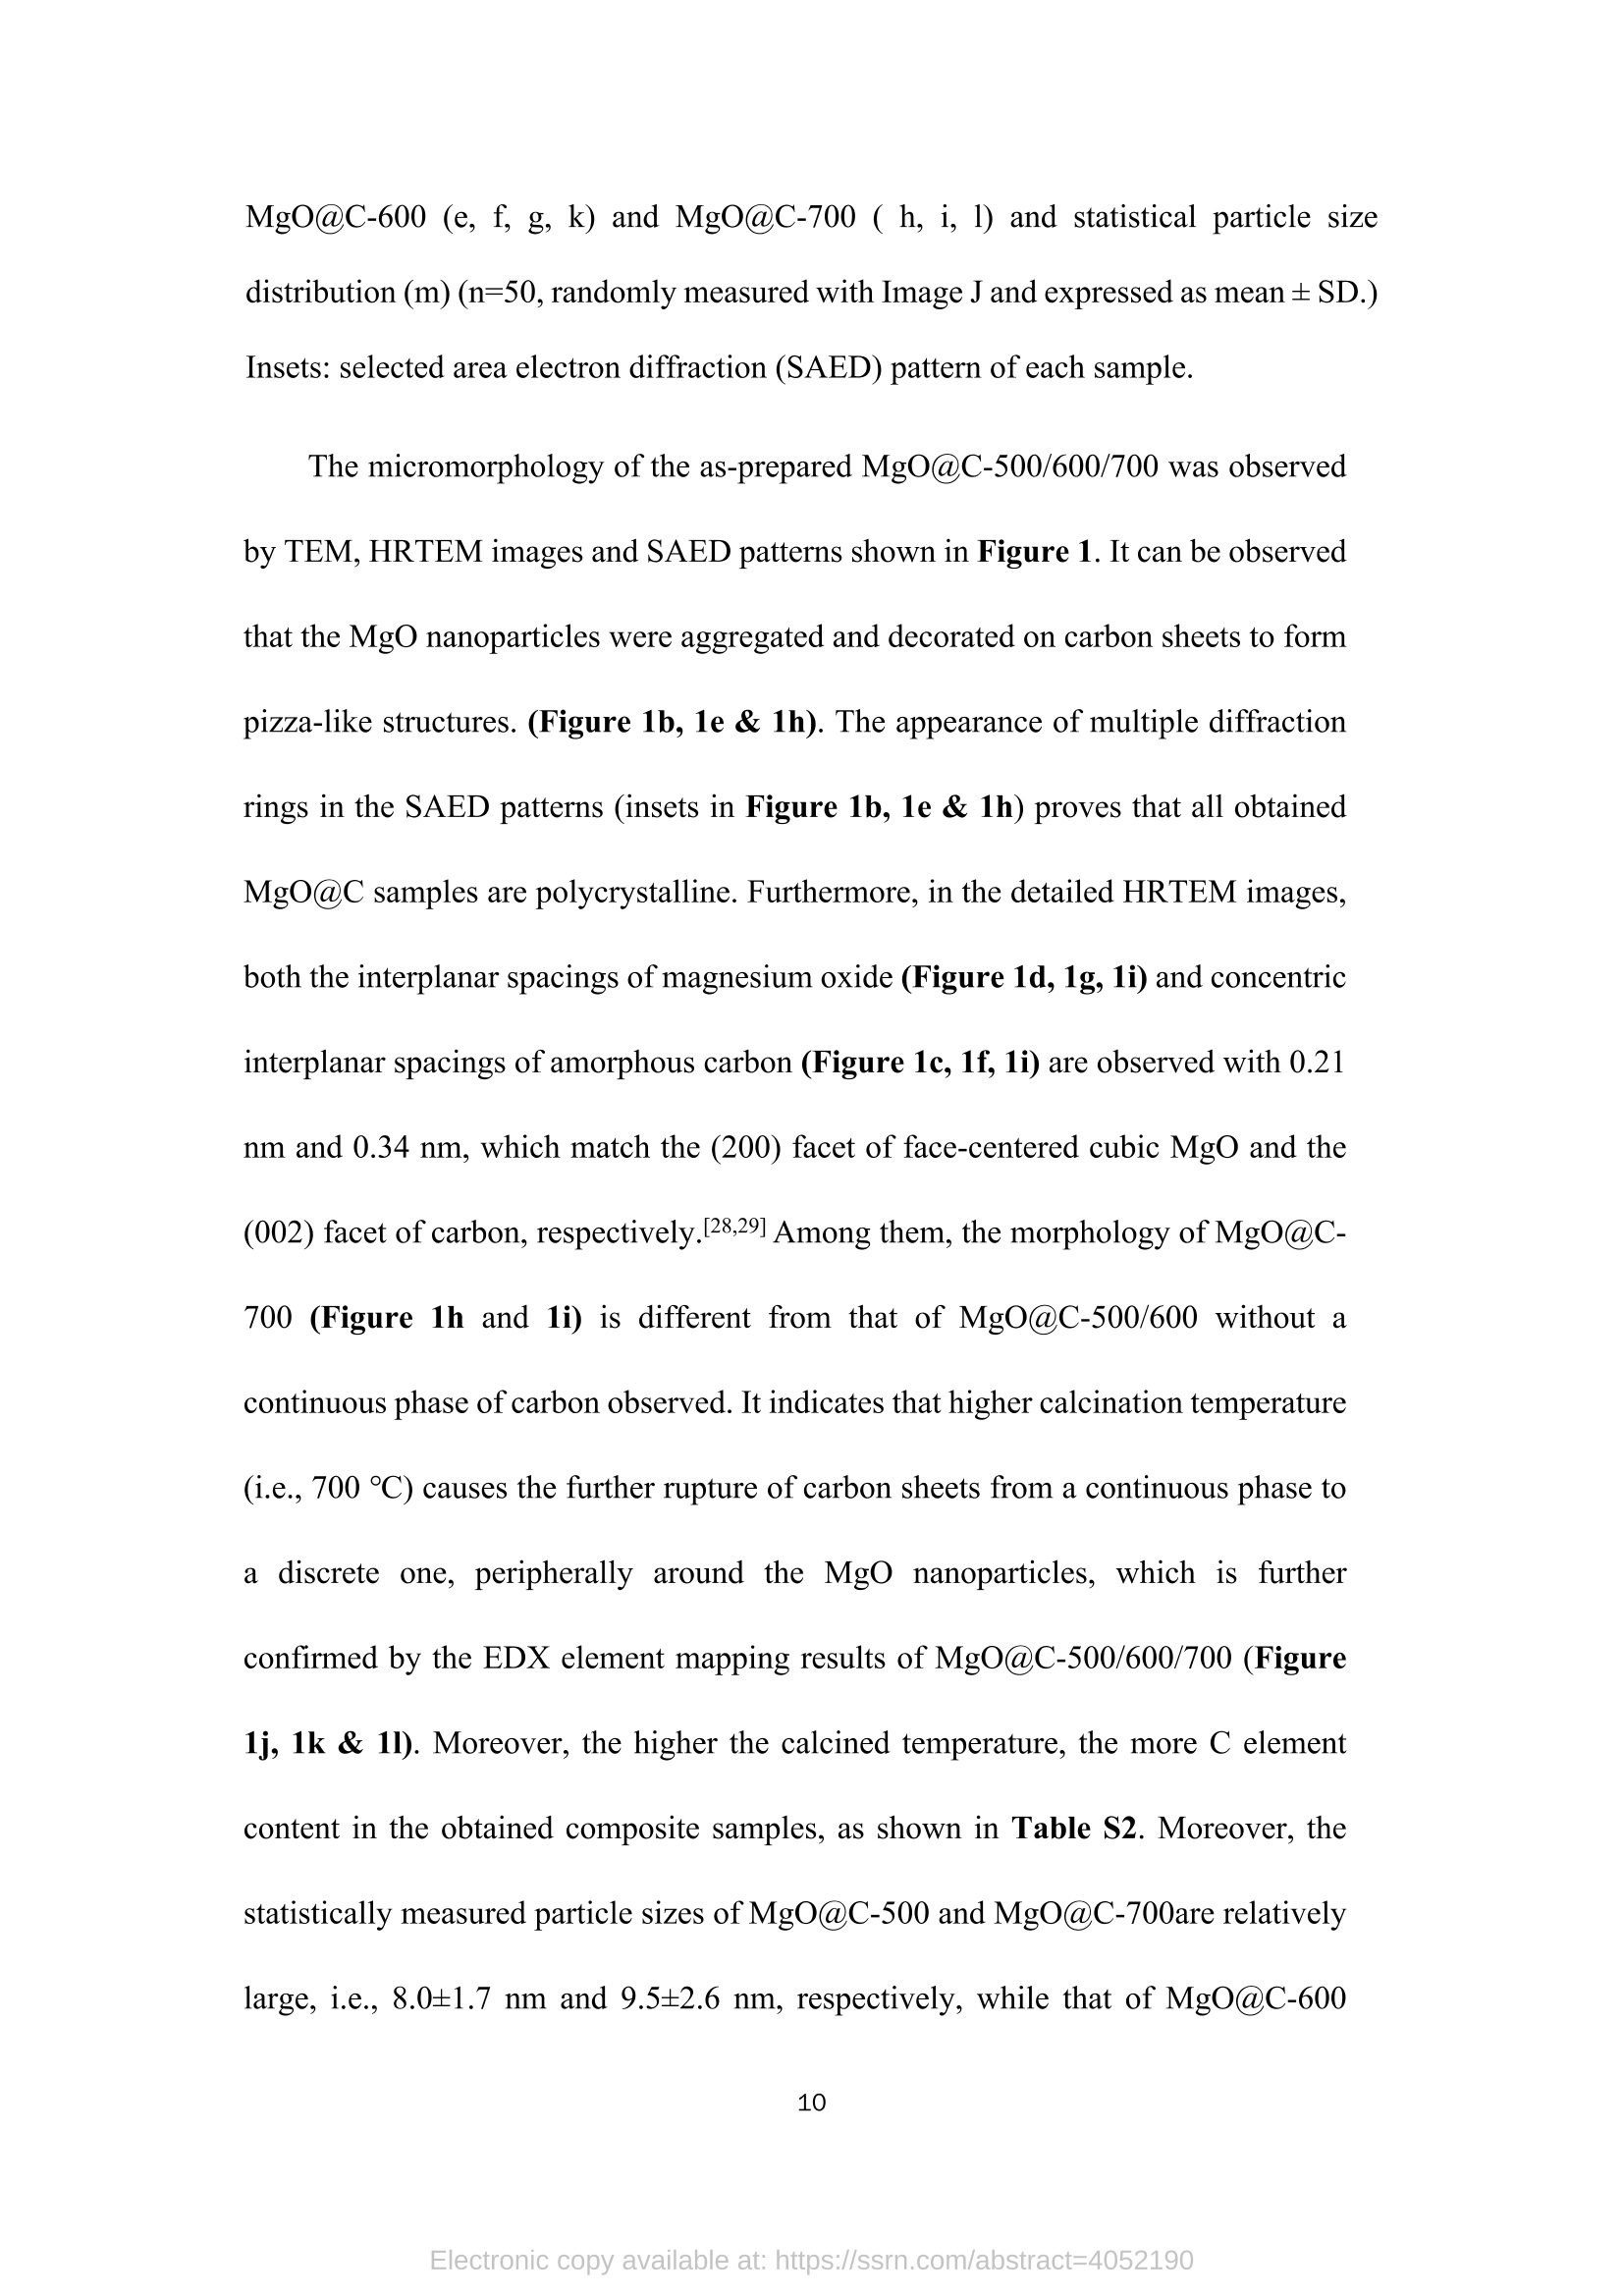
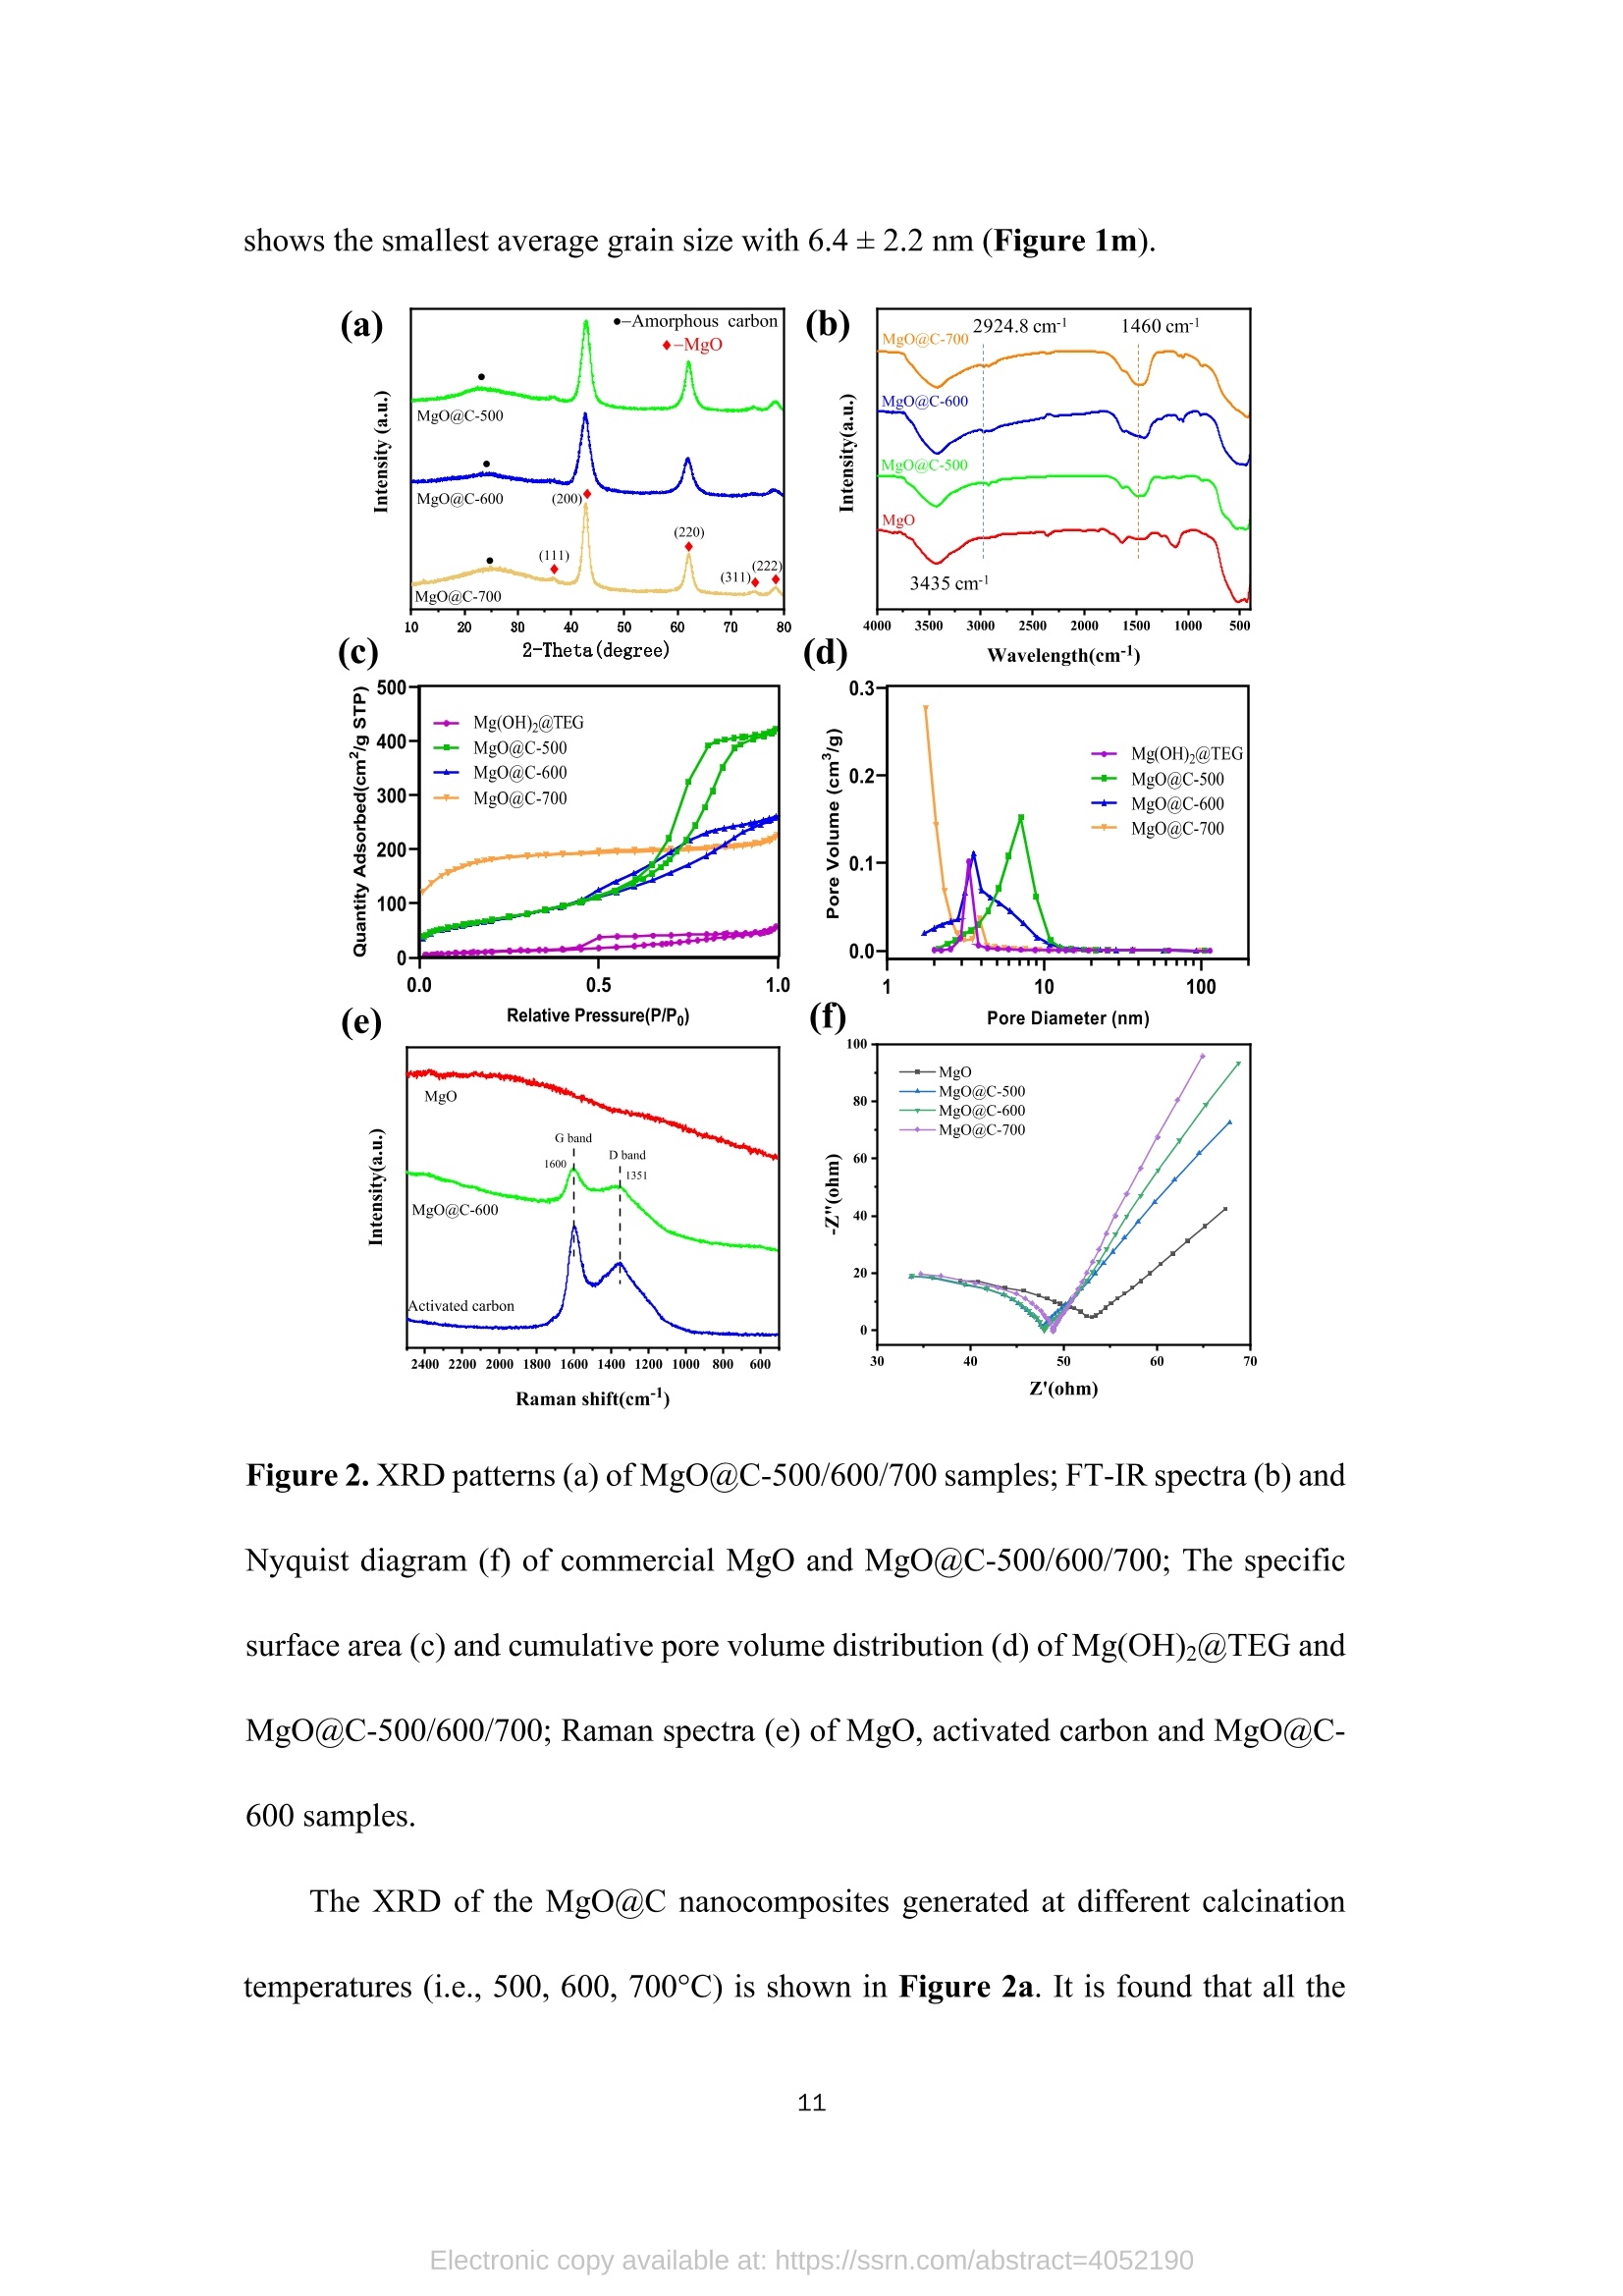
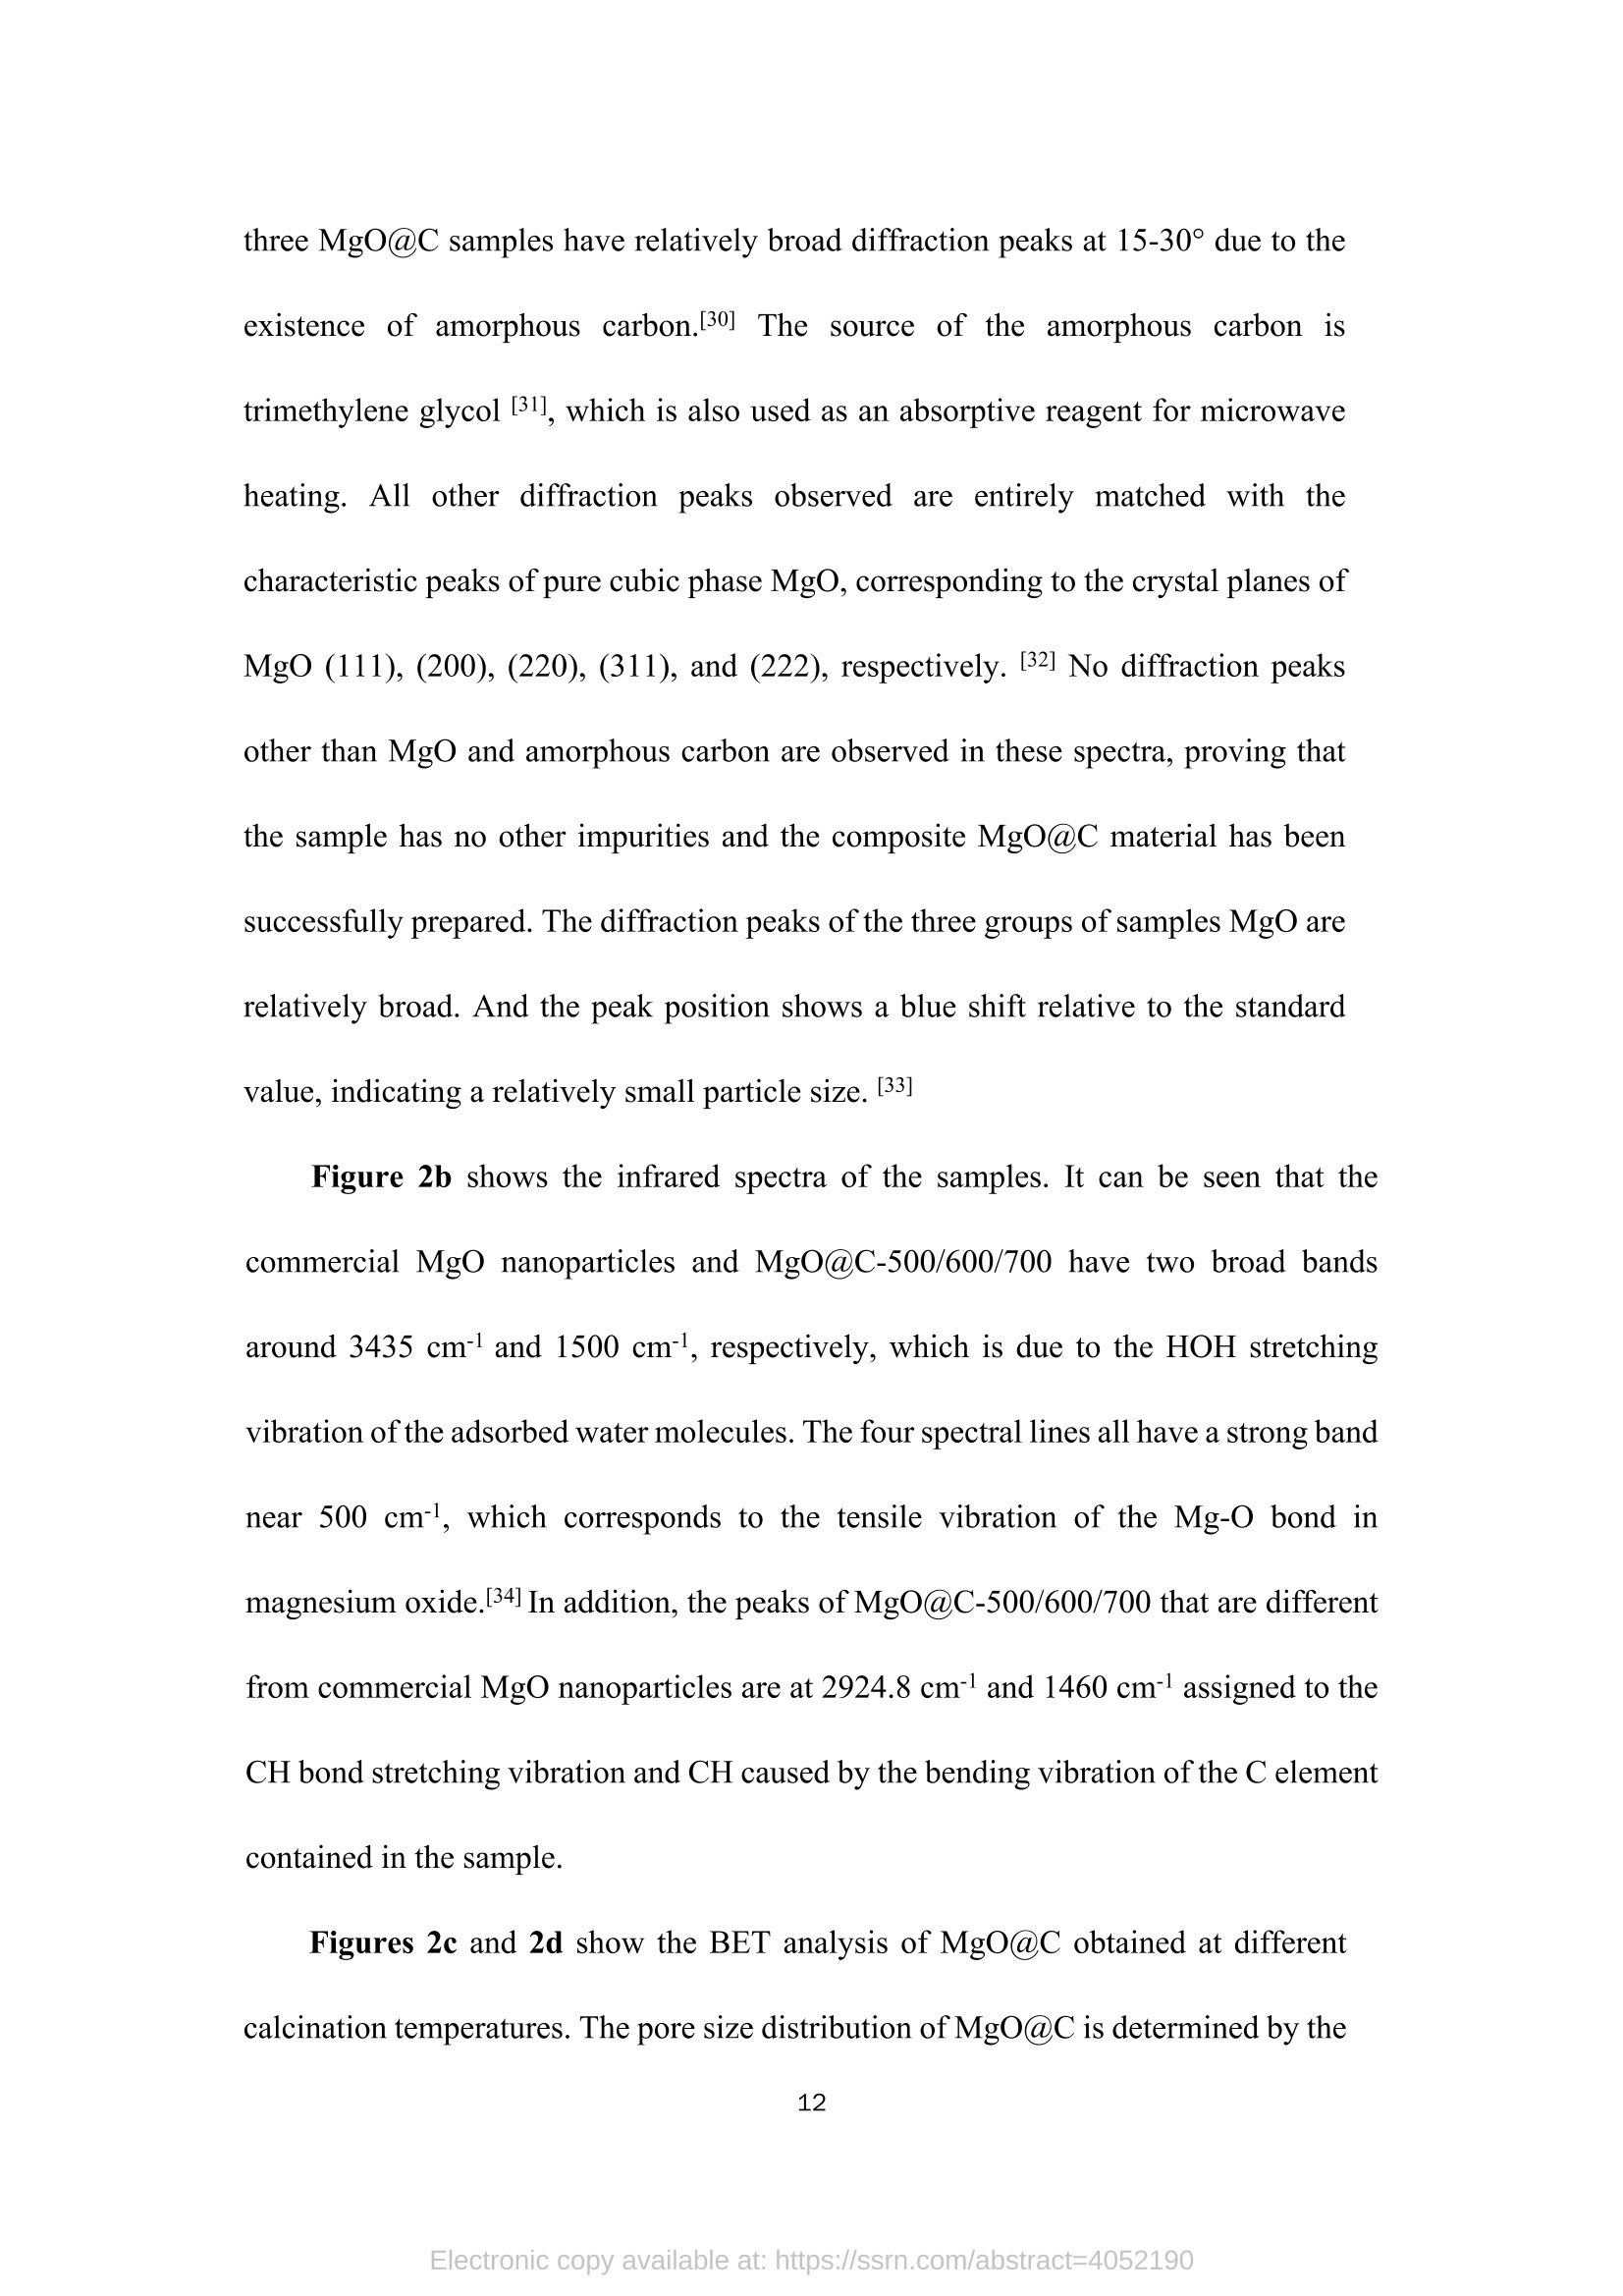
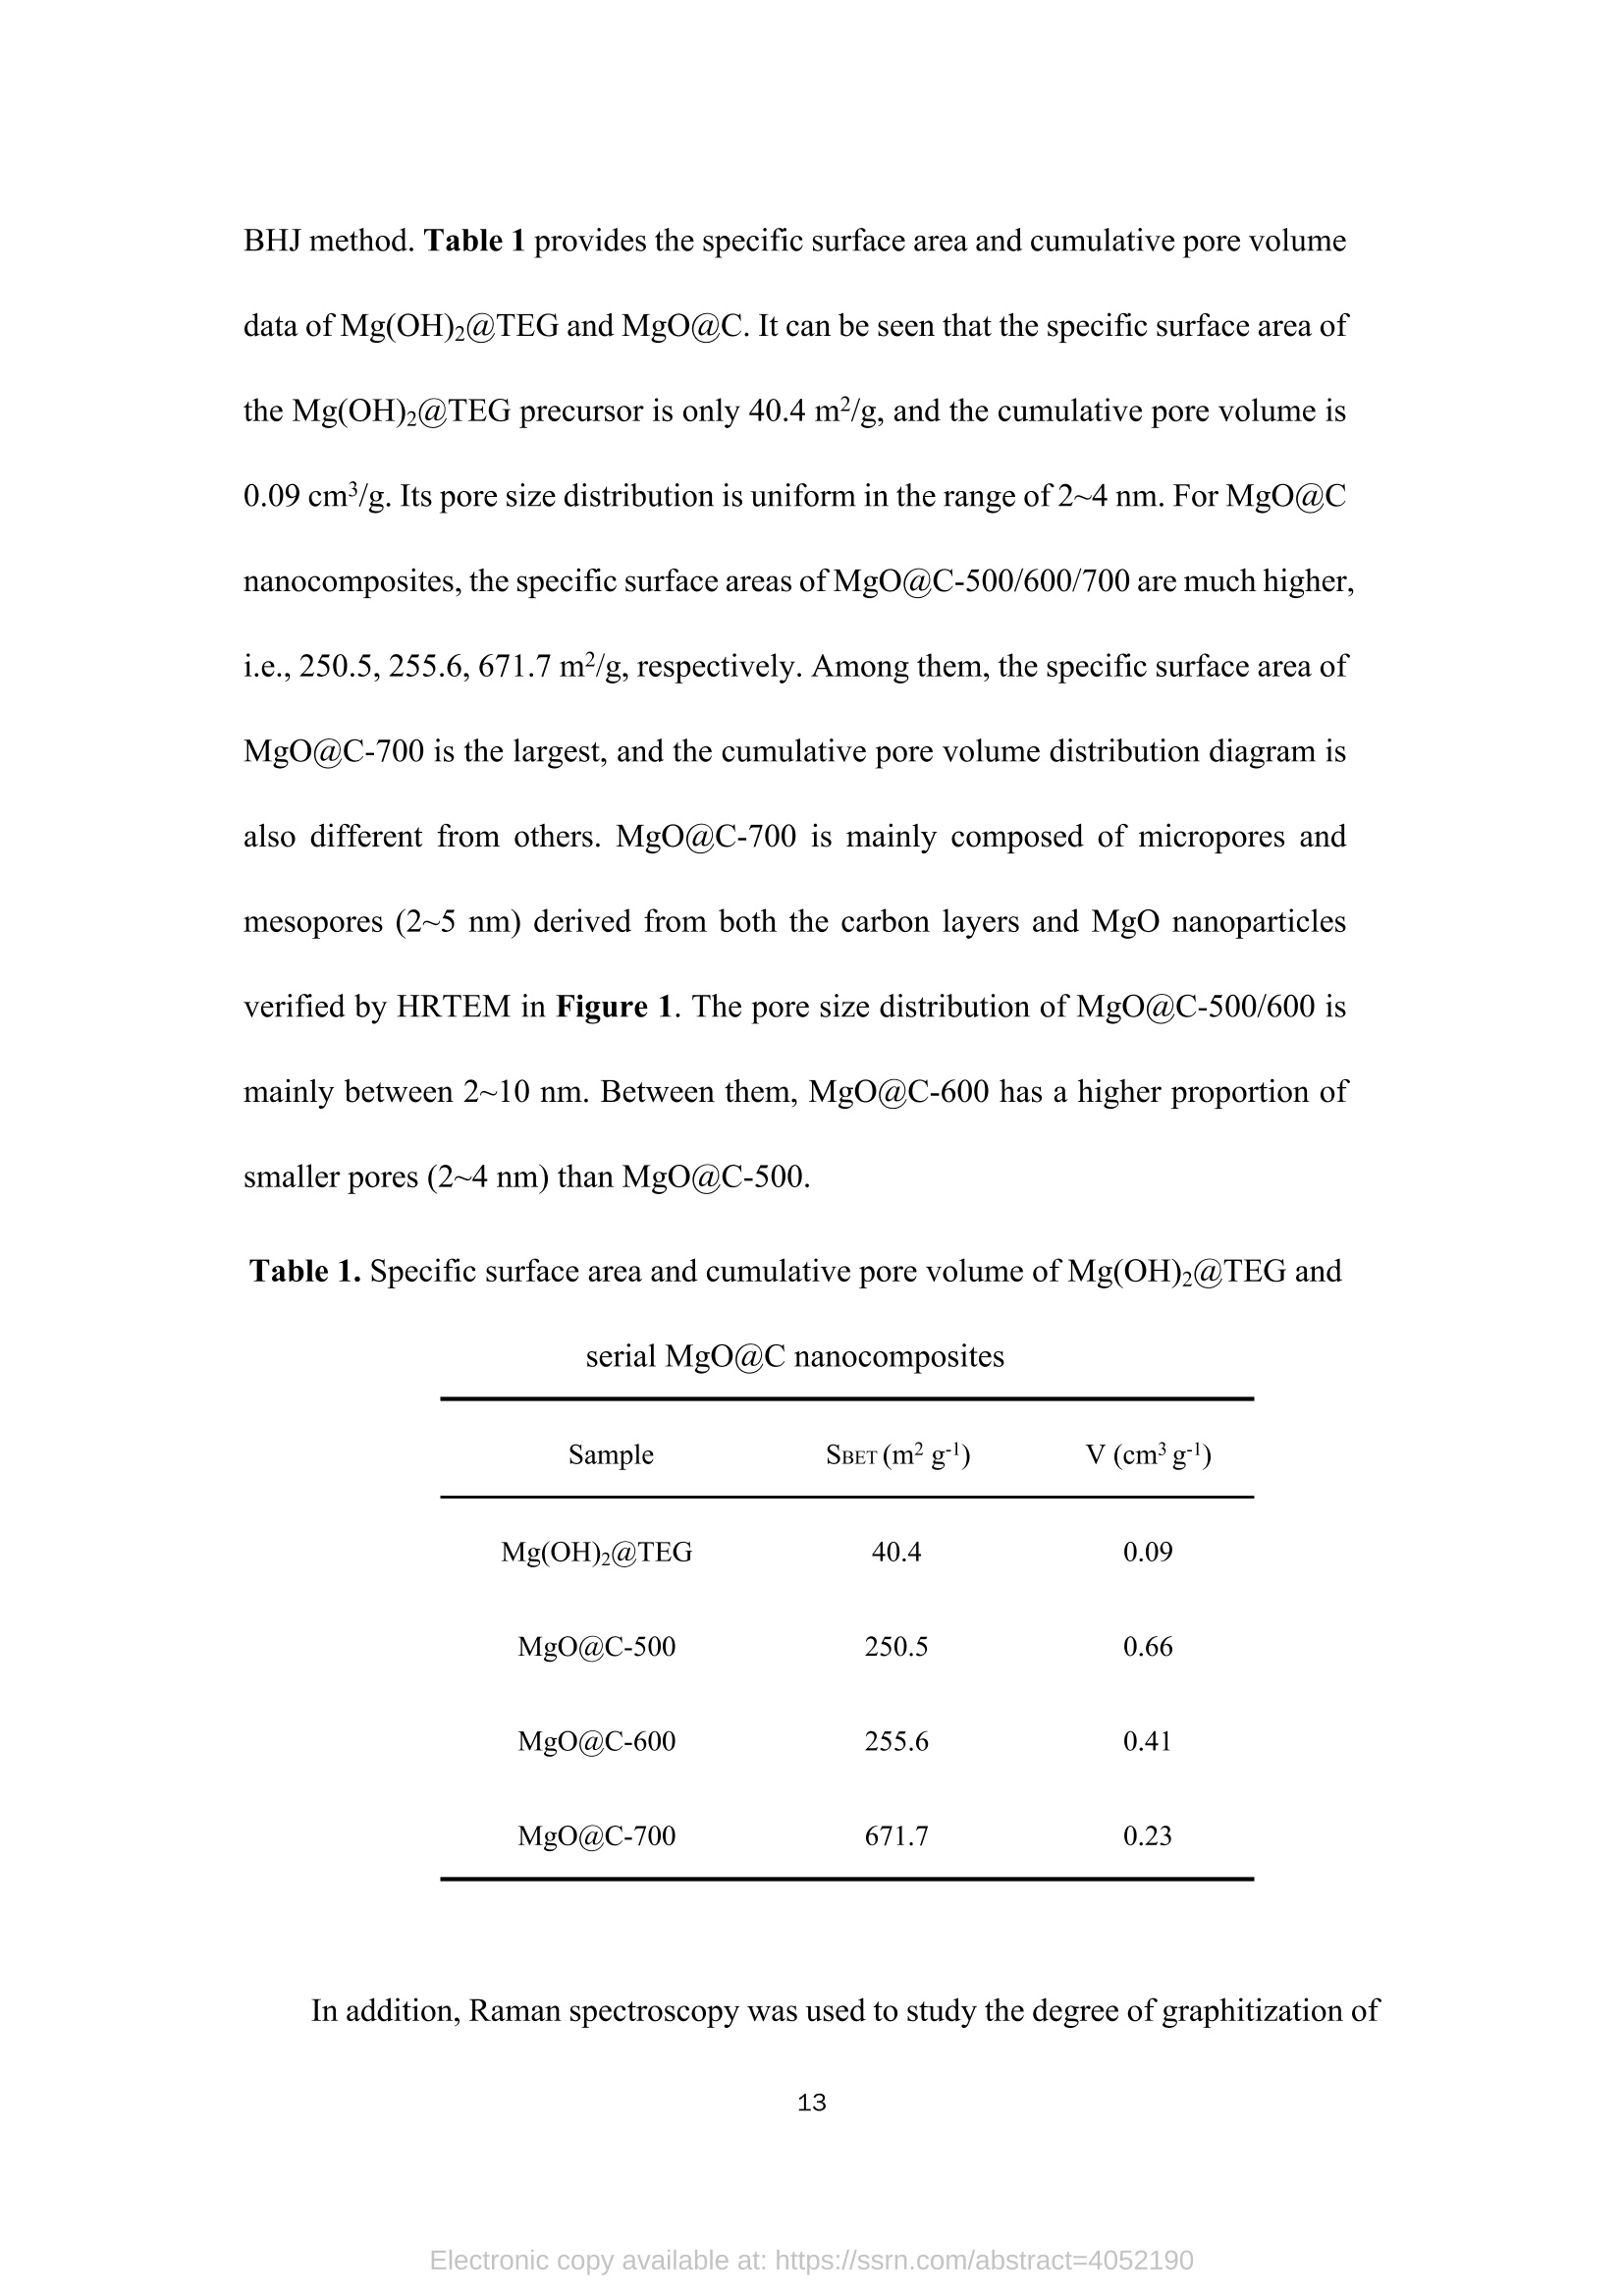
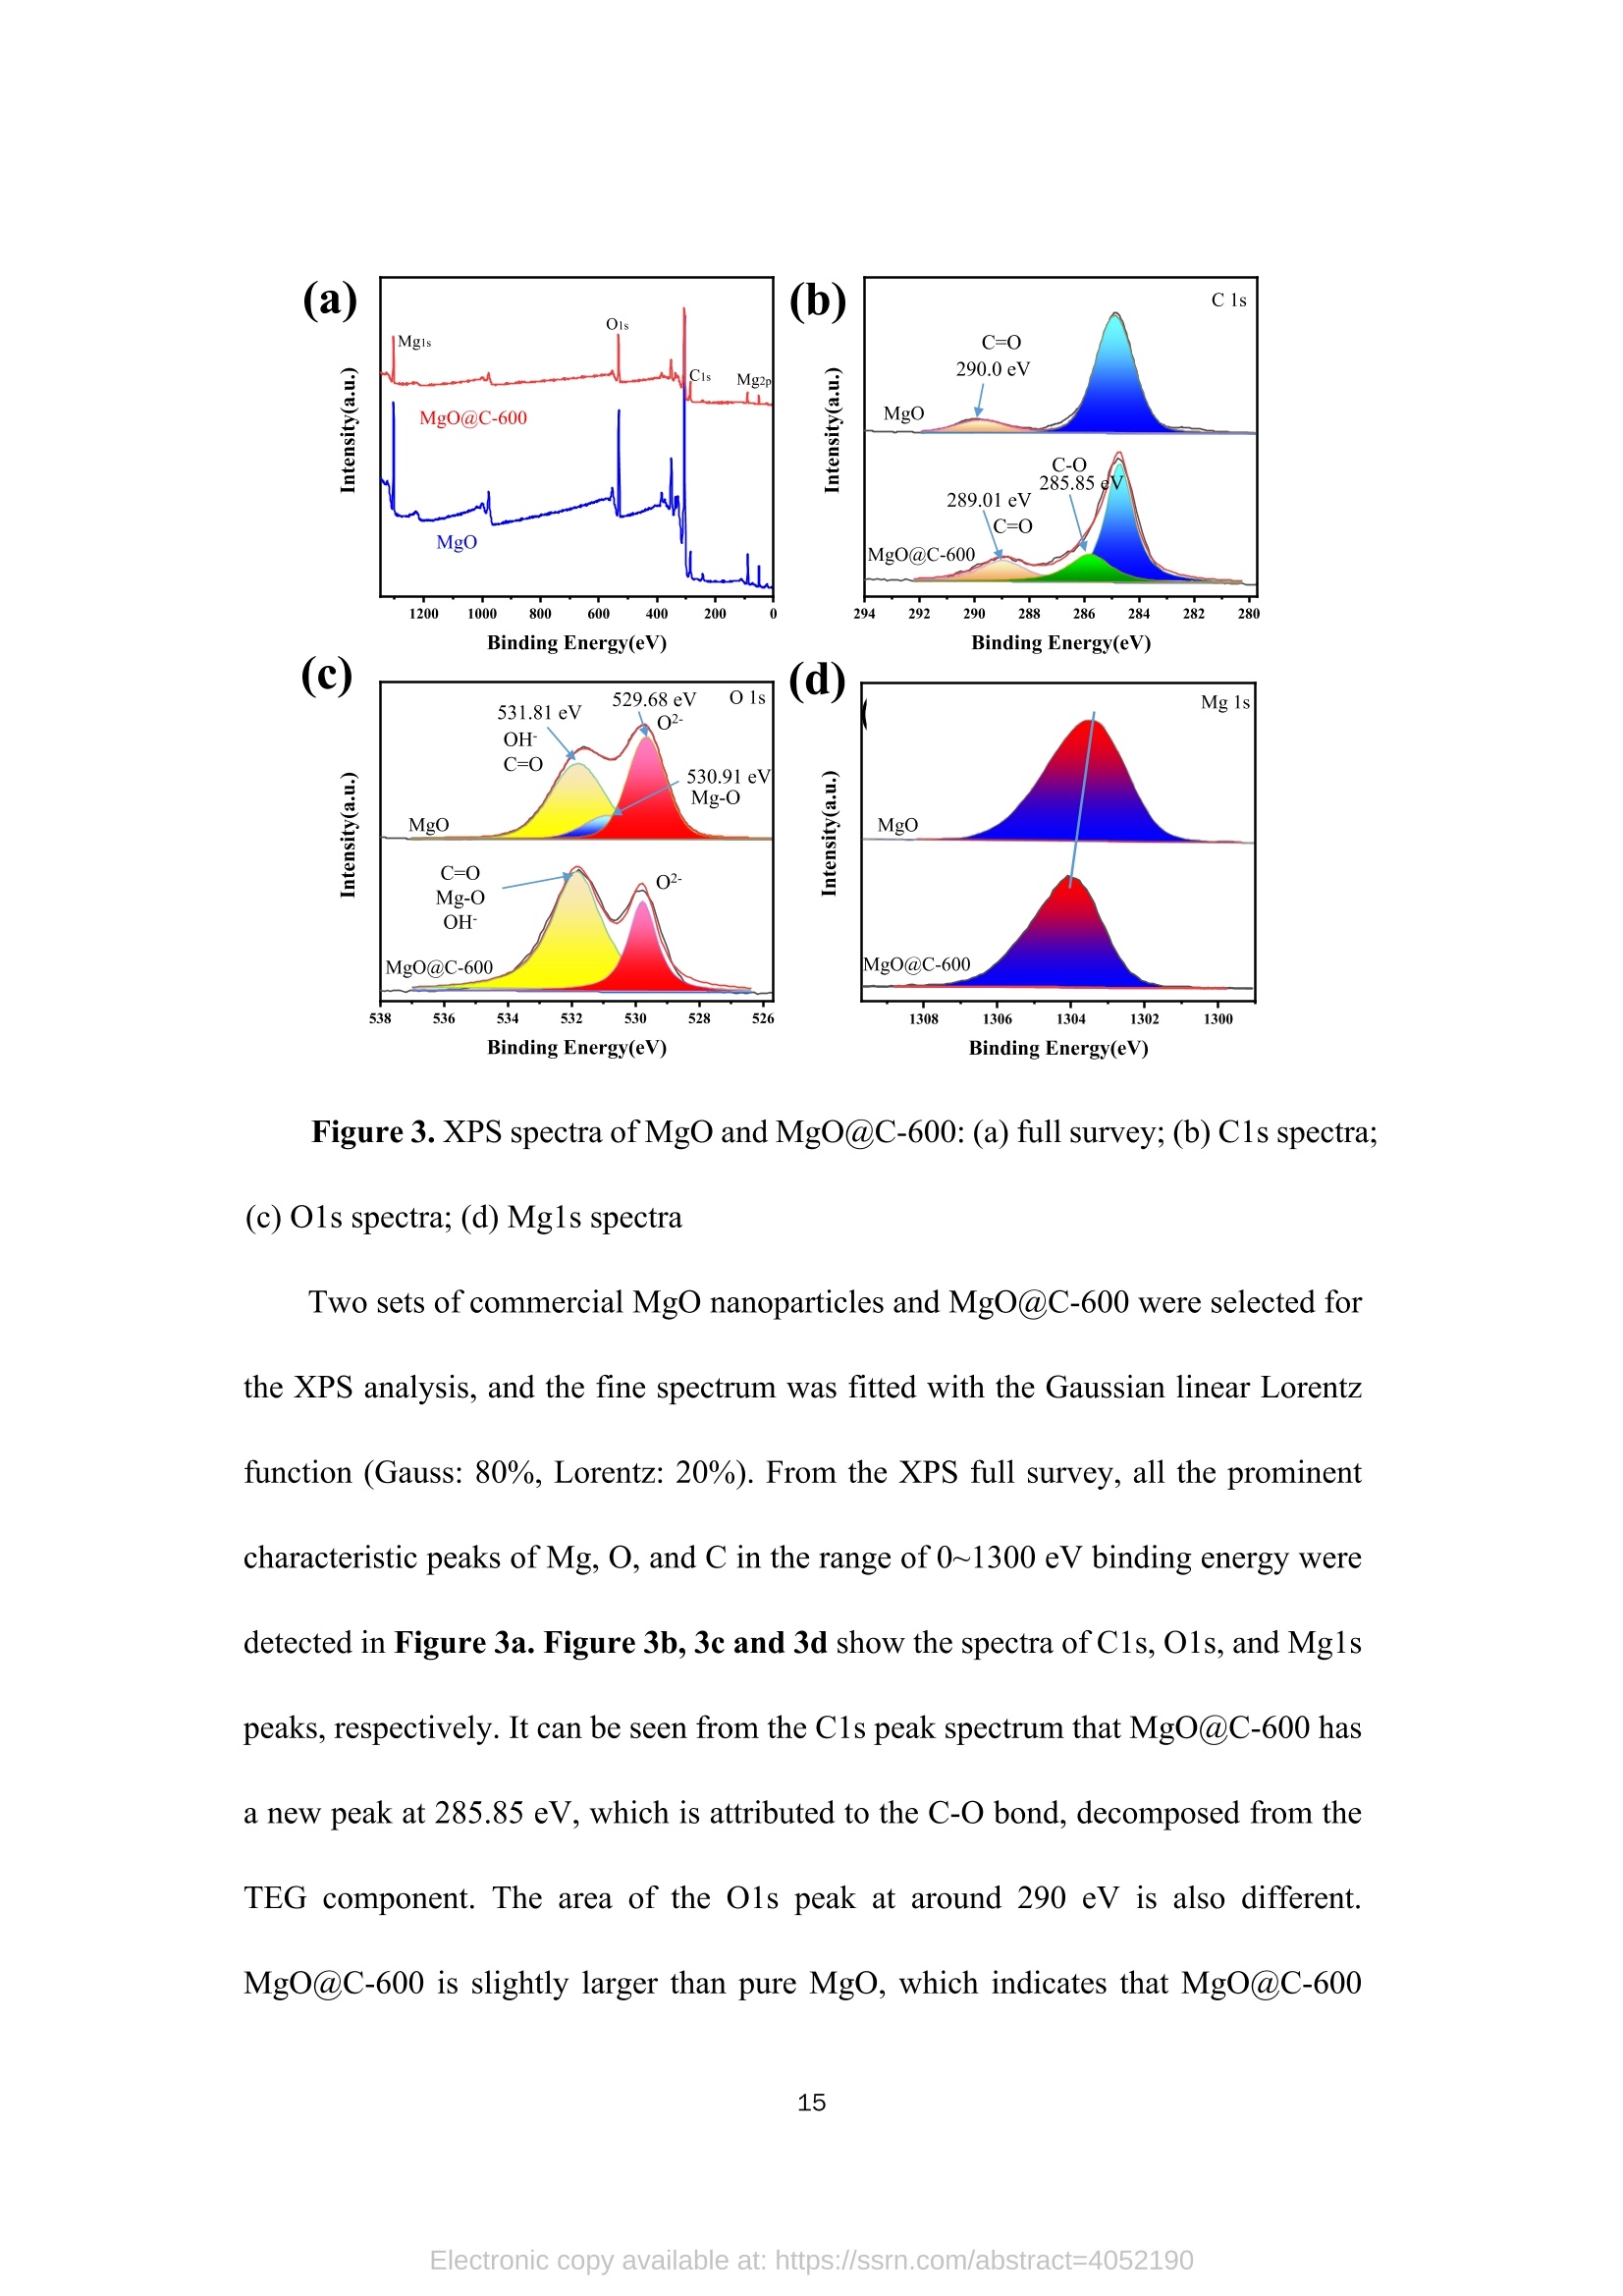
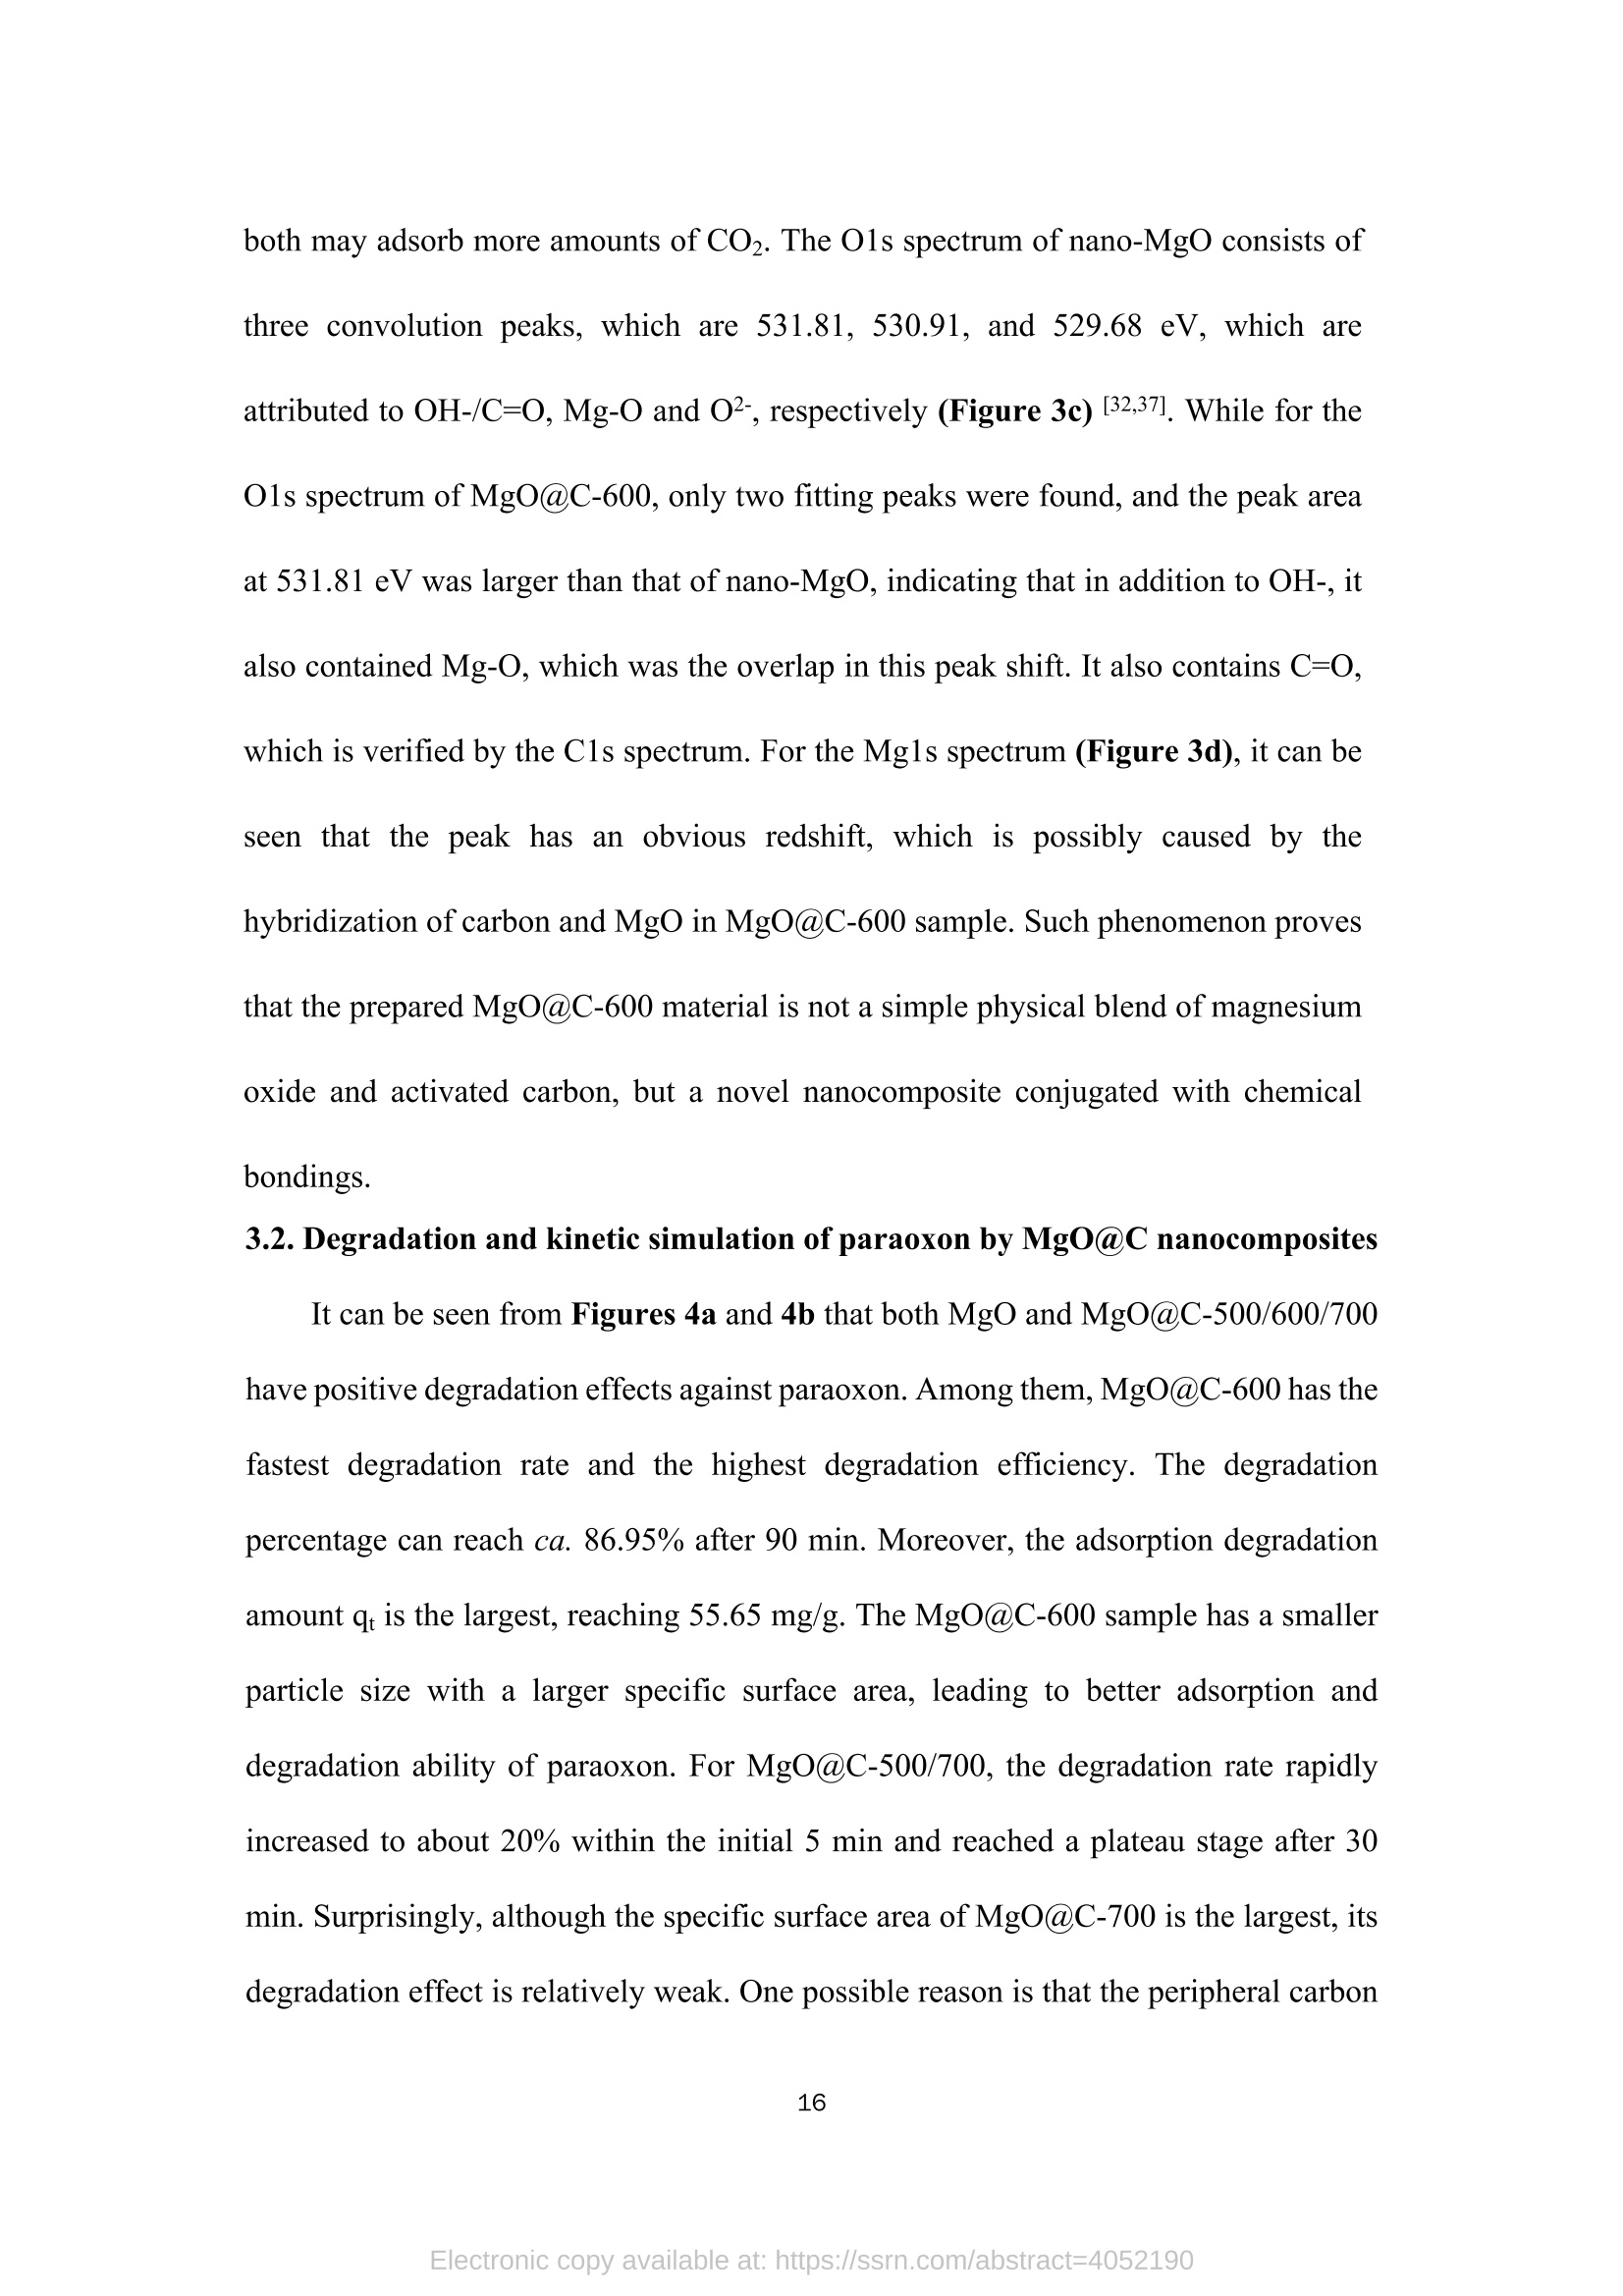
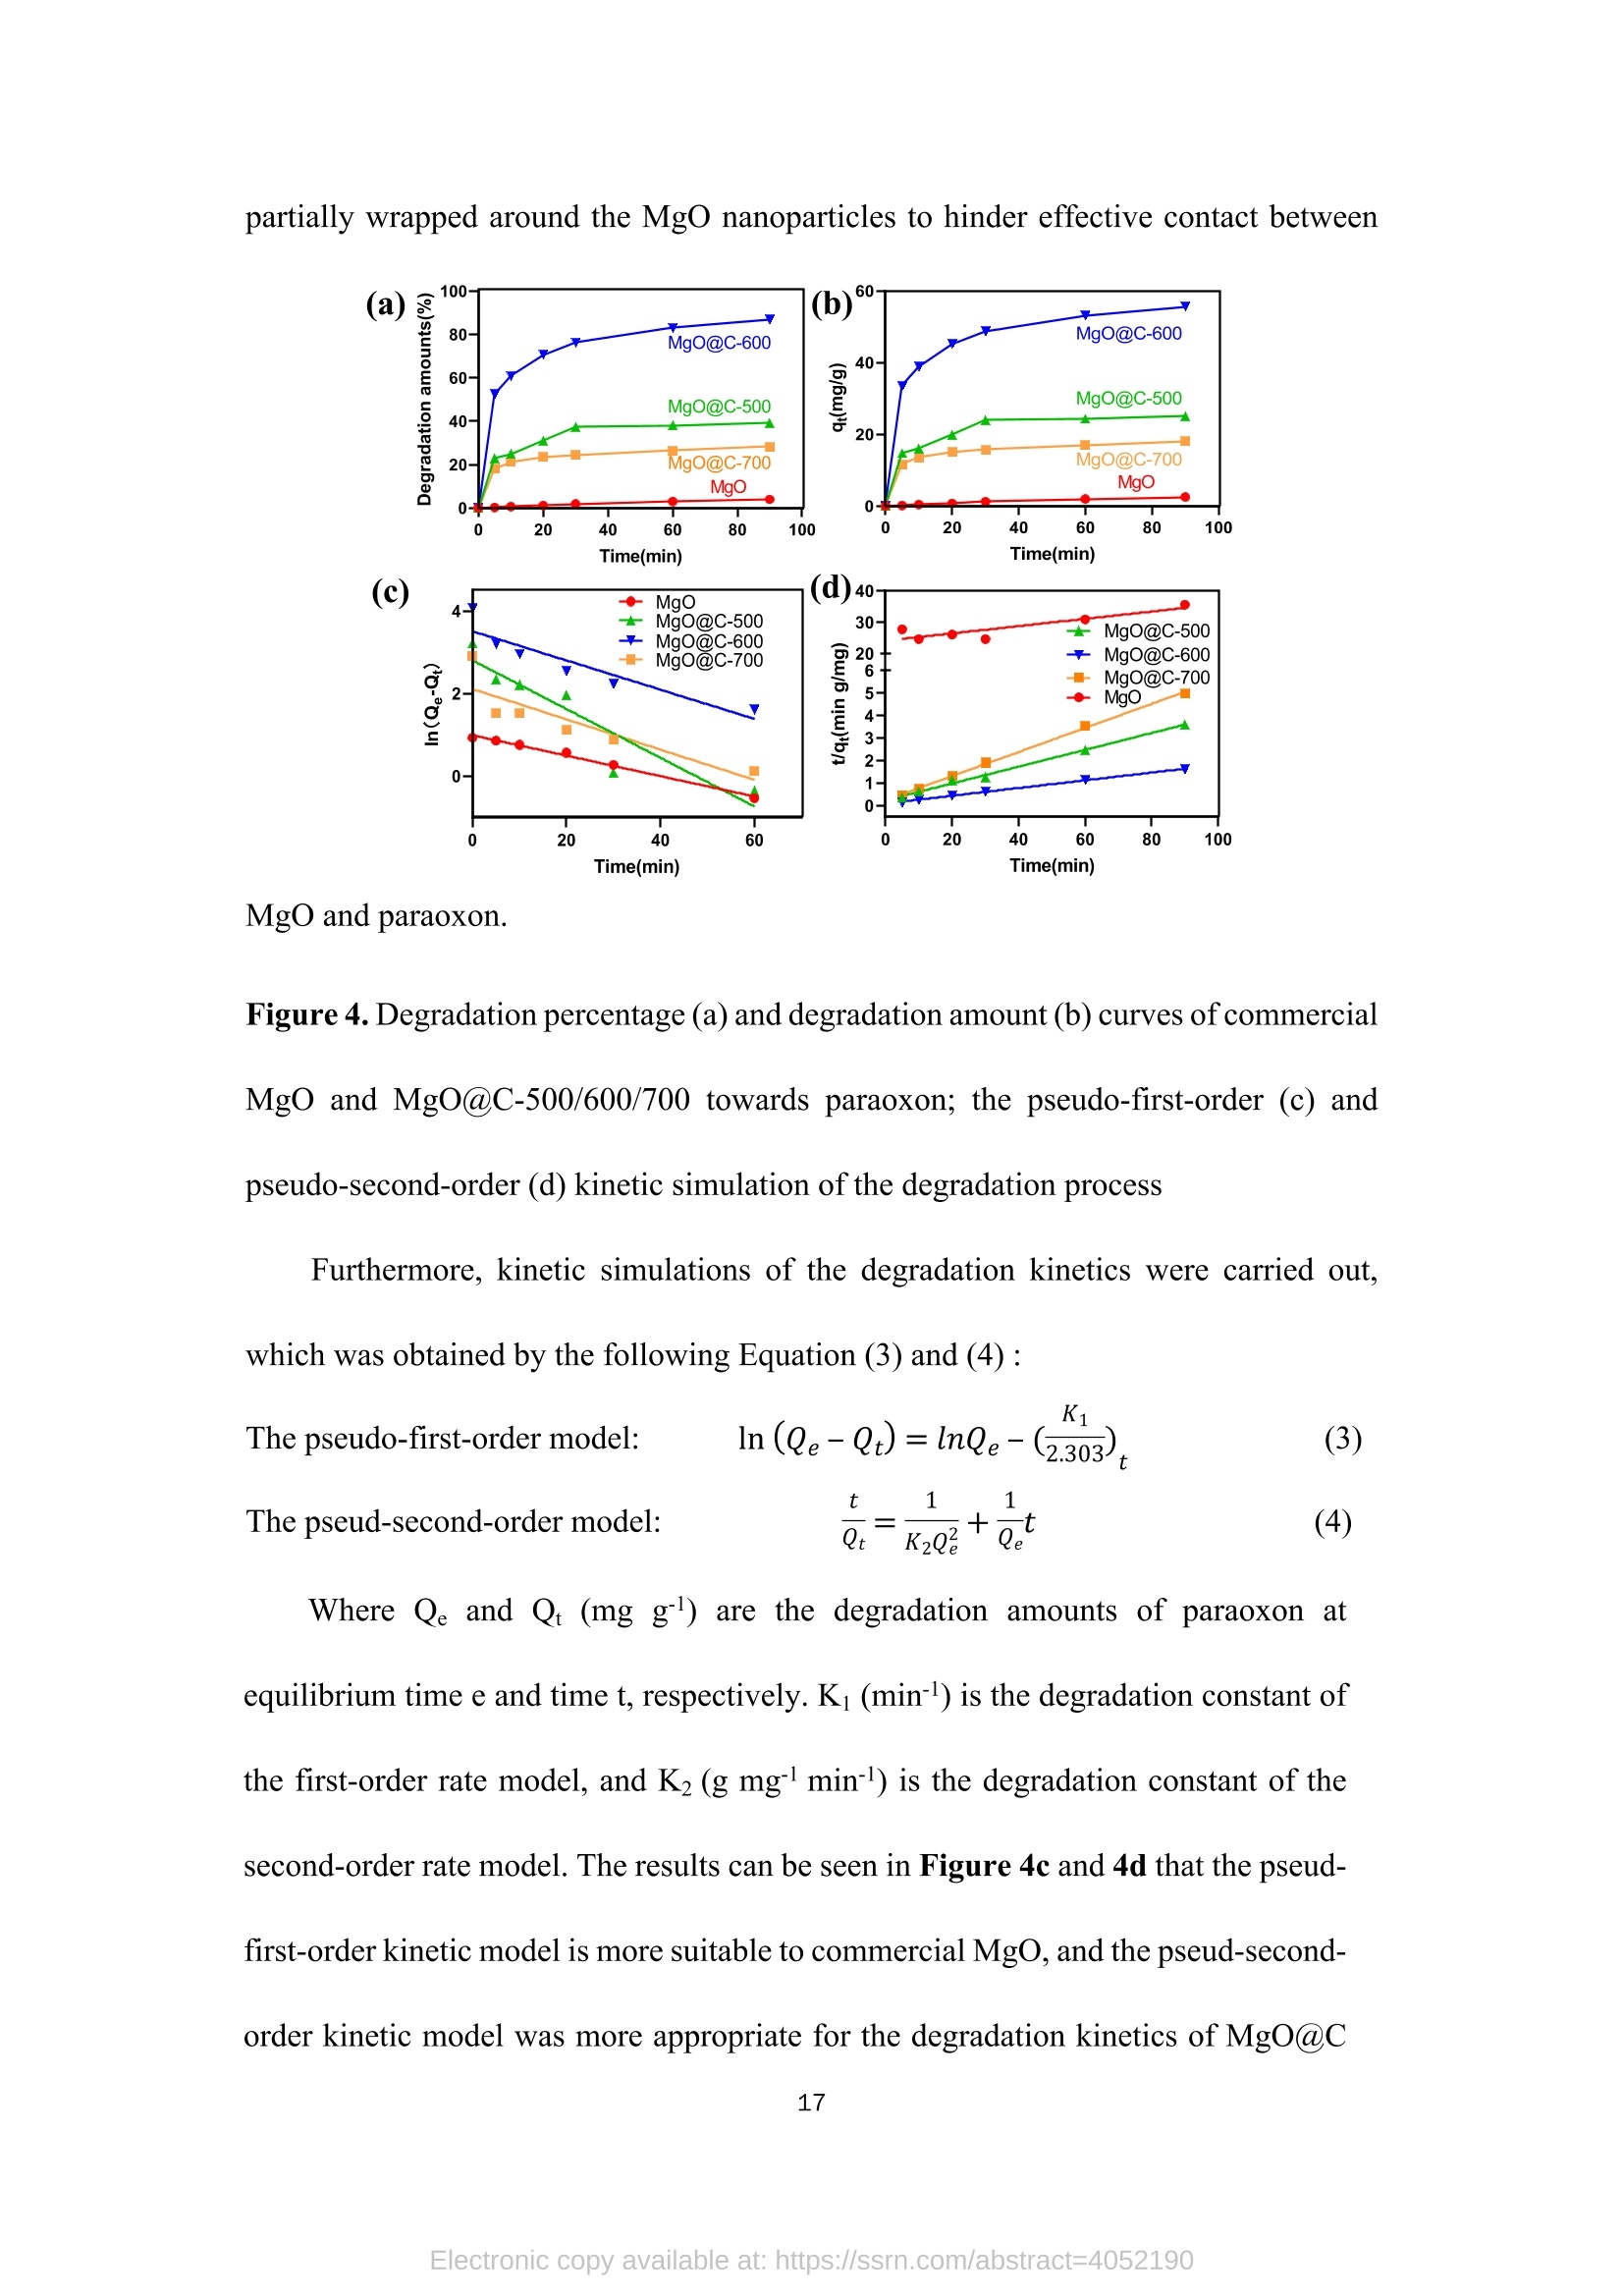
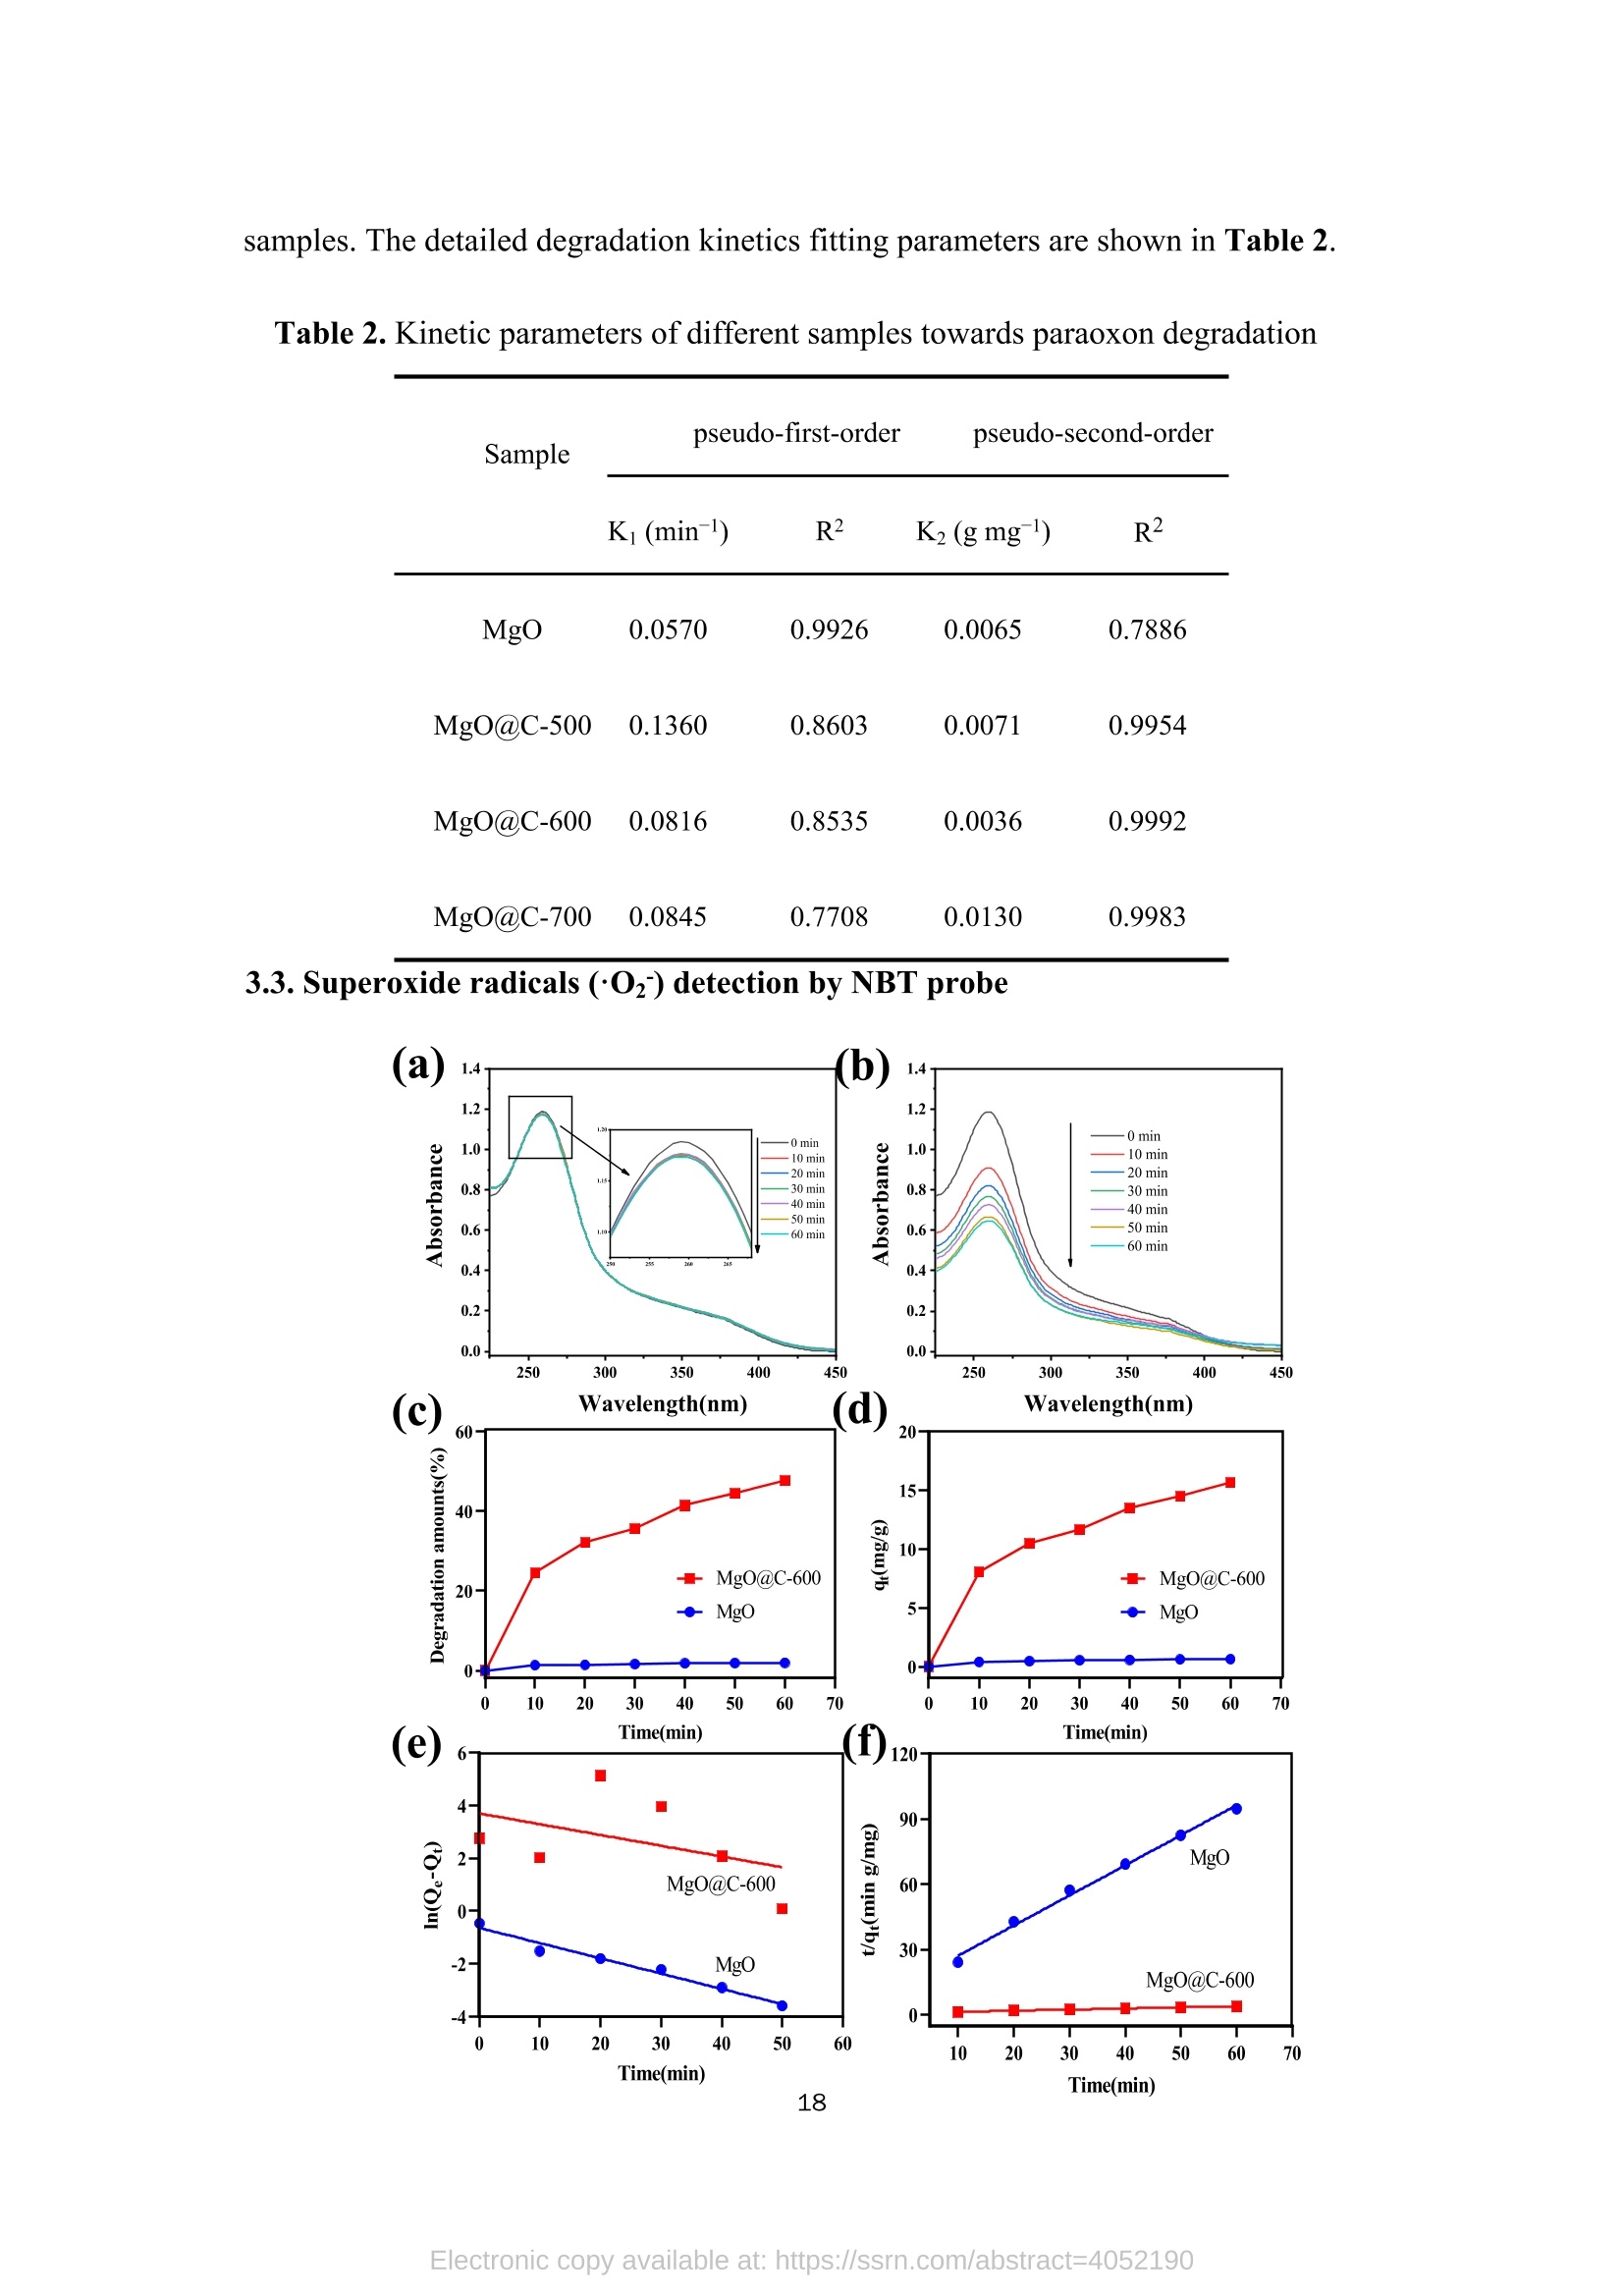
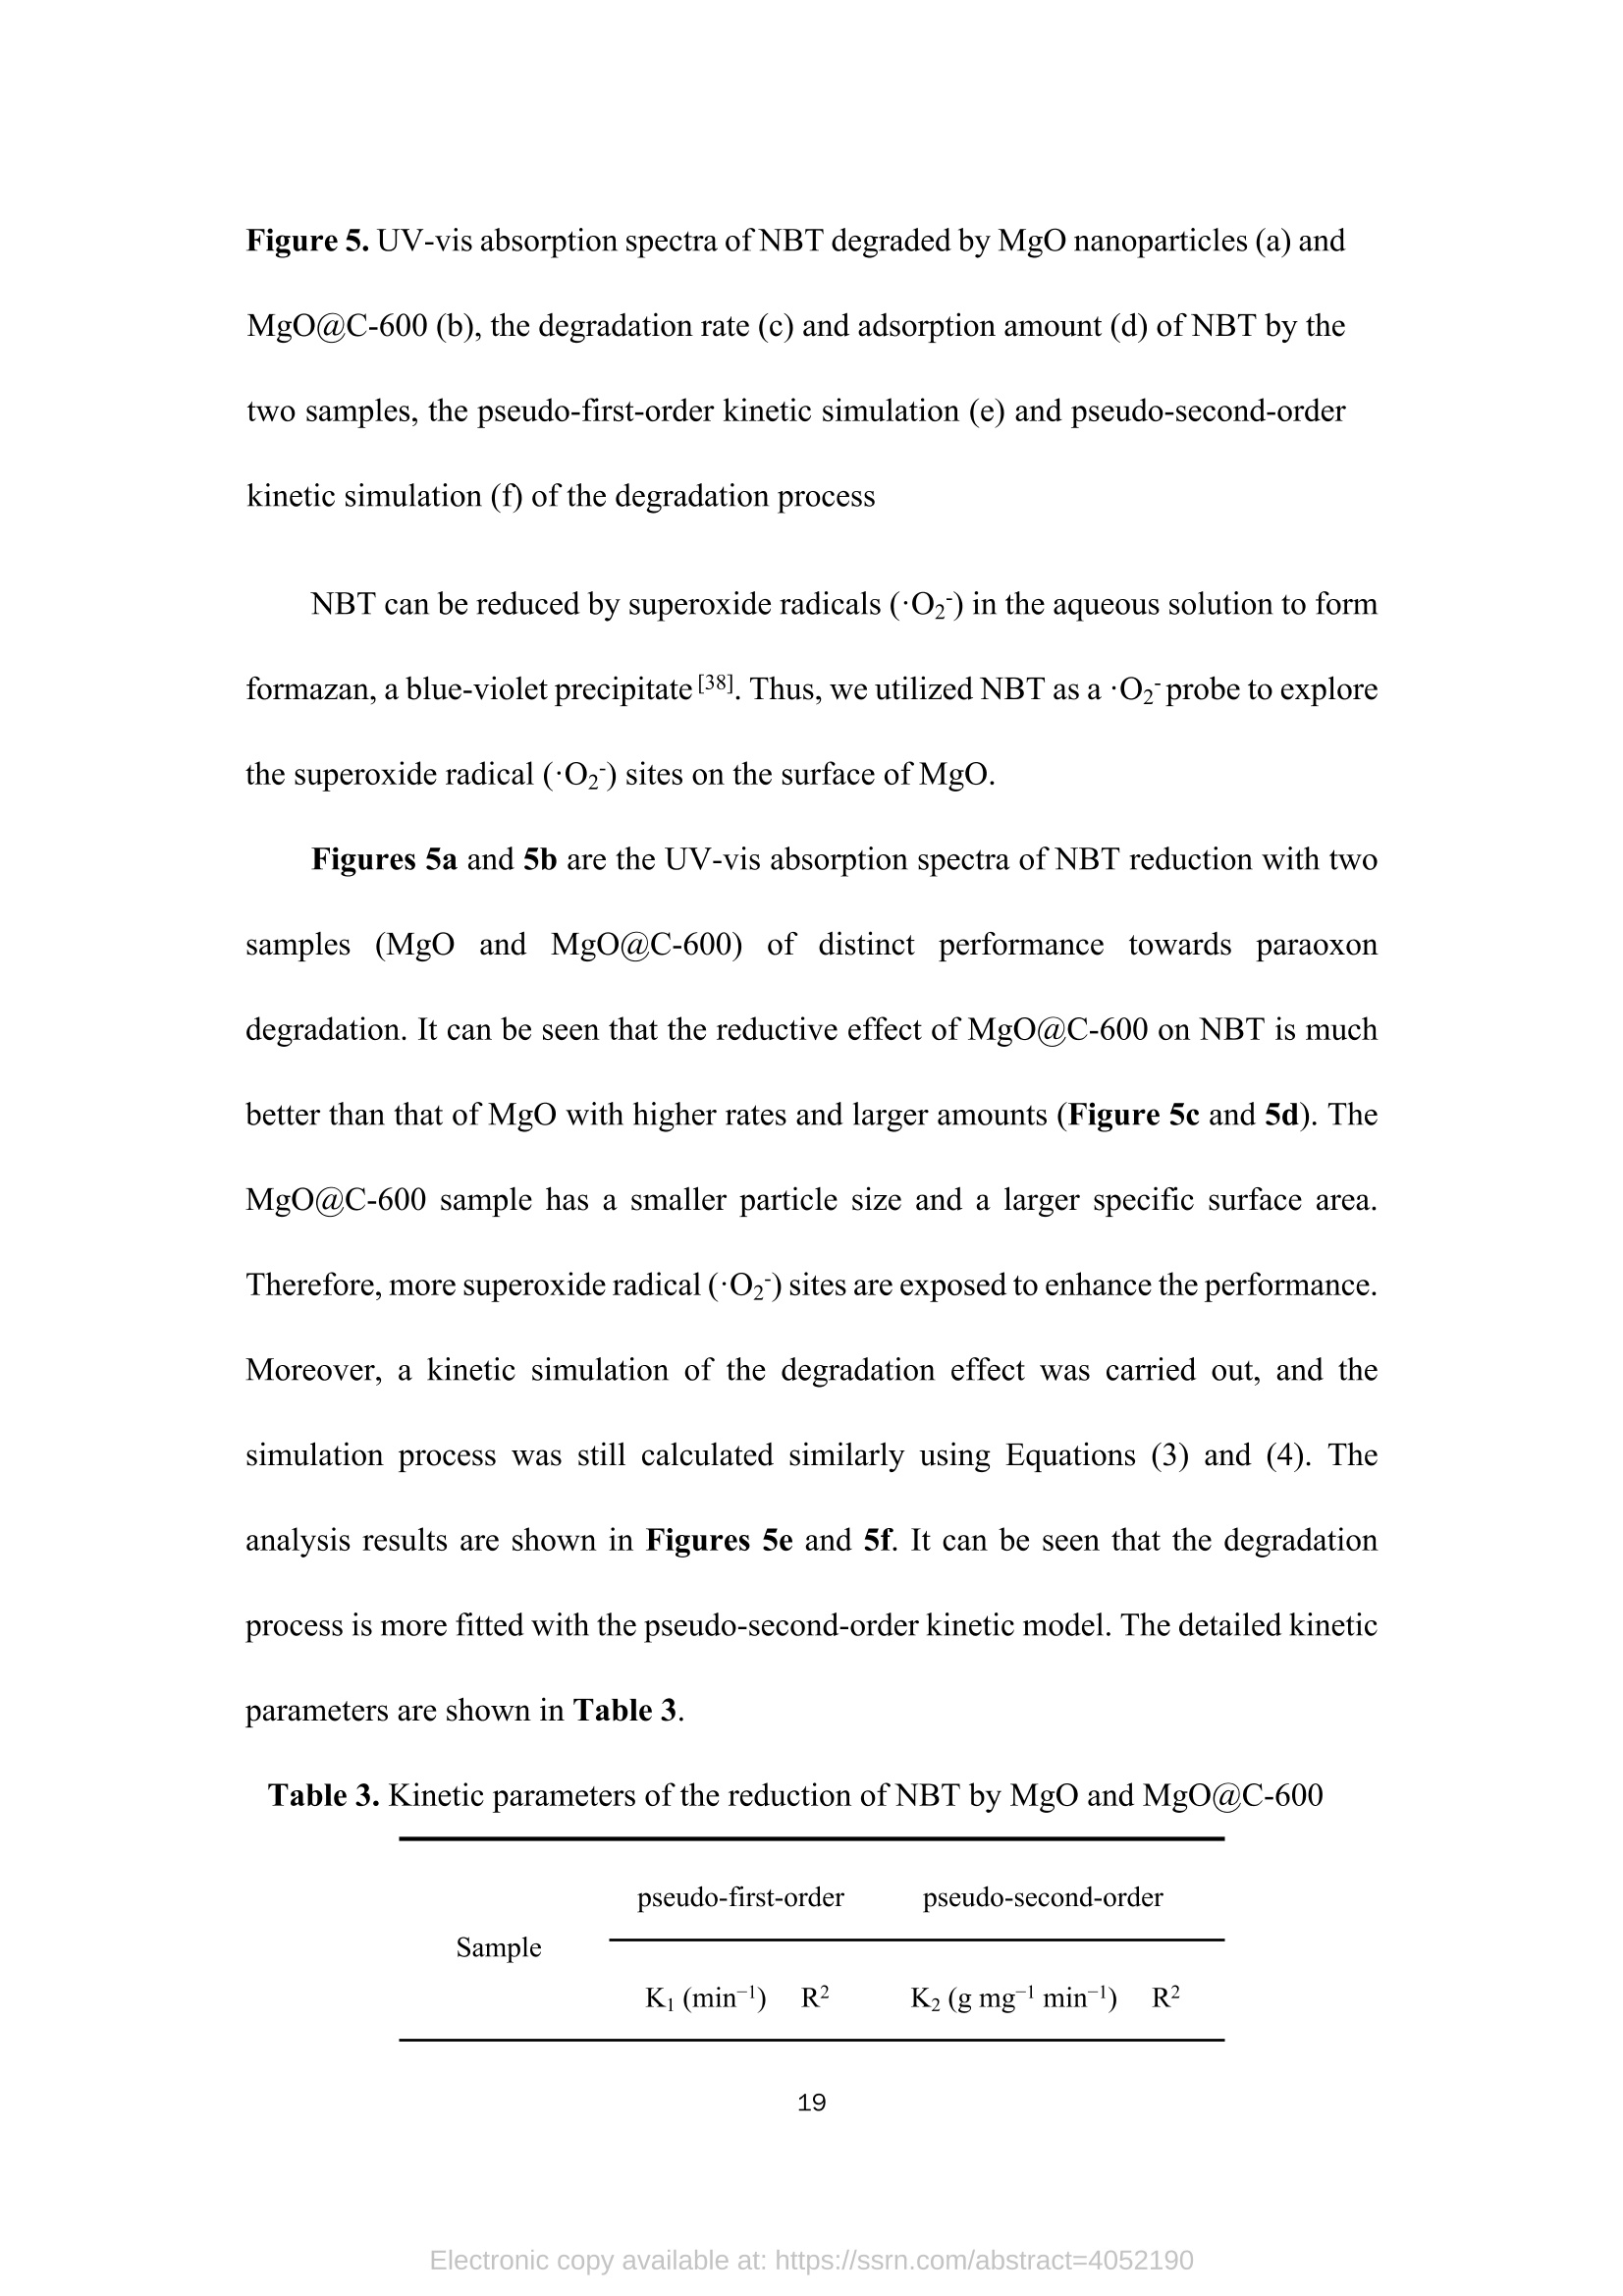
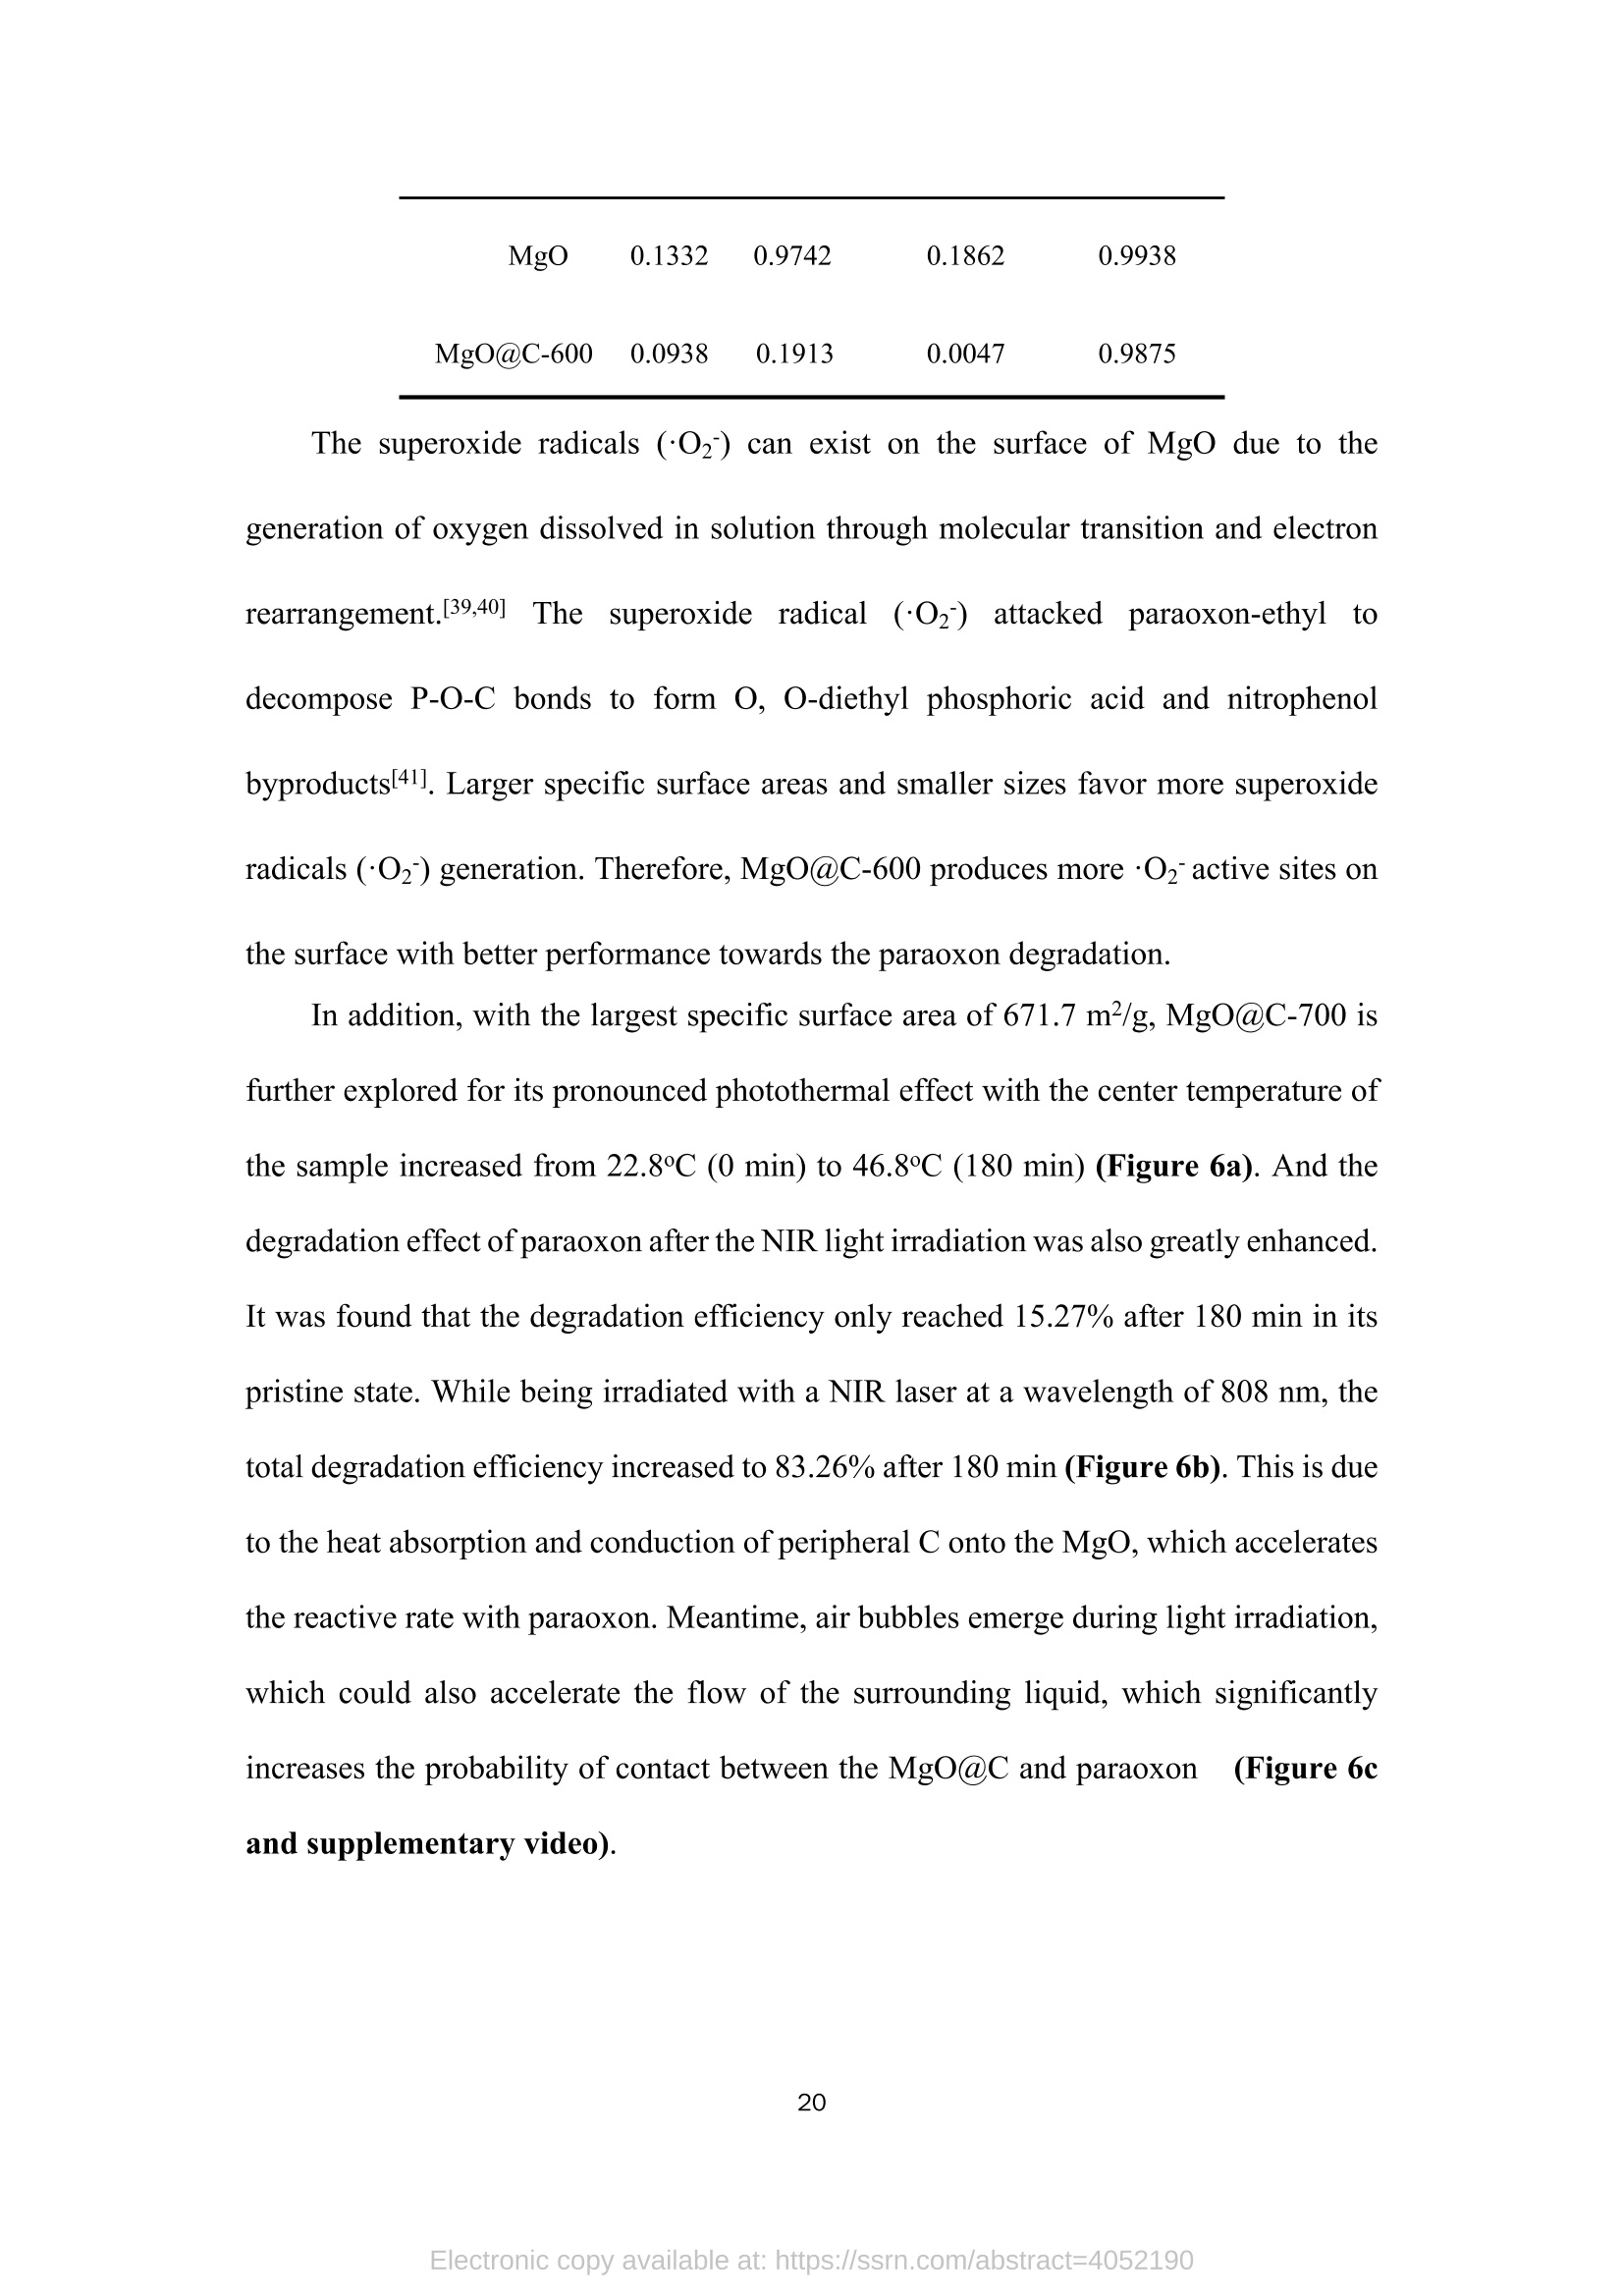
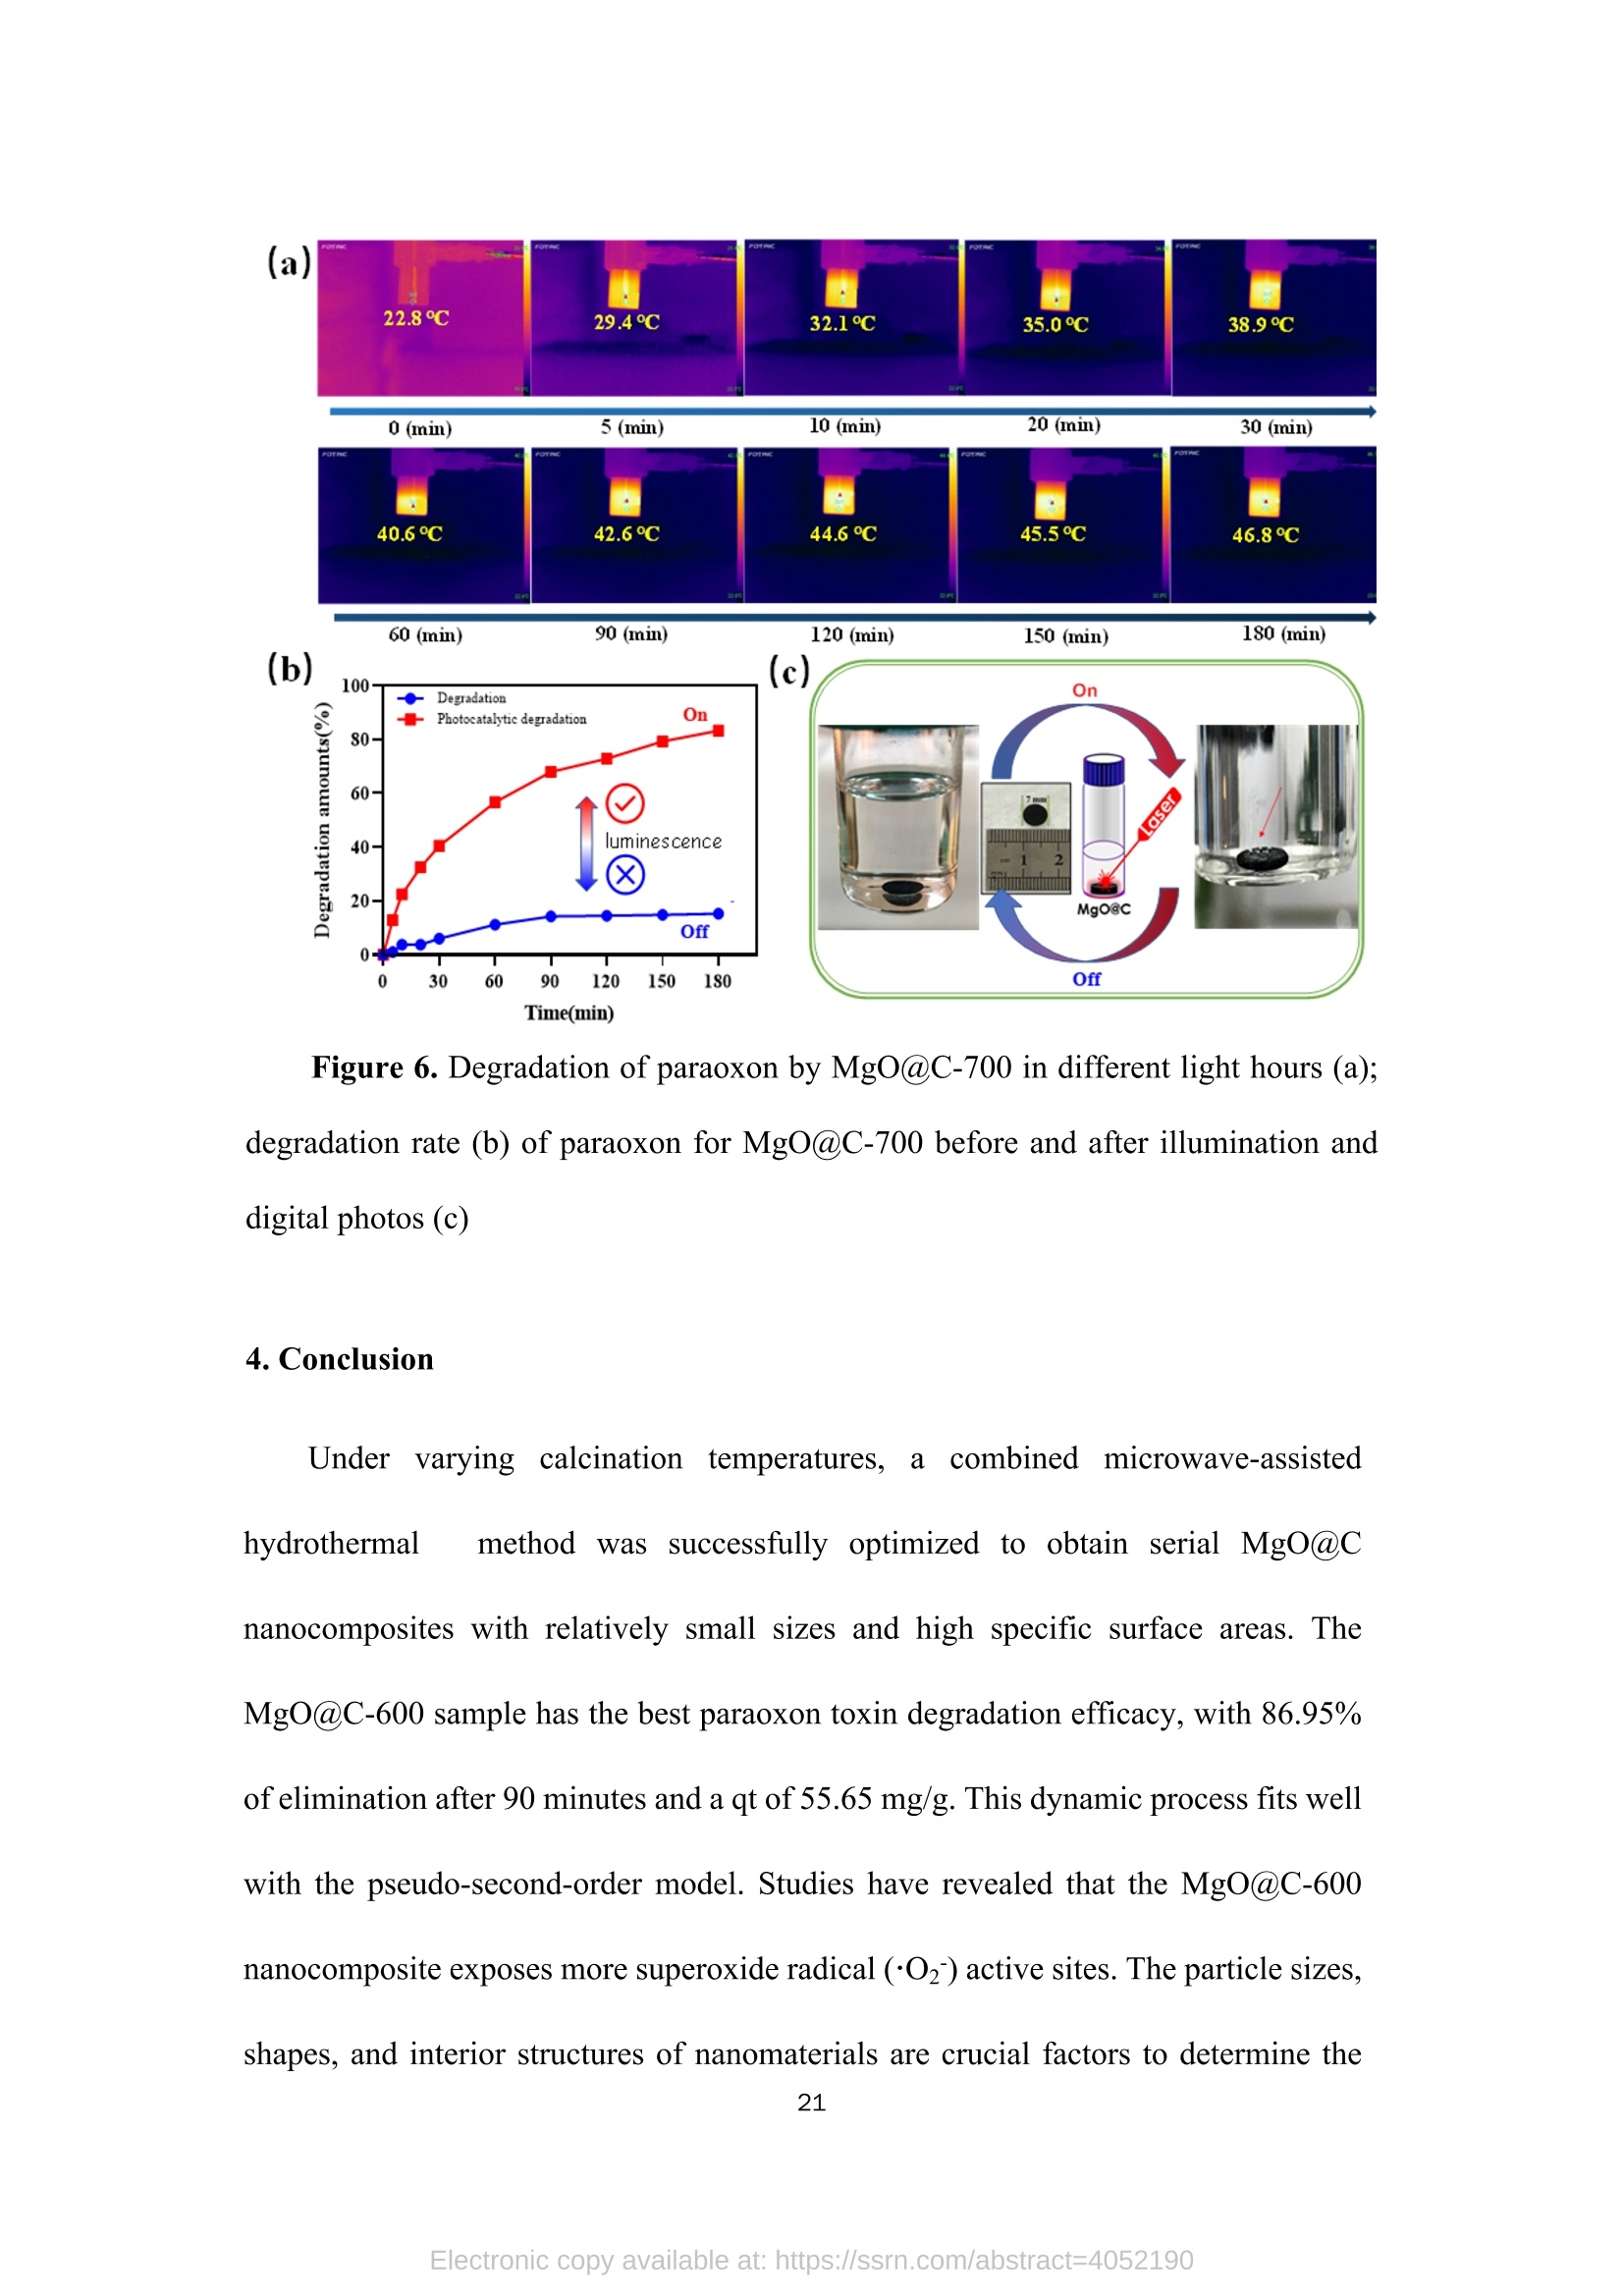
TEG、MicrowaveMg(0H)2(gel) Mg(OH)2@TEG(aerogel) samples. The detailed degradation kinetics fitting parameters are shown in Table 2. Microwave-assisted synthesis of mesoporous MgO@Carbonhybrid nanocomposites to enhance the catalytic degradation ofparaoxon toxin Meijie Cai12#, Shisheng Liu12#, Junjie Cai, Lei Zhao, Xiaohui Wei, Minjie Guol*,and Song Lin 1 College of Chemical Engineering and Materials Science, Tianjin University of Scienceand Technology,Tianjin, 300457, China 2 Institute of Medical Support, Academy ofMilitary Sciences, Tianjin, 300161, China # Contribute equally * Corresponding authors: Email: guomj@tust.edu.cn (M. Guo); Fax: +86 22-606-02772; Tel: +86 22-606-02736lynchpku@163.com (S. Lin); Fax: +86 22-846-60614; Tel: +86 22-846-60534 Abstract: A combination microwave-assisted hydrothermal and calcination method was usedto produce serial mesoporous MgO@Carbon (MgO@C) hybrid nanocomposites, whichwere studied and validated by TEM, XPS, XRD, and Raman spectra. The calcinedMgO@C nanocomposites have a high specific surface area and small grain sizes withan enhanced capacity to degrade paraoxon after optimal preparation. At roomtemperature, the decomposed amount of paraoxon toxins by MgO@C-600 is ca. 55.65mg/g@90min. Furthermore, the pseudo-second-order kinetic model (R>0.99) betterfits the experimental degradation data. The enhanced degradation mechanism ofMgO@C-600 was verified by using nitro blue tetrazolium chloride (NBT) as a probeto detect the generations of more superoxide radical (O2) active sites. A photothermaleffect was also observed in the MgO@C-700. A photothermal effect was also observed in the MgO@C sample. The removal efficiency increased 8-fold after being exposedwith near-infrared (NIR) radiation at 808 nm compared to the non-irradiating sample.Because of their ease of manufacture, low cost, and high removal effectiveness,MgO@C nanocomposites could be a suitable adsorbent choice for eliminatingorganophosphorus hazardous contaminants. Keywords: MgO, carbon, microwave, paraoxon, degradation 1. Introduction Nanomaterials have received uprising attention due to their unique structures andproperties. Among them, metal oxide nanoparticles are widely used in various fieldssuch as energy storage, catalysis, electrochemistry, lubrication, sensors, coatings, andenvironmental remediation. l Compared with traditional materials that remove organicpollutants, metal oxide nanomaterials and composite materials have better adsorptionand degradation capabilities due to their multiple active sites and high specific surfaceareas. As an organophosphorus pesticide and simulated chemical nerve agent of VX,paraoxon toxin has been used as a probe molecule in many studies to explore how todetoxify for increasing attention of environmental remediation.[2] various metal oxidenanoparticles have been reported as adsorbents for decontamination of paraoxon 3],such as TiO, [4-5] MgO,[6-8] CaO,[9] ZnO,[10] Al2O3[11-12] or MnOz[13] and CeO2.[14]Among them, MgO is a relatively cheap, safe, efficient, and readily available absorbenttowards heavy metal ions, organic dyes, fluorides, and phosphates in solutions. 15]However, preparing MgO nanoparticles with petite dimensional sizes is alwayschallenging because of its high activity and easy agglomeration. In general, the smaller the sizes of the nanoparticles, the larger their specific surface areas. Therefore it canprovide more active sites to improve their intrinsic adsorption and degradationperformance. So far, various methods have been explored to obtain MgO nanoparticles, such assol-gel, chemical precipitation, hydrothermal, solvothermal, thermal decomposition,chemical vapor deposition, microemulsion, and ultrasonication methods.[1,16-19,24] Theparticle sizes and morphology of MgO nanoparticles prepared in different ways havedistinct properties. Among these methods, the hydrothermal method is commonly used to synthesizehierarchical MgO nanostructures with different shapes.[20-21] However, these methodscommonly require relatively high hydrothermal temperature (i.e., 180℃ to 265℃) andlong incubation time (i.e., from 4 to 6 h)[22] which processes a severe adverse effect onthe environment due to the high energy consumption.As an efficient green method,microwave-assisted irradiation can be applied to overcome these problems to facilitatehydrothermal reactions for bulk heating due to its faster heating rate, higher energyefficiency,easier control, and more safety.[23] As a traditional adsorbent, activated carbon shows decent adsorption capacity.Nevertheless, its saturation capacity is limited, and the absorbed poison molecules arereadily dissociated to cause secondary pollution or injury due to the physical adsorptionprocess.[25-26] However, few studies focused on the hybrid fabrication of MgO/carbonnanocomposite for environmental remediation.[27] Herein, we apply the microwave-assisted hydrothermal method to one-pot synthesis of hierarchical MgO-doped carbonnanocomposites (MgO@C) to explore their degradation performance towards paraoxontoxins. Firstly, the hydrated Mg(OH)22wasprepared under mild conditions from hydrolyzed Mg(CH;O)2 in toluene/H2O overnight at room temperature. Then thetrimethylene glycol (TEG) was added to serve as both the carbon source and polarmolecules, which facilitates the heating conditions under programmed microwaveirradiation to form the Mg(OH)2-TEG precursors. Finally, the Mg(OH)2-TEGprecursors are decomposed to form MgO nanoparticles and amorphous carbon underN2 at different calcined temperatures, denoted as serial MgO@C nanocomposites.Furthermore. the constitution andmorphologyofas-prepared Mg0@cnanocomposites and their performance, kinetics, mechanism towardsparaoxondegradation were investigated. In addition, specific MgO@C samples showed apronounced photothermal enhanced effect in terms of paraoxon degradation. SuchMgO@C could be an effective adsorbent towards organophosphorus toxin removal dueto its relatively smaller particle size, larger specific surface area and abundantsuperoxide radical (.O2) sites. 2. Experimental Section 2.1. Materials and methods Commercial magnesium oxide (20 nm, 42.05 cm²/g) was purchased from NanjingXianfeng Nano Material Technology Co., Ltd. Magnesium methoxide (Mg(OCH3)2,7-8 wt.%), activated carbon powder ( 100 mesh), n-heptane (chromatographic grade)and nitrotetrazolium blue chloride (NBT, 98%) were supplied by Shanghai AladdinBiochemical Technology Co., Ltd. Paraoxon (AR)was obtained from TianjinRuiboxing Technology Co., Ltd. Nafion membrane solution (5%) was obtained fromShanghai Hesen Electric Co., Ltd. Toluene (AR), absolute ethanol (AR), andtrimethylene glycol (AR) were obtained from Tianjin Damao Chemical Reagent Factory. Deionized water (18.0 MQ.cm) is freshly made in our laboratory. The instrument used in the microwave-assisted heating stage is a multi-purpose microwavechemicalsynthesizerr (CXH-200UP, BeijingXianghu lTechnologyDevelopment Co., Ltd.). The vacuum/atmosphere tube furnace used in the combustionstage 1isSK-G051433 (Tianjin Zhonghuan Experimental Electric Furnace Co.,Ltd.).Thermogravimetric analyzer (TG, STA4495) was used to analyze the thermaldecomposition of the precursor Mg(OH)2@TEG in the temperature range of25~800℃, and the phase purity and crystallization peak of the synthesized MgO@Cnanoparticles were characterized by X-ray diffractometer (XRD, D8advance, Bruker,Germany), measured in the range of 10-80°, the scanning rate of2°/min, using Cu-Koradiation with 40 kV of the working voltage and 100 mA of current. Ramanspectroscopy was used to study the graphitization degree of MgO@C samples. Thelaser wavelength was 532 nm, the power was 10 mW, the spectral resolution was 1cm, and the scanning wavelength range was 500-2500 cm, and it was performed atroom temperature. Field emission scanning electron microscope (SEM, JSM-7500F,JEOL, Japan) and field emission transmission electron microscope (TEM,2010FEF,JEOL, Japan) was used to characterize the morphology and size of the samples. A fullyautomatic surface area and porosity analyzer (TriStar II 3020, Mike Instruments Inc.,America) was applied to measure the samples' specific surface areas and cumulativepore volumes. Fourier transform infrared spectroscopy (FT-IR, Nicolet 380, Thermo)wasused to analyze the microstructures of MgO@C, and X-ray photoelectronspectroscopy (XPS, Thermo Fisher Scientific ESCALAB 250XI) was used to analyze the elemental chemical composition of C, O, and Mg in the MgO@C material. Theelectrochemical workstation (CHI1760E, Shanghai Chenhua Instrument Co., Ltd.)was used to study the electrochemical performance ofMgO@C samples. 2.2. Preparation of Mw-Mg(OH)2-TEG 50 mL ofMg(CHO)2 was added to 131 mL of toluene before aerating with high-purity nitrogen for over 10 minutes. Then 1.75 mL of deionized water was dropwisecharged into the above solution in 30 minutes. The reaction was left standing overnightat room temperature. Then, 40 mL of trimethylene glycol(TEG) was added to 20 mLof the above gel. Moreover, the resulting solution was put into the synthetic microwaveapparatus under programmed gradient heating to 190°C (see Table S1). Finally, theproduct was cooled to room temperature, and the product was suction filtered andwashed with methanol to obtain the Mg(OH)2-TEG composite, denoted as Mw-Mg(OH)2-TEG. The Mw-Mg(OH)2-TEG was dried at 120 ℃ for 120 min and thenstored in a desiccator. 2.3. Preparation of Mw-MgO@C Mw-Mg(OH)2-TEG was calcined in a tube furnace under an N2 atmosphere. Theheating rate was1°C/min, and the calcination temperature was :set from roomtemperature (25℃) to 500, 600, 700C for complete decomposition (Figure S1),respectively with the activation time of 120 min to obtain the final black powderyproducts, which is MgO nanoparticles decorated carbon sheet, denoted as MgO@C-500/600/700, respectively. The preparation equation of MgO@C is as follows: Mg(OH)2@TEG(aerogel)→Mg0@C+H20 2.4. Degradation performance of paraoxon 32 mg/L of paraoxon was dissolved in n-heptane, and 5 mg of commercial MgOand the as-prepared MgO@C-500/600/700 sample was added into 10 mL of the abovesolution. After oscillation at different time intervals (5, 10, 20, 30, 60, and 90 min,respectively),thesupernatant was withdrawnand measured on a UV-visspectrophotometer (UV2600). The scanning wavelength is 200-600 nm, and thescanning rate is 600 nm/min. The percentage and the adsorption degradation amountsof paraoxon were calculated according to Equation (1) and (2), respectively. In Equation (1), ABSo and ABS; are the peak values at 268 nm of paraoxon attime=0 and t. In Equation (2),qt (mg g) is the degradation amount of paraoxon attime t, Co (mgL-l) is the initial concentration of paraoxon, Ct (mg L-l) is theconcentration of paraoxon at time t, V(L) is the tested volume of paraoxon solution,and m (g) is the tested dosage of MgO and MgO@C. 2.5. Degradation performance of nitro blue tetrazolium (NBT) 2×10-mol LofNBT was firstly dissolved in deionized water. Then 5 mg of eachMgO and the as-prepared MgO@C-500/600/700 was added into 10 mL of the abovesolution. After oscillation at different time intervals (0, 10, 20, 30, 40, 50, and 60 min,respectively), tthe ssuuipernatant was withdrawn and measured on a UV-vis spectrophotometer. The scanning wavelength is 225-450 nm, and the scanning rate is600 nm/min. NBT has the maximum absorbance at259 nm. The percentage of NBTdegradation and the amounts of absorption degradation were determined similarlyaccording to Equation (1) and (2). 2.6. Electrochemical experiment Each 4 mg of the commercial MgO and the as-prepared MgO@C-500/600/700samples was mixed with 400 uL of absolute ethanol and 20 uL of nafion membranesolution before being ultrasonicated for 30 min to make the dispersion uniform. 10 uLof the evenly dispersed sample was withdrawn and dropped onto a clean glassy carbonelectrode twice. After the sample is air-dried, it is used for the electrochemical test. Theworking, counter and reference electrodes are glassy carbon, platinum, Ag/AgClelectrode, respectively. The electrolyte is a 0.1 mol/L KOH solution. Use theelectrochemical workstation to test the electrochemical impedance spectroscopy (EIS)of the sample in the electrolyte. The frequency range is 1~106 Hz, the amplitude is0.005 V, and the static time is 2 s. 2.7.Photothermal irradiation experiment The catalytic degradation test of paraoxonby photothermal irradiation ofMgO@C-700 was also studied.Firstly, 35 mg of MgO@C-700 was produced in a discmold under a pressure of 10 MPa for 10 s into a tablet of 7 mm diameter. A laser of 808nm was set up to irradiate the MgO@C tablet with the 20 cm of irradiation distance,and its performance towards paraoxon degradation was evaluated similarly as section2.4. The center temperature was captured and measured by a thermal imaging camera (FOTRIC 226-1, ZXF Laborataries LLC ). 3. Results and discussion 3.1. Structure, morphology, and characterizations of MgO@C nanocomposites (a) 500/600/700℃ orr Mg(OCH3)2 H2O Mg(OH)2 →Mg(OH)2@TEG MgO@Carbon Figure 1. Schematic routes of the preparation of MgO@C by microwave-assistedsynthesis (a),TEM, HRTEM, and EDX element mappings of MgO@C-500 (b, c, d,j), MgO@C-600 (e, f, g, k) and MgO@C-700 ( h, i, l) and statistical particle sizedistribution (m) (n=50, randomly measured with Image J and expressed as mean ± SD.)Insets: selected area electron diffraction (SAED) pattern of each sample. The micromorphology of the as-prepared MgO@C-500/600/700 was observedby TEM, HRTEM images and SAED patterns shown in Figure 1. It can be observedthat the MgO nanoparticles were aggregated and decorated on carbon sheets to formpizza-like structures. (Figure 1b, 1e & 1h). The appearance of multiple diffractionrings in the SAED patterns (insets in Figure 1b, 1e & 1h) proves that all obtainedMgO@C samples are polycrystalline. Furthermore, in the detailed HRTEM images,both the interplanar spacings of magnesium oxide (Figure 1d,1g, 1i) and concentricinterplanar spacings of amorphous carbon (Figure 1c, 1f, 1i) are observed with 0.21nm and 0.34 nm, which match the (200) facet of face-centered cubic MgO and the(002) facet of carbon, respectively.[28,29] Among them, the morphology of MgO@C-700 (Figure 1h and 1i) is different from that of MgO@C-500/600 without acontinuous phase of carbon observed. It indicates that higher calcination temperature(i.e., 700℃) causes the further rupture of carbon sheets from a continuous phase toa discrete one, peripherally around the MgO nanoparticles, which is furtherconfirmed by the EDX element mapping results of MgO@C-500/600/700 (Figure1j, 1k & 1l). Moreover, the higher the calcined temperature, the more C elementcontent in the obtained composite samples, as shown in Table S2. Moreover, thestatistically measured particle sizes of MgO@C-500 and MgO@C-700are relativelylarge, i.e., 8.0±1.7 nm and 9.5±2.6 nm, respectively, while that of MgO@C-600 shows the smallest average grain size with 6.4±2.2 nm (Figure 1m). Figure 2. XRD patterns (a) ofMgO@C-500/600/700 samples; FT-IR spectra (b) andNyquist diagram (f) ofcommercial MgO and MgO@C-500/600/700; The specificsurface area (C) and cumulative pore volume distribution (d) ofMg(OH)2@TEG andMgO@C-500/600/700; Raman spectra (e) of MgO, activated carbon and MgO@C-600 samples. The XRD of the MgO@C nanocomposites generated at different calcinationtemperatures (i.e., 500, 600, 700℃) is shown in Figure 2a. It is found that all the three MgO@C samples have relatively broad diffraction peaks at 15-30° due to theexistence of amorphous carbon.[30]The source of the amorphous carbon istrimethylene glycol [31], which is also used as an absorptive reagent for microwaveheating. All other diffraction peaks observed are entirely matched with thecharacteristic peaks of pure cubic phase MgO, corresponding to the crystal planes ofMgO (111), (200), (220), (311), and (222), respectively. [32] No diffraction peaksother than MgO and amorphous carbon are observed in these spectra, proving thatthe sample has no other impurities and the composite MgO@C material has beensuccessfully prepared. The diffraction peaks of the three groups of samples MgO arerelatively broad. And the peak position shows a blue shift relative to the standardvalue, indicating a relatively small particle size. [33] Figure 2b shows the infrared spectra of the samples. It can be seen that thecommercial MgO nanoparticles and MgO@C-500/600/700 have two broad bandsaround 3435 cm and 1500 cm, respectively, which is due to the HOH stretchingvibration of the adsorbed water molecules. The four spectral lines all have a strong bandnear 500 cm, which corresponds to the tensile vibration of the Mg-O bond inmagnesium oxide.[34] In addition, the peaks ofMgO@C-500/600/700 that are differentfrom commercial MgO nanoparticles are at 2924.8 cmand 1460 cmassigned to theCH bond stretching vibration and CH caused by the bending vibration of the C elementcontained in the sample. Figures 2c and 2d show the BET analysis ofMgO@C obtained at differentcalcination temperatures. The pore size distribution of MgO@C is determined by the BHJ method. Table 1 provides the specific surface area and cumulative pore volumedata ofMg(OH)2@TEG and MgO@C. It can be seen that the specific surface area ofthe Mg(OH)2@TEG precursor is only 40.4 m/g, and the cumulative pore volume is0.09 cm’/g. Its pore size distribution is uniform in the range of 2~4 nm. For MgO@Cnanocomposites, the specific surface areas ofMgO@C-500/600/700 are much higher,i.e., 250.5, 255.6, 671.7 m²/g,respectively. Among them, the specific surface area ofMgO@C-700 is the largest, and the cumulative pore volume distribution diagram isalso different from others. MgO@C-700 is mainly composed of micropores andmesopores (2~5 nm) derived from both the carbon layers and MgO nanoparticlesverified by HRTEM in Figure 1. The pore size distribution of MgO@C-500/600 ismainly between 2~10 nm.Between them, MgO@C-600 has a higher proportion ofsmaller pores (2~4 nm) than MgO@C-500. Table 1. Specific surface area and cumulative pore volume ofMg(OH)2@TEG and serial MgO@C nanocomposites Sample SBET(m²g-) V(cm’g) Mg(OH)2@TEG 40.4 0.09 MgO@C-500 250.5 0.66 MgO@C-600 255.6 0.41 MgO@C-700 671.7 0.23 In addition, Raman spectroscopy was used to study the degree of graphitization of MgO@C-600 samples and compared with commercial MgO nanoparticles andactivated carbon powder, as shown in Figure 2e. The pristine MgO sample did notshow any peaks in the detectable shift range. However, the MgO@C-600 sample andactivated carbon powder showed two characteristic peaks at 1351 cm-and 1600 cm-l,corresponding to the D and G bands, respectively. The G band represents the E2gvibration of sp² hybridized C atoms, and the D band corresponds to disordered graphiticcarbon.35] The intensity ratio between G-band and D-band (Ip/Ic) is generallyconsidered to be an essential indicator for evaluating the degree of graphitization ofcarbon-containing materials.[36] The larger the Ip/Ic value, the smaller the degree ofgraphitization,and vice versa. Herein, the Ip/IG value of activated carbon is 0.73, whilethe value of MgO@C-600 is 0.87, indicating that the degree of graphitization ofMgO@C-600 is lower than that of pure activated carbon due to the decorated MgOnanoparticles. This result will be confirmed in the subsequent XPS analysis. Figure 2f is the Nyquist diagram of commercialized MgO nanoparticles andMgO@C-500/600/700. It can be seen that the solution resistance of commercial MgOnanoparticles is about 52.9 Q. In contrast, the solution resistance ofMgO@C-500/600/700 is relatively small, i.e., 47.8 Q,47.9 Q, 48.8 Q, respectively. Since thecarbon has good conductivity, the incorporation of carbon reduces the resistance at theMgO@C nanocomposite/solution interface during the electrochemical process, thusenhancing its electrical conductivity. Figure 3. XPS spectra ofMgO and MgO@C-600:(a) full survey; (b) C1s spectra; (c) O1s spectra; (d) Mg1s spectra Two sets of commercial MgO nanoparticles and MgO@C-600 were selected forthe XPS analysis, and the fine spectrum was fitted with the Gaussian linear Lorentzfunction (Gauss: 80%, Lorentz: 20%). From the XPS full survey, all the prominentcharacteristic peaks of Mg, O,and C in the range of 0~1300 eV binding energy weredetected in Figure 3a. Figure 3b, 3c and 3d show the spectra of C1s, O1s, and Mg1speaks, respectively. It can be seen from the C1s peak spectrum that MgO@C-600 hasa new peak at 285.85 eV, which is attributed to the C-O bond, decomposed from theTEG component. The area of the O1s peak at around 290 eV is also different.MgO@C-600 is slightly larger than pure MgO, which indicates that MgO@C-600 both may adsorb more amounts of CO2. The O1s spectrum of nano-MgO consists ofthree convolution peaks, which are 531.81, 530.91, and 529.68 eV, which areattributed to OH-/C=O, Mg-O and O, respectively (Figure 3c) [32,37]. While for theO1s spectrum of MgO@C-600, only two fitting peaks were found, and the peak areaat 531.81 eV was larger than that of nano-MgO, indicating that in addition to OH-, italso contained Mg-O, which was the overlap in this peak shift. It also contains C=O,which is verified by the C1s spectrum. For the Mg1s spectrum (Figure 3d), it can beseen that the peak has an obvious redshift, which is possibly caused by thehybridization of carbon and MgO in MgO@C-600 sample. Such phenomenon provesthat the prepared MgO@C-600 material is not a simple physical blend of magnesiumoxide and activated carbon, but a novel nanocomposite conjugated with chemicalbondings. 3.2. Degradation and kinetic simulation of paraoxon by MgO@C nanocomposites It can be seen from Figures 4a and 4b that both MgO and MgO@C-500/600/700have positive degradation effects against paraoxon. Among them,MgO@C-600 has thefastest degradation rate and the highest degradation efficiency. The degradationpercentage can reach ca. 86.95% after 90 min. Moreover, the adsorption degradationamount qt is the largest, reaching 55.65 mg/g. The MgO@C-600 sample has a smallerparticle size with a larger specific surface area, leading to better adsorption anddegradation ability of paraoxon. For MgO@C-500/700, the degradation rate rapidlyincreased to about 20% within the initial 5 min and reached a plateau stage after 30min. Surprisingly, although the specific surface area ofMgO@C-700 is the largest, itsdegradation effect is relatively weak. One possible reason is that the peripheral carbon partially wrapped around the MgO nanoparticles to hinder effective contact between MgO and paraoxon. Figure 4. Degradation percentage (a) and degradation amount (b) curves of commercialMgO and MgO@C-500/600/700 towards paraoxon; the pseudo-first-order (c) andpseudo-second-order (d) kinetic simulation of the degradation process Furthermore, kinetic simulations of the degradation kinetics were carried out,which was obtained by the following Equation (3) and (4) : K1The pseudo-first-order model: ln(Qe-Qt)=lnQe-(2.303), (3)The pseud-second-order model:Q(4) Where Qe and Qt (mg g) are the degradation amounts of paraoxon atequilibrium time e and time t, respectively. Ki (min-l) is the degradation constant ofthe first-order rate model, and K2 (g mg-min-l) is the degradation constant of thesecond-order rate model. The results can be seen in Figure 4c and 4d that the pseud-first-order kinetic model is more suitable to commercial MgO, and the pseud-second-order kinetic model was more appropriate for the degradation kinetics of MgO@C Table 2. Kinetic parameters of different samples towards paraoxon degradation Sample pseudo-first-order pseudo-second-order Ki (min-) R2 K2(g mg ) R2 MgO 0.0570 0.9926 0.0065 0.7886 MgO@C-500 0.1360 0.8603 0.0071 0.9954 MgO@C-600 0.0816 0.8535 0.0036 0.9992 MgO@C-700 0.0845 0.7708 0.0130 0.9983 3.3. Superoxide radicals(O2) detection by NBT probe 18 Figure 5. UV-vis absorption spectra of NBT degraded by MgO nanoparticles (a) andMgO@C-600 (b), the degradation rate (c) and adsorption amount (d) of NBT by thetwo samples, the pseudo-first-order kinetic simulation (e) and pseudo-second-orderkinetic simulation (f) of the degradation process NBT can be reduced by superoxide radicals (O2) in the aqueous solution to formformazan, a blue-violet precipitate [38].Thus, we utilized NBT as a O2 probe to explorethe superoxide radical (O2) sites on the surface of MgO. Figures 5a and 5b are the UV-vis absorption spectra of NBT reduction with twosamples (MgO and MgO@C-600) of distinct performance tovtowardsparaoxondegradation. It can be seen that the reductive effect of MgO@C-600 on NBT is muchbetter than that of MgO with higher rates and larger amounts (Figure 5c and 5d). TheMgO@C-600 sample has a smaller particle size and a larger specific surface area.Therefore, more superoxide radical (.O2-) sites are exposed to enhance the performance.Moreover, a kinetic simulation of the degradation effect was carried out, and thesimulation process was still calculated similarly using Equations (3) and (4). Theanalysis results are shown in Figures 5e and 5f. It can be seen that the degradationprocess is more fitted with the pseudo-second-order kinetic model. The detailed kineticparameters are shown in Table 3. Table 3. Kinetic parameters of the reduction of NBT by MgO and MgO@C-600 MgO 0.1332 0.9742 0.1862 0.9938 MgO@C-600 0.0938 0.1913 0.0047 0.9875 The superoxide radicals (O2) can exist on the surface of MgO due to thegeneration of oxygen dissolved in solution through molecular transition and electronrearrangement.[39,40] Thelessuperoxideradicall ((O2)attackedparaoxon-ethyl1todecompose P-O-C bonds to form O, O-diethyl phosphoric acid and nitrophenolbyproducts[41]. Larger specific surface areas and smaller sizes favor more superoxideradicals (.O2) generation. Therefore, MgO@C-600 produces more ·O2 active sites onthe surface with better performance towards the paraoxon degradation. In addition, with the largest specific surface area of 671.7 m²/g, MgO@C-700 isfurther explored for its pronounced photothermal effect with the center temperature ofthe sample increased from 22.8℃ (0 min) to 46.8℃ (180 min) (Figure 6a). And thedegradation effect of paraoxon after the NIR light irradiation was also greatly enhanced.It was found that the degradation efficiency only reached 15.27% after 180 min in itspristine state. While being irradiated with a NIR laser at a wavelength of 808 nm, thetotal degradation efficiency increased to 83.26% after 180 min (Figure6b). This is dueto the heat absorption and conduction of peripheral C onto the MgO, which acceleratesthe reactive rate with paraoxon. Meantime, air bubbles emerge during light irradiation,which could also accelerate the flow of the surrounding liquid, which significantlyincreases the probability of contact between the MgO@C and paraoxon (Figure 6cand supplementary video). Figure 6. Degradation of paraoxon by MgO@C-700 in different light hours (a);degradation rate (b) of paraoxon for MgO@C-700 before and after illumination anddigital photos (c) 4. Conclusion Under varying calcinationn temperatures,acombined microwave-assistedhydrothermal method waSs 1successfully optimized to obtain serial MgO@Cnanocomposites with relatively small sizes and high specific surface areas. TheMgO@C-600 sample has the best paraoxon toxin degradation efficacy, with 86.95%of elimination after 90 minutes and a qt of 55.65 mg/g. This dynamic process fits wellwith the pseudo-second-order model. Studies have revealed that the MgO@C-600nanocomposite exposes more superoxide radical (.O2) active sites. The particle sizes,shapes, and interior structures of nanomaterials are crucial factors to determine the degrading performance, in addition to their high specific surface areas. In addition,MgO@C-700 shows a photothermally enhanced paraoxon degrading action. Due toits facile, low cost, eco-friendly manufacturing process, and high removal efficiency,MgO@C nanocomposites can serve as a potential adsorbent option for eliminatingorganophosphorus hazardous contaminants. Supporting Information Supporting Information is available from XXX. Declaration of interests The authors declare that they have no known competing financial interests orpersonal relationships that could have appeared to influence the work reported in thispaper. Acknowledgments This work was financially supported by Tianjin Science and Technology Major ProjectProgram (18ZXJMTG00070). Meijie Cai and Shisheng Liu contributed equally to thiswork. References [1] The role of some important metal oxide nanoparticles for wastewater andantibacterialapplications::Areview[J]. Taibaa Naseem.TayyibaaLDurrani.Environmental Chemistry and Ecotoxicology, 2021, 3: 59-75. [2] Advanced Catalytic Materials: Current Status and Future Progress. Dominguez-Esquivel JM, Ramos M. Springer International Publishing, Cham, 2019. [3] Fabrication of Anisotropic Silver Nanoplatelets on the Surface of TiO2Fibers forEnhanced Photocatalysis of a Chemicall Warfare Agent Simulant, MethylParaoxon[J]. Kuhn DL, Zander DZ, Kulisiewicz AM, Debow SM, Haffey C, FangH, Kong XT, Qian Y, Walck SD, Govorov AO, Rao Y, Dai HL, Delacy BG. Journal of Physical Chemistry C, 2019, 123(32):19579-19587. [4] A Novel Process for the Fabrication of Nanocomposites Membranes[J]. SundarrajanS, Pliszka D, Jaworek A, Krupa A, Lackowski M, Ramakrishna S, Journal ofNanoscience and Nanotechnology,2009,9(7): 4442-4447. [5] Fabrication of Anisotropic Silver Nanoplatelets on the Surface of TiO2 Fibers forEnhanced Photocatalysis of a Chemical Warfare Agent Simulant, MethylParaoxon[J]. Kuhn DL,Zander Z, Kulisiewicz AM, Debow SM, Haffey C, FangH, Kong XT, Qian Y, Walck SD, Govorov AO, Rao Y, Dai HL, Delacy BG,Journal Physical Chemistry C, 2019, 123(32):19579-19587. [6] Nanocrystalline metal oxides as destructive adsorbents for organophosphoruscompounds at ambient temperatures[J]. Rajagopalan S, Koper O, Decker S,Klabunde KJ. Chemistry-A European Journal, 2002,8(11):2602-2607. [7] Degradation of paraoxon (VX chemical agent simulant) and bacteria by magnesiumoxide depends on the crystalline structure of magnesium oxide[J]. Sellik A, PolletT, Ouvry L, Briancon S, Fessi H, Hartmann DJ,Renaud FNR. Chemico-BiologicalInteractions, 2017,267:67-73. [8] Rapid and destructive adsorption of paraoxon-ethyl toxin via a self-detoxifyinghybrid electrospun nanofibrous membrane[J]. Wei XH, Li C, Wang CL, Lin S,Wu JH, Guo MJ. Chemical Engineering Journal, 2018, 351: 31-39. [9] Nanocrystalline Metal Oxides: A New Family of Mesoporous Inorganic MaterialsUseful for Destructive Adsorption of Environmental Toxins[J]. Klabunde KJ,Medine G, Bedilo A, Stoimenov P, Heroux D. ACS Symposium Series, 2004,890: 272-276. [10] Reclaimable La: ZnO/PAN nanofiber catalyst for photodegradation of methylparaoxon and its toxicological evaluation utilizing early life stages of zebra fish(Danio rerio)[J]. Lakshmi K, Kadirvelu K, Mohan PS, Chemical EngineeringJournal, 2019,357:724-736. [11] Al2O3 nanoparticles with and without polyoxometalates as reactive sorbents forthe removal of sulphur mustard[J]. Saxena A, Singh B, Srivastava AK,Suryanarayana MVS, Ganesan K, Vijayaraghavan R, Dwivedi KK. Microporousand Mesoporous Materials, 2008, 115(3):364-375. [12] Reactions of VX, GB, GD, and HD with nanosize Al203. Formation ofaluminophosphonates[J]. Wagner GW, Procell LR, Connor RJO, Munavalli S,Carnes CL, Kapoor PN, Klabunde KJ. Journal of the American Chemical Society,2001,123(8):1636-1644. [13] Abiotic degradation of methyl parathion by manganese dioxide: Kinetics andtransformation pathway[J]. Liao XP, Zhang CX, Liu Y, Luo YW, Wu SS, YuanSH,Zhu Z. Chemosphere,2016,150:90-96. [14] Shape-selective synthesis of nanoceria for degradation of paraoxon as a chemicalwarfare simulant[J]. Trenque I, Magnano GC, Bolzinger MA, Roiban L, ChaputF, Pitault I, Briancon S, Devers T, Masenelli-Varlot K, Bugnet M, Amans D.Physical Chemistry Chemical Physics. 2019,21(10): 5455. [15] Pilarska AA, Klapiszewski L, Jesionowski T. Recent development in the synthesis,modification and application of Mg(OH)2 and MgO: A review[J]. Powder Technology,2017,319:373-407. [16] Preparation of flower-like MgO via spray drying with high adsorption performancepreparation of flower-like MgO via :sprayadiryingvwithhigh adsorptionperformance[J]. Kuang MJ, Yang GL, Xie ZM, Su Q, Liu BX. IOP ConferenceSeries- Materials Science and Engineering, 2018, 423:012-085. [17] Fabrication of MgO nanostructures and its efficient photocatalytic, antibacterialandanticancerperformance[J]. KaithikK, Dhanuskodi SS.). Gobinath (C,Prabukumar S, SivaramakrishnanS. journal offPhotochemistryyandPhotobiology B-Biology, 2019, 190: 8-20. [18] Controlling the porosity and crystallinity of MgO catalysts by addition ofsurfactant in the sol-gel synthesis[J]. Possato LG, Pereira E, Goncalves RGL,Pulcinelli SH, Martins L, Santilli CV. Catalysis Today, 2018,344:52-58. [19] Synthesis and orientational assemblies of MgO nanosheets with exposed (111)facets[J]. Tang M, Ren YH, Hu YC, Ye L, Yue B, He HY. Chinese ChemicalLetters, 2018,29(6):935-938. [20] Necklace-like mesoporous MgO/TiO2 heterojunction structures with excellentcapability for water treatment[J]. Jia Y, Yu XY, Luo T, Jin Z, Su B, Liu JH, HuangXJ.Dalton Trans, 2014, 43(6): 2348-2351. [21] Pore size and surface area control MgO nanostructuresusing a surface-anttemplated hydrothermal process: high adsorption capability to azo dyes[J]. LiXC, Xiao W, He GH, Zheng WJ, Yu NS, Tan M. Colloids and Surfaces A-Physicochemical and Engineering Aspects, 2012,408: 79-86. [22] Preparation of aerogel Mg(OH)2 nanosheets by a combined sol-gel-hydrothermalprocess and its calcined MgO towards enhanced degradation of paraoxonpollutants[J]. Liu SH, Wei XH, Lin S, Guo MJ. J Sol-Gel Sci Technol,2021,99(1):122-131. [23] Microwave-Assisted Synthesis in Water as Solvent[J]. Dallinger D, Kappe CO.Chemical Reviews, 2007,107(6):2563-2591. [24] Rapid and destructive adsorption of paraoxon-ethyl toxin via a self-detoxifyinghybrid electrospun nanofibrous membrane[J].Wei XH, Li C, Wang CL, Lin S,Wu JH, Guo MJ. Chemical Engineering Journal, 2018,351:31-39. [25] Relationship between The Adsorption Capacity of Pesticides by Wood Residuesand The Properties of Woods and Pesticides[J].Rodriguez-Cruz S, Andrades MS,Sanchez-Camazano M. Sanchez-Martin MJ. Environmental Science &Technology,2007, 41(10): 3613-3619. [26] Evaluation of mesoporous cyclodextrin-silica nanocomposites for the removal ofpesticides from aqueous media[J]. Sawicki R, Mercier L. Environmental Science& Technology,2006,40(6):1978. [27] One-pot synthesis of sandwich-like MgO@Carbon with enhanced sorptioncapacity of organic dye[J]. Zheng XG, Huang M, You YH, Fu XJ, Liu Y, Wen J.Chemical Engineering Journal, 2017, 334,1399-1409. [28] Growth of MgO nanowires assisted by the annealing treatment of Au-coatedsubstrates[J].Kim HW, Shim SH. Chemical Physics Letters, 2006, 422(1-3):165-169. [29] Zn-MOF-74 derived N-doped mesoporous carbon as pH-universal electrocatalystfor oxygen reduction reaction[J]. Ye L, Chai G, Wen Z. Advanced FunctionalMaterials,2017,27(14). [30] One-pot synthesis of sandwich-like MgO@Carbon with enhanced sorptioncapacity of organic dye[J]. Zheng XG, Huang M, You YH, Fu XJ, Liu Y, Wen J.Chemical Engineering Journal, 2018, 334:1399-1409. [31] Fabrication of carbonated alumina doped by calcium oxide via microwavecombustion method used as nanocatalyst in biodiesel production: Influence ofcarbonSSourcetype[J]. Nayebzadenh H, Haghighi NM,SIaghatoleslamiN.Tabasizadeh M, Yousefi S. Energy Conversion and Management, 2018,171: 566-575. [32] Adsorption study of selenium ions from aqueous solutions using MgO nanosheetssynthesized by ultrasonic method[J]. Cui W, Li P, Wang ZM, Zhen SL, Zhang Y.Journal of Hazardous Materials, 2018, 341: 1268-1276. [33] Size-controlled synthesisand optical rproperties of monodisperse colloidalmagnesium oxide nanocrystals[J]. Moon HR, Urban JJ, Milliron DJ. AngewandteChemie-International Edition, 2009, 48(34):6278-6281. [34] Gelatin-pyrolyzed mesoporous carbon as a high- performance sodium-storagematerial[J]. Guan Z, Liu H, Xu B, Hao X, Wang ZX, Chen LQ. Journal ofMaterials Chemistry A, 2015,3(15): 7849-7854. [35] Porous N-doped carbon-encapsulated CoNi alloy nanoparticles derived fromMOFs as efficient bifunctional oxygen electrocatalysts[J]. Ning H, Li G, Chen Y, Zhang KK, Gong Z,Nie RF, Hu W, Xia QH. ACS Applied Materials & Interfaces,2019,11(2):1957-1968. [36] In situ one-step synthesis of hierarchical nitrogen- doped porous carbon for high-performance supercapacitors[J]. Jeon JW, Sharma R, Meduri P, Arey BW, SchaefHT, Lutkenhaus JL, Lemmon JP, Thallapally PK, Nandasiri MI, McGrail BP,Nune SK. ACS Applied Materials & Interfaces, 2014, 6(10): 7214-7222. [37] Electrospun SiO2-MgO hybrid fibers for heavy metal removal: Characterizationand adsorption study of Pb(II) and Cu(II)[J]. Xu CH, Shi SY, Wang XQ, ZhouHF, Wang L, Zhu LY, Zhang GH, Xu D. Journal of Hazardous Materials, 2020,381:120974. [38] Photocatalytic production of superoxide ion in the aqueous suspensions of twokinds of ZnO under simulated solar light[J]. Xu XL, Duan X, Yi ZG, Zhou ZW,Fan XM, Wang Y. Catalysis Communications, 2010,12(3): 169-172. [39] Formation of superoxide ions upon oxygen adsorption on magnesium-dopedmagnesium oxide: An EPR investigation[J]. Giamello E, Murphy D, Garrone E,Zecchina A. Spectrochim. Acta, Part A, 1993,49(9):1323-1330. [40] Synthesis of {111} facet-exposed MgO with surface oxygen vacancies for reactiveoxygen species generation in the dark[J]. Hao YJ, Liu B, Tian LG, Ren J, Liu SJ,Liu Y, Zhao J, Wang X. ACS Appl. Mater. Interfaces, 2017,9(14):12687-12693. [41] Photocatalytic degradation of paraoxon-ethyl in aqueous solution using titaniananoparticulate film[J]. Prasad GK, Ramacharyulu PVRK, Kumar JP, SrivastavaAR, Singh B. Thin solid films,2012,520(17):5597-5601. lectronic copy available at: https://ssrn.com/abstract= 微波辅助合成介孔MgO@Carbon混合纳米复合材料以增强对羟基化合物的催化降解作用 摘要 采用微波辅助水热和煅烧相结合的方法生产系列介孔氧化镁@碳(MgO@C)混合纳米复合材料,并通过TEM、XPS、XRD和拉曼光谱进行研究和验证。通过TEM、XPS、XRD和拉曼光谱的研究和验证。煅烧后的MgO@C纳米复合材料具有较高的比表面积和较小的晶粒尺寸,在优化制备后具有较强的降解对苯二酚能力。在室温下,MgO@C-600分解的对氨基苯酚毒素量约为55.65mg/g@90min。此外,拟二阶动力学模型(R2>0.99)更适合实验降解数据。MgO@C-600的强化降解机制制得到了验证,使用氯化硝基蓝四唑(NBT)作为探针来检测更多的超氧自由基(-O2-)活性点的产生。光热效。与非辐照样品相比,在808纳米的近红外(NIR)辐射下,去除效率提高了8倍。由于它们易于制造,成本低,而且去除效率高。MgO@C纳米复合材料可以作为一种合适的吸附剂,用于消除有机磷危险污染物。关键词:氧化镁,碳,微波,对苯二甲酸,降解 简介 纳米材料由于其独特的结构和特性,已经受到了越来越多的关注。其中,金属氧化物纳米颗粒被广泛地应用于各个领域,如储能、催化、电化学、润滑、传感器、涂层和环境修复。[1] 与传统的去除有机污染物的材料相比,金属氧化物纳米颗粒的应用范围更广。具有更好的吸收和降解能力,因为它们有多个活性点和高比表面积。作为一种有机磷农药和模拟VX的化学神经毒剂,对羟色胺毒素已被用作许多研究的探针分子,以探索如何进行解毒,以引起人们对环境修复的重视[2] 各种金属氧化物作为吸附剂,用于消除对氧磷的污染[3]。如TiO2, [4-5] MgO, [6-8] CaO, [9] ZnO, [10] Al2O3[11-12] 或 MnO2[13] 和 CeO2[14] 。其中,氧化镁是一种相对便宜、安全、高效和容易获得的吸收溶液中的重金属离子、有机染料、氟化物和磷酸盐。然而,制备尺寸较小的氧化镁纳米颗粒一直是一个挑战。因为它的高活性和易结块。一般来说,纳米颗粒的尺寸越小,其比表面积就越大。因此,它可以提供更多的活性点,以改善其固有的吸附和降解性能。 到目前为止,人们已经探索了各种方法来获得氧化镁纳米颗粒,例如溶胶-凝胶法、化学沉淀法、水热法、溶胶热法、热分解法、化学气相沉积法、微乳法和超声波法。用不同方法制备的氧化镁纳米颗粒的颗粒大小和形态具有不同的特性。在这些方法中,水热法通常被用来合成[20-21]然而,这些方法通常需要相对较高的水热温度(即180℃至265℃)和培养时间长(即4-6小时)[22],由于能源消耗大,对环境造成了严重的负面影响。作为一种有效的绿色方法。微波辅助辐照可以用来克服这些问题,由于其更快的加热速度、更高的能源效率、更容易控制和更安全的特性,微波辅助辐照可以用来克服这些问题,以促进批量加热的水热反应。[23]。作为一种传统的吸附剂,活性炭显示出体面的吸附能力。然而,它的饱和能力是有限的,而且吸收的毒物分子很容易解离,由于物理吸附的原因,会造成二次污染或伤害。[25-26] 很少有研究关注氧化镁/碳纳米复合材料的混合制造。[27] 在此,我们应用微波辅助水热法,一举合成了层次分明的氧化镁掺杂碳纳米复合材料(MgO@C),以探索其对对苯二酚的降解性能。 首先,在温和的条件下,在室温下用甲苯/H2O中水解的Mg(CH3O)2过夜制备水合Mg(OH)2。然后,加入三甘醇(TEG),作为碳源和极性分子,这有利于在程序化微波辐照下的加热条件,形成Mg(OH)2-TEG前体。最后,Mg(OH)2-TEG前体在不同的煅烧温度下,在N2条件下分解形成MgO纳米颗粒和无定形碳。表示为系列MgO@C纳米复合材料。此外,所制备的MgO@C纳米复合材料的结构和形态,以及它们对对苯二酚的性能、动力学和降解的机制进行了研究。此外,特定的MgO@C样品显示了在对苯二酚的降解方面表现出明显的光热增强效果。这样的MgO@C可以成为去除有机磷毒素的有效吸附剂。由于其相对较小的颗粒尺寸、较大的比表面积和丰富的超氧自由基(-O2-)位点。 结论 在不同的煅烧温度下,一个联合的微波辅助的成功地优化了微波辅助水热法,得到了具有相对较小尺寸和高比表面积的系列MgO@C纳米复合材料。该MgO@C-600样品具有最佳的对羟胺毒素降解效果,在90分钟后有86.95%的消除率为86.95%,qt为55.65 mg/g。这一动态过程很好地符合伪二阶模型。研究发现,MgO@C-600纳米复合材料暴露了更多的超氧自由基(-O2-)活性位点。颗粒的大小。除了高比表面积外,纳米材料的颗粒大小、形状和内部结构是决定降解性能的关键因素。此外。MgO@C-700显示了光热增强的对羟基化合物降解作用。由于其简便、低成本、生态友好的制造工艺和高去除率。MgO@C纳米复合材料可以作为一种潜在的吸附剂选择来消除有机磷危险污染物。
确定
还剩26页未读,是否继续阅读?

产品配置单
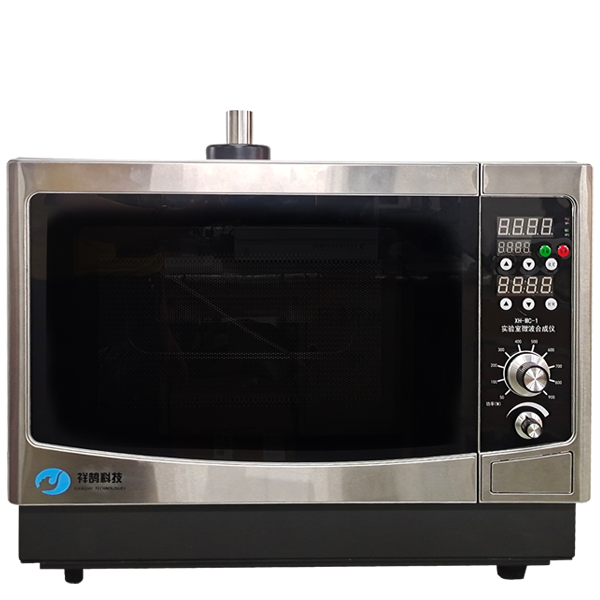
北京祥鹄科技发展有限公司为您提供《介孔混合纳米材料中对羟基化合物催化降解检测方案(微波合成仪)》,该方案主要用于纳米材料中其他检测,参考标准--,《介孔混合纳米材料中对羟基化合物催化降解检测方案(微波合成仪)》用到的仪器有Multicomb 电脑微波超声波紫外光组合催化合成仪
推荐专场

该厂商其他方案
更多