


方案详情
文
带通滤光片可以做为光栅单色器的廉价替代品,用于分离窄波长区域。许多商用的带通滤光片的最大半峰宽为10nm。本文主要使用安捷伦Cary系列高端分光光度计对亚纳米带通滤光片的半峰宽进行了表征。测试的三个样品中,其中一个样品的半峰宽为3.1埃,而另外两个样品的半峰宽仅为1.2埃。即使在极限的操作条件下,安捷伦Cary系列高端紫外依然能获得准确的测试结果。
方案详情

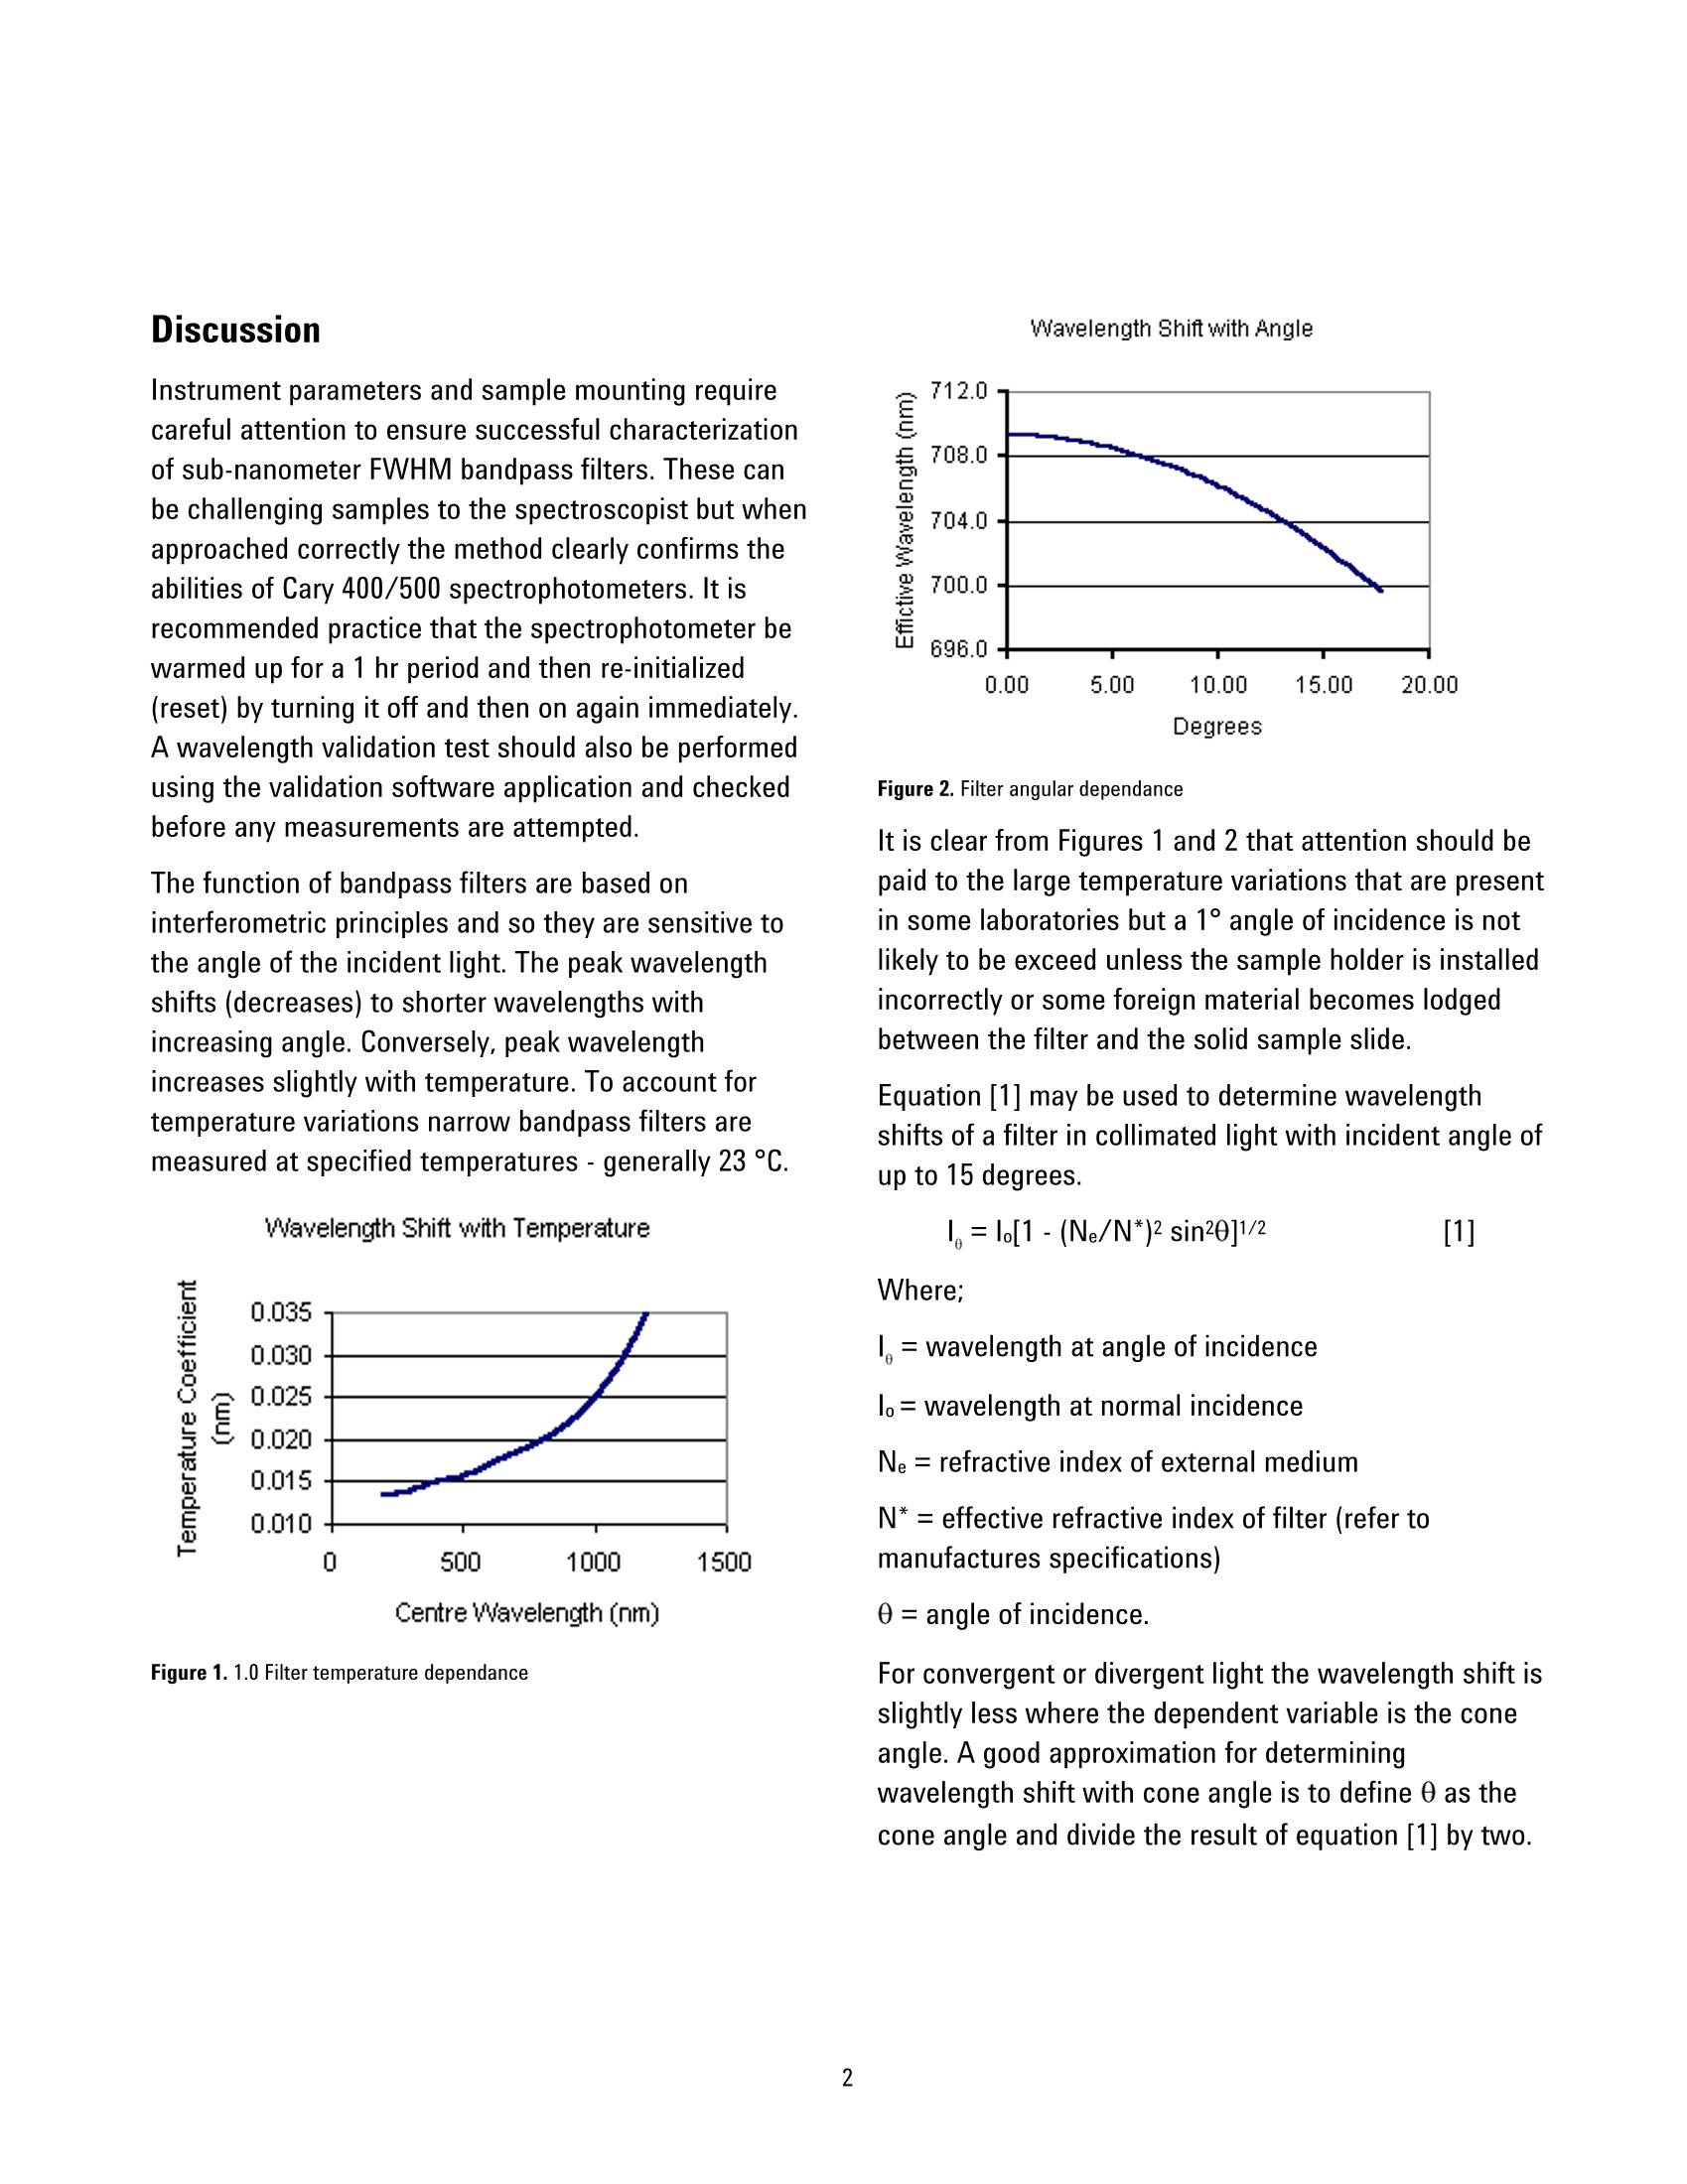
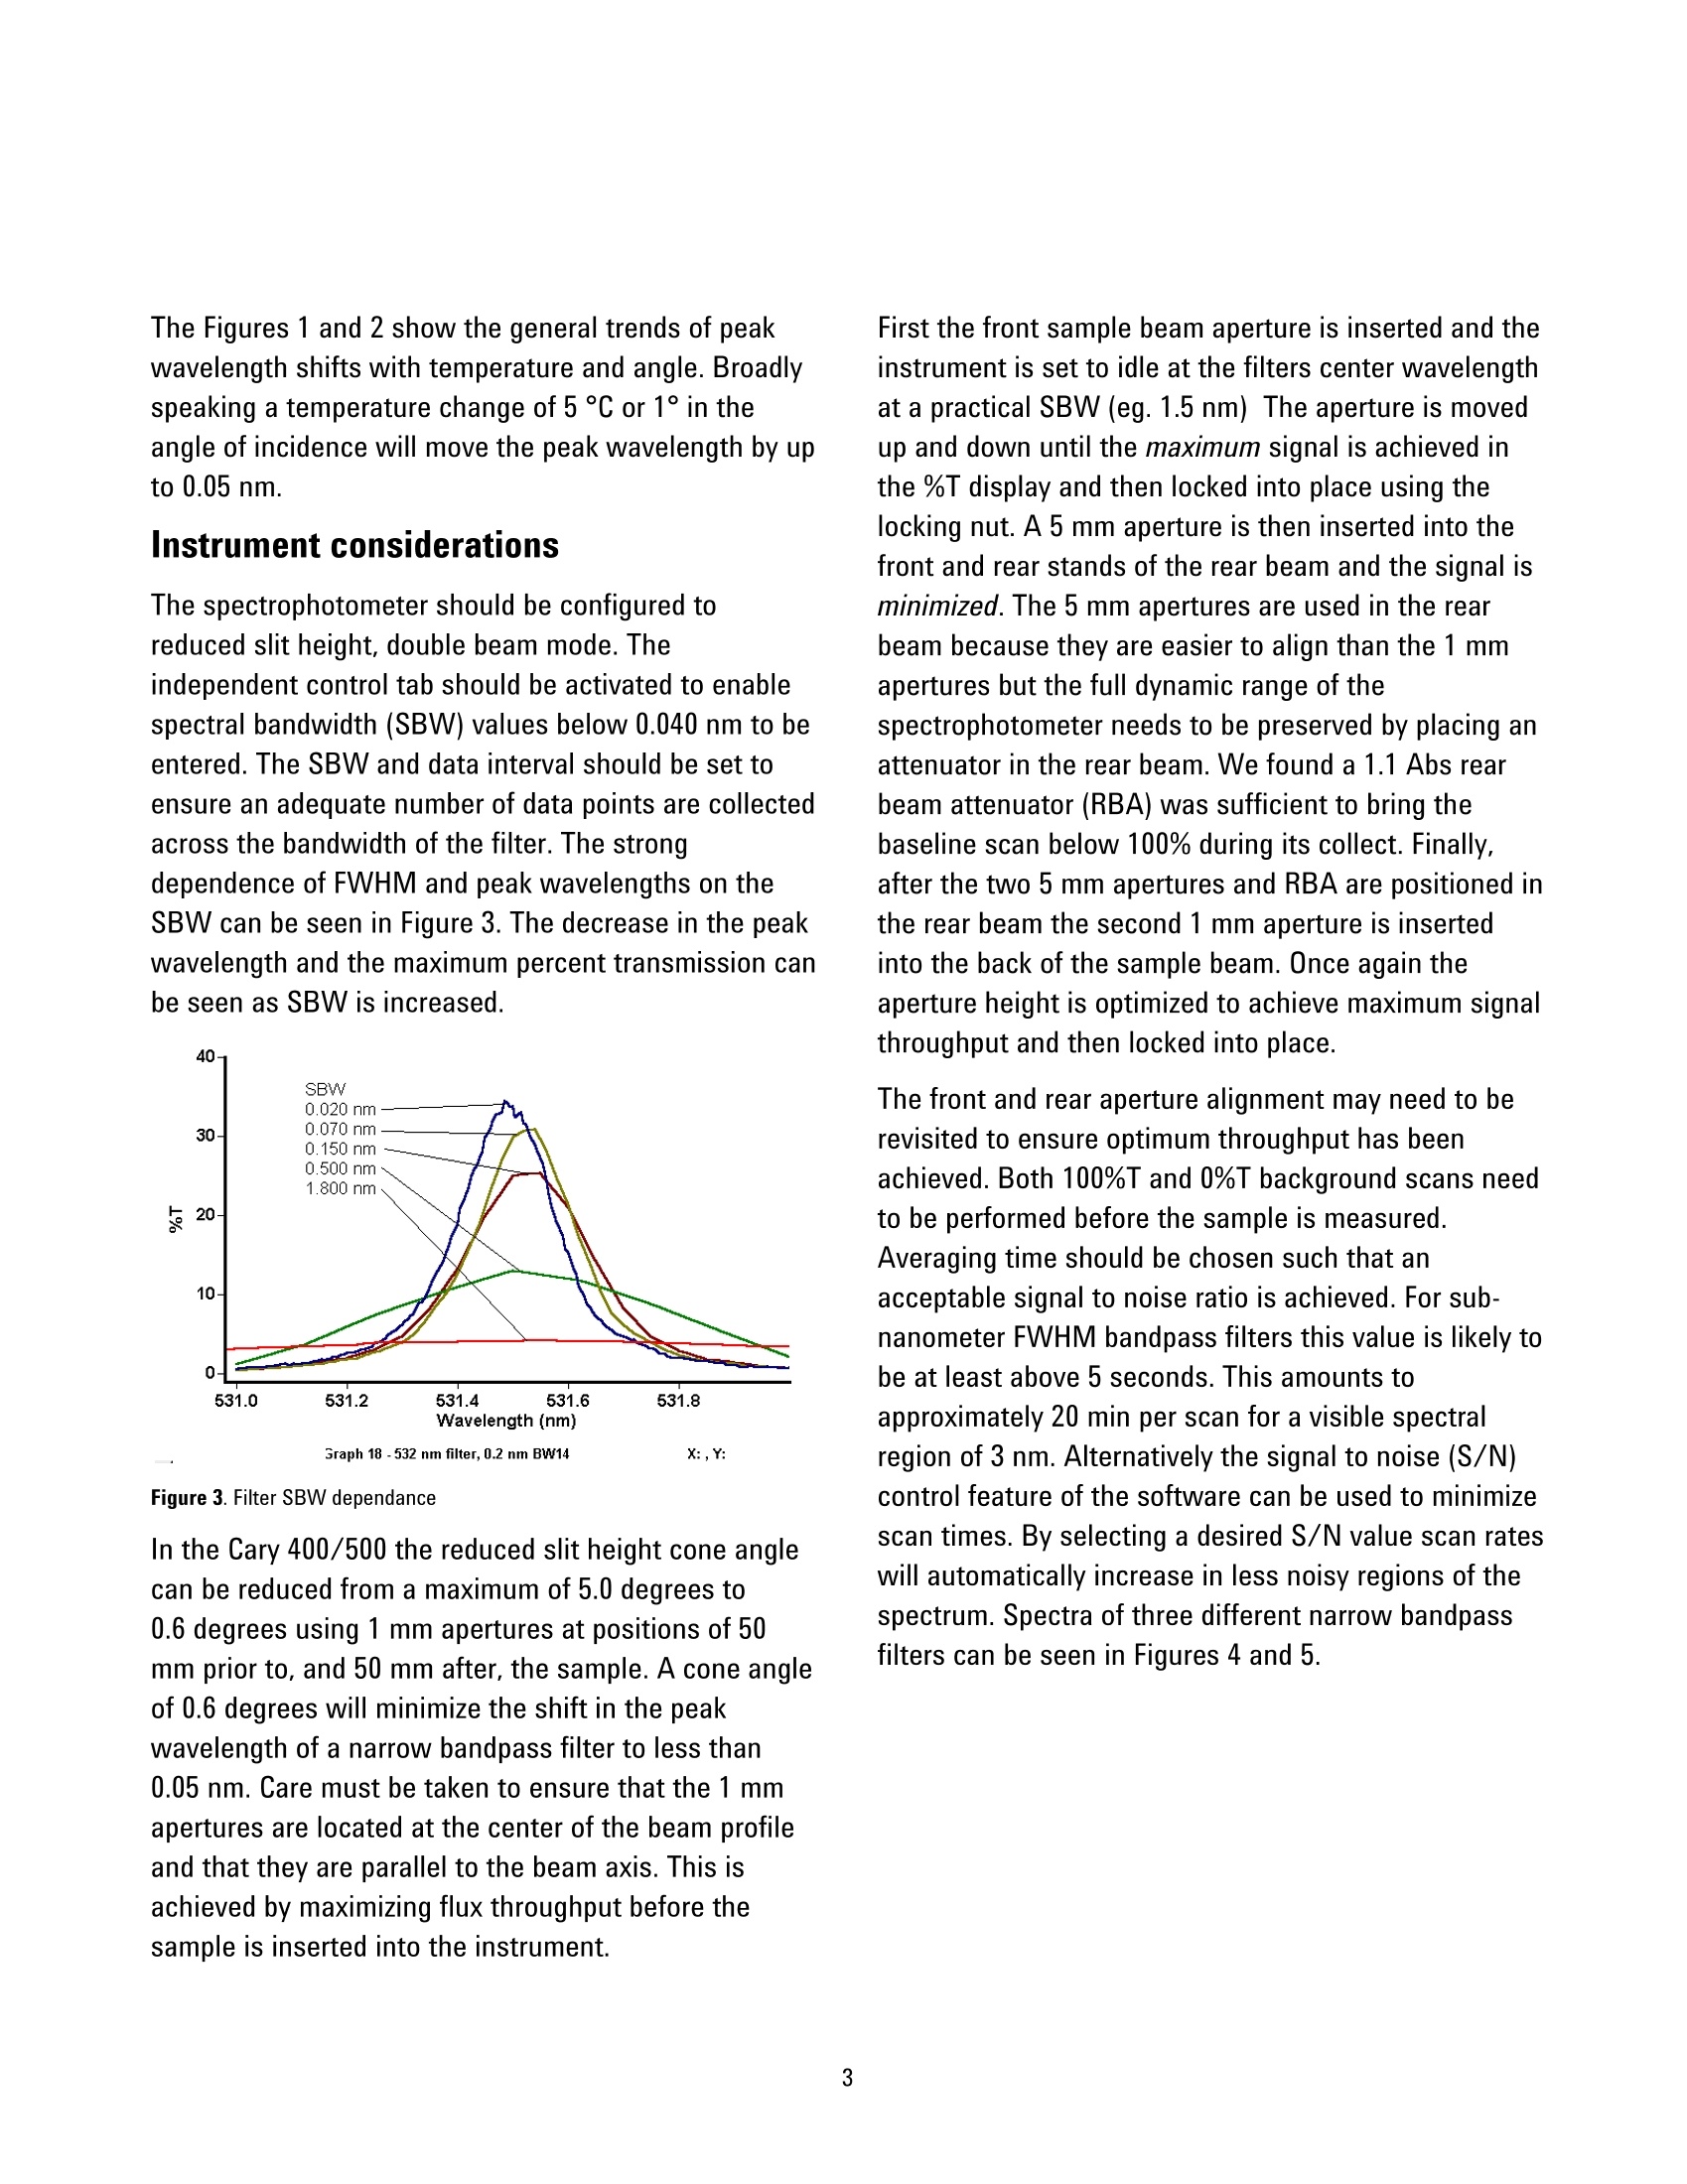
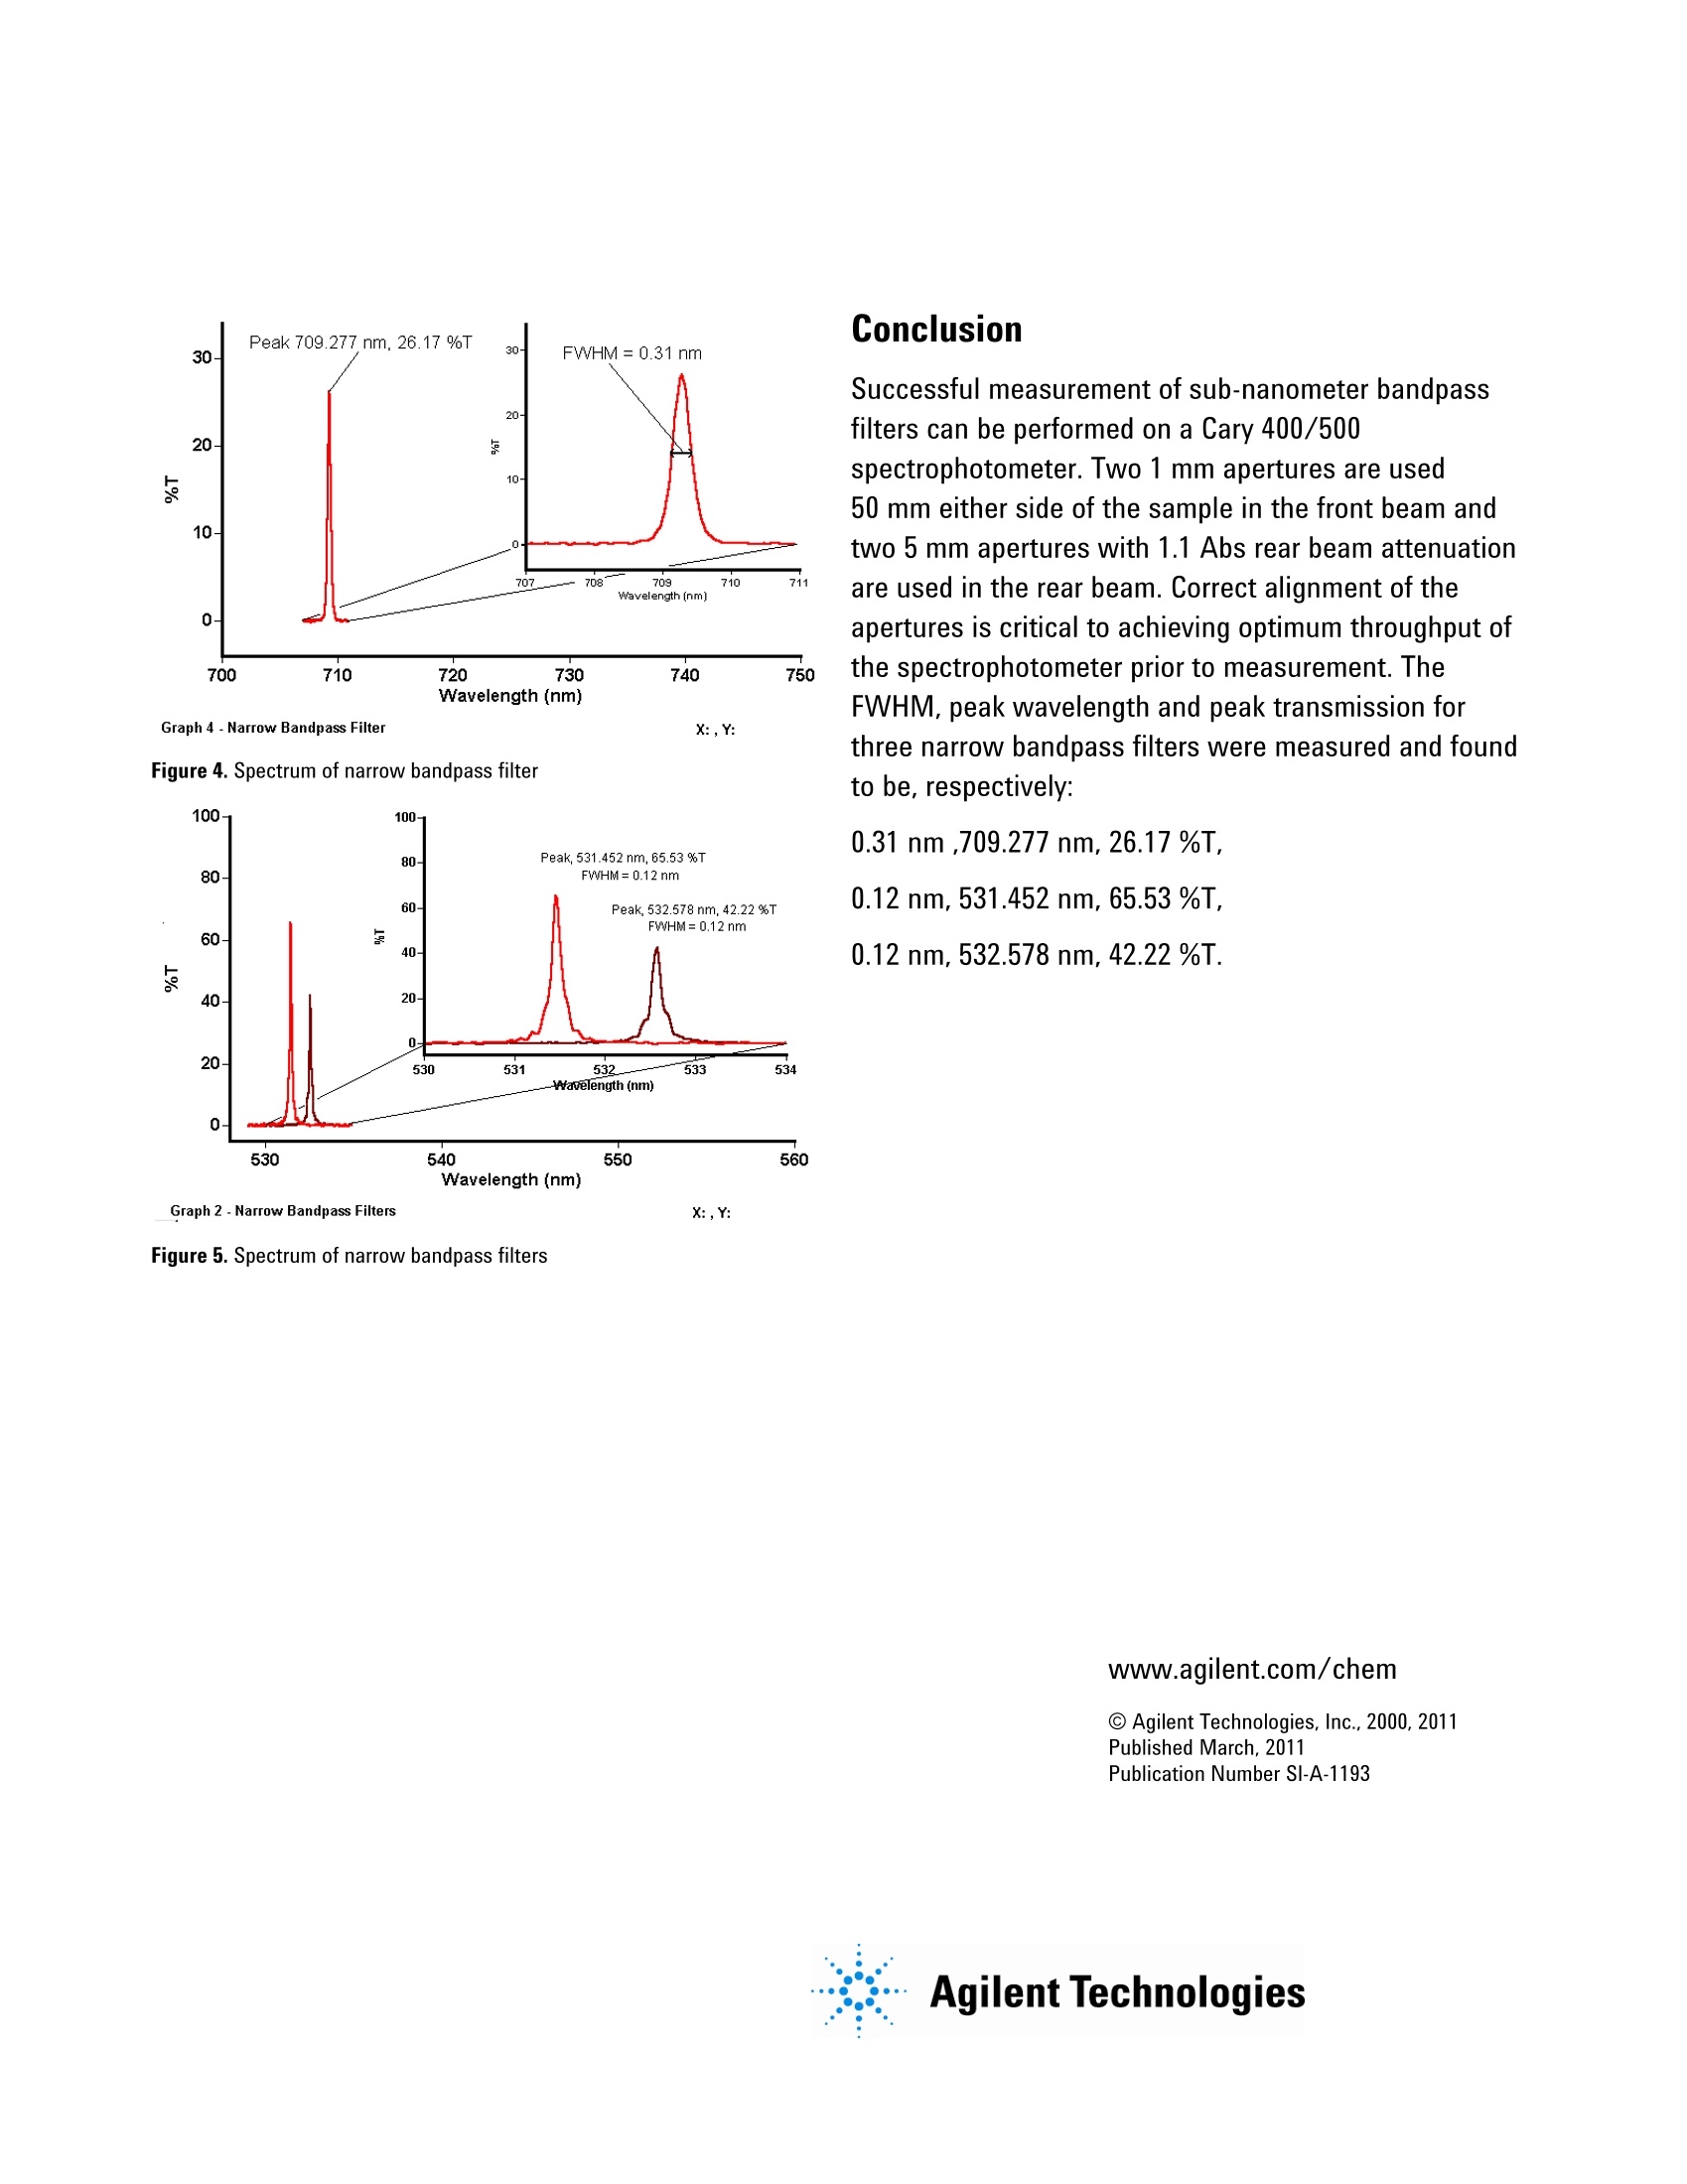
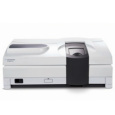
Characterizing sub-nanometer narrowbandpass filters using a Cary 400/500 Application Note Author Introduction Travis BurtAgilent Technologies, Inc. Bandpass filters can provide an inexpensive alternative to gratingmonochromators for isolating narrow wavelength regions. Many commercialbandpass filters have full-widthhalf-maximum (FWHM) bandwidths of10 nm. This application note describes Cary 400/500 spectrophotometertechniques for characterizing sub-nanometer FWHM bandpass filters andpresents the results of a filter with a FWHM bandwidth of 3.1 A and twofilters with FWHM bandwidths of 1.2 A. Agilent Technologies Discussion Instrument parameters and sample mounting requirecareful attention to ensure successful characterizationof sub-nanometer FWHM bandpass filters. These canbe challenging samples to the spectroscopist but whenapproached correctly the method clearly confirms theabilities of Cary 400/500 spectrophotometers. It isrecommended practice that the spectrophotometer bewarmed up for a 1 hr period and then re-initialized(reset) by turning it off and then on again immediately.A wavelength validation test should also be performedusing the validation software application and checkedbefore any measurements are attempted. The function of bandpass filters are based oninterferometric principles and so they are sensitive tothe angle of the incident light. The peak wavelengthshifts (decreases) to shorter wavelengths withincreasing angle. Conversely,peak wavelengthincreases slightly with temperature. To account fortemperature variations narrow bandpass filters aremeasured at specified temperatures - generally 23 °C. Wavelength Shift with Temperature Figure 1.1.0 Filter temperature dependance Wavelength Shift with Angle Degrees Figure 2. Filter angular dependance It is clear from Figures 1 and 2 that attention should bepaid to the large temperature variations that are presentin some laboratories but a 1°angle of incidence is notlikely to be exceed unless the sample holder is installedincorrectly or some foreign material becomes lodgedbetween the filter and the solid sample slide. Equation [1] may be used to determine wavelengthshifts of a filter in collimated light with incident angle ofup to 15 degrees. Where; l= wavelength at angle of incidence lo= wavelength at normal incidence Ne = refractive index of external medium N* = effective refractive index of filter (refer tomanufactures specifications) 0= angle of incidence. For convergent or divergent light the wavelength shift isslightly less where the dependent variable is the coneangle. A good approximation for determiningwavelength shift with cone angle is to define 0 as thecone angle and divide the result of equation [1] by two. The Figures 1 and 2 show the general trends of peakwavelength shifts with temperature and angle. Broadlyspeaking a temperature change of 5 °C or 1° in theangle of incidence will move the peak wavelength by upto 0.05 nm. Instrument considerations The spectrophotometer should be configured toreduced slit height, double beam mode. Theindependent control tab should be activated to enablespectral bandwidth (SBW) values below 0.040 nm to beentered. The SBWand data interval should be set toensure an adequate number of data points are collectedacross the bandwidth of the filter. The strongdependence of FWHM and peak wavelengths on theSBW can be seen in Figure 3. The decrease in the peakwavelength and the maximum percent transmission canbe seen as SBW is increased. Figure 3. Filter SBW dependance In the Cary 400/500 the reduced slit height cone anglecan be reduced from a maximum of 5.0 degrees to0.6 degrees using 1 mm apertures at positions of 50mm prior to, and 50 mm after, the sample. A cone angleof 0.6 degrees will minimize the shift in the peakwavelength of a narrow bandpass filter to less than0.05 nm. Care must be taken to ensure that the 1 mmapertures are located at the center of the beam profileand that they are parallel to the beam axis. This isachieved by maximizing flux throughput before thesample is inserted into the instrument. First the front sample beam aperture is inserted and theinstrument is set to idle at the filters center wavelengthat a practical SBW (eg. 1.5 nm) The aperture is movedup and down until the maximum signal is achieved inthe %T display and then locked into place using thelocking nut. A 5 mm aperture is then inserted into thefront and rear stands of the rear beam and the signal isminimized. The 5 mm apertures are used in the rearbeam because they are easier to align than the 1 mmapertures but the full dynamic range of thespectrophotometer needs to be preserved by placing anattenuator in the rear beam. We found a 1.1 Abs rearbeam attenuator (RBA) was sufficient to bring thebaseline scan below 100% during its collect. Finally,after the two 5 mm apertures and RBA are positioned inthe rear beam the second 1 mm aperture is insertedinto the back of the sample beam. Once again theaperture height is optimized to achieve maximum signalthroughput and then locked into place. The front and rear aperture alignment may need to berevisited to ensure optimum throughput has beenachieved. Both 100%T and 0%T background scans needto be performed before the sample is measured.Averaging time should be chosen such that anacceptable signal to noise ratio is achieved. For sub-nanometer FWHM bandpass filters this value is likely tobe at least above 5 seconds. This amounts toapproximately 20 min per scan for a visible spectralregion of 3 nm. Alternatively the signal to noise (S/N)control feature of the software can be used to minimizescan times. By selecting a desired S/N value scan rateswill automatically increase in less noisy regions of thespectrum. Spectra of three different narrow bandpassfilters can be seen in Figures 4 and 5. Graph 4-Narrow Bandpass Filter X:,Y: Figure 4. Spectrum of narrow bandpass filter Graph 2-Narrow Bandpass Filters X:Y: Successful measurement of sub-nanometer bandpassfilters can be performed on a Cary 400/500spectrophotometer. Two 1 mm apertures are used50 mm either side of the sample in the front beam andtwo 5 mm apertures with 1.1 Abs rear beam attenuationare used in the rear beam. Correct alignment of theapertures is critical to achieving optimum throughput ofthe spectrophotometer prior to measurement. TheFWHM, peak wavelength and peak transmission forthree narrow bandpass filters were measured and foundto be, respectively: 0.31 nm ,709.277 nm, 26.17 %T, 0.12 nm, 531.452 nm, 65.53 %T, 0.12 nm, 532.578 nm, 42.22 %T. www.agilent.com/chem C Agilent Technologies, Inc., 2000, 2011 Published March,2011Publication Number SI-A-1193 带通滤光片可以做为光栅单色器的廉价替代品,用于分离窄波长区域。许多商用的带通滤光片的最大半峰宽为10nm。本文主要使用安捷伦Cary系列高端分光光度计对亚纳米带通滤光片的半峰宽进行了表征。测试的三个样品中,其中一个样品的半峰宽为3.1埃,而另外两个样品的半峰宽仅为1.2埃。即使在极限的操作条件下,安捷伦Cary系列高端紫外依然能获得准确的测试结果。
确定
还剩2页未读,是否继续阅读?

产品配置单
安捷伦科技(中国)有限公司为您提供《亚纳米窄带滤光片中表征检测方案(紫外分光光度)》,该方案主要用于其他中表征检测,参考标准--,《亚纳米窄带滤光片中表征检测方案(紫外分光光度)》用到的仪器有Cary 5000 紫外可见近红外分光光度计、Agilent Cary 7000 全能型分光光度计(UMS)
推荐专场
相关方案
更多
该厂商其他方案
更多