


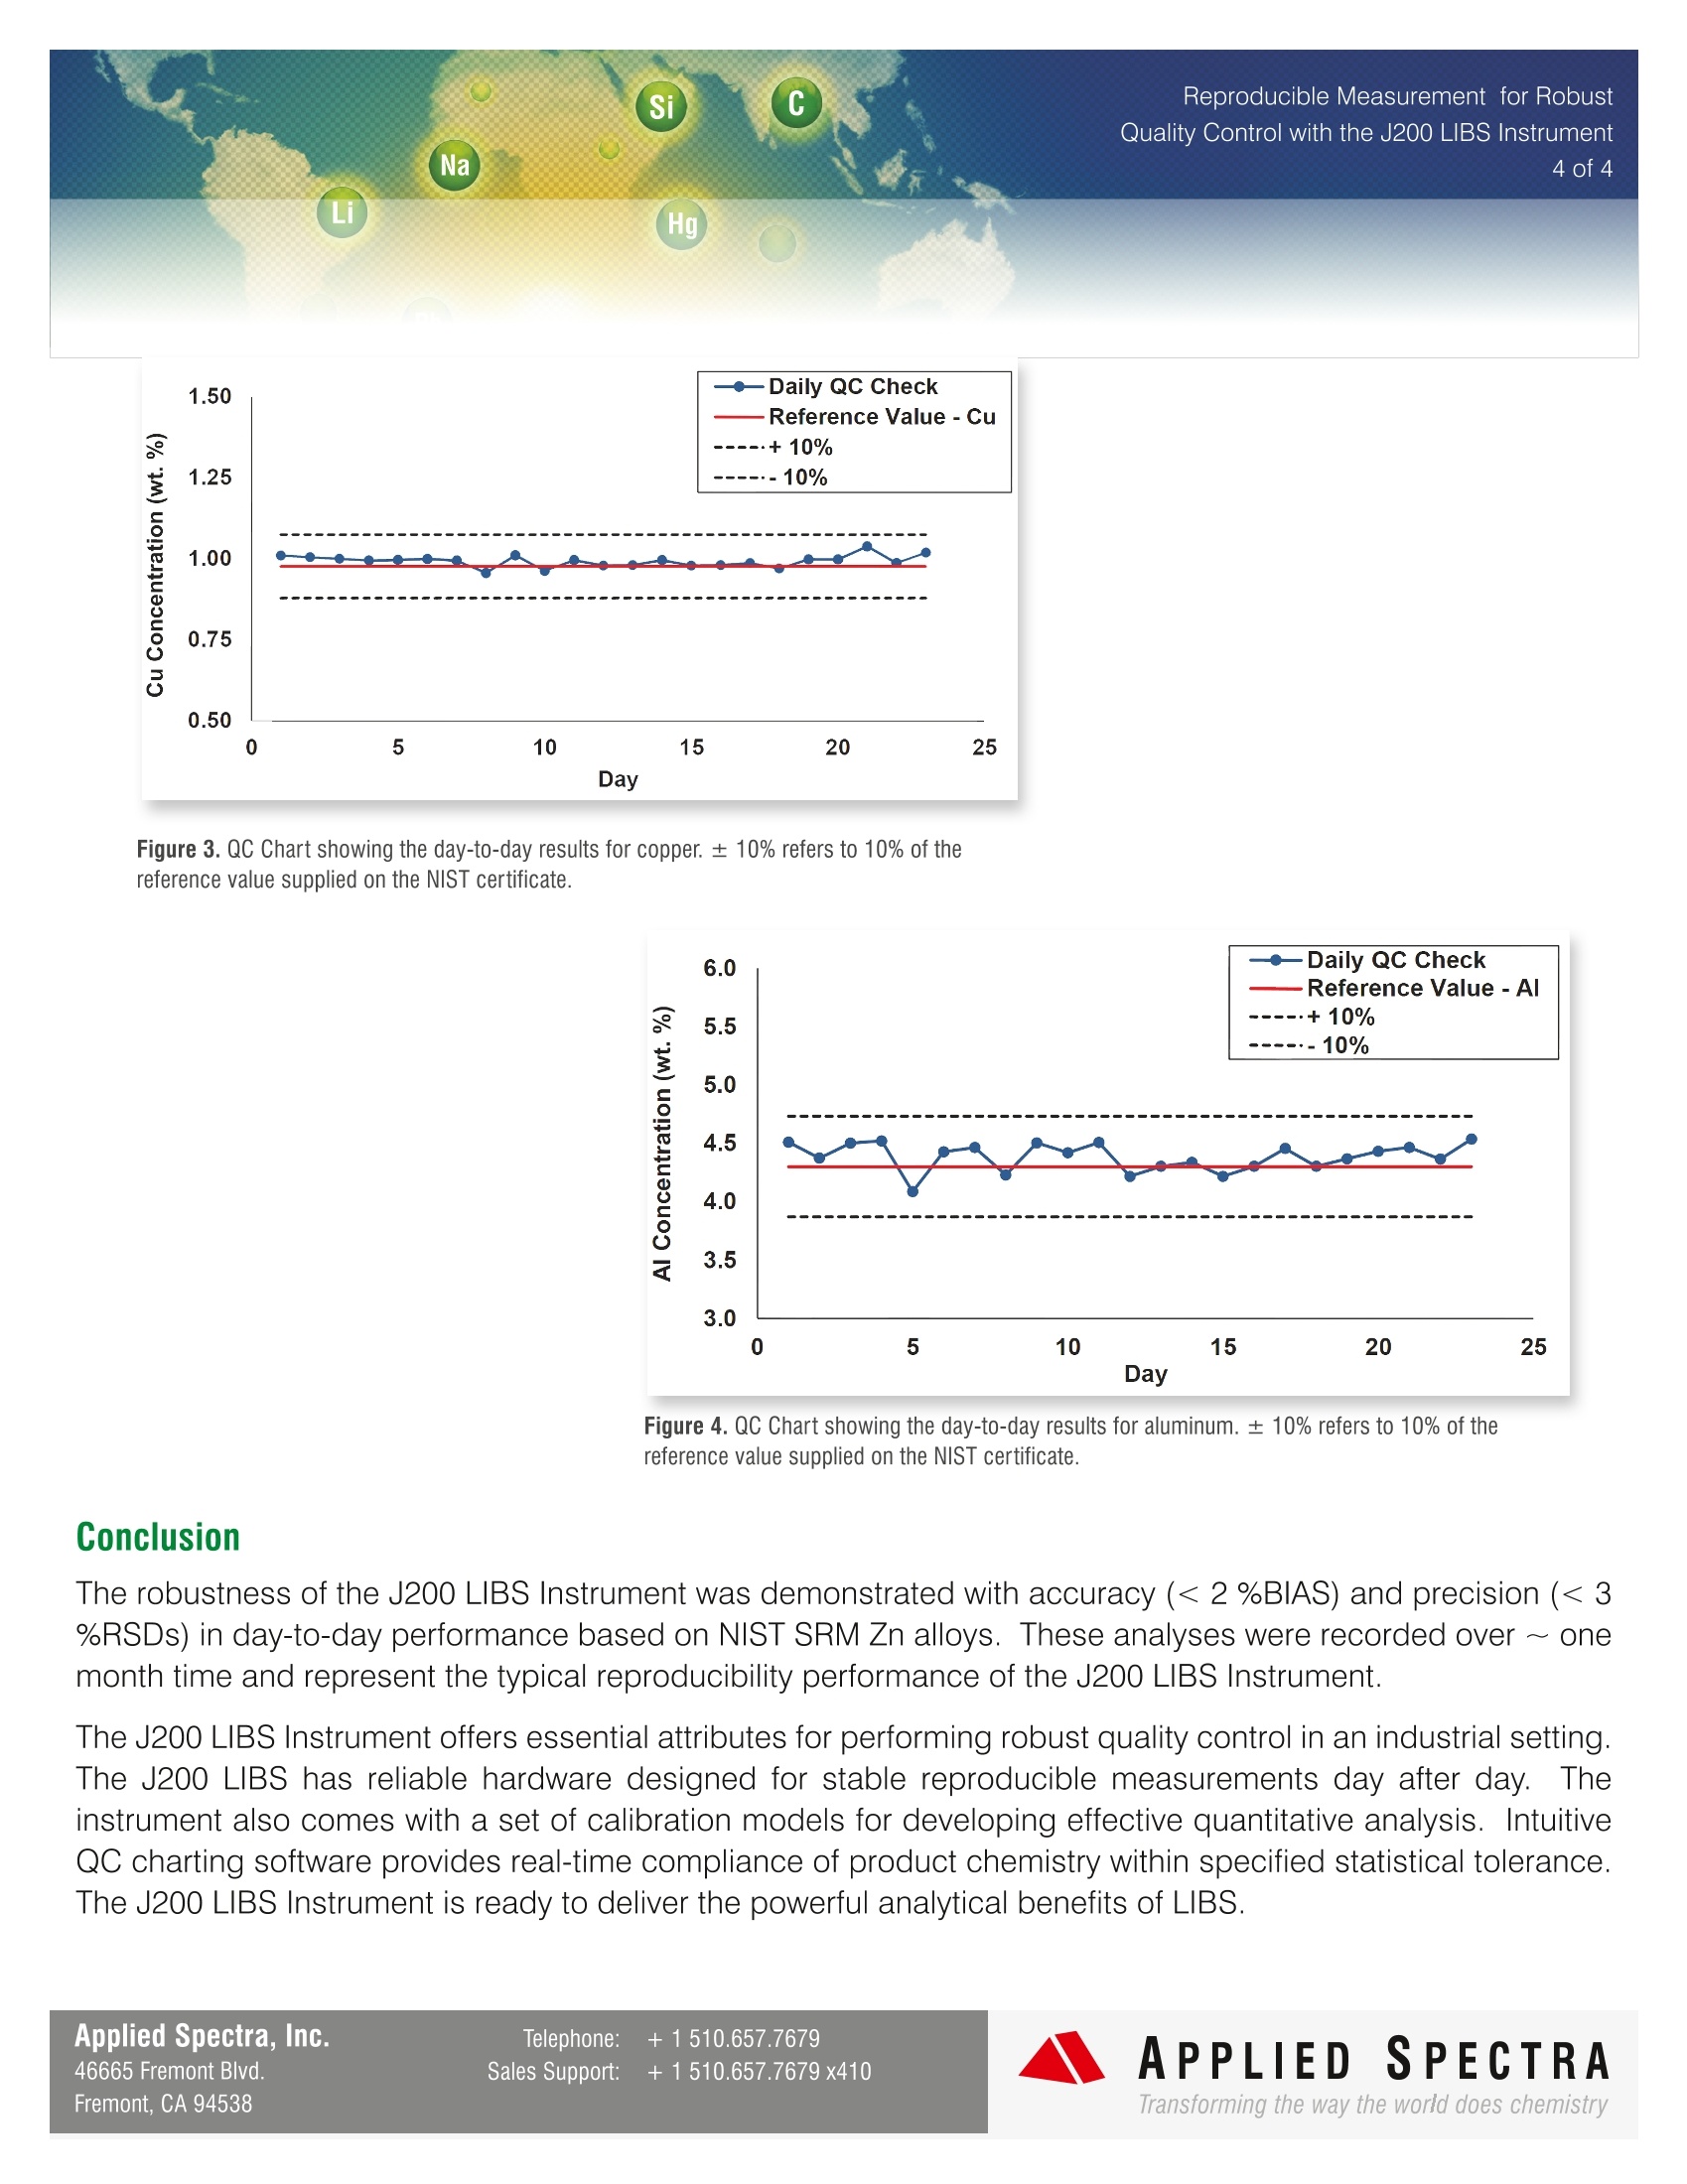
检测了这些NIST样品中的所有元素。第1天对NIST SRM 625-630(锌合金)进行了分析,以建立铜和铝的校准曲线。然后在第1天将NIST SRM 630作为QC样品(参考样品)进行分析,此后的23个工作日(~4周)也是如此。铜和铝在23天内的总精度分别为+1.7%偏离率和+1.9%偏离率。
方案详情

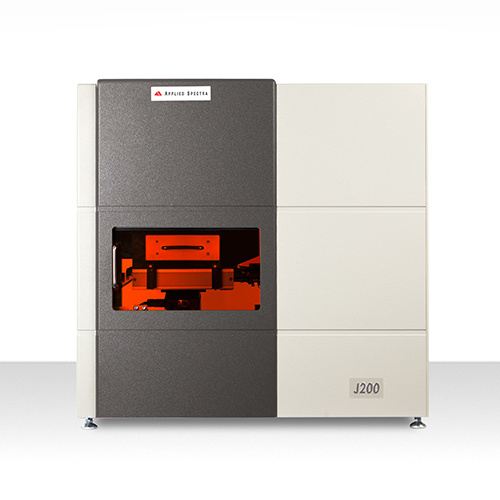
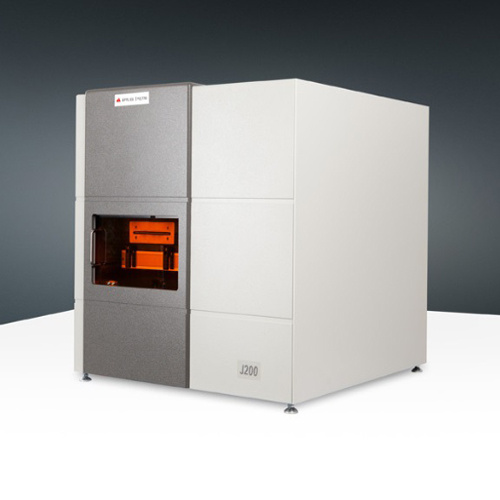
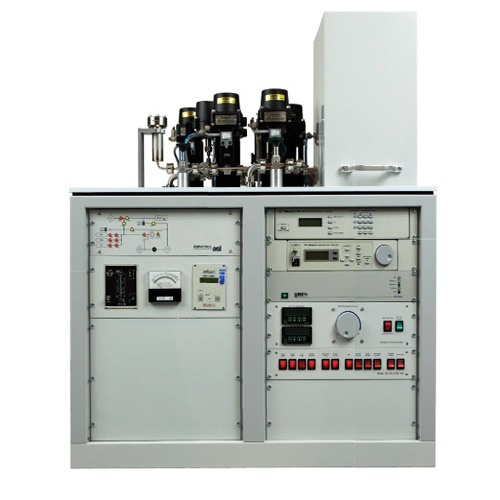
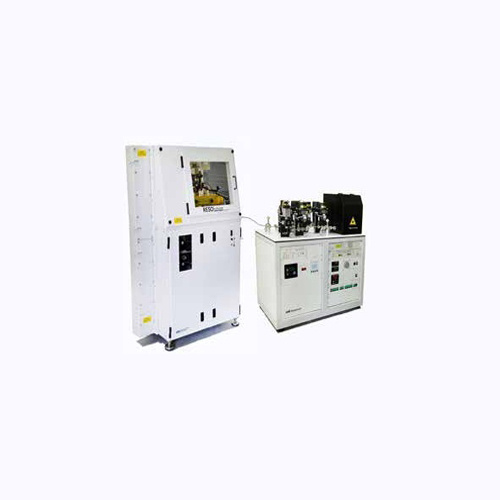
Reproducible Measurement for RobustQuality Control with the J200 LIBS Instrument4 of 4 LIBS (Laser Induced Breakdown Spectroscopy) is ananalytical technique for elemental analysis based onoptical detection of the plasma emission generated bya short-pulsed laser beam focused on a sample. LIBShas a long history; its first demonstration for elementalanalysis was in 1964 based on a Q-switched rubylaser. The last decade has seen significant advances inthe reliability and reproducibility performanceofLIBS instrumentation. LIBS has been adopted inmanyindustrial applications including metallurgrgy,energy materials, thin films, soil, forensic, ecologyand environmental sample analysis.LIBS made a landmark achievement when it landed in the 3.7-billion-year-old Gale Crater on August 6, 2012 as a part ofthe Chemcam sensor of NASA's Curiosity Rover onMars. Since then, LIBS has reliably made 160,000measurements of over4500 locations onMars.sending valuable elemental composition informationabout soils and rocks back to Earth. The technical benefits of LIBS include high speed (inseconds), direct solid analysis, and coverage of everyelement, including lighter and non-metal elementssuch as H, Be, Li, C, N, O and halogens; difficultfor other elemental analysis techniques. With theseattributes, LIBS is ideal for performing many industrialmeasurement applications, including quality control(QC) during manufacturing processes. Si C Reproducible Measurement for RobustQuality Control with the J200 LIBS InstrumentNa 2 of 4LiHg Robust QC requires a reliableinstrumentthat produces reproducibleday-to-day measurements. The J200 LIBS, Applied Spectra Inc's3rd generation LIBS instrument, provides unparalleled long termreproducibility. In this study, NIST SRM Zn standards were analyzedover an extended period of time. Using on-board multivariatecalibration and QC charting software, the quantitative results weretracked to demonstrate excellent day-to-day reproducibility. Operating Parameters Applied Spectra J200 LIBS Instrument 266 nm Nd:YAG laser (ns) with a broadband CCD detector (EC model) Axiom Operating Software FlexTM sample chamber with helium or argon gas flow Samples: NIST SRM Zn Alloys 625-630 LIBS data analyzed with Applied Spectra's Data Analysis Software Sample Analysis The J200 LIBS Instrument provides spectral coverage from 190 - 1040 nm, measuring every element in theseNIST samples. NIST SRMs 625-630 (Zn alloys) were analyzed on day 1 to create a calibration curve for copperand aluminum. NIST SRM 630 was then analyzed as a QC sample (reference sample) on day 1 and every daythereafter for 23 working days (~4+ weeks). Figure 1 displays the LIBS spectra showing the major elementsdetected in the NIST SRM 630 Zn allov. Figure 1. LIBS spectrum from NIST 630 SRM Zn alloy. Telephone: +1510.657.7679 For quantitative analysis, the user can select univariate calibration based on traditional peak integration ofindividual emission lines. Alternatively, the user may apply multivariate calibration models based on chemometricanalysis of LIBS spectra. The multivariate calibration curves for Al and Cu are shown in Fig. 2. Figure 2. Multivariate calibration curves for Cu and Al created on day 1. The quality of the calibration model was determined using a combination of the highest R2 value and root-mean-square error estimated by cross-validation (RMSECV). The precision of each standard for Cu and Al calibrationcurves ranged from 2.5-4.3 %RSDs. A quality control check (Daily QC Check) was performed by analyzing the NIST SRM 630 sample against thispre-defined calibration. The calibration curves from day 1 were used to calculate the concentration of the “dailyQC check" and the results were tracked in the QC software over 23 days. The solid red line in Figs. 3 and 4represents the Cu (0.976 wt. %) and Al (4.30 wt. %) values from the NIST 630 standard reference material. The average results of analysis were 0.993 ±0.018 wt. %Cu (1.9 %RSD) and 4.38±0.12 wt. % Al (2.7%RSD). Thegraphs also show the reference value ±10% range for visualpurposes only. The overall accuracy for these results overthe 23 days was found to be +1.7 %BIAS and +1.9 %BIASfor Cu and Al, respectively. si C Na Li Hg —0—[Daily QC Check Figure 3. QC Chart showing the day-to-day results for copper. ±10% refers to 10% of thereference value supplied on the NIST certificate. Figure 4. QC Chart showing the day-to-day results for aluminum. ±10% refers to 10% of thereference value supplied on the NIST certificate. Conclusion The robustness of the J200 LIBS Instrument was demonstrated with accuracy (< 2 %BIAS) and precision (< 3%RSDs) in day-to-day performance based on NIST SRM Zn alloys. These analyses were recorded over ~ onemonth time and represent the typical reproducibility performance of the J200 LIBS Instrument. The J200 LIBS Instrument offers essential attributes for performing robust quality control in an industrial setting.The J200 LIBS has reliable hardware designed for stable reproducible measurements day after day.Theinstrument also comes with a set of calibration models for developing effective quantitative analysis. IntuitiveQC charting software provides real-time compliance of product chemistry within specified statistical tolerance.The J200 LIBS Instrument is ready to deliver the powerful analytical benefits of LIBS. APPLIEDSPECTRAwww.AppliedSpectra.comTransforming the way the world does chemistry Applied Spectra, Inc.Fremont Blvd.Fremont, CA PPLIED SPECTRASales Support: +xransforming the way the world does chemistry QC图表显示铜的日常结果。±10%是指NIST证书上提供的参考值的10%。QC图表显示铝的日常结果。±10%是指NIST证书上提供的参考值的10%.
确定


还剩2页未读,是否继续阅读?

产品配置单

北京富尔邦科技发展有限责任公司为您提供《合金中多元素检测方案(激光诱导击穿)》,该方案主要用于合金中含量分析检测,参考标准--,《合金中多元素检测方案(激光诱导击穿)》用到的仪器有美国ASI 激光诱导击穿光谱仪(LIBS)
推荐专场
相关方案
更多