


方案详情
文
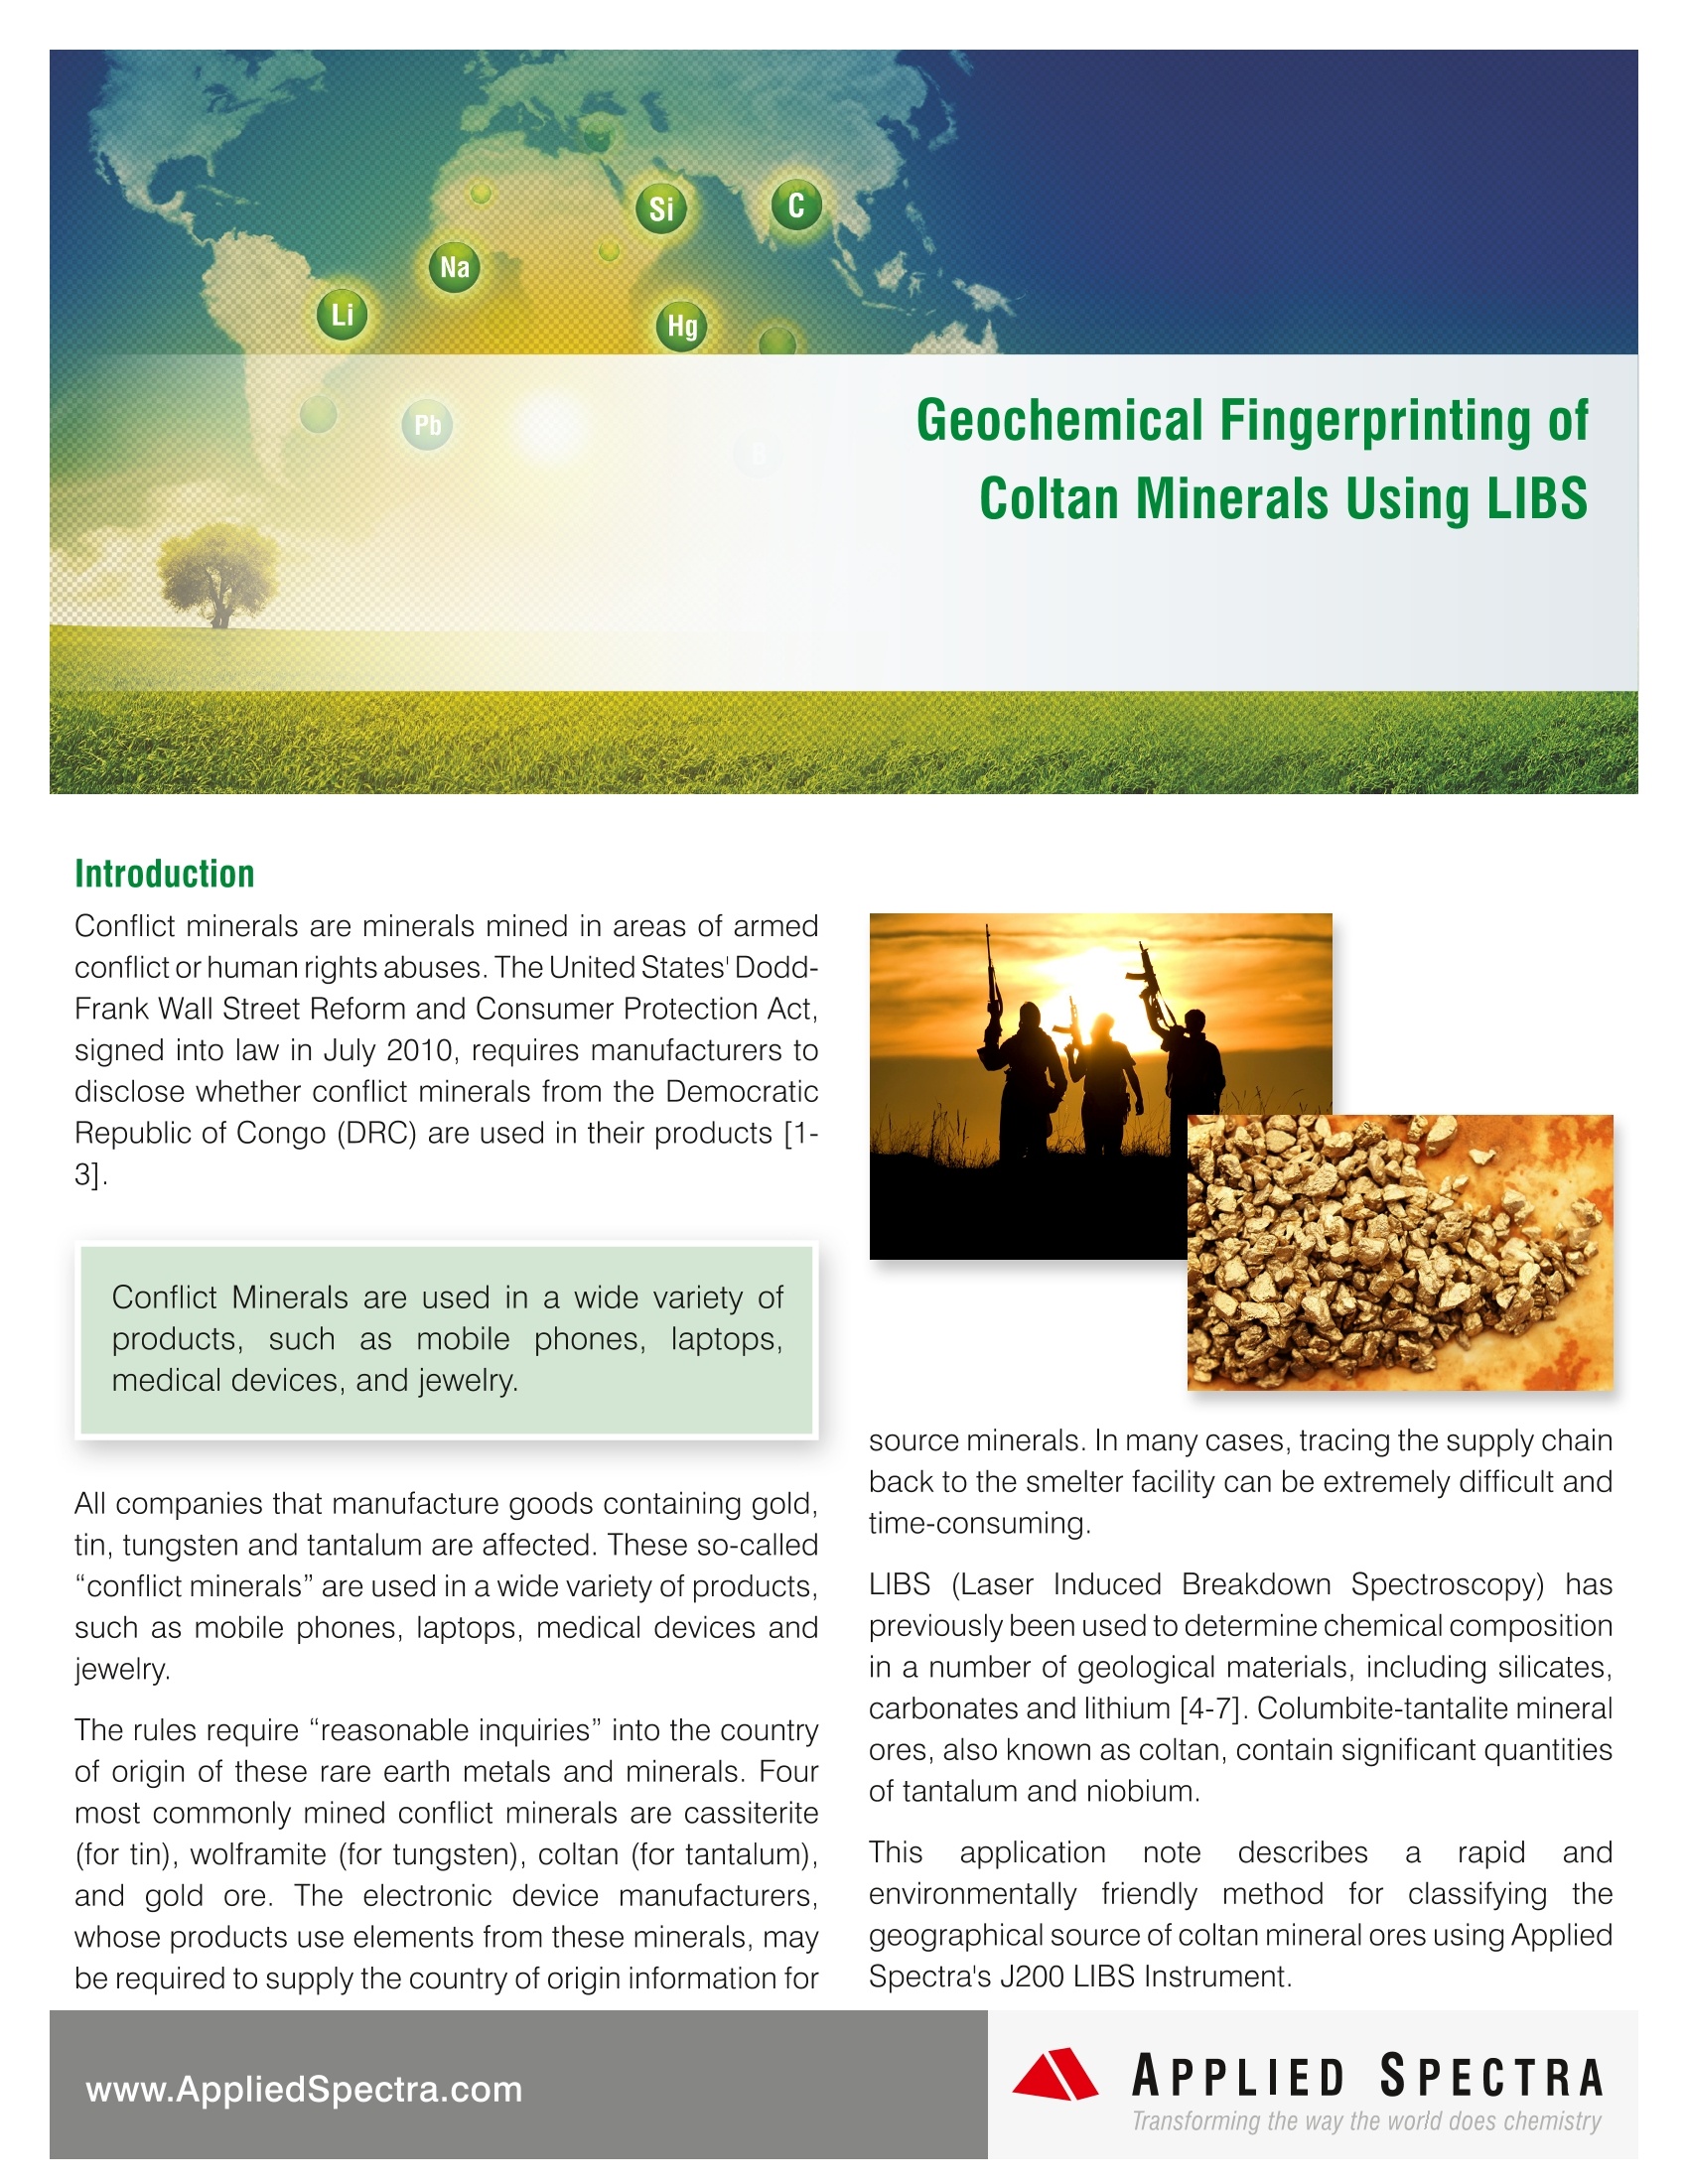
冲突矿物这个词汇用于武装冲突和侵权情况下的矿石开采。铌和钽是两种稀有金属,主要是自然产生的铌和钽铁矿的复杂氧化物,通常称为钶钽铁矿石。钶钽铁矿石的提取后用于电子或其他商品。从刚果民主共和国非法出口钶钽铁矿石是这一地区发生冲突事件的主要原因。确定钶钽铁矿石的化学成分是确定其出处的主要方法之一。常规分析方法,复杂繁琐。
激光诱导击穿光谱技术(LIBS)提供了一种快速辨别矿物来源地的方法,因为 LIBS 等离子体发射光谱能够实时提供矿物完整的化学组成信息(“化学指纹”)。
方案详情

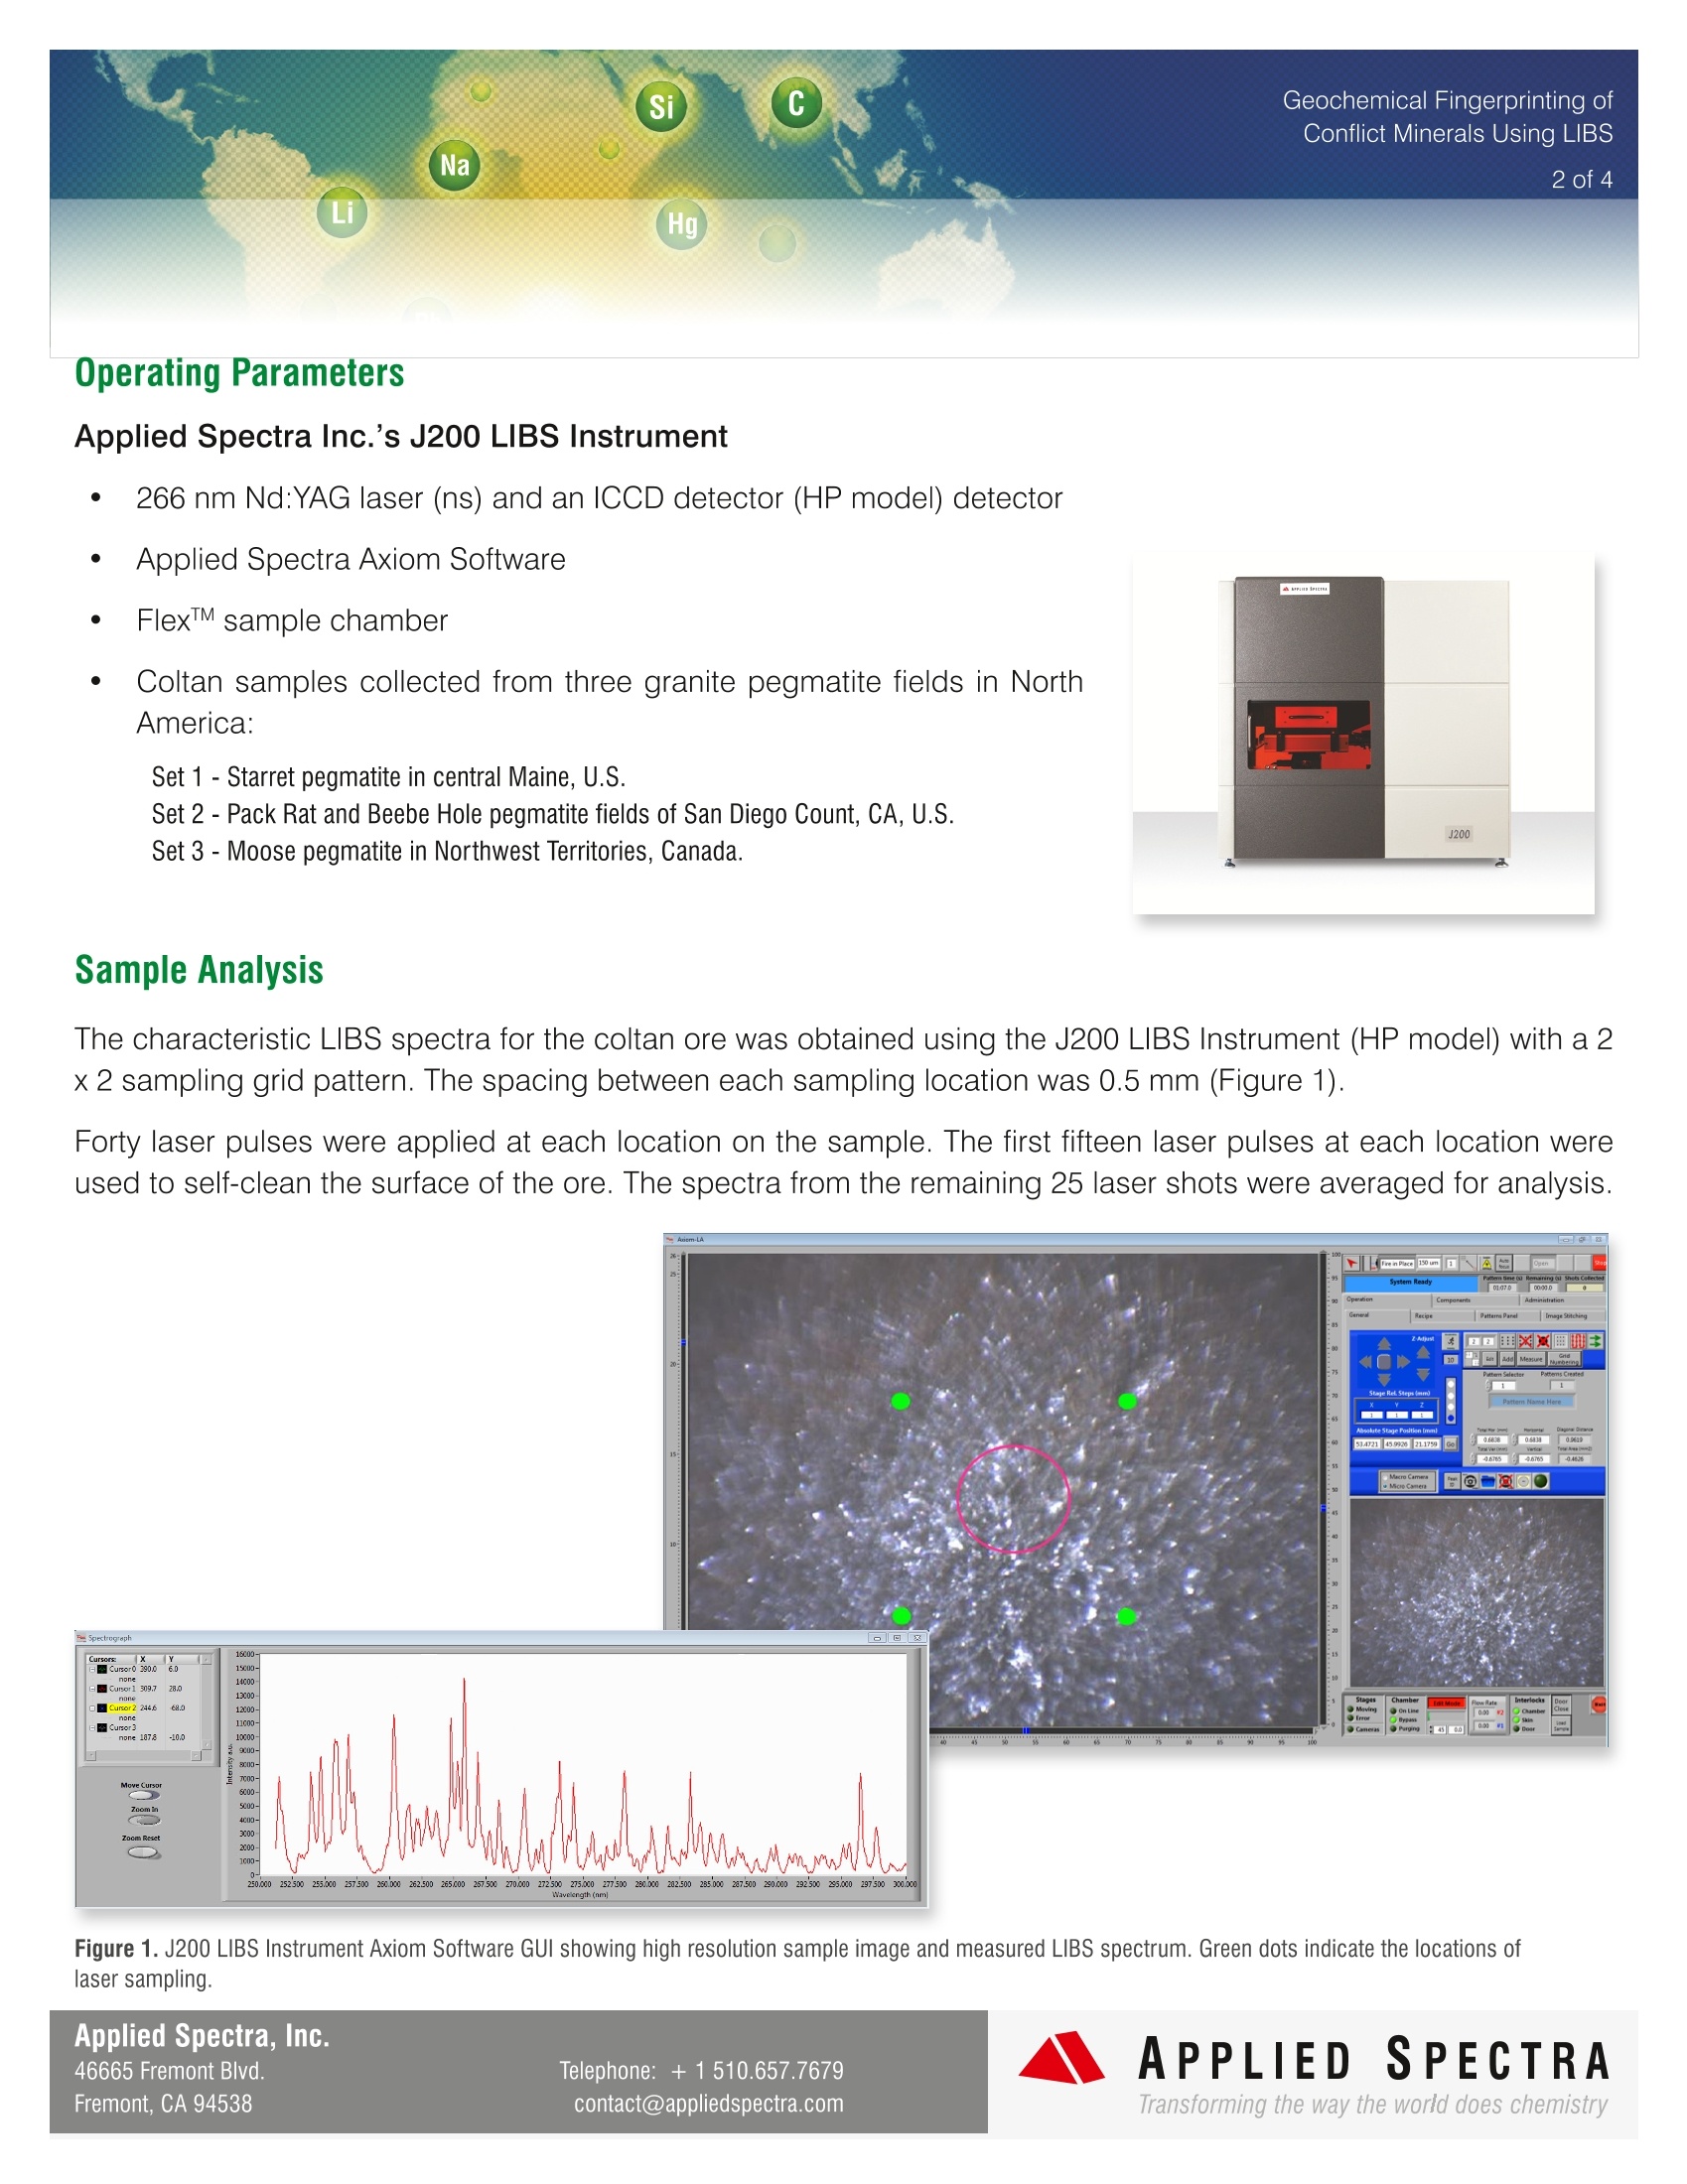
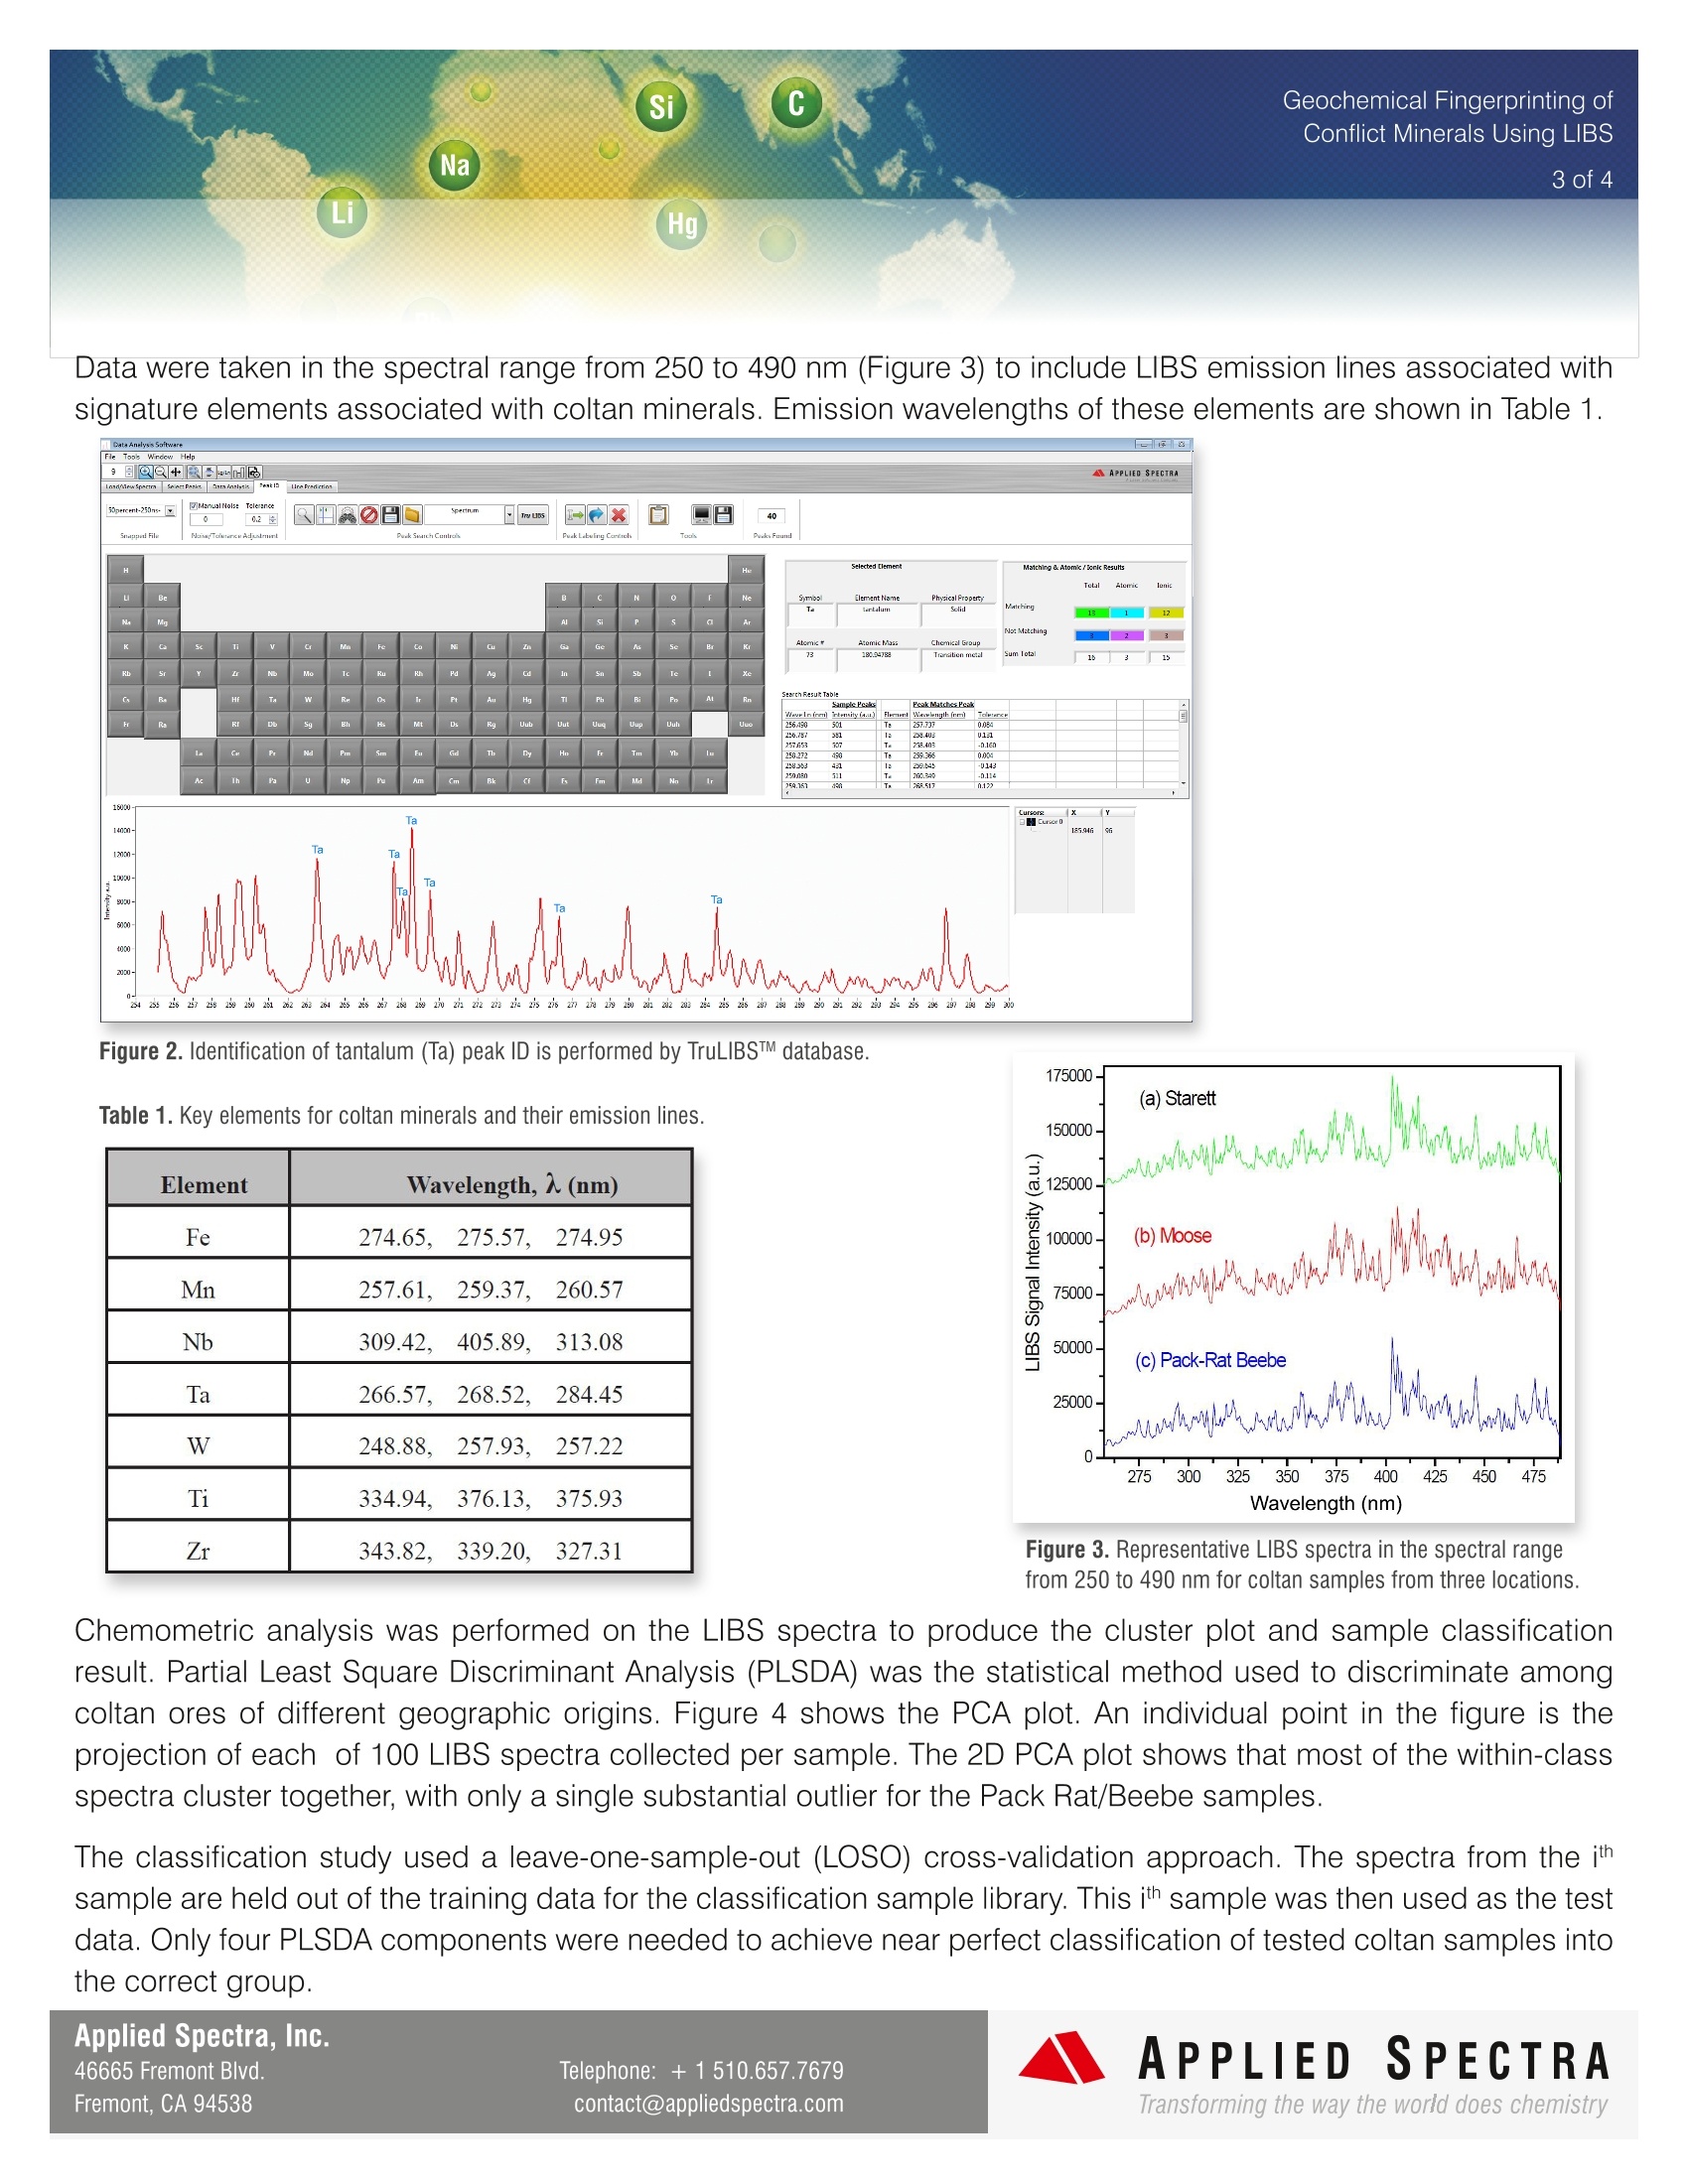
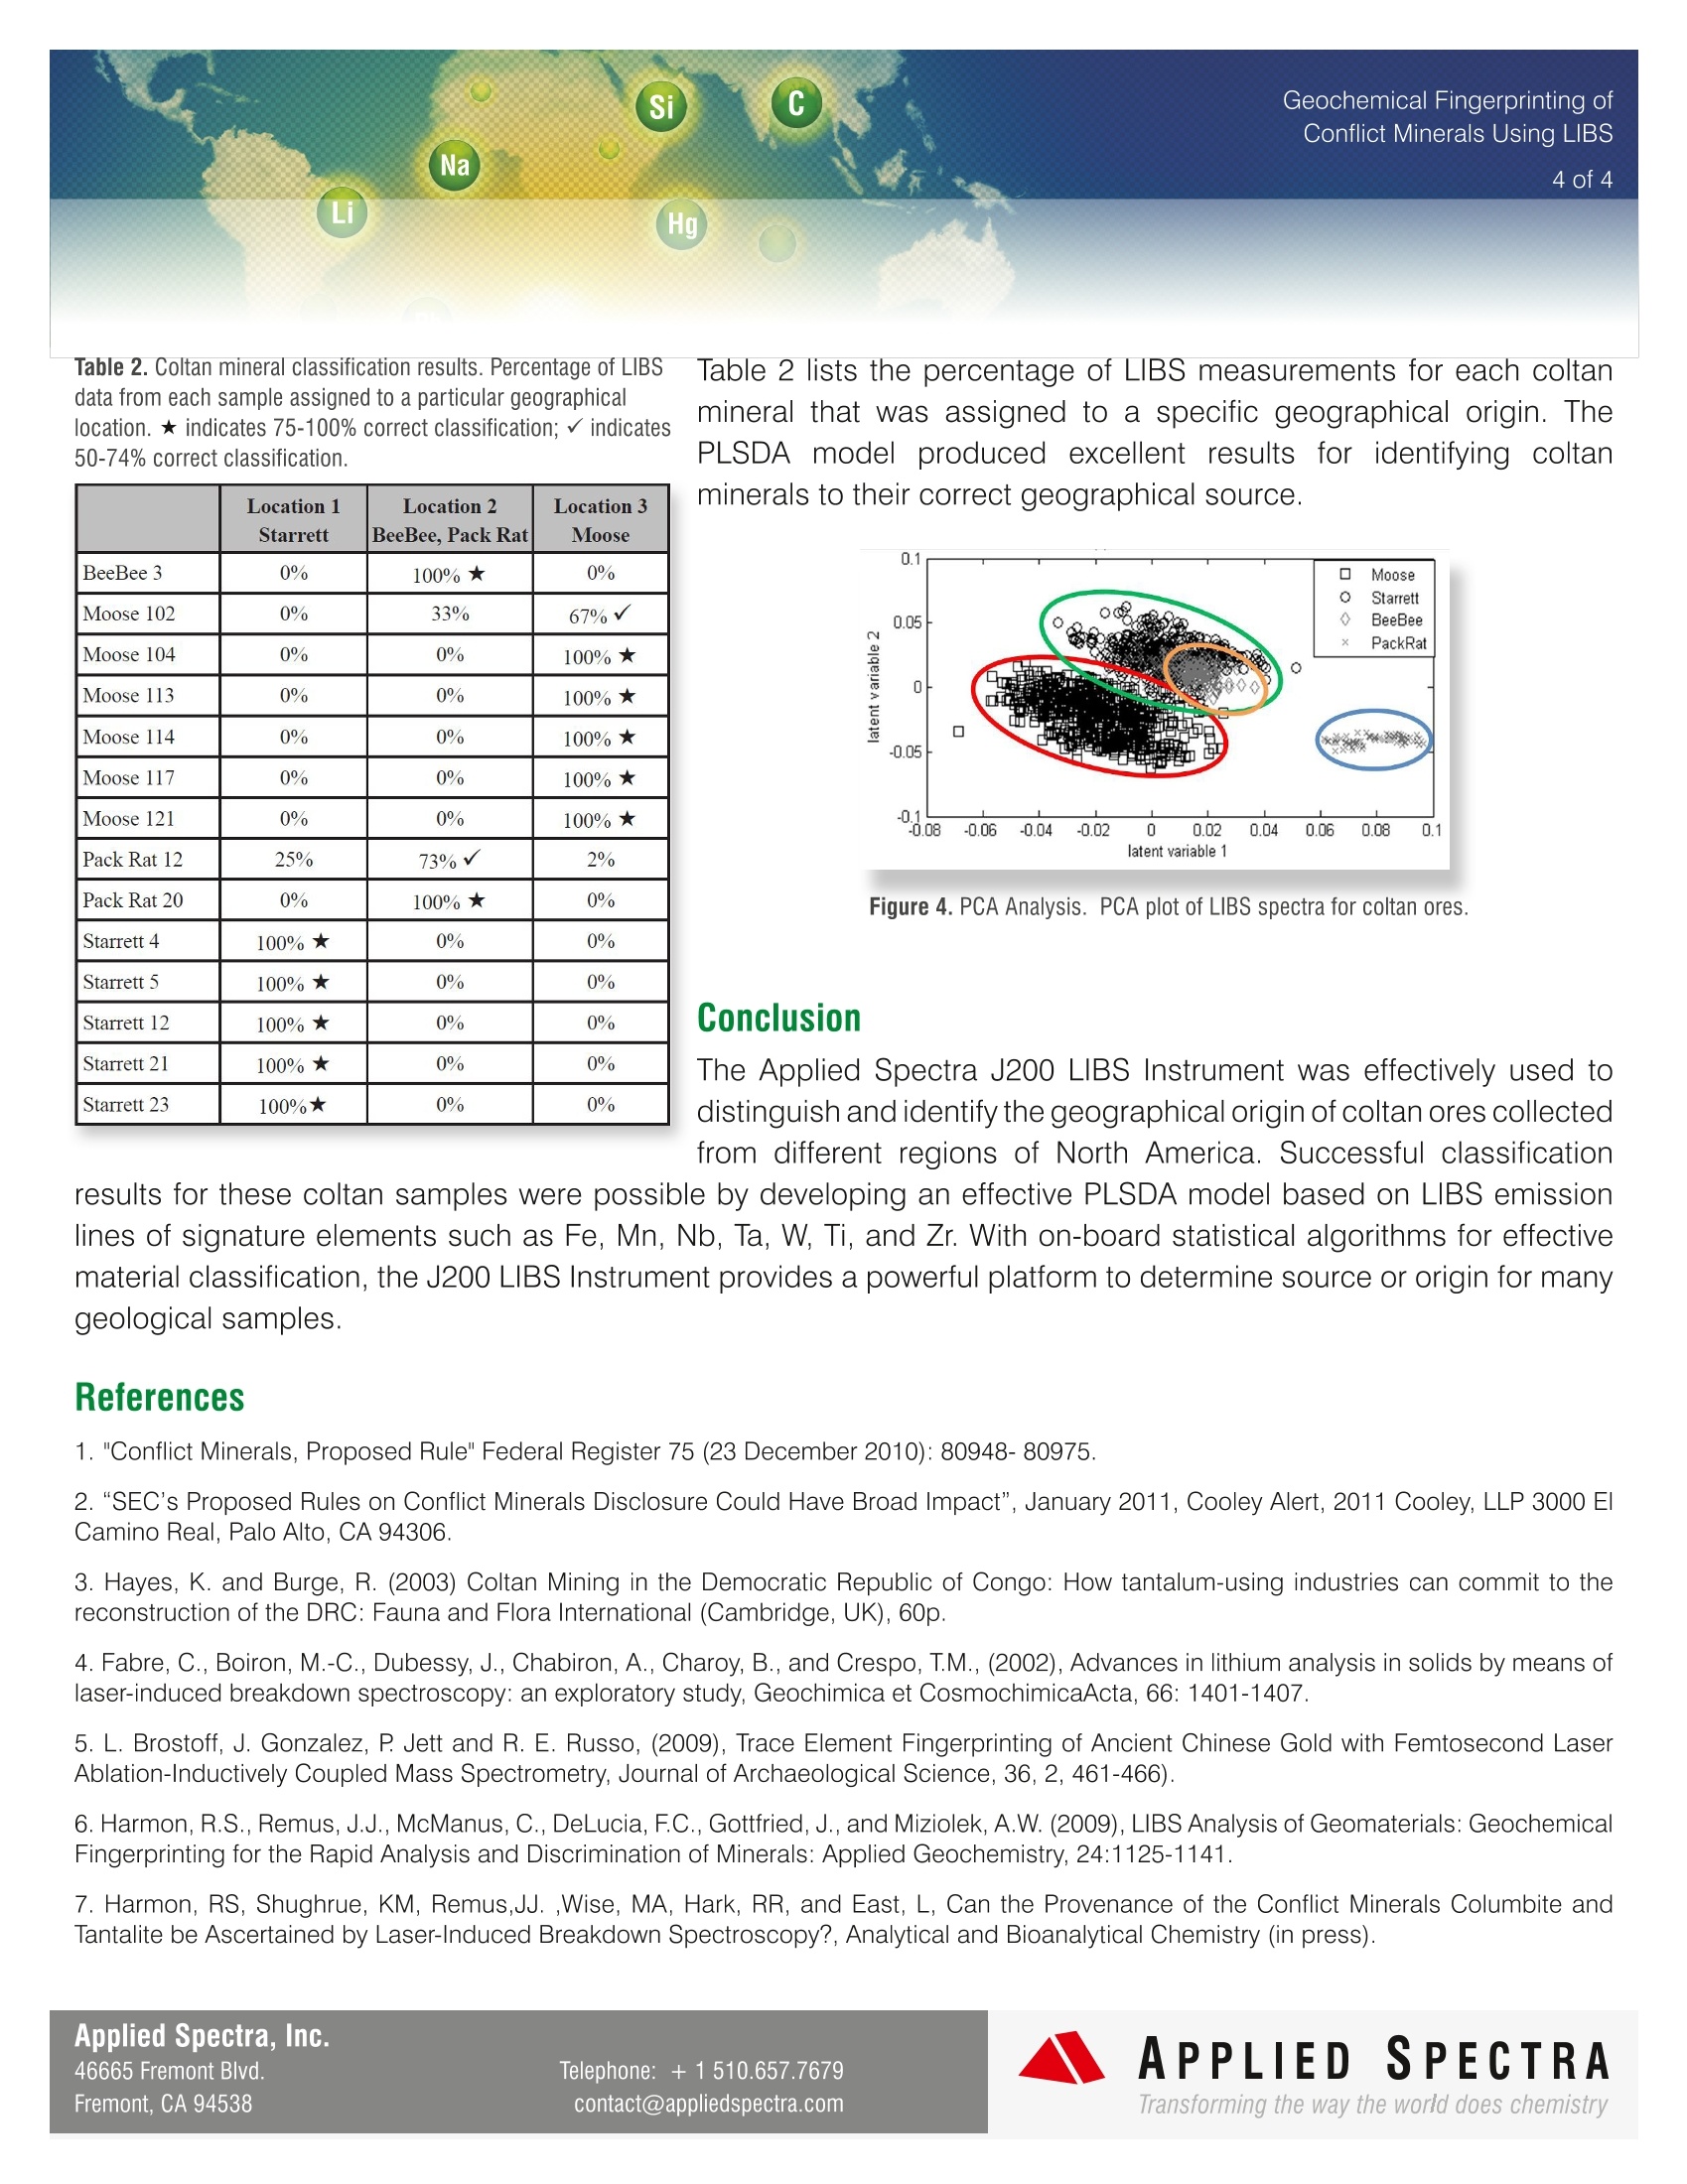
Geochemical Fingerprinting ofConflict Minerals Using LIBS2of4 Conflict minerals are minerals mined in areas of armedconflict or humanrights abuses. The United States' Dodd-Frank Wall Street Reform and Consumer Protection Act,signed into law in July 2010, requires manufacturers todisclose whether conflict minerals from the DemocraticRepublic of Congo (DRC) are used in their products [1-31. Conflict Minerals are used in a wide variety ofproducts, such as mobile: phones, laptops,medical devices, and jewelry. All companies that manufacture goods containing gold,tin, tungsten and tantalum are affected. These so-called“conflict minerals" are used in a wide variety of products,such as mobile phones, laptops, medical devices andjewelry. The rules require“reasonable inquiries" into the countryof origin of these rare earth metals and minerals. Fourmost commonly mined conflict minerals are cassiterite(for tin), wolframite (for tungsten), coltan (for tantalum),and gold ore. The electronic device manufacturers,whose products use elements from these minerals, maybe required to supply the country of origin information for source minerals. In many cases, tracing the supply chainback to the smelter facility can be extremely difficult andtime-consuming. LIBS (Laser Induced Breakdown Spectroscopy) haspreviously been used to determine chemical compositionin a number of geological materials, including silicates,carbonates and lithium [4-7]. Columbite-tantalite mineralores, also known as coltan, contain significant quantitiesof tantalum and niobium. Thisapplicationnotedescribes a rapidandenvironmentally friendly method for classifying thegeographical source of coltan mineral ores using AppliedSpectra's J200 LIBS Instrument. Operating Parameters Applied Spectra Inc.’s J200 LIBS Instrument 266 nm Nd:YAG laser (ns) and an ICCD detector (HP model) detector Applied Spectra Axiom Software FlexTM sample chamber Coltan samples collected from three granite pegmatite fields in NorthAmerica: Set 1 - Starret pegmatite in central Maine, U.S.Set 2- Pack Rat and Beebe Hole pegmatite fields of San Diego Count, CA, U.S. Set 3- Moose pegmatite in Northwest Territories, Canada. Sample Analysis The characteristic LIBS spectra for the coltan ore was obtained using the J200 LIBS Instrument (HP model) with a 2x 2 sampling grid pattern. The spacing between each sampling location was 0.5 mm (Figure 1). Forty laser pulses were applied at each location on the sample. The first fifteen laser pulses at each location wereused to self-clean the surface of the ore. The spectra from the remaining 25 laser shots were averaged for analysis. 0 Shots Collected DDGLD DA026 Figure 1. J200 LIBS Instrument Axiom Software GUI showing high resolution sample image and measured LIBS spectrum. Green dots indicate the locations oflaser sampling. Applied Spectra, Inc.46665 Fremont Blvd.Fremont, CA 94538 ( Telephone : +1510.657.7679contact@ap pli edspectra.com ) Data were taken in the spectral range from 250 to 490 nm (Figure 3) to include LIBS emission lines associated withsignature elements associated with coltan minerals. Emission wavelengths of these elements are shown in Table 1. Figure 2. Identification of tantalum (Ta) peak ID is performed by TruLIBSTM database. Table 1.Key elements for coltan minerals and their emission lines. Element Wavelength,(nm) Fe 274.65.275.57.274.95 Mn 257.61,259.37.260.57 Nb 309.42,405.89.313.08 Ta 266.57,268.52.284.45 W 248.88.2257.93,257.22 Ti 334.94,376.13,375.93 Zr 343.82.小339.20.327.31 Figure 3. Representative LIBS spectra in the spectral rangefrom 250 to 490 nm for coltan samples from three locations. Chemometric analysis was performed on the LIBS spectra to produce the cluster plot and sample classificationresult. Partial Least Square Discriminant Analysis (PLSDA) was the statistical method used to discriminate amongcoltan ores of different geographic origins. Figure 4 shows the PCA plot. An individual point in the figure is theprojection of each of 100 LIBS spectra collected per sample. The 2D PCA plot shows that most of the within-classspectra cluster together, with only a single substantial outlier for the Pack Rat/Beebe samples. The classification study used a leave-one-sample-out (LOSO) cross-validation approach. The spectra from the ithsample are held out of the training data for the classification sample library. This ith sample was then used as the testdata. Only four PLSDA components were needed to achieve near perfect classification of tested coltan samples intothe correct group. Applied Spectra, Inc.46665 Fremont Blvd.Telephone: +1510.657.7679APPLIED SPECTRAFremont, CA 94538contact@appliedspectra.comTransforming the way the world does chemistry Table 2. Coltan mineral classification results. Percentage of LIBSdata from each sample assigned to a particular geographicallocation. ★ indicates 75-100% correct classification;√indicates50-74% correct classification. Table 2 lists the percentage of LIBS measurements for each coltanmineral that was assigned to a specific geographical origin. ThePLSDA model produced excellent results for identifying coltanminerals to their correct geographical source. Location 1 Starrett Location 2 BeeBee, Pack Rat Location 3Moose BeeBee3 0% 100%★ 0% Moose 102 0% 33% 67%√ Moose 104 0% 0% 100%★ Moose 113 0% 0% 100%★ Moose 114 0% 0% 100%★ Moose 117 0% 0% 100%★ Moose 121 0% 0% 100%★ Pack Rat 12 25% 73%√ 2% Pack Rat 20 0% 100%★ 0% Starrett 4 100%★ 0% 0% Starrett 5 100%★ 0% 0% Starrett 12 100%★ 0% 0% Starrett 21 100%★ 0% 0% Starrett 23 100%★ 0% 0% Figure 4. PCA Analysis. PCA plot of LIBS spectra for coltan ores. Conclusion The Applied Spectra J200 LIBS Instrument was effectively used todistinguish and identify the geographical origin of coltan ores collectedfrom different regions of North America. Successful classification results for these coltan samples were possible by developing an effective PLSDA model based on LIBS emissionlines of signature elements such as Fe, Mn, Nb, Ta, W, Ti, and Zr. With on-board statistical algorithms for effectivematerial classification, the J200 LIBS Instrument provides a powerful platform to determine source or origin for manygeological samples. References ( 1. " Conflict Minerals , Proposed Rule" Federal Register 75 (23 December 2010): 80948-80975. ) 2. “SEC's Proposed Rules on Conflict Minerals Disclosure Could Have Broad Impact", January 2011, Cooley Alert, 2011 Cooley, LLP 3000 ElCamino Real, Palo Alto, CA 94306. ( 3. Hayes, K . a nd Burge, R . (2003) C o ltan M i ning in the Democratic Re p ublic of Co n go: How tantalum-using indus t ries can c ommit to thereconstruction of the DRC: Fauna and Flora International (Cambridge, UK ) , 60 p . ) ( 4. Fabre,C., B o iron, M.-C., Dubessy, J., Chabiron, A., Charoy, B., and C respo, T.M., ( 2 0 02) , Advanc e s in lithium a nalysis in solids by means oflaser-induced breakdown spectroscopy: an exploratory study, Geochimica et CosmochimicaActa,66:14 0 1-14 0 7. ) ( 5. L. Brostoff, J. Gonzalez , P. Jett a n d R . E. Russo, (2009 ) , Tra c e Element Fingerprinti n g of Ancient Chinese Gol d with Femtosecond L aserAblation-Inductively Coupled Mass Spectrometry, Journal of Archaeological Science, 3 6, 2, 461-466). ) ( 6. Harmon,R.S.,Re m us,J.J., McManus, C.,De L ucia, F.C., G ottfried,J.,and Mizio l ek,A.W. ( 2009), LIBS A nalysis of Geomaterials: GeochemicalFingerprinting for the Rapid Analysis and Discrimination of Minerals: Applied Geochemistry, 24:1125-11 41 . ) 7. Harmon, RS, Shughrue, KM, Remus,JJ. ,Wise, MA, Hark, RR, and East, L, Can the Provenance of the Conflict Minerals Columbite andTantalite be Ascertained by Laser-Induced Breakdown Spectroscopy?, Analytical and Bioanalytical Chemistry (in press). Applied Spectra, Inc.46665 Fremont Blvd.Telephone: +1510.657.7679APPLIEDSPECTRAFremont, CA 94538contact@appliedspectra.comTransforming the way the world does chemistry APPLIEDSPECTRAwww.AppliedSpectra.comTransforming the way the world does chemistry 测量所得数据通过化学分析软件,得到分布图和 分类结果。偏最小二乘法鉴定分析(plsda)用于 辨别不同钶钽铁矿石的来源地。Figure 3 是 PCA scatter plots。图中的每个点都是单个光谱的投影, 每个样品有 100 个光谱。从此表可以看出,除了 两个点,其他点都在同类光谱团内。 采用 LOSO 交叉验证法进行分类研究。Table 2 列 出了而每个样品属于每个分类的几率。从表出可 以看出,分类准确率达到了 100%。 Figure 3. 主成分分析.Table 2. 样品分类结果.
确定
还剩2页未读,是否继续阅读?

产品配置单

北京富尔邦科技发展有限责任公司为您提供《矿石中多元素检测方案(激光诱导击穿)》,该方案主要用于其他中多元素检测,参考标准--,《矿石中多元素检测方案(激光诱导击穿)》用到的仪器有美国ASI 激光诱导击穿光谱仪(LIBS)
推荐专场
相关方案
更多
该厂商其他方案
更多