


方案详情
文
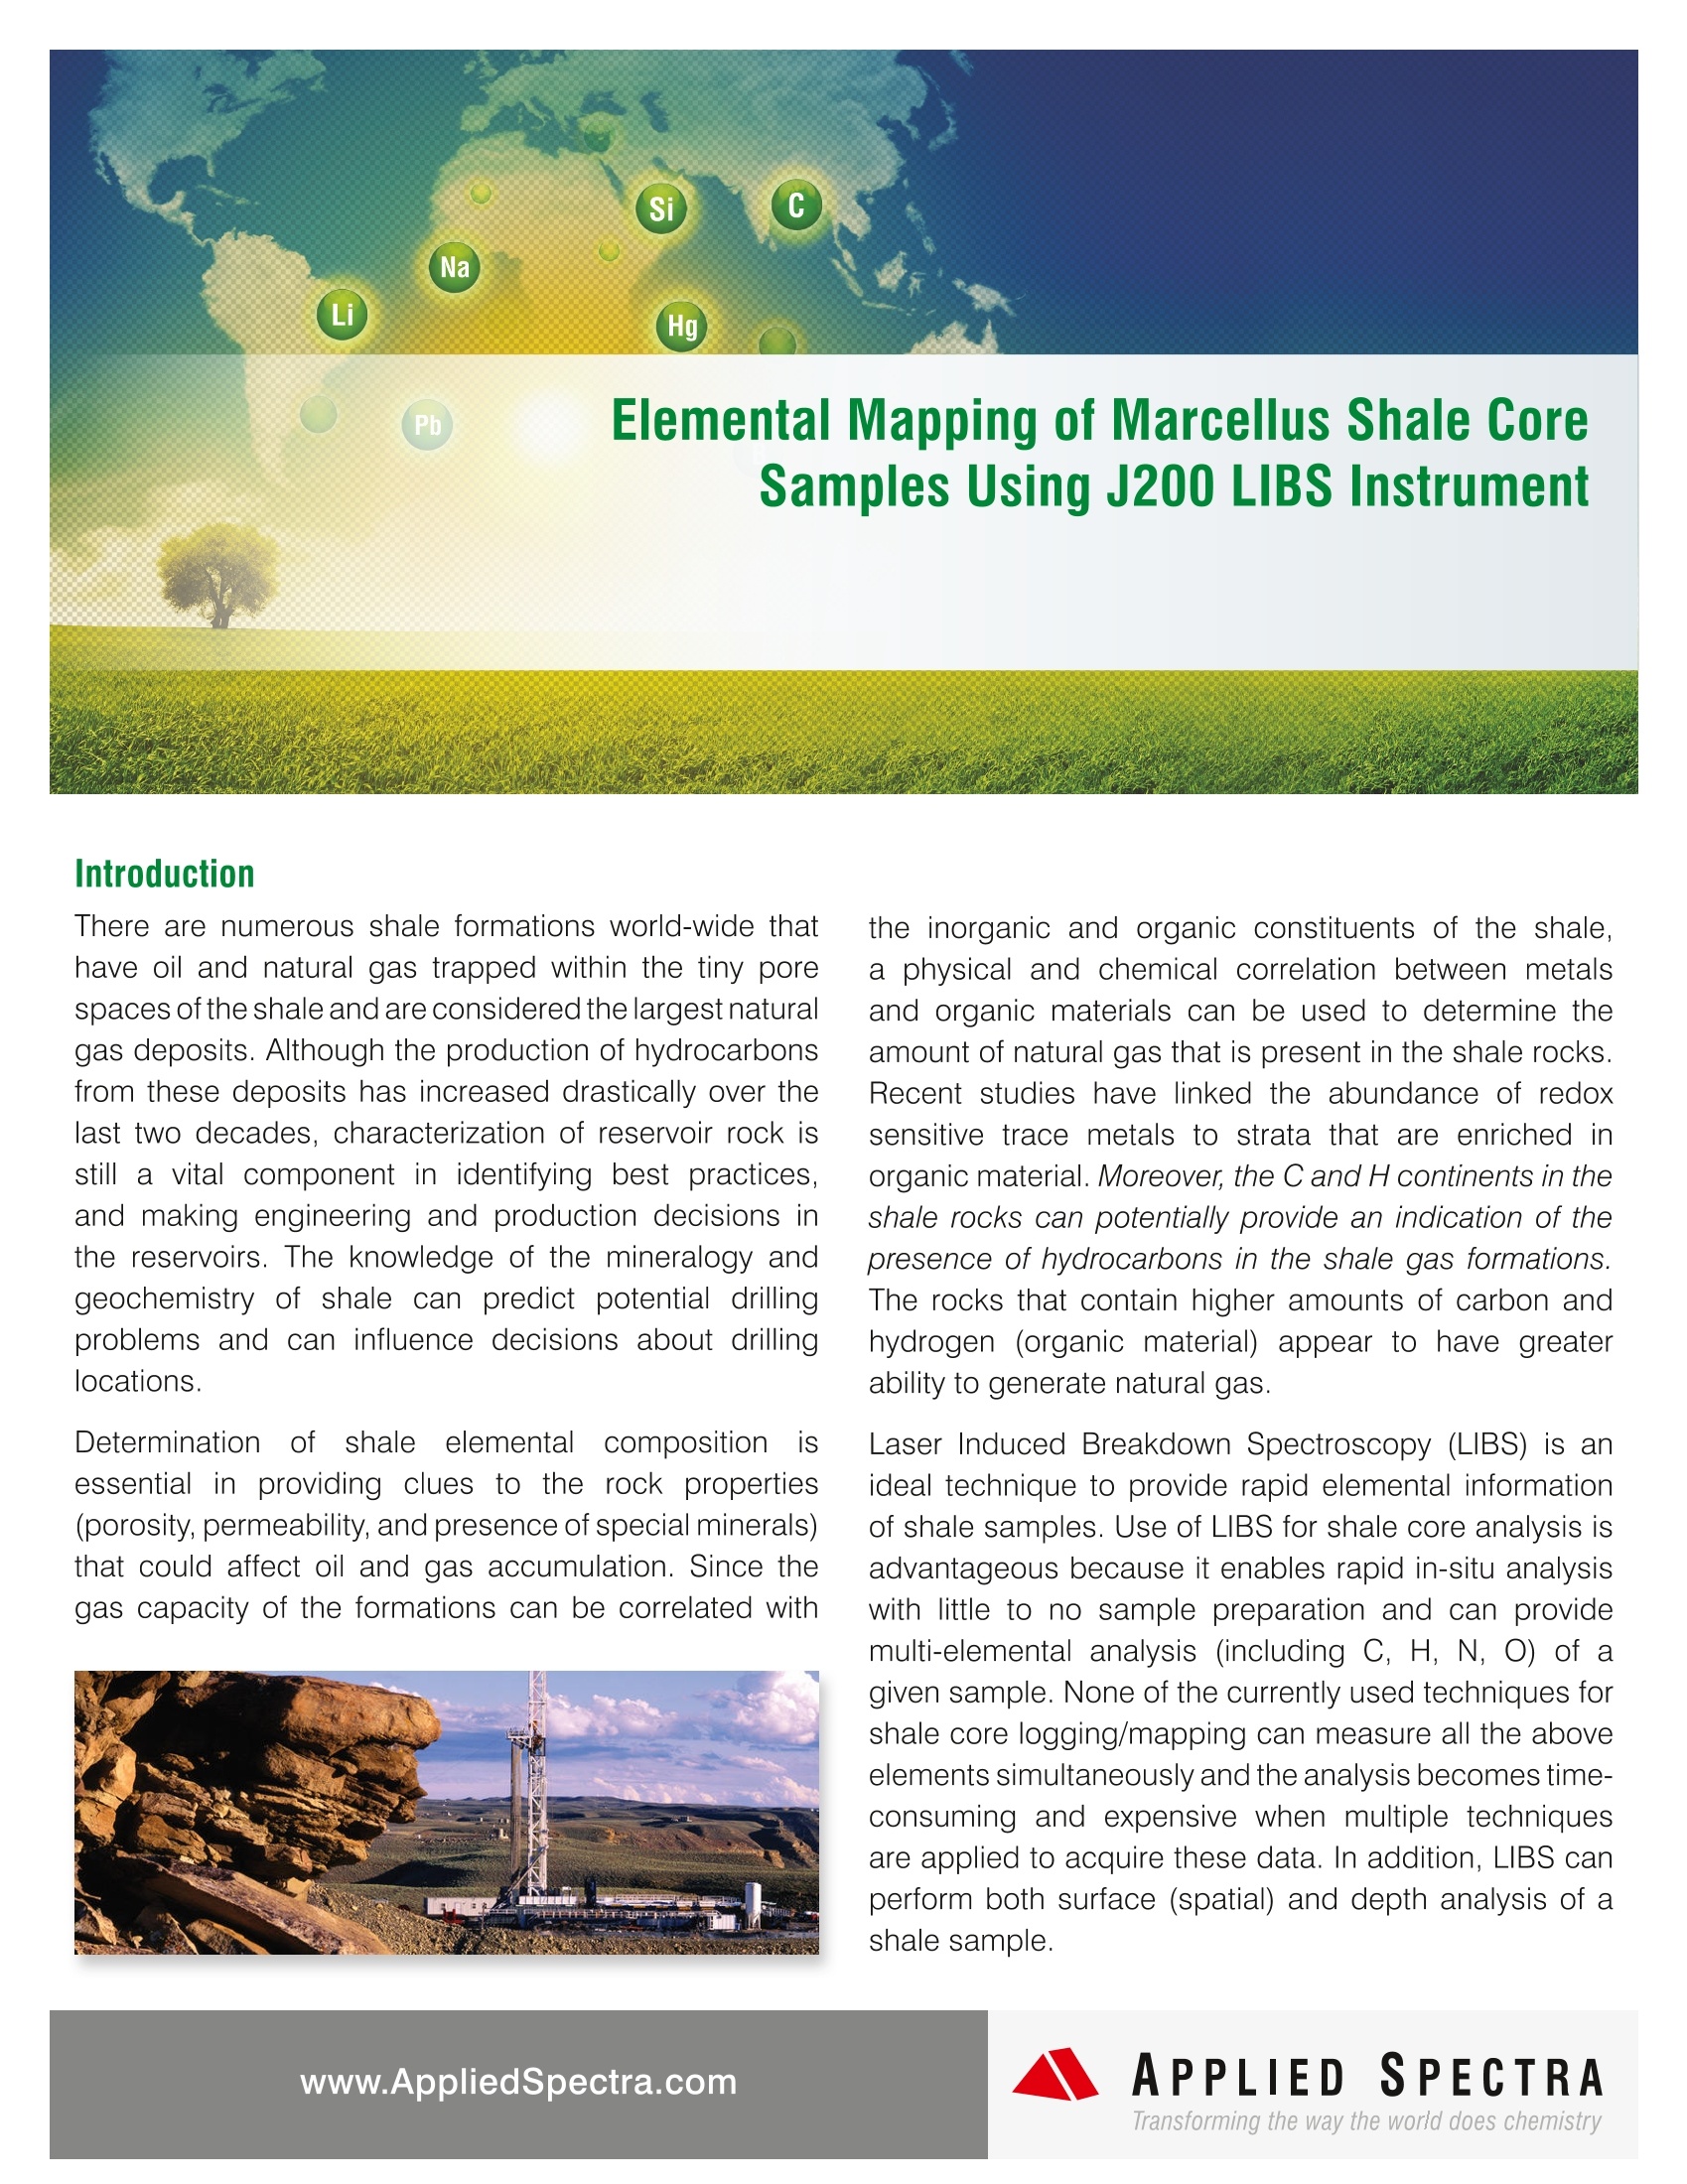
世界范围内存在许多页岩地层,页岩的微小孔隙中蕴藏着石油和天然气,被认为是天然气储存场所。尽管在过去的两年里,该场所产生的烃急剧增长,储集岩表征仍然在识别实践、在储层中做出工程和生产决策中发挥重要作用。页岩矿物学和地球化学方面的知识可以帮助人们预测潜在的钻井问题,并影响钻井的位置。
测定页岩元素成分非常重要,能帮助人们分析影响油气成藏的岩石性质(孔隙度、渗透率以及特殊矿物存在度)。地层的气体容量与页岩的无机和有机组分有关,因此,可以利用金属和有机材料之间的物理和化学相关性来测定页岩中的天然气含量。最近的研究表明,氧化还原敏感痕量金属的丰富度与富含有机物的地层有关。此外,页岩中的C、H元素表明页岩地层中可能存在烃类。对于岩石来说,含有C、H(有机物)越多,产生的天然气就越多。
激光诱导击穿光谱技术(简称LIBS系统)具有理想的分析技术,能够快速分析页岩样品的元素信息。利用LIBS分析页岩核心样品非常有利,因为该系统具有快速原位分析能力,几乎无需制样,且能提供为特定样品进行多元素分析(包括C、H、N、O元素)。目前使用的用于页岩岩心测井、制图的技术不能同时测量上述所有元素,如果利用多种技术来获取元素数据时,分析过程则变得费时费力。此外,LIBS系统能对页岩样品进行表面(空间)和深度分析。
方案详情

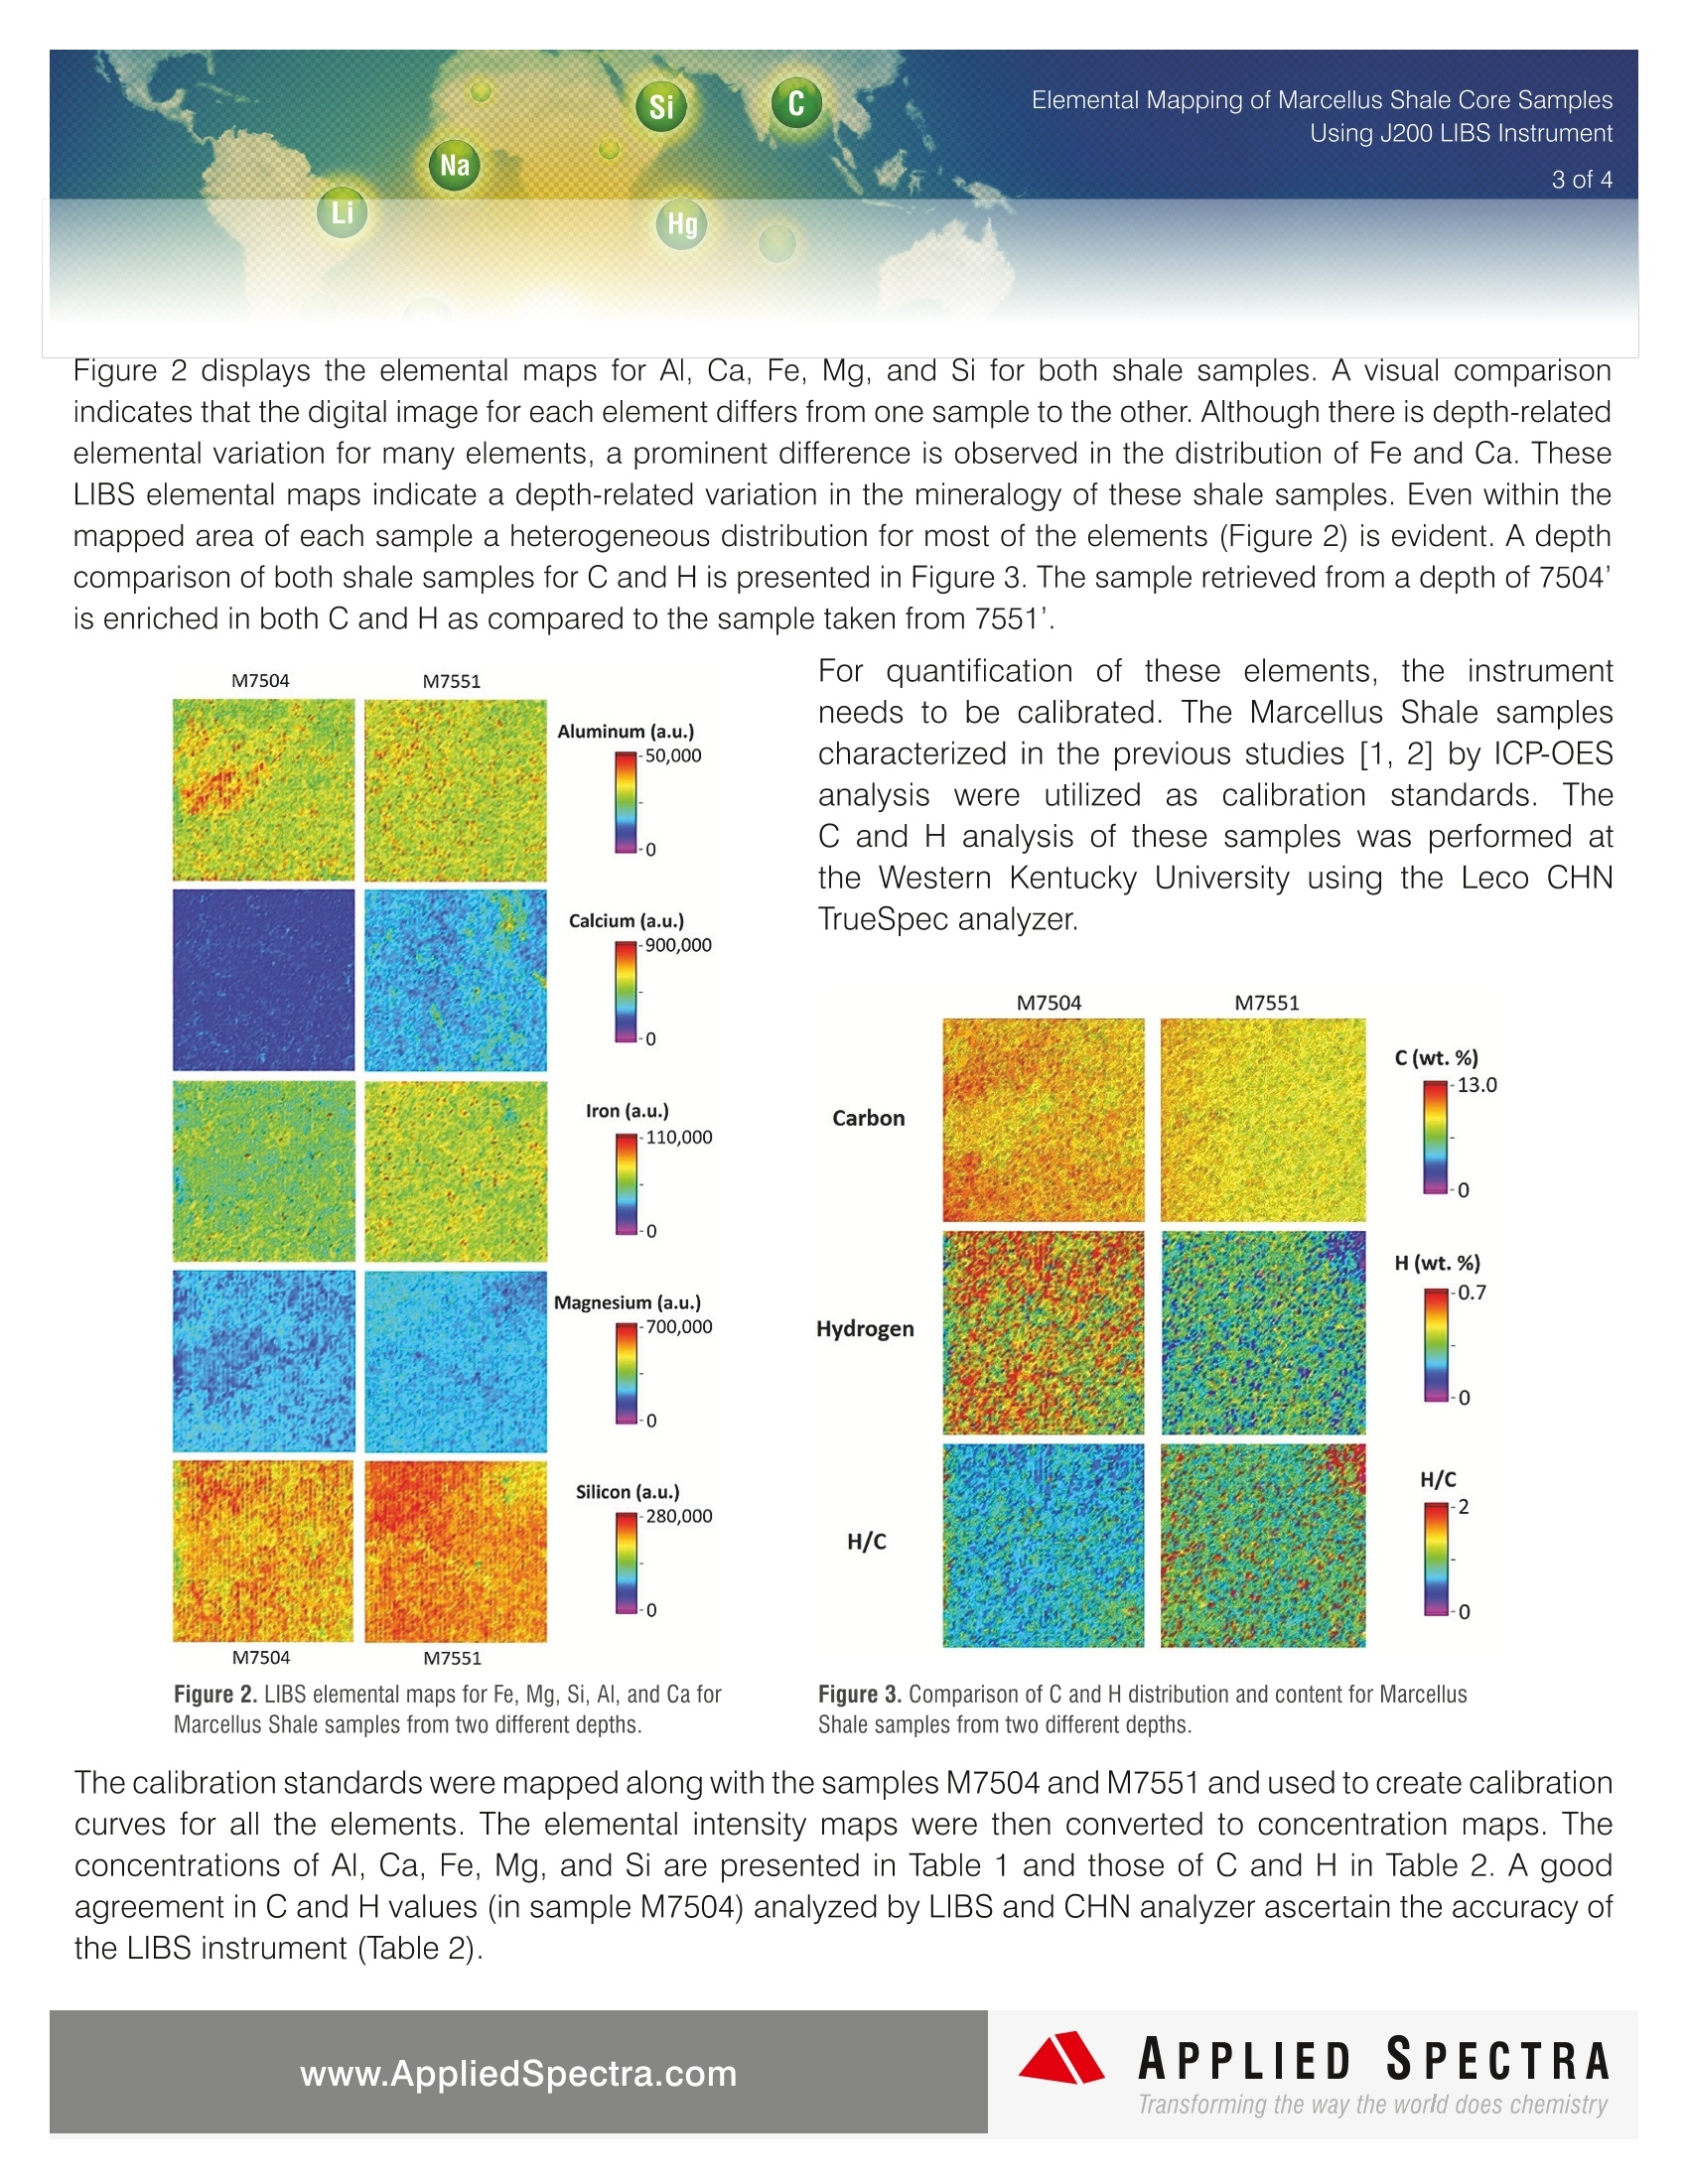
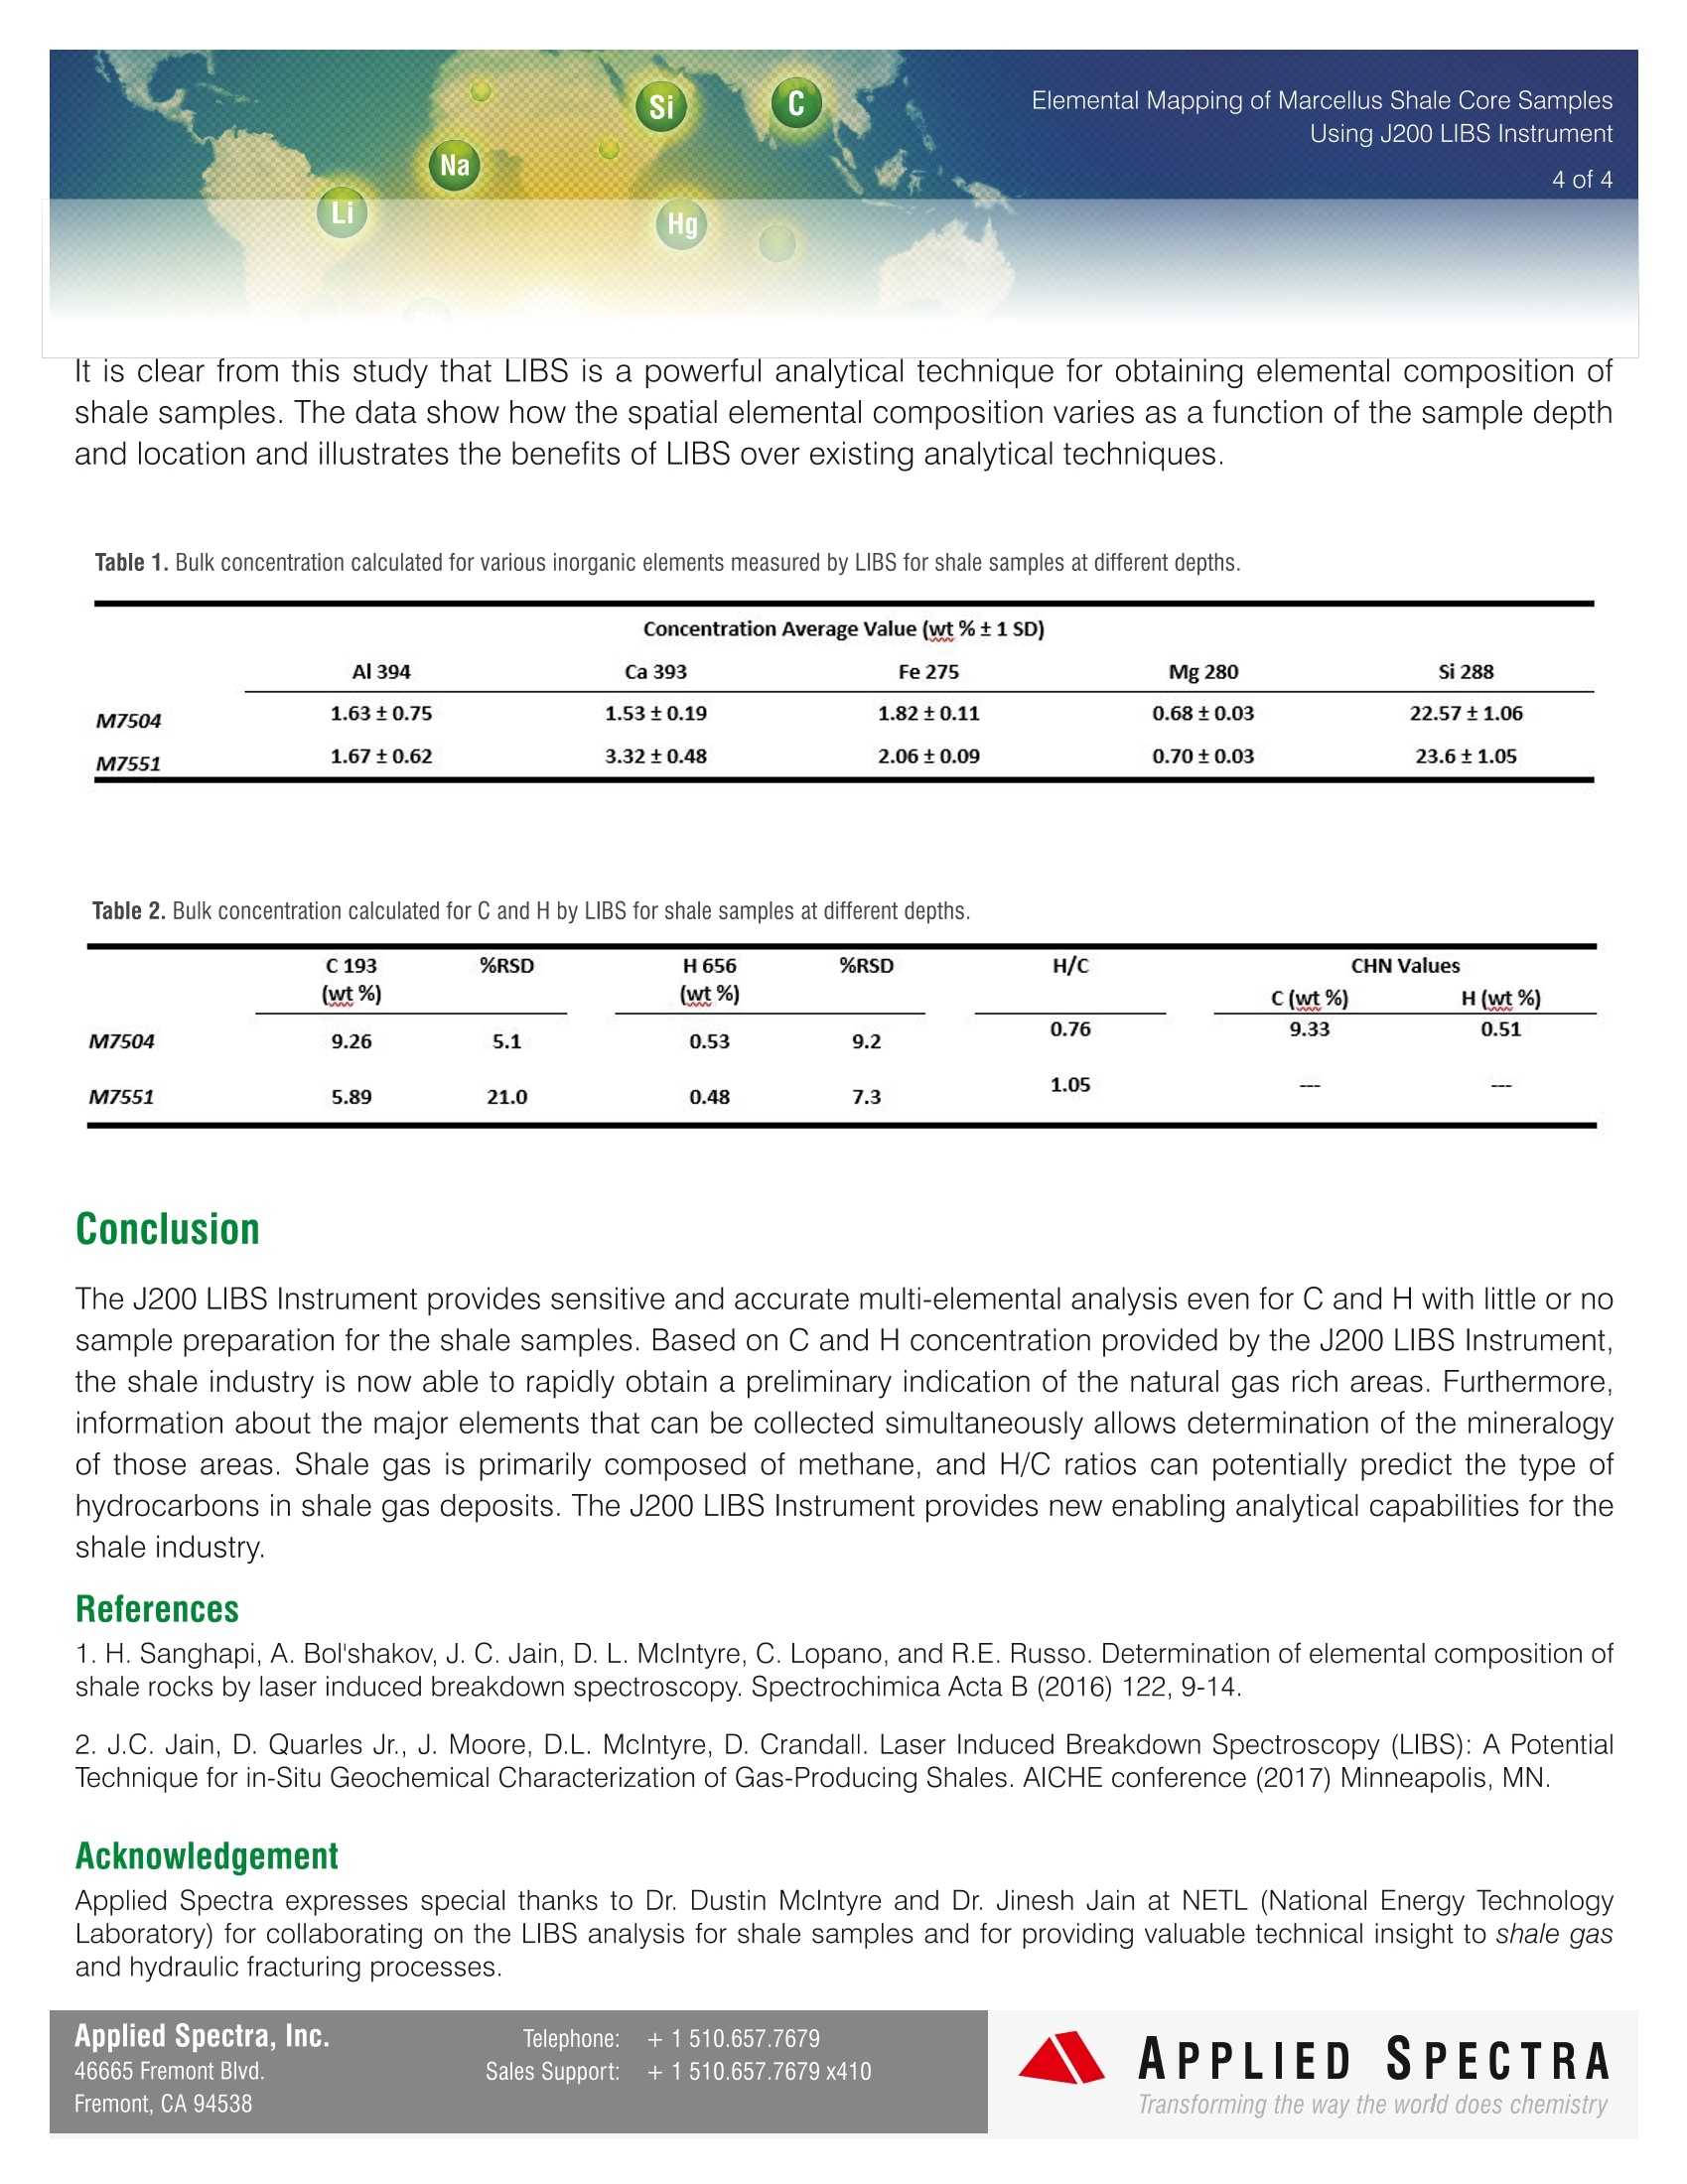
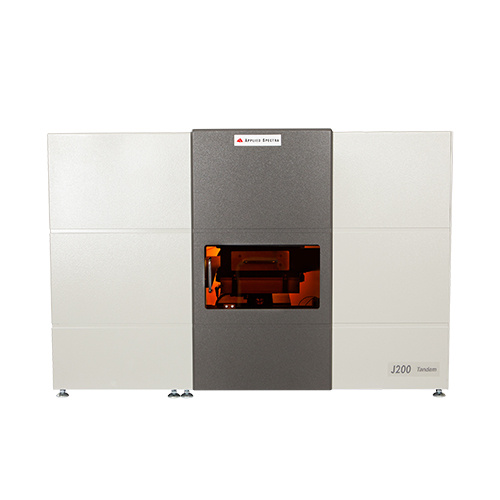
Si C Na Li Hg Pb Elemental Mapping of Marcellus Shale CoreSamples Using J200 LIBS Instrument There are numerous shale formations world-wide thathave oil and natural gas trapped within the tiny porespaces of the shale and are considered the largest naturalgas deposits. Although the production of hydrocarbonsfrom these deposits has increased drastically over thelast two decades, characterization of reservoir rock isstill a vital component in identifying best practices,and making engineering and production decisions inthe reservoirs. The knowledge of the mineralogy andgeochemistry of shale can predict potential drillingproblems and can influence decisions about drillinglocations. Determinationof shale elemental composition ISessential in providing clues to the rock properties(porosity, permeability, and presence of special minerals)that could affect oil and gas accumulation. Since thegas capacity of the formations can be correlated with the inorganic and organic constituents of the shale,a physical and chemical correlation between metalsand organic materials can be used to determine theamount of natural gas that is present in the shale rocks.Recent studies have linked the abundance of redoxsensitive trace metals to strata that are enriched inorganic material. Moreover, the C and H continents in theshale rocks can potentially provide an indication of thepresence of hydrocarbons in the shale gas formations.The rocks that contain higher amounts of carbon andhydrogen (organic material) appear to have greaterability to generate natural gas. Laser Induced Breakdown Spectroscopy (LIBS) is anideal technique to provide rapid elemental informationof shale samples. Use of LIBS for shale core analysis isadvantageous because it enables rapid in-situ analysiswith little to no sample preparation and can providemulti-elemental analysis (including C, H, N, O) of agiven sample. None of the currently used techniques forshale core logging/mapping can measure all the aboveelements simultaneously and the analysis becomes time-consuming and expensive when multiple techniquesare applied to acquire these data. In addition, LIBS canperform both surface (spatial) and depth analysis of ashale sample. We highlight below the use of the J200 LIBS Instrument with multi-channel broadband CCD detector to rapidlydetermine the spatial variation of both organic and inorganic elements across the Marcellus Shale section. Thisstudy demonstrates effectiveness of LIBS to perform in-situ chemical characterization of shale samples from differentdepths. Operating Parameters Applied Spectra J200 LIBS Instrument 2266 nm Nd:YAG laser (ns) and broadband CCD detector (EC model) ● Applied Spectra Axiom operation software for instrument operationcontrol ● FlexM sample chamber (measurement in air) 50 um laser spot size . 81 x81 grid pattern map over 8 x 8 mm (64 mm?) analyzed area 5 shots per location- accumulated.Clarity LIBS software for elemental mapping Applied Spectra J200 LIBS Instrument Sample Analysis In this study, two Marcellus Shale samples taken from a gas well at a depth of 7504 and 7551 feet were analyzedusing Applied Spectra's J200 LIBS Instrument. An 8 mm x 8 mm area was mapped in both cases. Several elementssuch as Al, Ba, C, Ca, Fe, H, K, Mg, Na, O, Si, Sr, and Ti were detected and the LIBS data collected for some of theelements were used to construct 2D elemental maps for each sample. A representative map for Al corresponding tothe scanned area is indicated in Figure 1. Figure 1. Representative LIBS Al map for Marcellus shale sample. Figure 2 displays the elemental maps for Al, Ca, Fe, Mg, and Si for both shale samples. A visual comparisonindicates that the digital image for each element differs from one sample to the other. Although there is depth-relatedelemental variation for many elements, a prominent difference is observed in the distribution of Fe and Ca. TheseLIBS elemental maps indicate a depth-related variation in the mineralogy of these shale samples. Even within themapped area of each sample a heterogeneous distribution for most of the elements (Figure 2) is evident. A depthcomparison of both shale samples for C and H is presented in Figure 3.The sample retrieved from a depth of 7504'is enriched in both C and H as compared to the sample taken from 7551'. For quantification of these elements, the instrumentneeds to be calibrated. The Marcellus Shale samplescharacterized in the previous studies [1, 2] by ICP-OESanalysis were utilized as calibration standards. TheC and H analysis of these samples was performed atthe Western Kentucky University using the Leco CHNTrueSpec analyzer. Figure 2. LIBS elemental maps for Fe, Mg, Si, Al, and Ca forMarcellus Shale samples from two different depths. Figure 3. Comparison of C and H distribution and content for MarcellusShale samples from two different depths. The calibration standards were mapped along with the samples M7504 and M7551 and used to create calibrationcurves for all the elements. The elemental intensity maps were then converted to concentration maps. Theconcentrations of Al, Ca, Fe, Mg,and Si are presented in Table 1 and those of C and H in Table 2. A goodagreement in C and H values (in sample M7504) analyzed by LIBS and CHN analyzer ascertain the accuracy ofthe LIBS instrument (Table 2). It is clear from this study that LIBS is a powerful analytical technique for obtaining elemental composition ofshale samples. The data show how the spatial elemental composition varies as a function of the sample depthand location and illustrates the benefits of LIBS over existing analytical techniques. Table 1. Bulk concentration calculated for various inorganic elements measured by LIBS for shale samples at different depths. Concentration Average Value (wt%±1SD) Al 394 Ca 393 Fe 275 Mg 280 Si 288 M7504 1.63±0.75 1.53±0.19 1.82±0.11 0.68±0.03 22.57±1.06 M7551 1.67±0.62 3.32±0.48 2.06±0.09 0.70±0.03 23.6±1.05 Table 2. Bulk concentration calculated for C and H by LIBS for shale samples at different depths. C 193 %RSD H 656 %RSD H/C CHN Values (wt%) (wt%) C (wt%) H (wt %) M7504 9.26 5.1 0.53 9.2 0.76 9.33 0.51 M7551 5.89 21.0 0.48 7.3 1.05 Conclusion The J200 LIBS Instrument provides sensitive and accurate multi-elemental analysis even for C and H with little or nosample preparation for the shale samples. Based on C and H concentration provided by the J200 LIBS Instrument,the shale industry is now able to rapidly obtain a preliminary indication of the natural gas rich areas. Furthermore,information about the major elements that can be collected simultaneously allows determination of the mineralogyof those areas. Shale gas is primarily composed of methane, and H/C ratios can potentially predict the type ofhydrocarbons in shale gas deposits. The J200 LIBS Instrument provides new enabling analytical capabilities for theshale industry. References 1. H. Sanghapi,A. Bol'shakov, J. C. Jain, D. L. Mclntyre, C. Lopano, and R.E. Russo. Determination of elemental composition ofshale rocks by laser induced breakdown spectroscopy. Spectrochimica Acta B (2016) 122, 9-14. 2. J.C. Jain, D. Quarles Jr., J. Moore, D.L. Mclntyre, D. Crandall. Laser Induced Breakdown Spectroscopy (LIBS): A PotentialTechnique for in-Situ Geochemical Characterization of Gas-Producing Shales. AICHE conference (2017) Minneapolis, MN. Acknowledgement Applied Spectra expresses special thanks to Dr. Dustin Mclntyre and Dr. Jinesh Jain at NETL (National Energy TechnologyLaboratory) for collaborating on the LIBS analysis for shale samples and for providing valuable technical insight to shale gasand hydraulic fracturing processes. Applied Spectra, Inc.Telephone: +1510.657.767946665 Fremont Blvd.Sales Support:十+1510.657.7679 x410APPLIEDSPECTRAFremont, CA 94538 APPLIEDSPECTRAwww.AppliedSpectra.comTransforming the way the world does chemistry 此项研究利用J200激光光谱元素分析仪,对两个从深度为7504英尺和7551英尺的气井中采集的马塞勒斯页岩样品进行分析。并从两个样本中各选取8 mm x 8 mm的区域进行制图。探测到多个元素,如:Al, Ba, C, Ca, Fe, H, K, Mg, Na, O, Si, Sr, 以及Ti元素,针对某些元素收集的LIBS数据可以为各个样品制作2D元素分布图。图1表示扫描区的Al元素典型图。 两个不同深度的马塞勒斯页岩样品中Fe, Mg, Si, Al, 和Ca的LIBS元素图两种不同深度的马塞勒斯页岩样品中C、H元素的分布和含量比较
确定

还剩2页未读,是否继续阅读?

产品配置单

北京富尔邦科技发展有限责任公司为您提供《马塞勒斯页岩中元素及元素分布检测方案(激光诱导击穿)》,该方案主要用于非金属矿产中元素及元素分布检测,参考标准--,《马塞勒斯页岩中元素及元素分布检测方案(激光诱导击穿)》用到的仪器有美国ASI 激光诱导击穿光谱仪(LIBS)
推荐专场
相关方案
更多
该厂商其他方案
更多