


方案详情
文
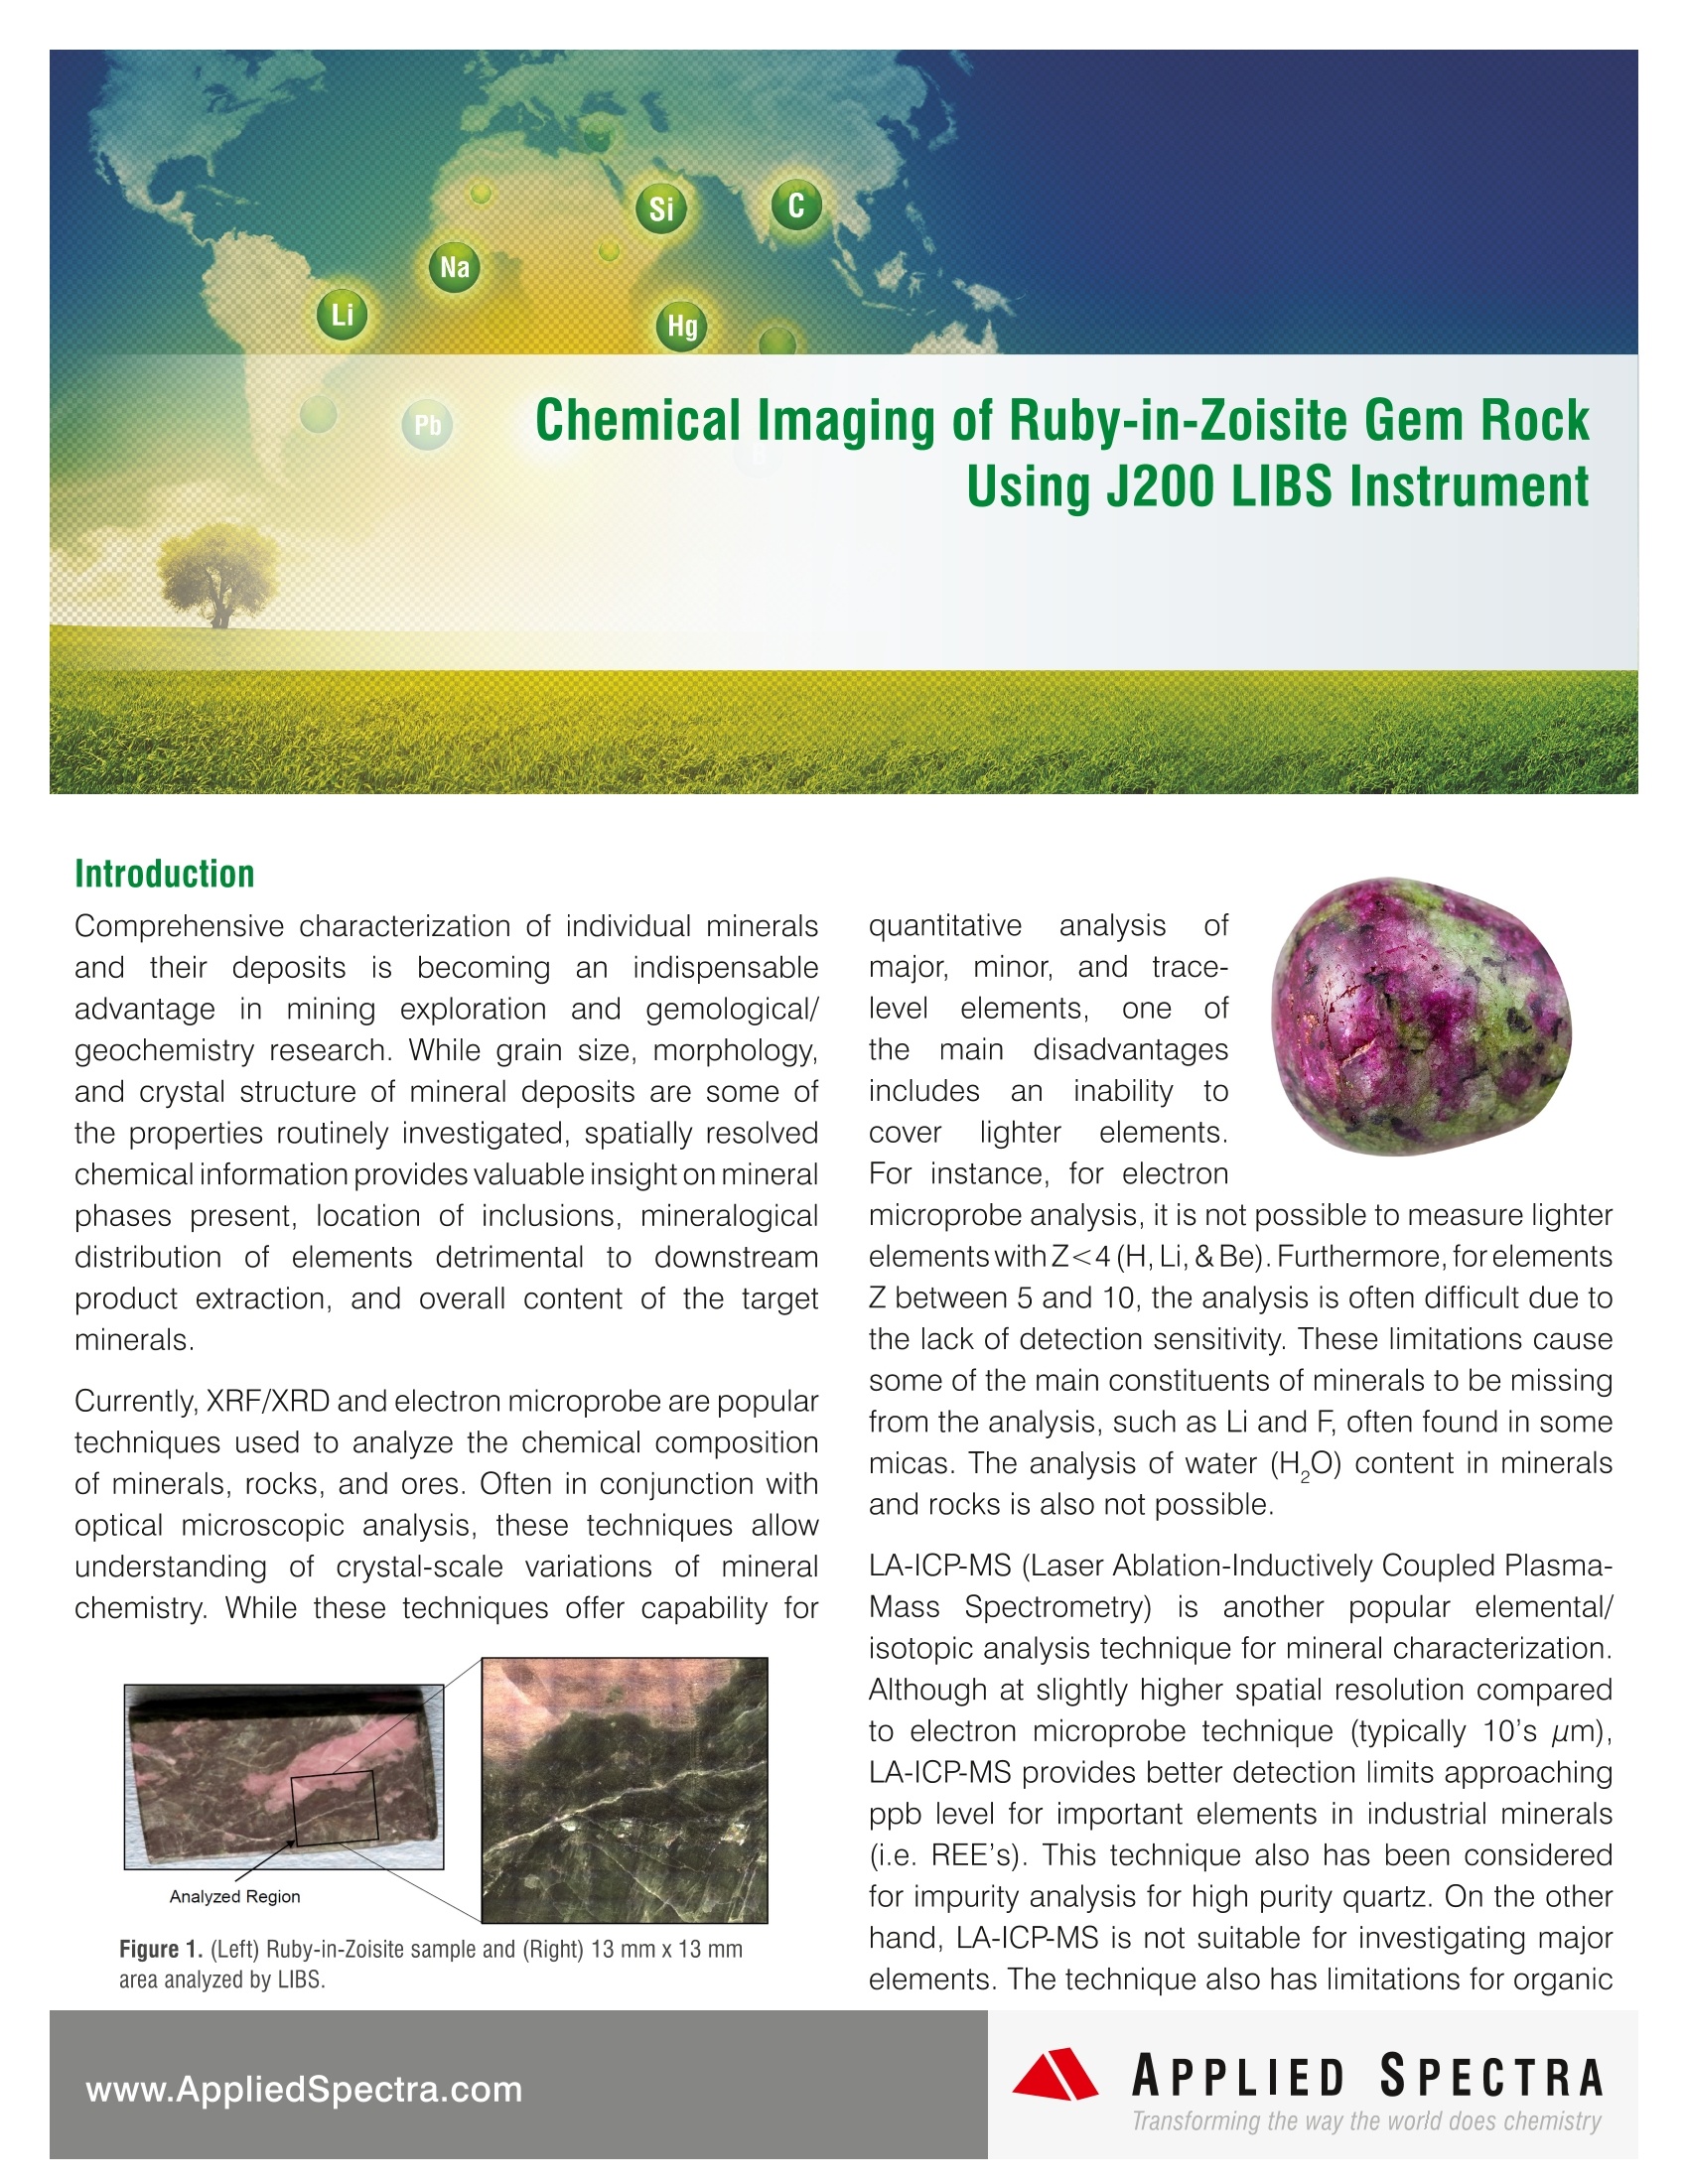
介绍了使用Applied Spectra的J200对红宝石-黝帘石岩石进行元素制图。LIBS揭示了元素如氢、氧、锂、钾、钠和镁的分布,而这些元素对于电子探针和其他基于x射线的技术来说是很难或完全不可能的。LIBS对分析区域内的主要红宝石、酸性晶体及其他组成矿物有较好的鉴别作用。
方案详情

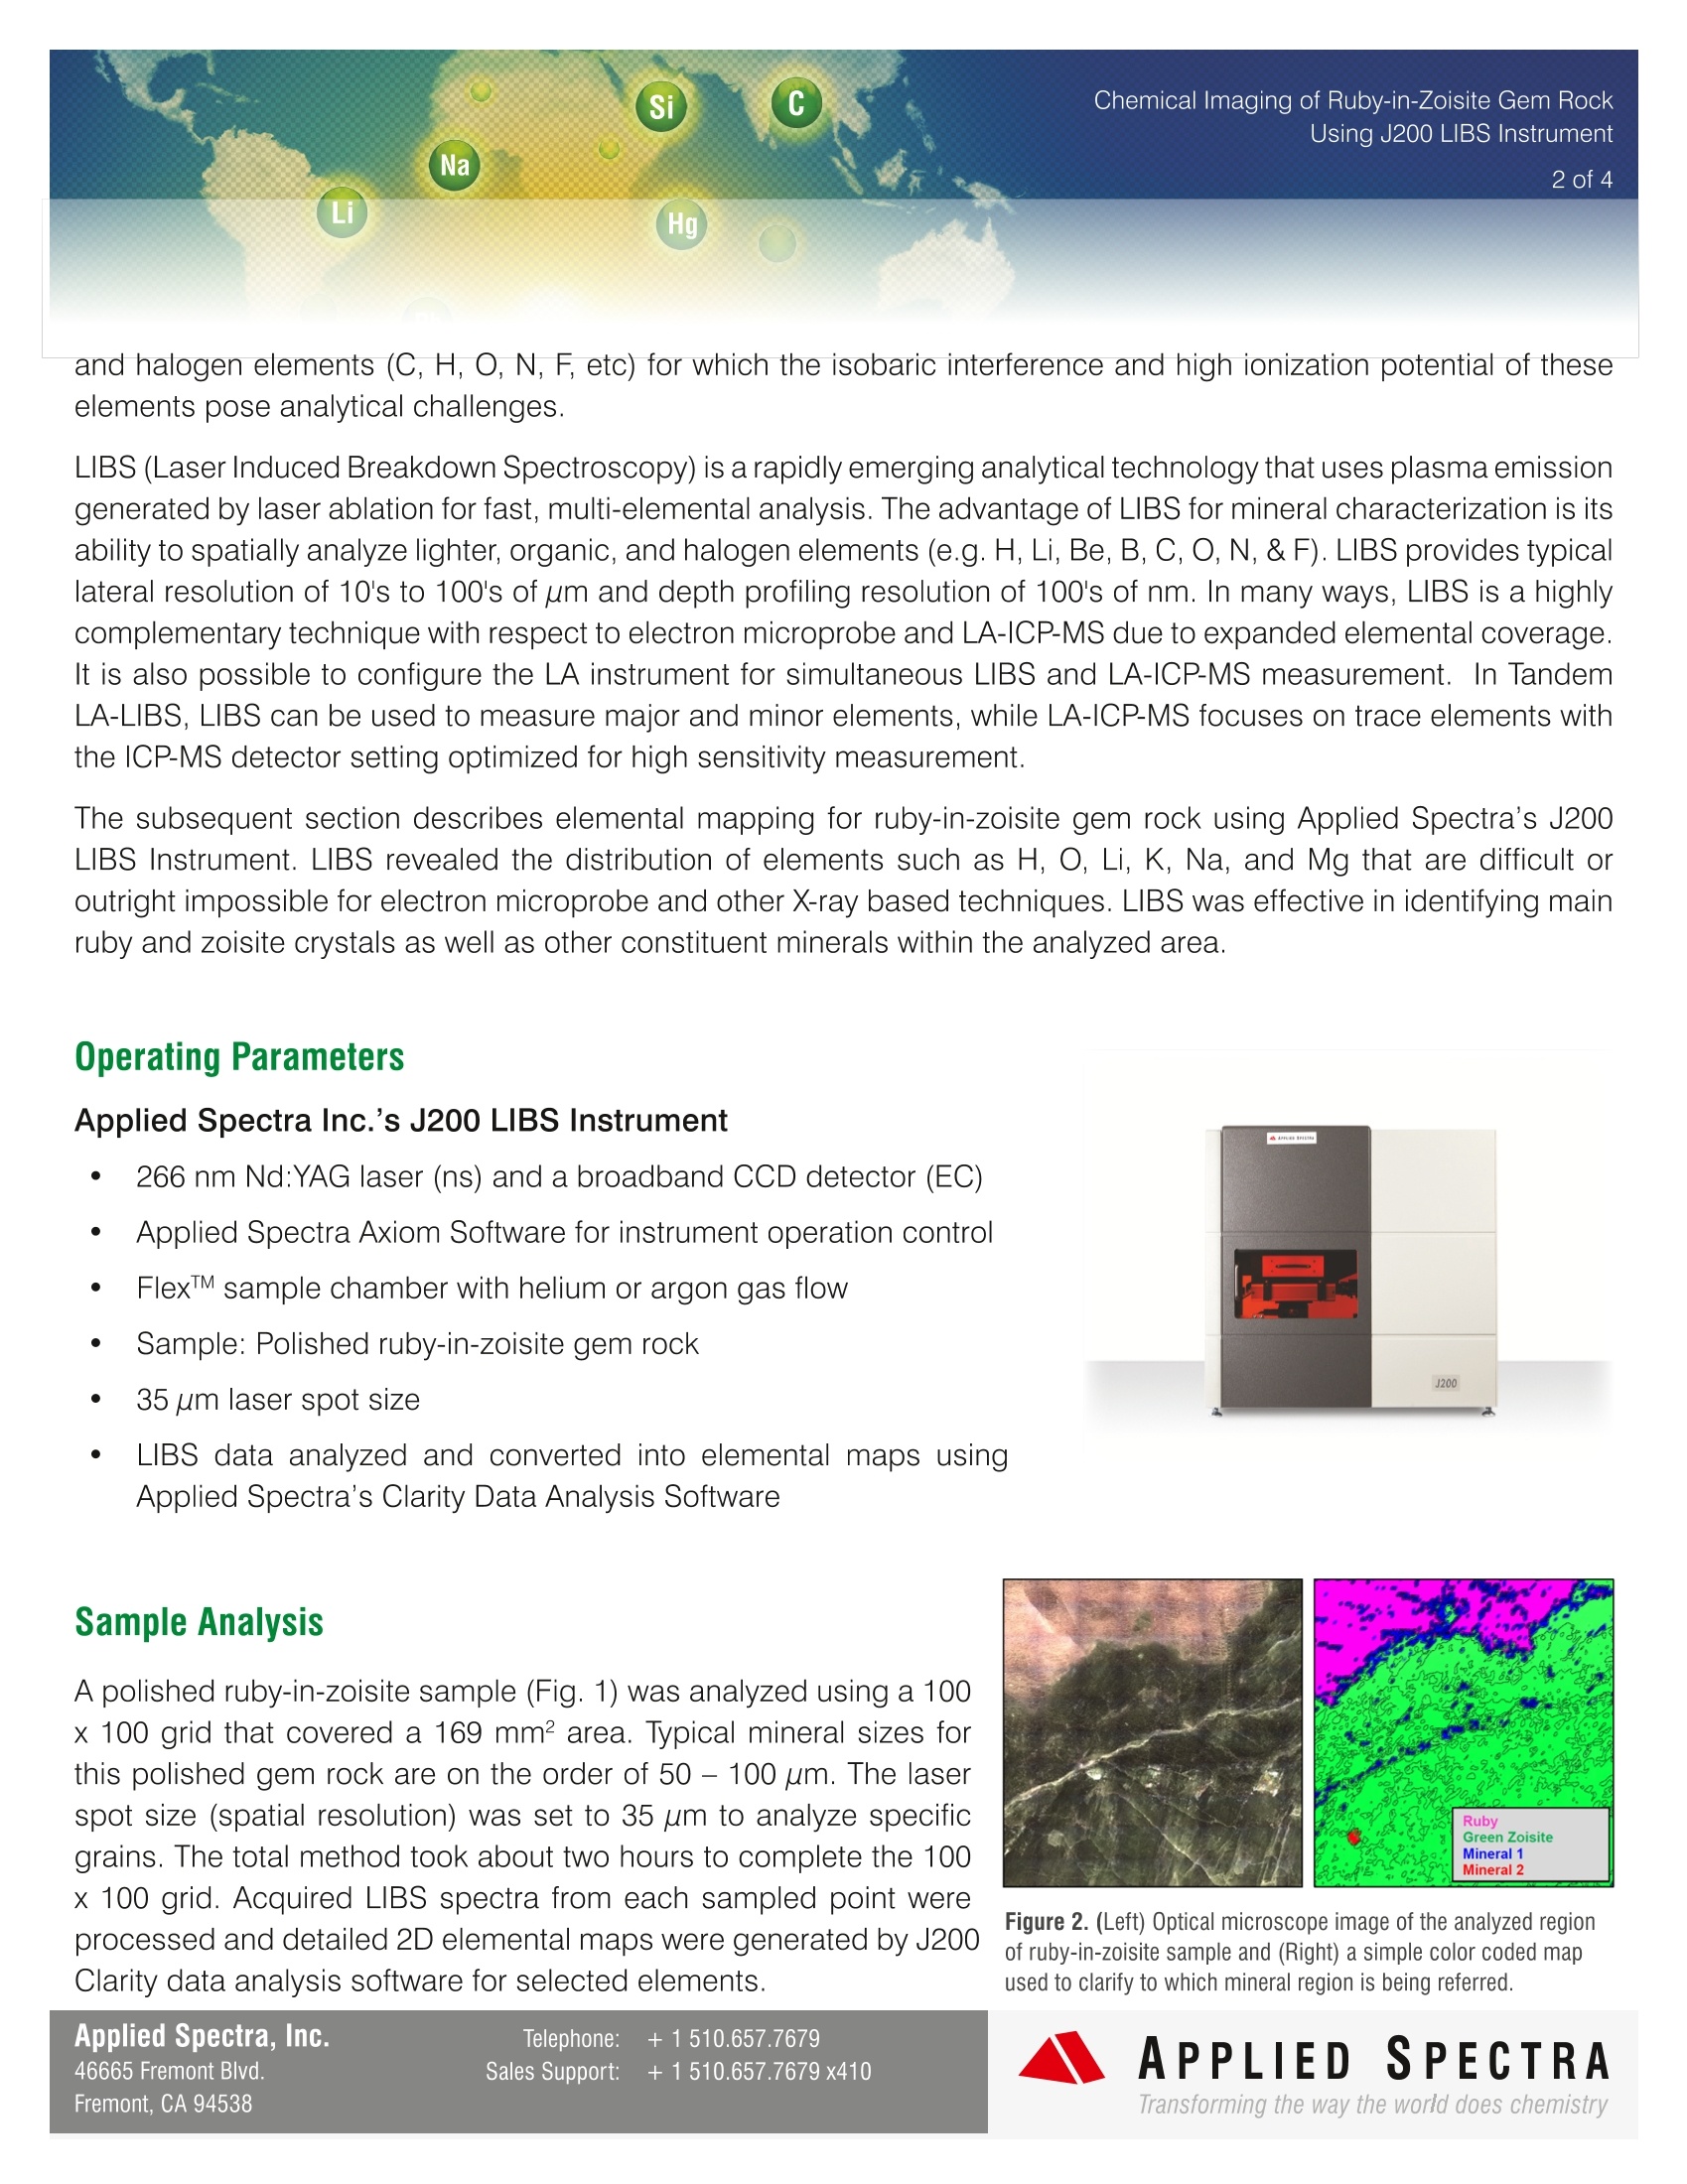
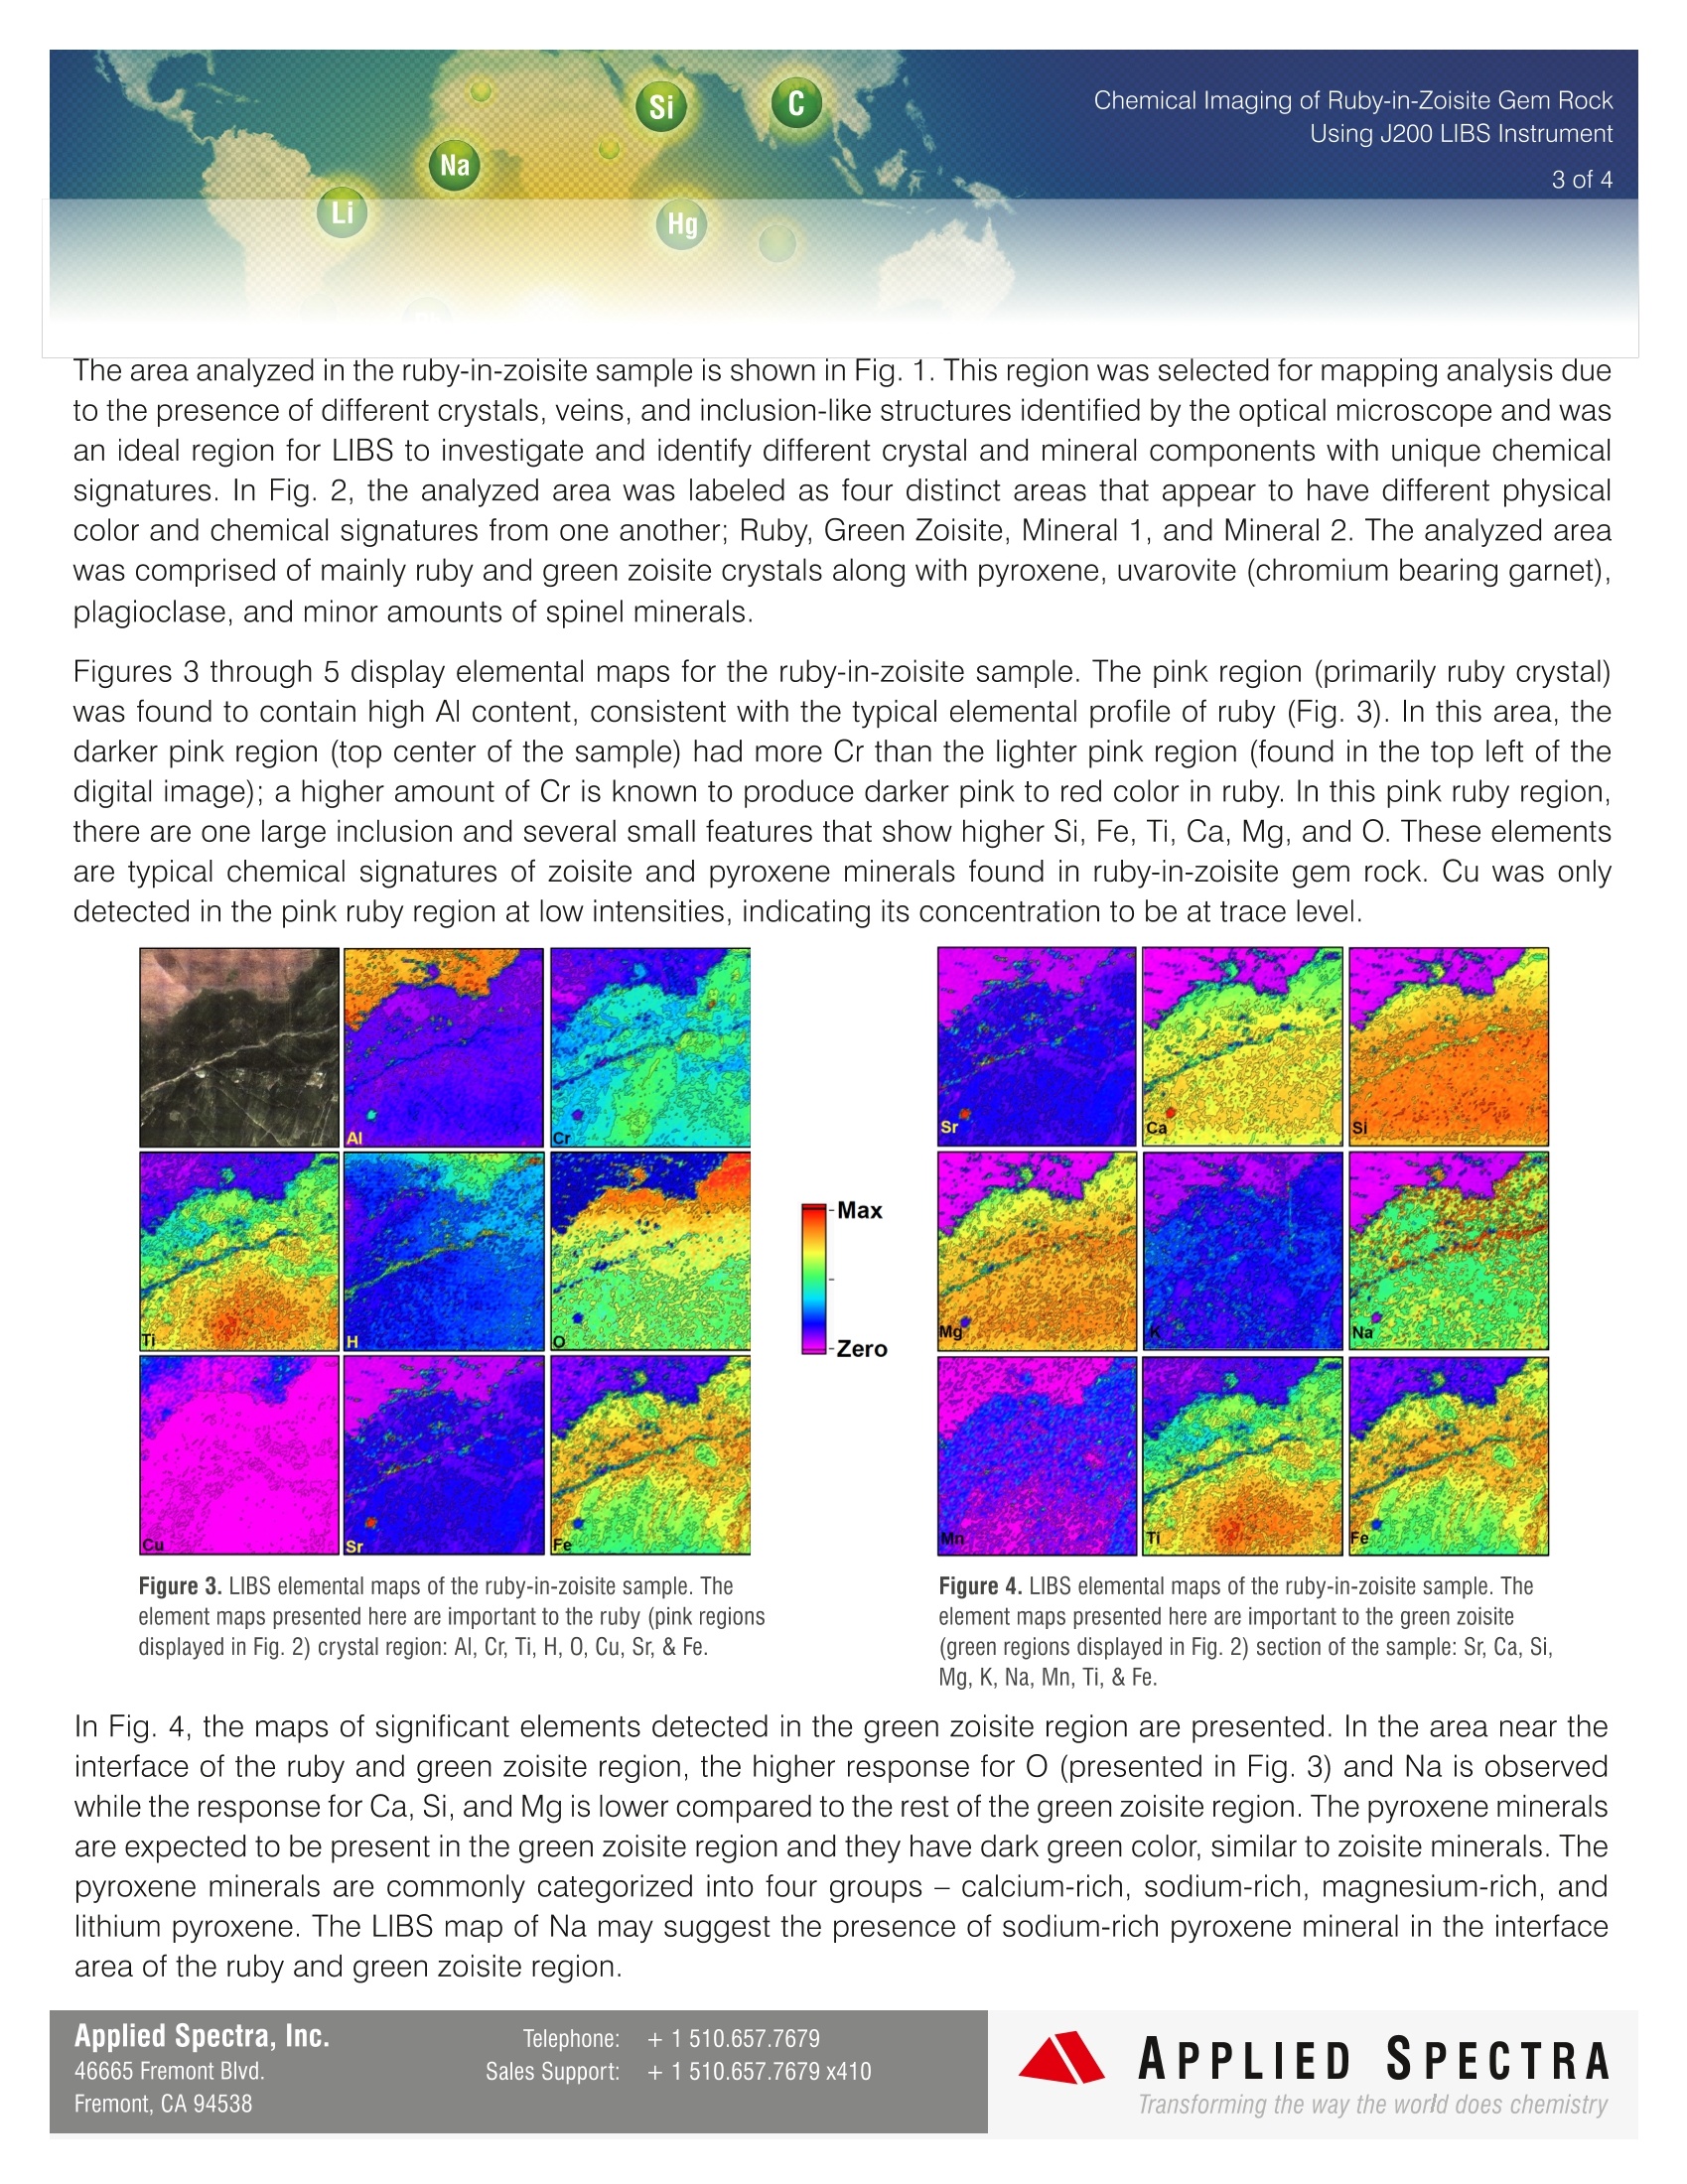
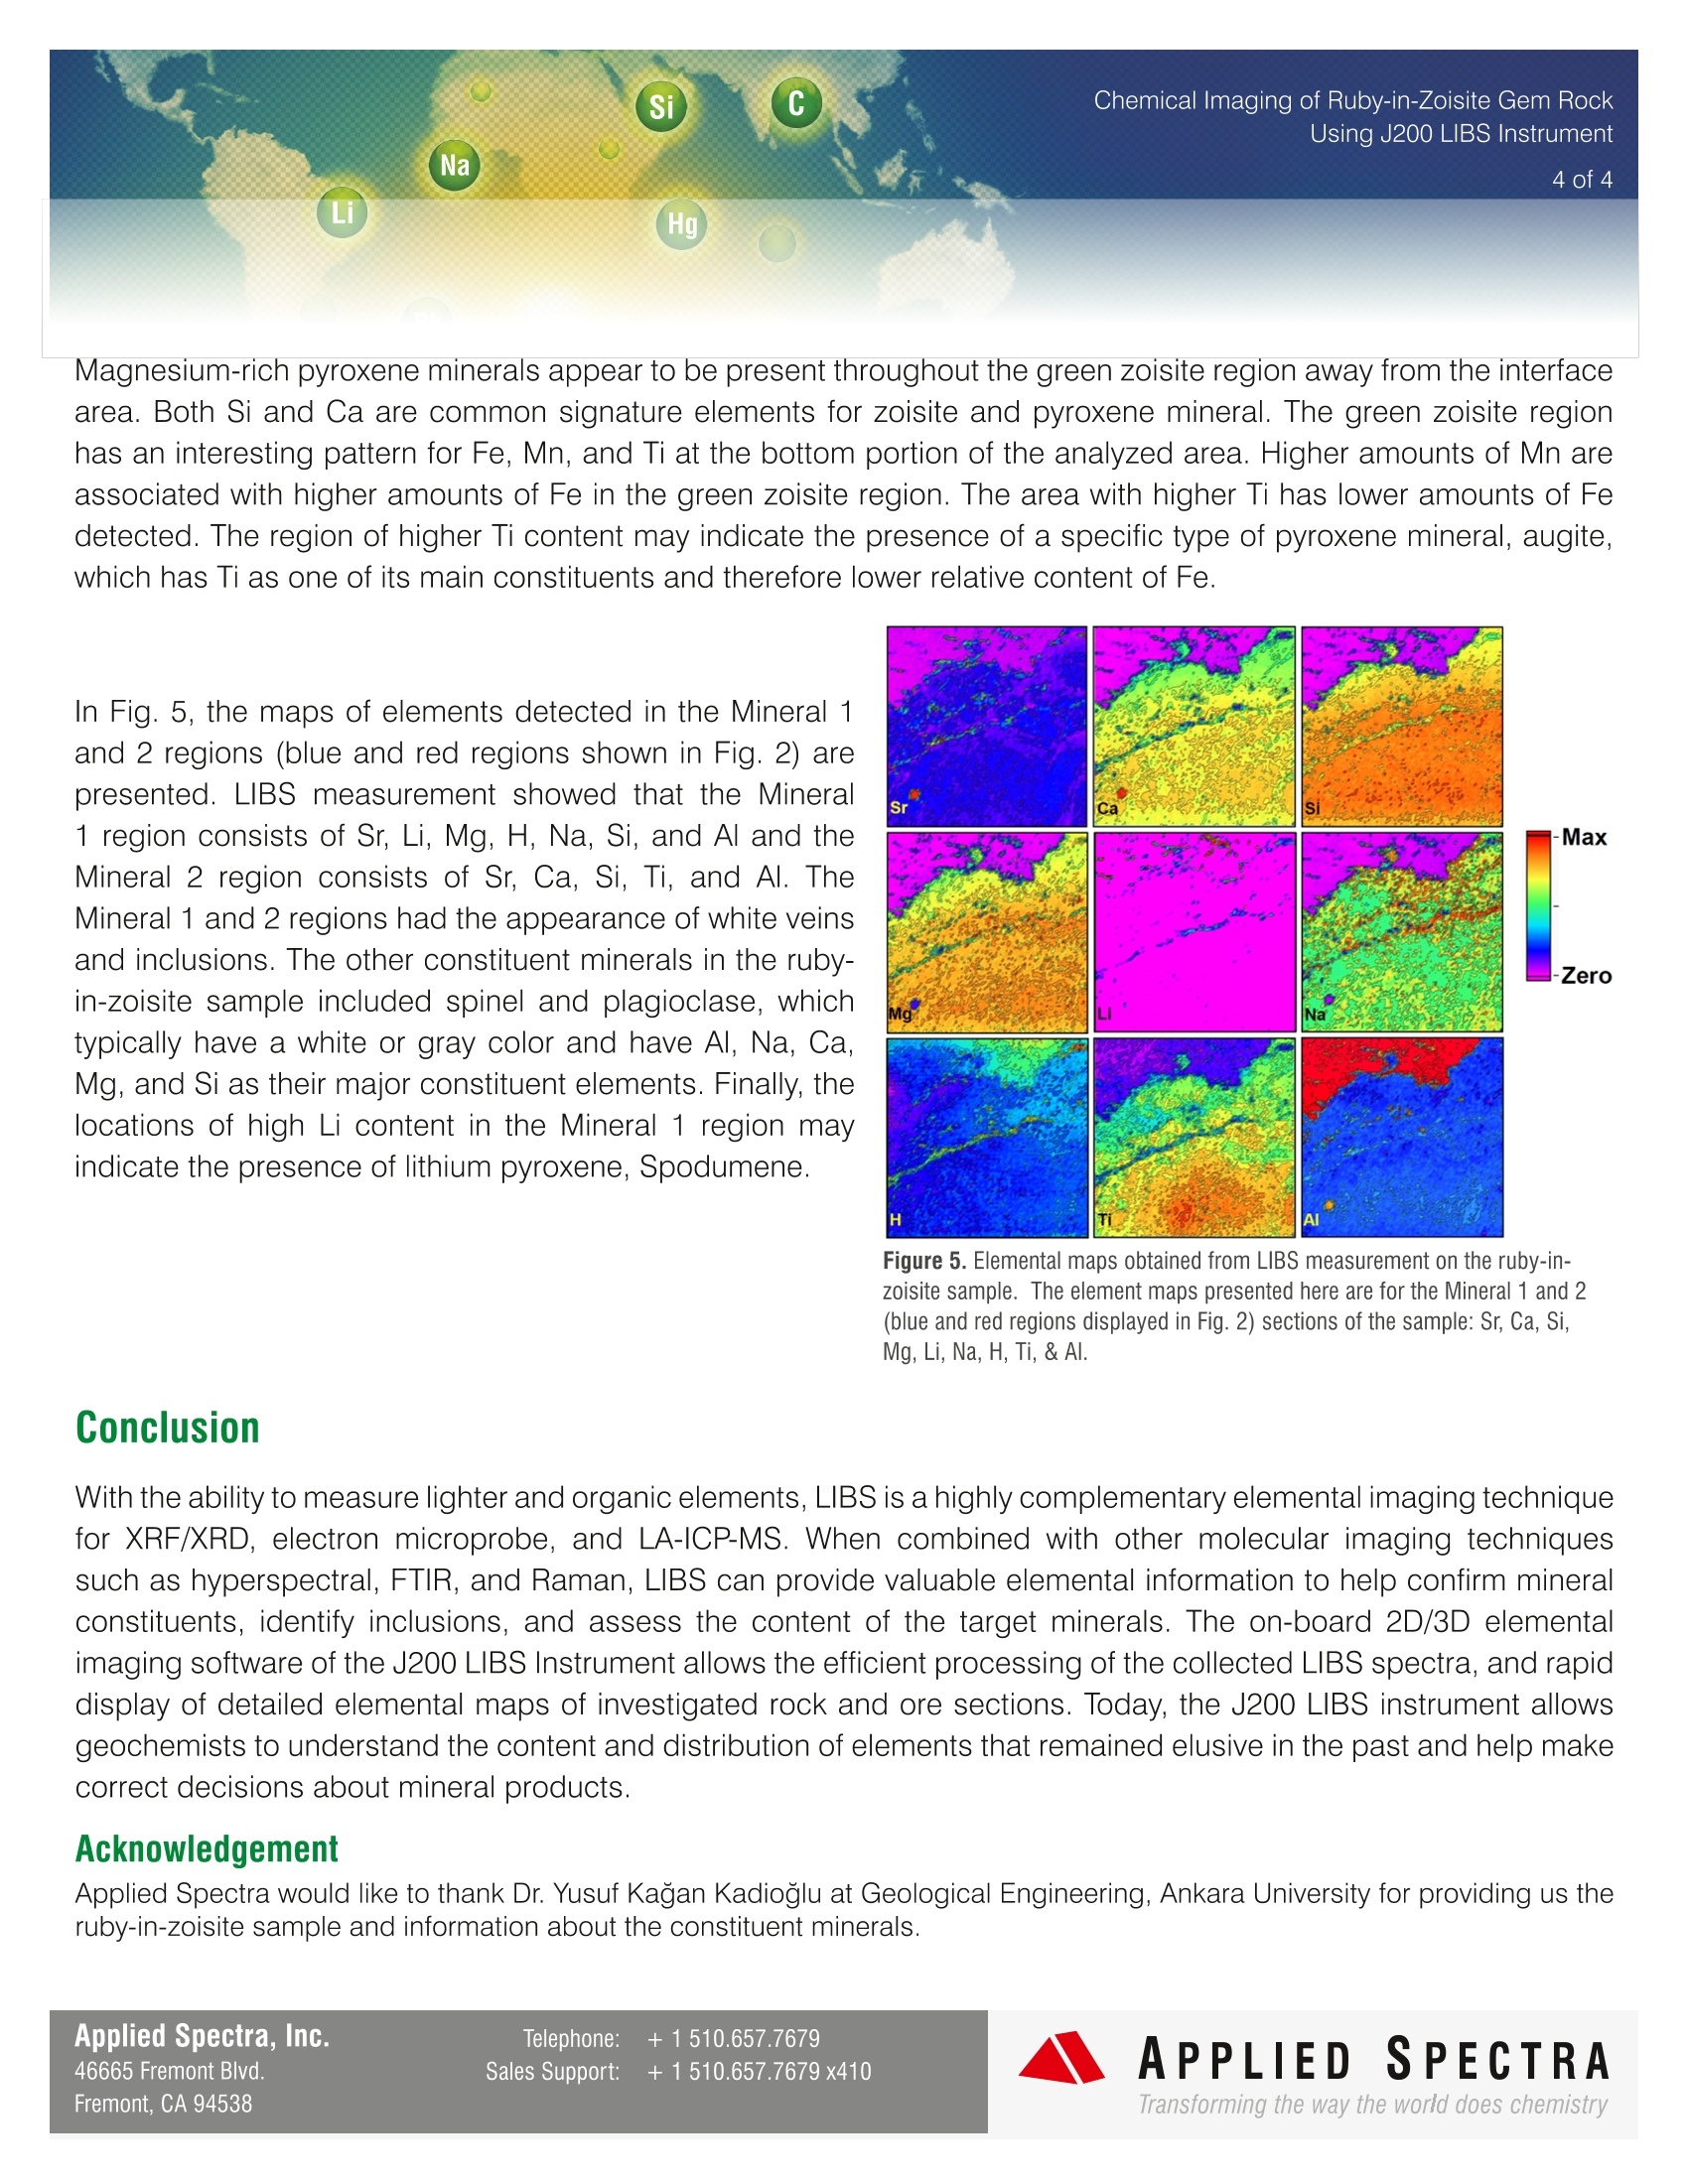
Chemical Imaging of Ruby-in-Zoisite Gem RockUsing J200 LIBS Instrument3 of 4 Si C Na Li Hg Pb Chemical Imaging of Ruby-in-Zoisite Gem RockUsing J200 LIBS Instrument Comprehensive characterization of individual mineralsand their depositsISbecoming an indispensableadvantage in mining exploration and gemological/geochemistry research. While grain size, morphology,and crystal structure of mineral deposits are some ofthe properties routinely investigated, spatially resolvedchemicalinformation provides valuable insight on mineralphases present, location of inclusions, mineralogicaldistribution of elements detrimental to downstreamproduct extraction, and overall content of the targetminerals. Currently, XRF/XRD and electron microprobe arepopulartechniques used to analyze the chemical compositionof minerals, rocks, and ores. Often in conjunction withoptical microscopic analysis, these techniques allowunderstanding of crystal-scale variations of mineralchemistry. While these techniques offer capability for Figure 1. (Left) Ruby-in-Zoisite sample and (Right) 13 mm x 13 mmarea analyzed by LIBS. quantitativeanalysis Oofmajor, minor, and trace-level e(lements.,oneofthe main Id(isadvantagesincludesSan inabilitytocover lighterelements. For instance, for electron microprobe analysis, it is not possible to measure lighterelements withZ<4(H,Li,& Be). Furthermore,forelementsZ between 5 and 10, the analysis is often difficult due tothe lack of detection sensitivity. These limitations causesome of the main constituents of minerals to be missinafrom the analysis, such as Li and F, often found in somemicas. The analysis of water (H,O) content in mineralsand rocks is also not possible. LA-ICP-MS (Laser Ablation-Inductively Coupled Plasma-Mass Spectrometry)is another popular elemental/isotopic analysis technique for mineral characterization.Although at slightly higher spatial resolution comparedto electron microprobe technique (typically 10's um),LA-ICP-MS provides better detection limits approachingppb level for important elements in industrial minerals(i.e. REE's). This technique also has been consideredfor impurity analysis for high purity quartz. On the otherhand, LA-ICP-MS is not suitable for investigating majorelements. The technique also has limitations for organic and halogen elements (C, H, O,N, F, etc) for which the isobaric interference and high ionization potential of theseelements pose analytical challenges. LIBS (Laser Induced Breakdown Spectroscopy) is a rapidly emerging analytical technology that uses plasma emissiongenerated by laser ablation for fast, multi-elemental analysis. The advantage of LIBS for mineral characterization is itsability to spatially analyze lighter, organic, and halogen elements (e.g.H, Li, Be, B, C, O, N, &F). LIBS provides typicallateral resolution of 10's to 100's of um and depth profiling resolution of 100's of nm. In many ways, LIBS is a highlycomplementary technique with respect to electron microprobe and LA-ICP-MS due to expanded elemental coverage.It is also possible to configure the LA instrument for simultaneous LIBS and LA-ICP-MS measurement. In TandemLA-LIBS, LIBS can be used to measure major and minor elements, while LA-ICP-MS focuses on trace elements withthe ICP-MS detector setting optimized for high sensitivity measurement. The subsequent section describes elemental mapping for ruby-in-zoisite gem rock using Applied Spectra's J200LIBS Instrument. LIBS revealed the distribution of elements such as H, O, Li, K, Na, and Mg that are difficult oroutright impossible for electron microprobe and other X-ray based techniques. LIBS was effective in identifying mainruby and zoisite crystals as well as other constituent minerals within the analyzed area. Operating Parameters Applied Spectra Inc.’s J200 LIBS Instrument 266 nm Nd:YAG laser (ns) and a broadband CCD detector (EC) Applied Spectra Axiom Software for instrument operation control FlexTM sample chamber with helium or argon gas flow Sample: Polished ruby-in-zoisite gem rock e 35 um laser spot size LIBS data analyzed and converted into elemental maps usingApplied Spectra's Clarity Data Analysis Software Sample Analysis A polished ruby-in-zoisite sample (Fig.1) was analyzed using a 100x 100 grid that covered a 169 mm² area. Typical mineral sizes forthis polished gem rock are on the order of 50 -100 um. The laserspot size (spatial resolution) was set to 35 um to analyze specificgrains. The total method took about two hours to complete the 100x100 grid. Acquired LIBS spectra from each sampled point wereprocessed and detailed 2D elemental maps were generated by J200Clarity data analysis software for selected elements. Figure 2. (Left) Optical microscope image of the analyzed regionof ruby-in-zoisite sample and (Right) a simple color coded mapused to clarify to which mineral region is being referred. ( Telephone: + 1510.657.7679Sales Support : +1510.657.7679 x410 ) Fremont, CA 94538 The area analyzed in the ruby-in-zoisite sample is shown in Fig.1. This region was selected for mapping analysis dueto the presence of different crystals, veins, and inclusion-like structures identified by the optical microscope and wasan ideal region for LIBS to investigate and identify different crystal and mineral components with unique chemicalsignatures. In Fig. 2, the analyzed area was labeled as four distinct areas that appear to have different physicalcolor and chemical signatures from one another; Ruby, Green Zoisite, Mineral 1, and Mineral 2. The analyzed areawas comprised of mainly ruby and green zoisite crystals along with pyroxene, uvarovite (chromium bearing garnet),plagioclase, and minor amounts of spinel minerals. Figures 3 through 5 display elemental maps for the ruby-in-zoisite sample. The pink region (primarily ruby crystal)was found to contain high Al content, consistent with the typical elemental profile of ruby (Fig. 3). In this area, thedarker pink region (top center of the sample) had more Cr than the lighter pink region (found in the top left of thedigital image); a higher amount of Cr is known to produce darker pink to red color in ruby. In this pink ruby region,there are one large inclusion and several small features that show higher Si, Fe, Ti, Ca, Mg, and O.These elementsare typical chemical signatures of zoisite and pyroxene minerals found in ruby-in-zoisite gem rock. Cu was onlydetected in the pink ruby region at low intensities, indicating its concentration to be at trace level. i-Max -Zero Figure 3. LIBS elemental maps of the ruby-in-zoisite sample. Theelement maps presented here are important to the ruby (pink regionsdisplayed in Fig. 2) crystal region: Al, Cr, Ti, H, O, Cu, Sr, & Fe. Figure 4. LIBS elemental maps of the ruby-in-zoisite sample. Theelement maps presented here are important to the green zoisite(green regions displayed in Fig. 2) section of the sample: Sr, Ca, Si,Mg, K, Na, Mn, Ti, & Fe. In Fig. 4, the maps of significant elements detected in the green zoisite region are presented. In the area near theinterface of the ruby and green zoisite region, the higher response for O (presented in Fig. 3) and Na is observedwhile the response for Ca, Si, and Mg is lower compared to the rest of the green zoisite region. The pyroxene mineralsare expected to be present in the green zoisite region and they have dark green color, similar to zoisite minerals. Thepyroxene minerals are commonly categorized into four groups - calcium-rich, sodium-rich, magnesium-rich, andlithium pyroxene. The LIBS map of Na may suggest the presence of sodium-rich pyroxene mineral in the interfacearea of the ruby and green zoisite region. Magnesium-rich pyroxene minerals appear to be present throughout the green zoisite region away from the interfacearea. Both Si and Ca are common signature elements for zoisite and pyroxene mineral. The green zoisite regionhas an interesting pattern for Fe, Mn, and Ti at the bottom portion of the analyzed area. Higher amounts of Mn areassociated with higher amounts of Fe in the green zoisite region. The area with higher Ti has lower amounts of Fedetected. The region of higher Ti content may indicate the presence of a specific type of pyroxene mineral, augite,which has Ti as one of its main constituents and therefore lower relative content of Fe. In Fig. 5, the maps of elements detected in the Mineral 1and 2 regions (blue and red regions shown in Fig. 2) arepresented. LIBS measurement showed that the Mineral1 region consists of Sr, Li, Mg, H, Na, Si, and Al and theMineral 2 region consists of Sr, Ca, Si, Ti, and Al. TheMineral 1 and 2 regions had the appearance of white veinsand inclusions. The other constituent minerals in the ruby-in-zoisite sample included spinel and plagioclase, whichtypically have a white or gray color and have Al, Na, Ca,Mg, and Si as their major constituent elements. Finally, thelocations of high Li content in the Mineral 1 region mayindicate the presence of lithium pyroxene, Spodumene. Figure 5. Elemental maps obtained from LIBS measurement on the ruby-in-zoisite sample. The element maps presented here are for the Mineral 1 and 2(blue and red regions displayed in Fig.2) sections of the sample: Sr, Ca, Si,Mg, Li, Na, H, Ti, & Al. With the ability to measure lighter and organic elements, LIBS is a highly complementary elemental imaging techniquefor XRF/XRD, electron microprobe, and LA-ICP-MS. When combined with other molecular imaging techniquessuch as hyperspectral, FTIR, and Raman, LIBS can provide valuable elemental information to help confirm mineralconstituents, identify inclusions, and assess the content of the target minerals. The on-board 2D/3D elementalimaging software of the J200 LIBS Instrument allows the efficient processing of the collected LIBS spectra, and rapiddisplay of detailed elemental maps of investigated rock and ore sections. Today, the J200 LIBS instrument allowsgeochemists to understand the content and distribution of elements that remained elusive in the past and help makecorrect decisions about mineral products. Acknowledgement Applied Spectra would like to thank Dr. Yusuf Kagan Kadioglu at Geological Engineering, Ankara University for providing us theruby-in-zoisite sample and information about the constituent minerals. APPLIEDSPECTRAwww.AppliedSpectra.comTransforming the way the world does chemistry Applied Spectra, Inc.Fremont Blvd.APPLIEDSPECTRATransforming the way the world does chemistry 图5给出了矿物1区和矿物2区(图2中蓝色和红色区域)探测到的元素图。LIBS测定结果表明,矿物1区由Sr、Li、Mg、H、Na、Si、Al组成,矿物2区由Sr、Ca、Si、Ti、Al组成,矿物1、2区呈现白色脉状和包裹体。样品中的其他组成矿物包括尖晶石和斜长石,一般呈白色或灰色,主要成分为铝、钠、钙、镁和硅。矿物1区锂含量高的位置可能预示着锂辉石、锂辉石的存在。
确定
还剩2页未读,是否继续阅读?

产品配置单

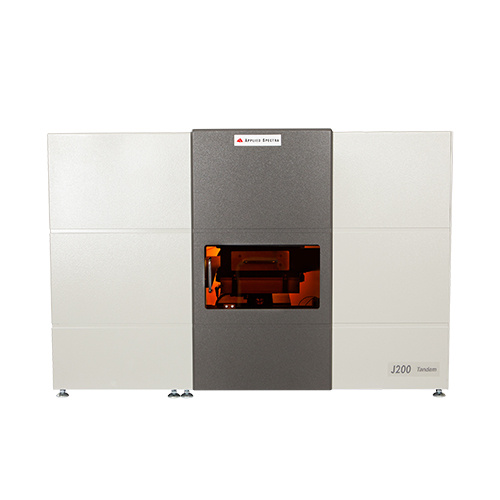
北京富尔邦科技发展有限责任公司为您提供《红宝石-黝帘石岩石中多元素分布检测方案(激光诱导击穿)》,该方案主要用于珠宝/玉石中多元素分布检测,参考标准--,《红宝石-黝帘石岩石中多元素分布检测方案(激光诱导击穿)》用到的仪器有美国ASI 激光诱导击穿光谱仪(LIBS)
推荐专场
相关方案
更多
该厂商其他方案
更多