


方案详情
文
研究结果表明,利用飞秒激光烧蚀-电感耦合等离子体质谱法可以对太阳电池薄膜的成分进行高精度的定量分析。结果表明,在飞秒激光束(λ = 1030 nm, τ = 450 fs)扫描CIGS表面时,采样条件对扫描结果有较大的影响。在zui佳采样条件下测得的fs-LA-ICP-MS信号,通常与电感耦合等离子体发射光谱法(ICP-OES)测量的参考浓度呈一条校准直线。fs-LA-ICP-MS预测的铜、铟、镓、硒元素的浓度比准确度较高,达到ICP-OES测定值的95% - 97%。
方案详情

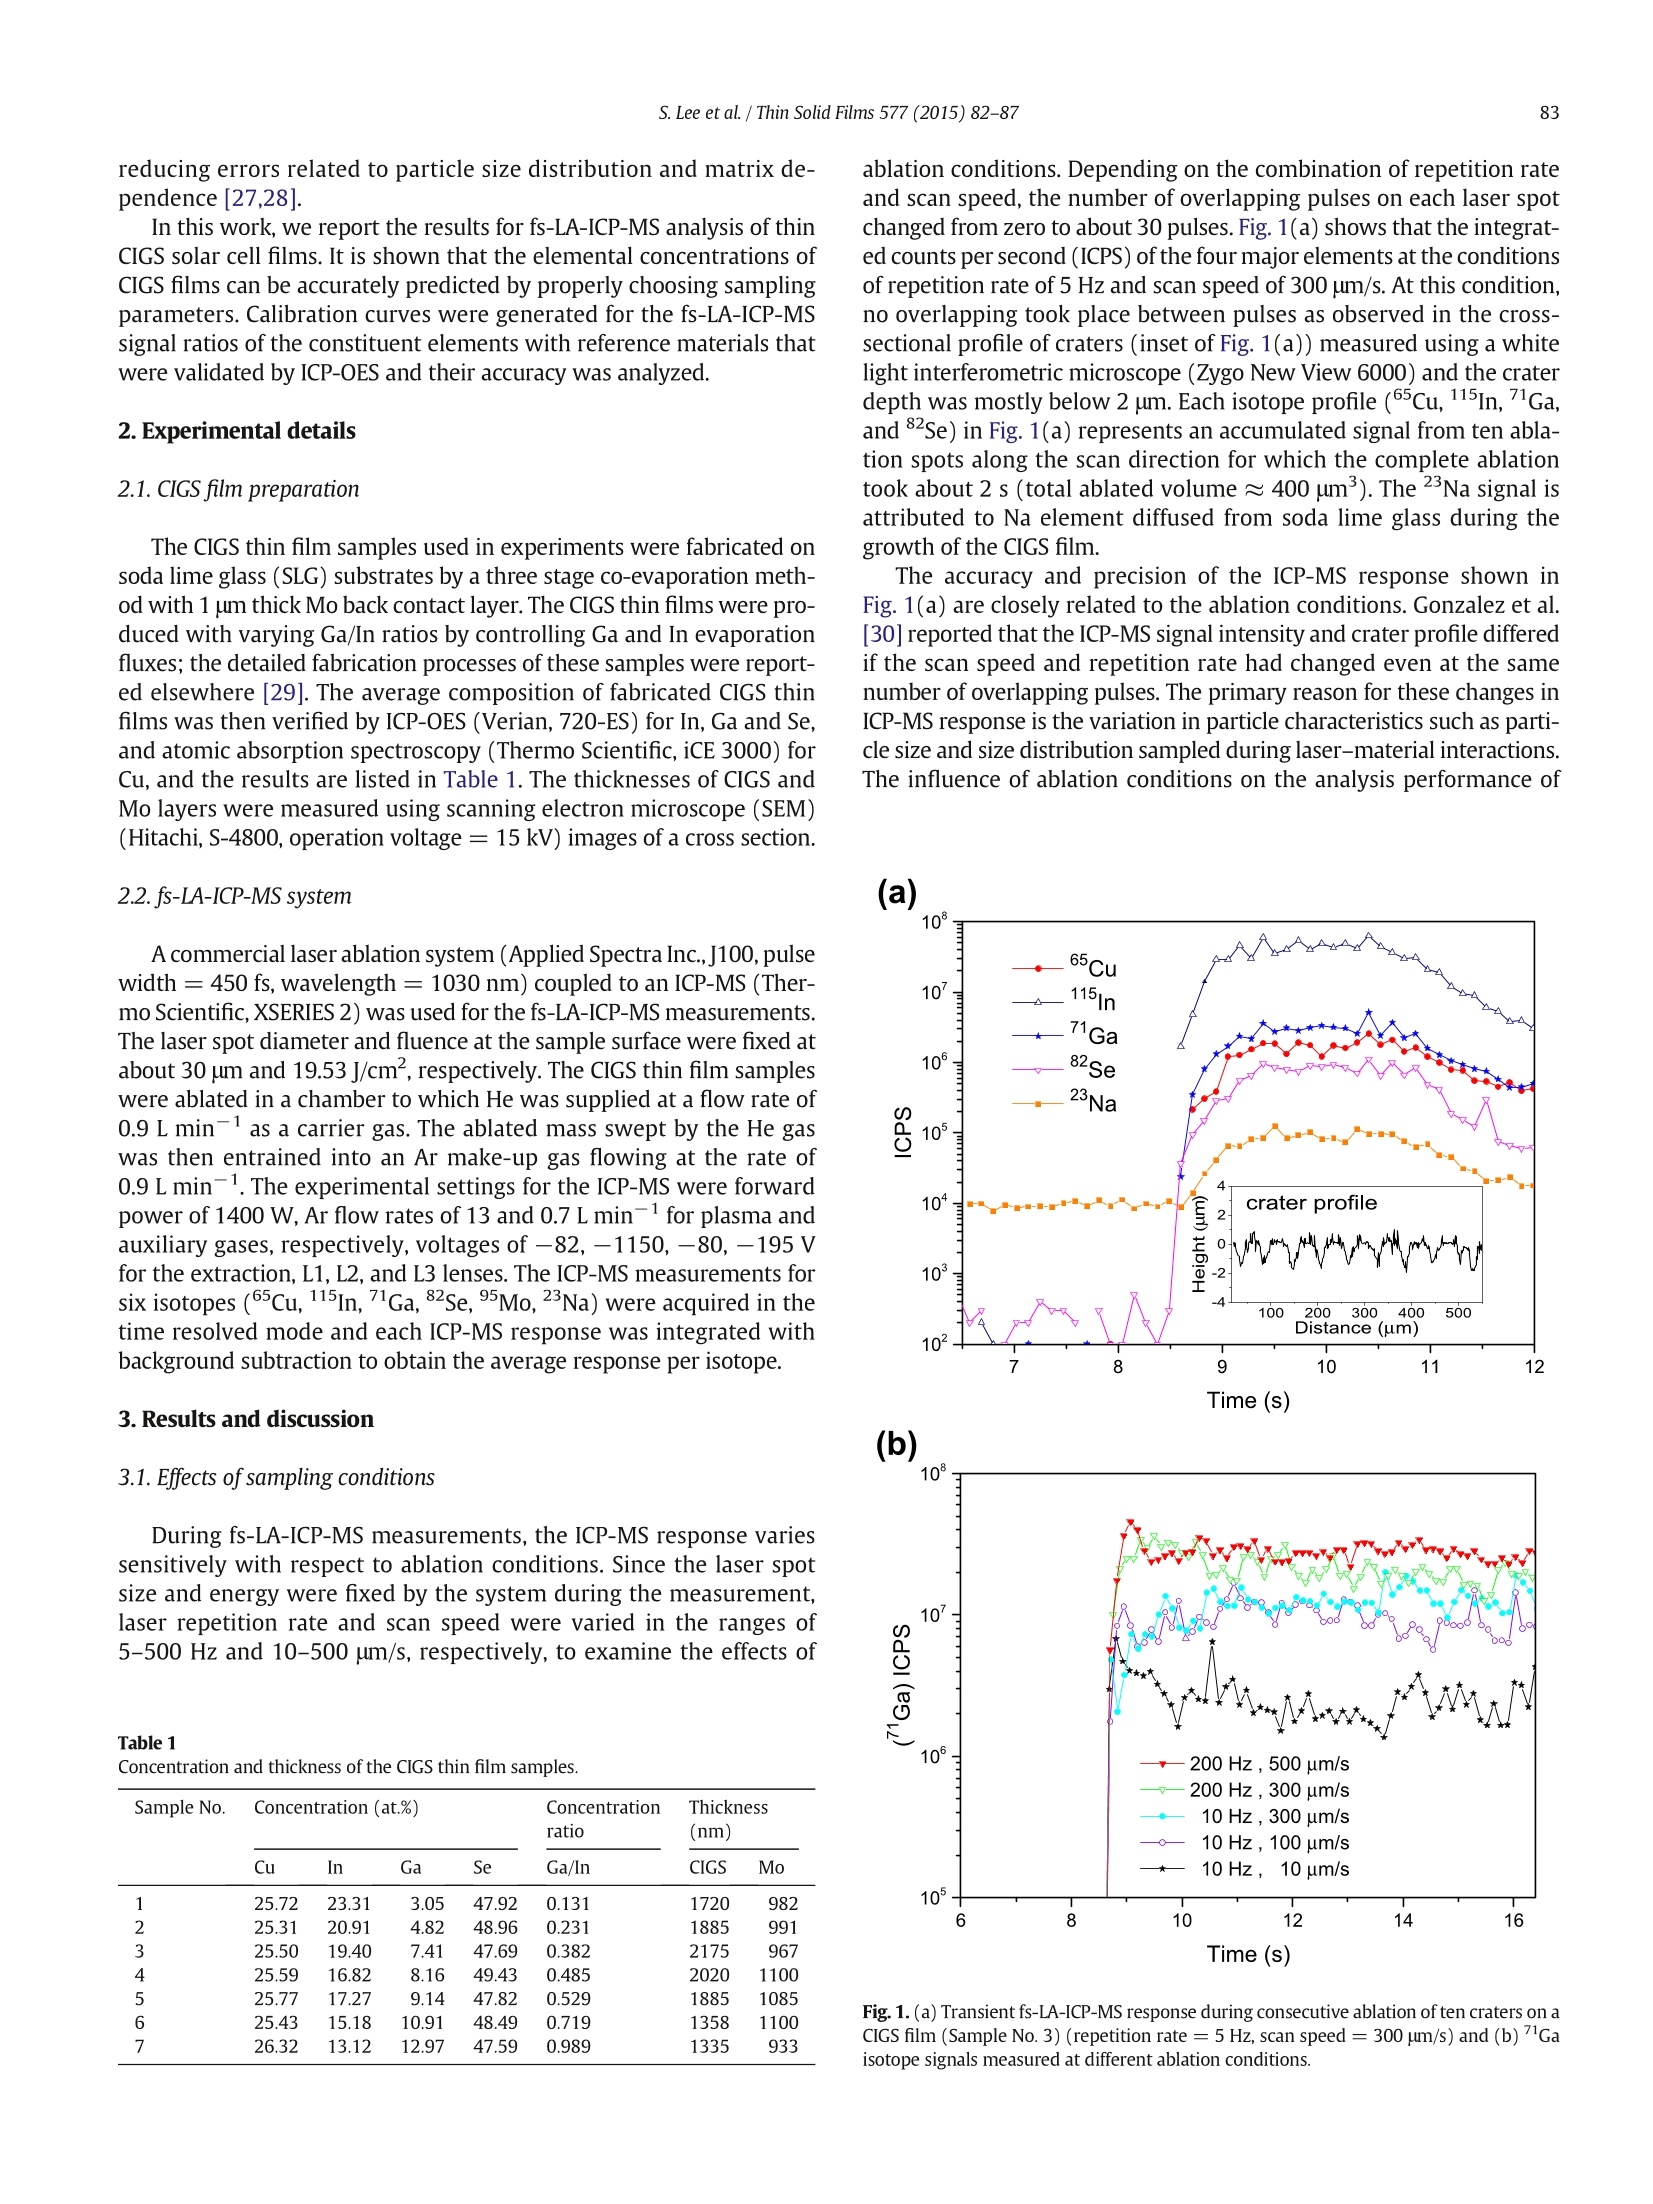
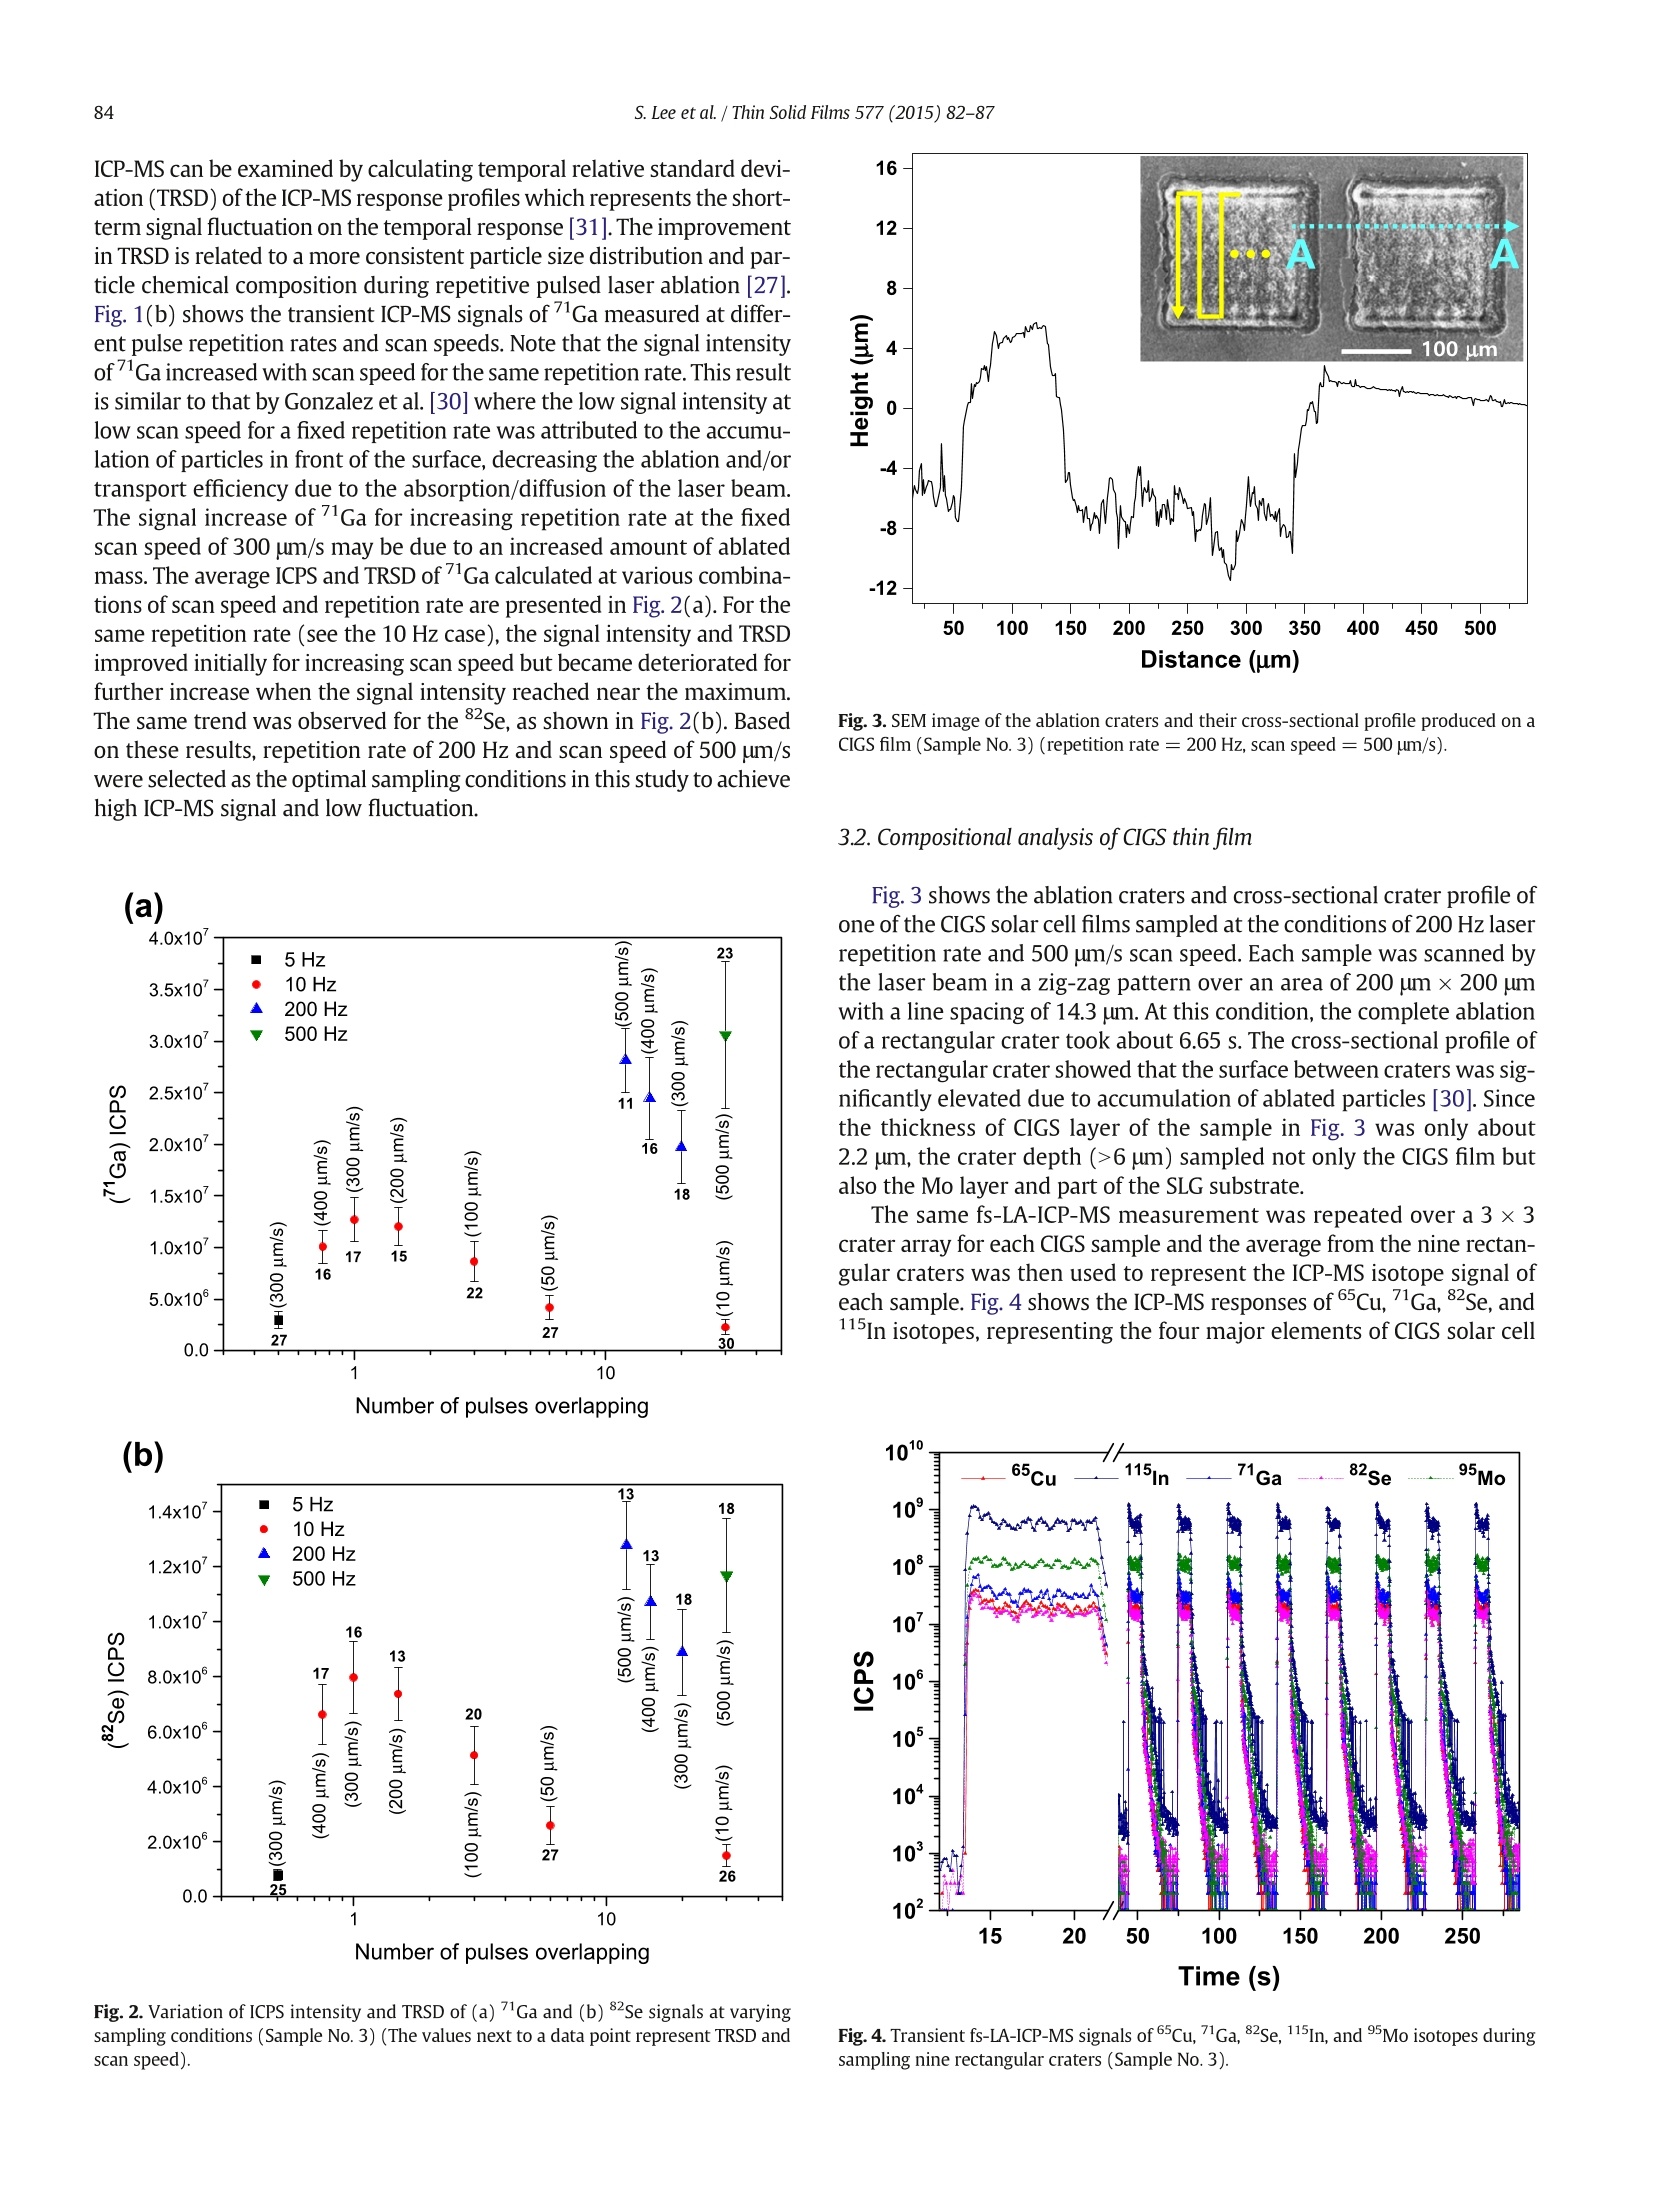
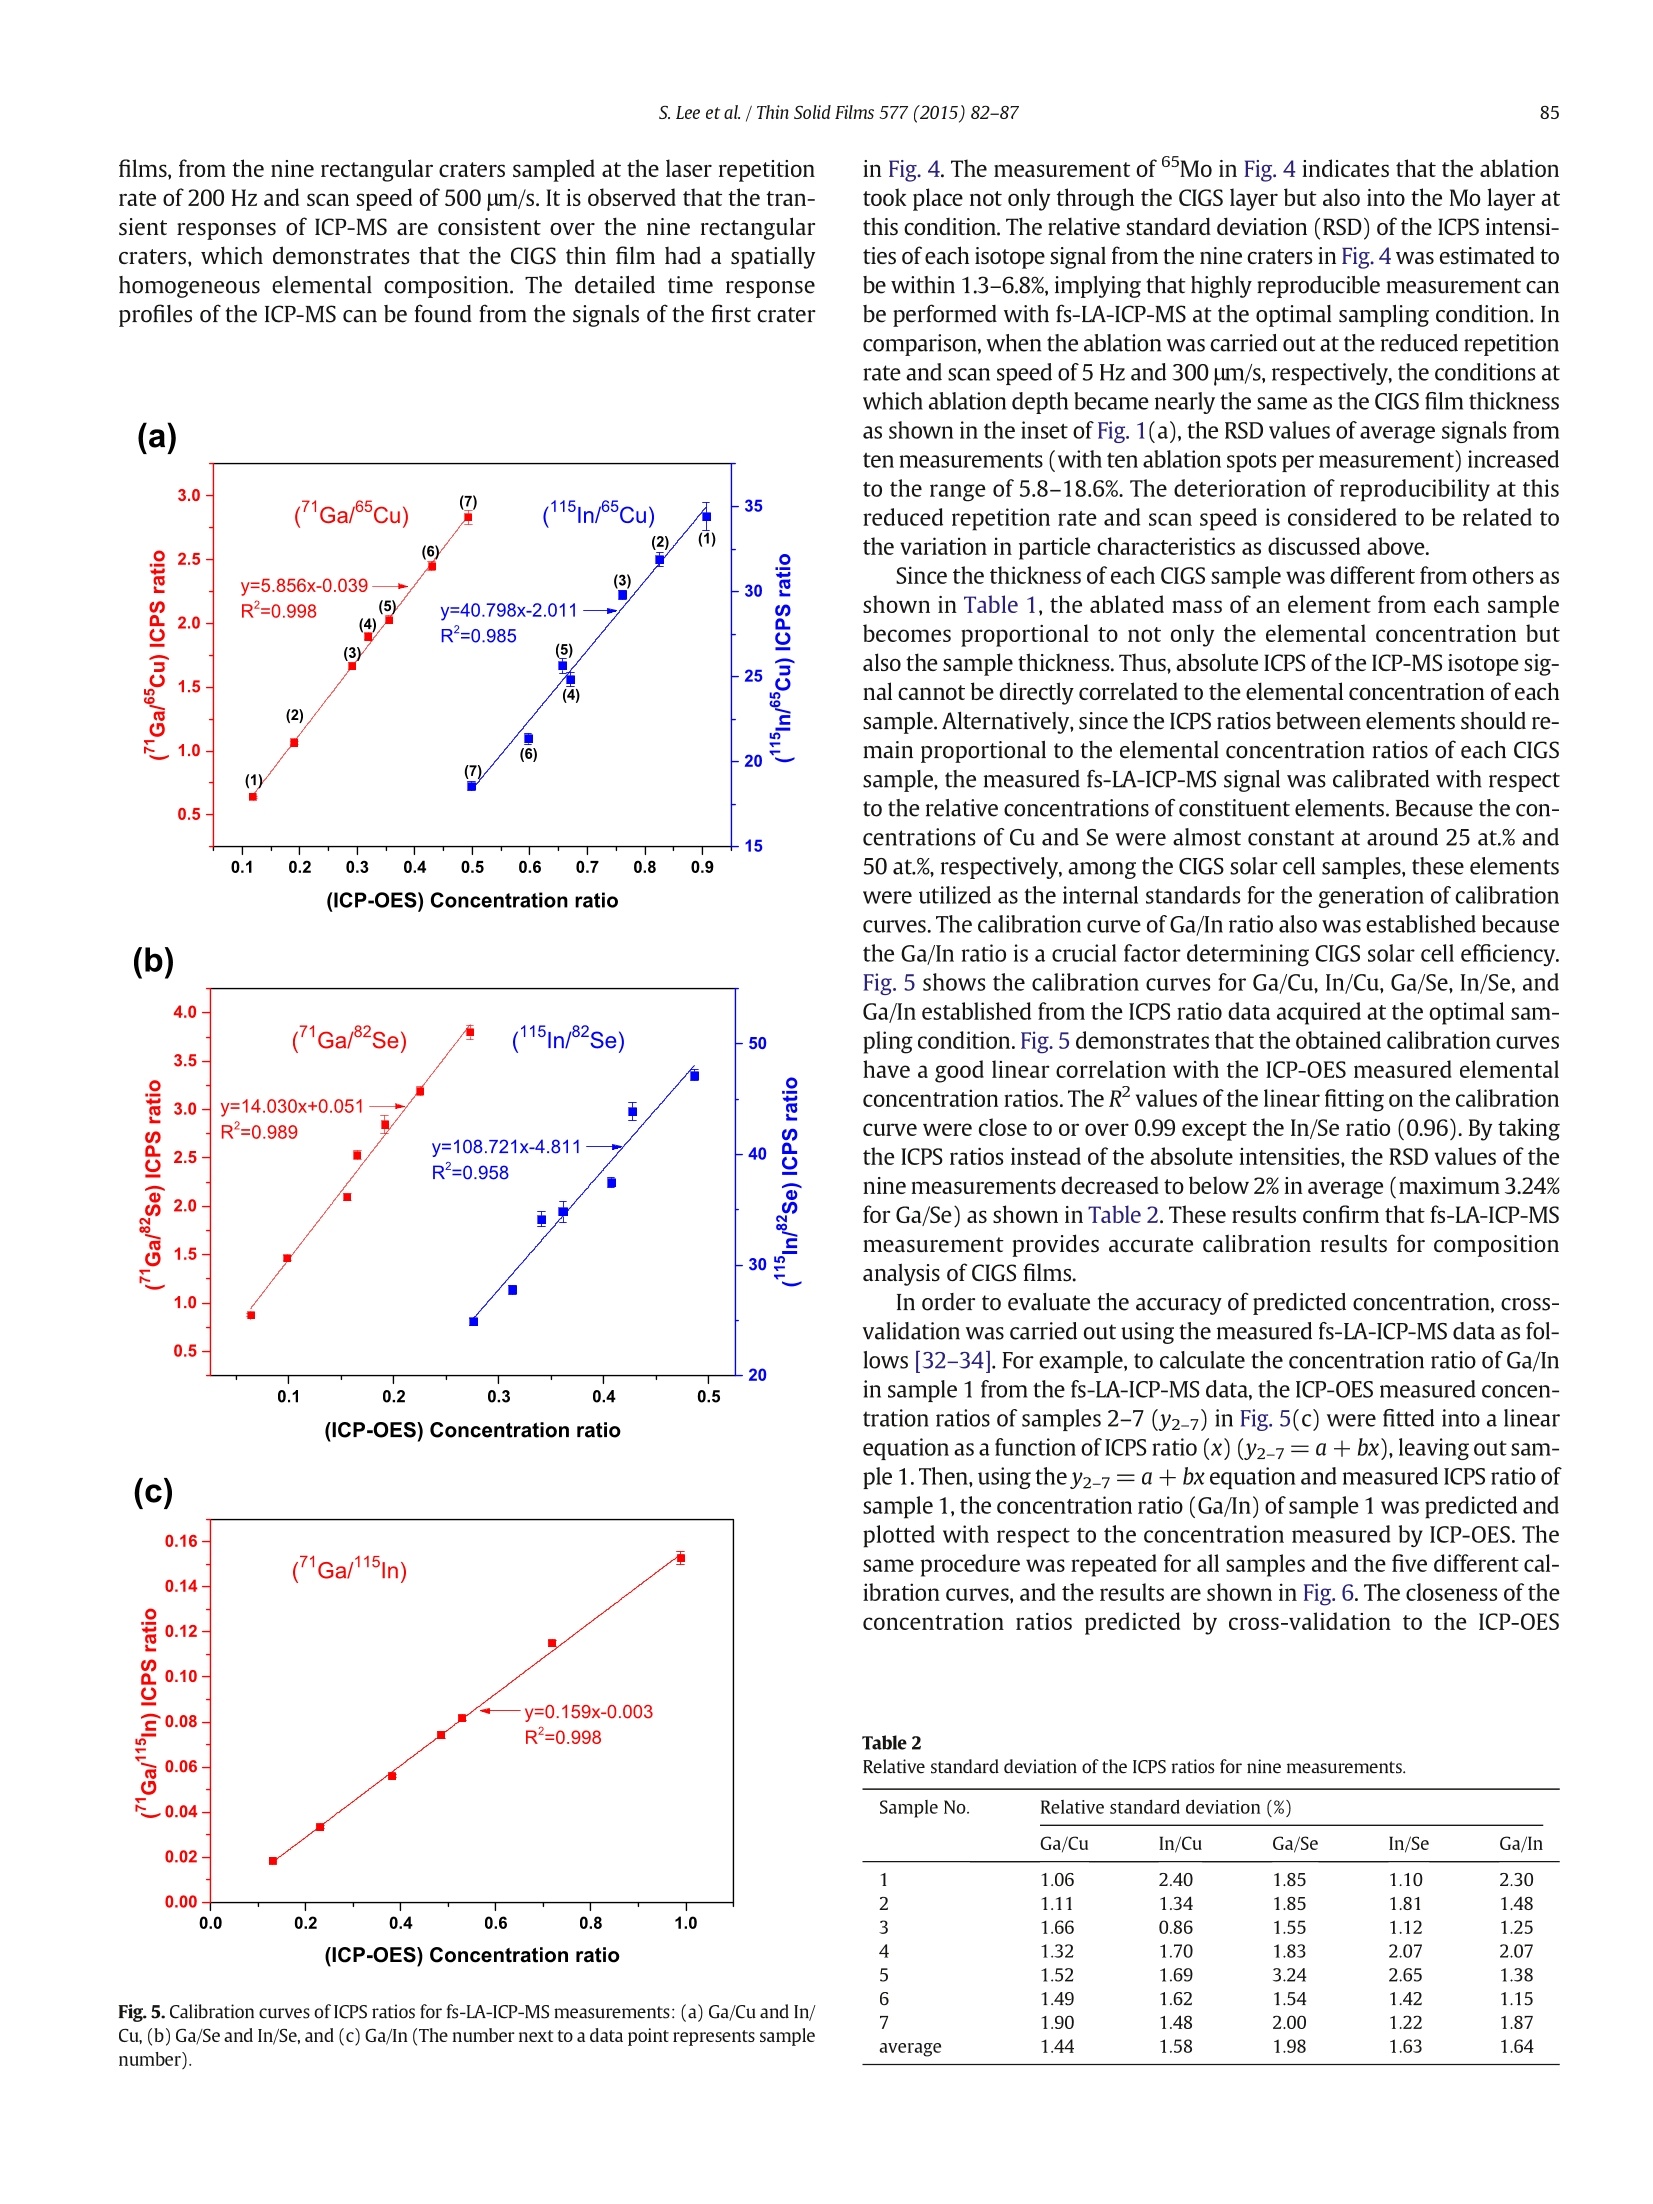
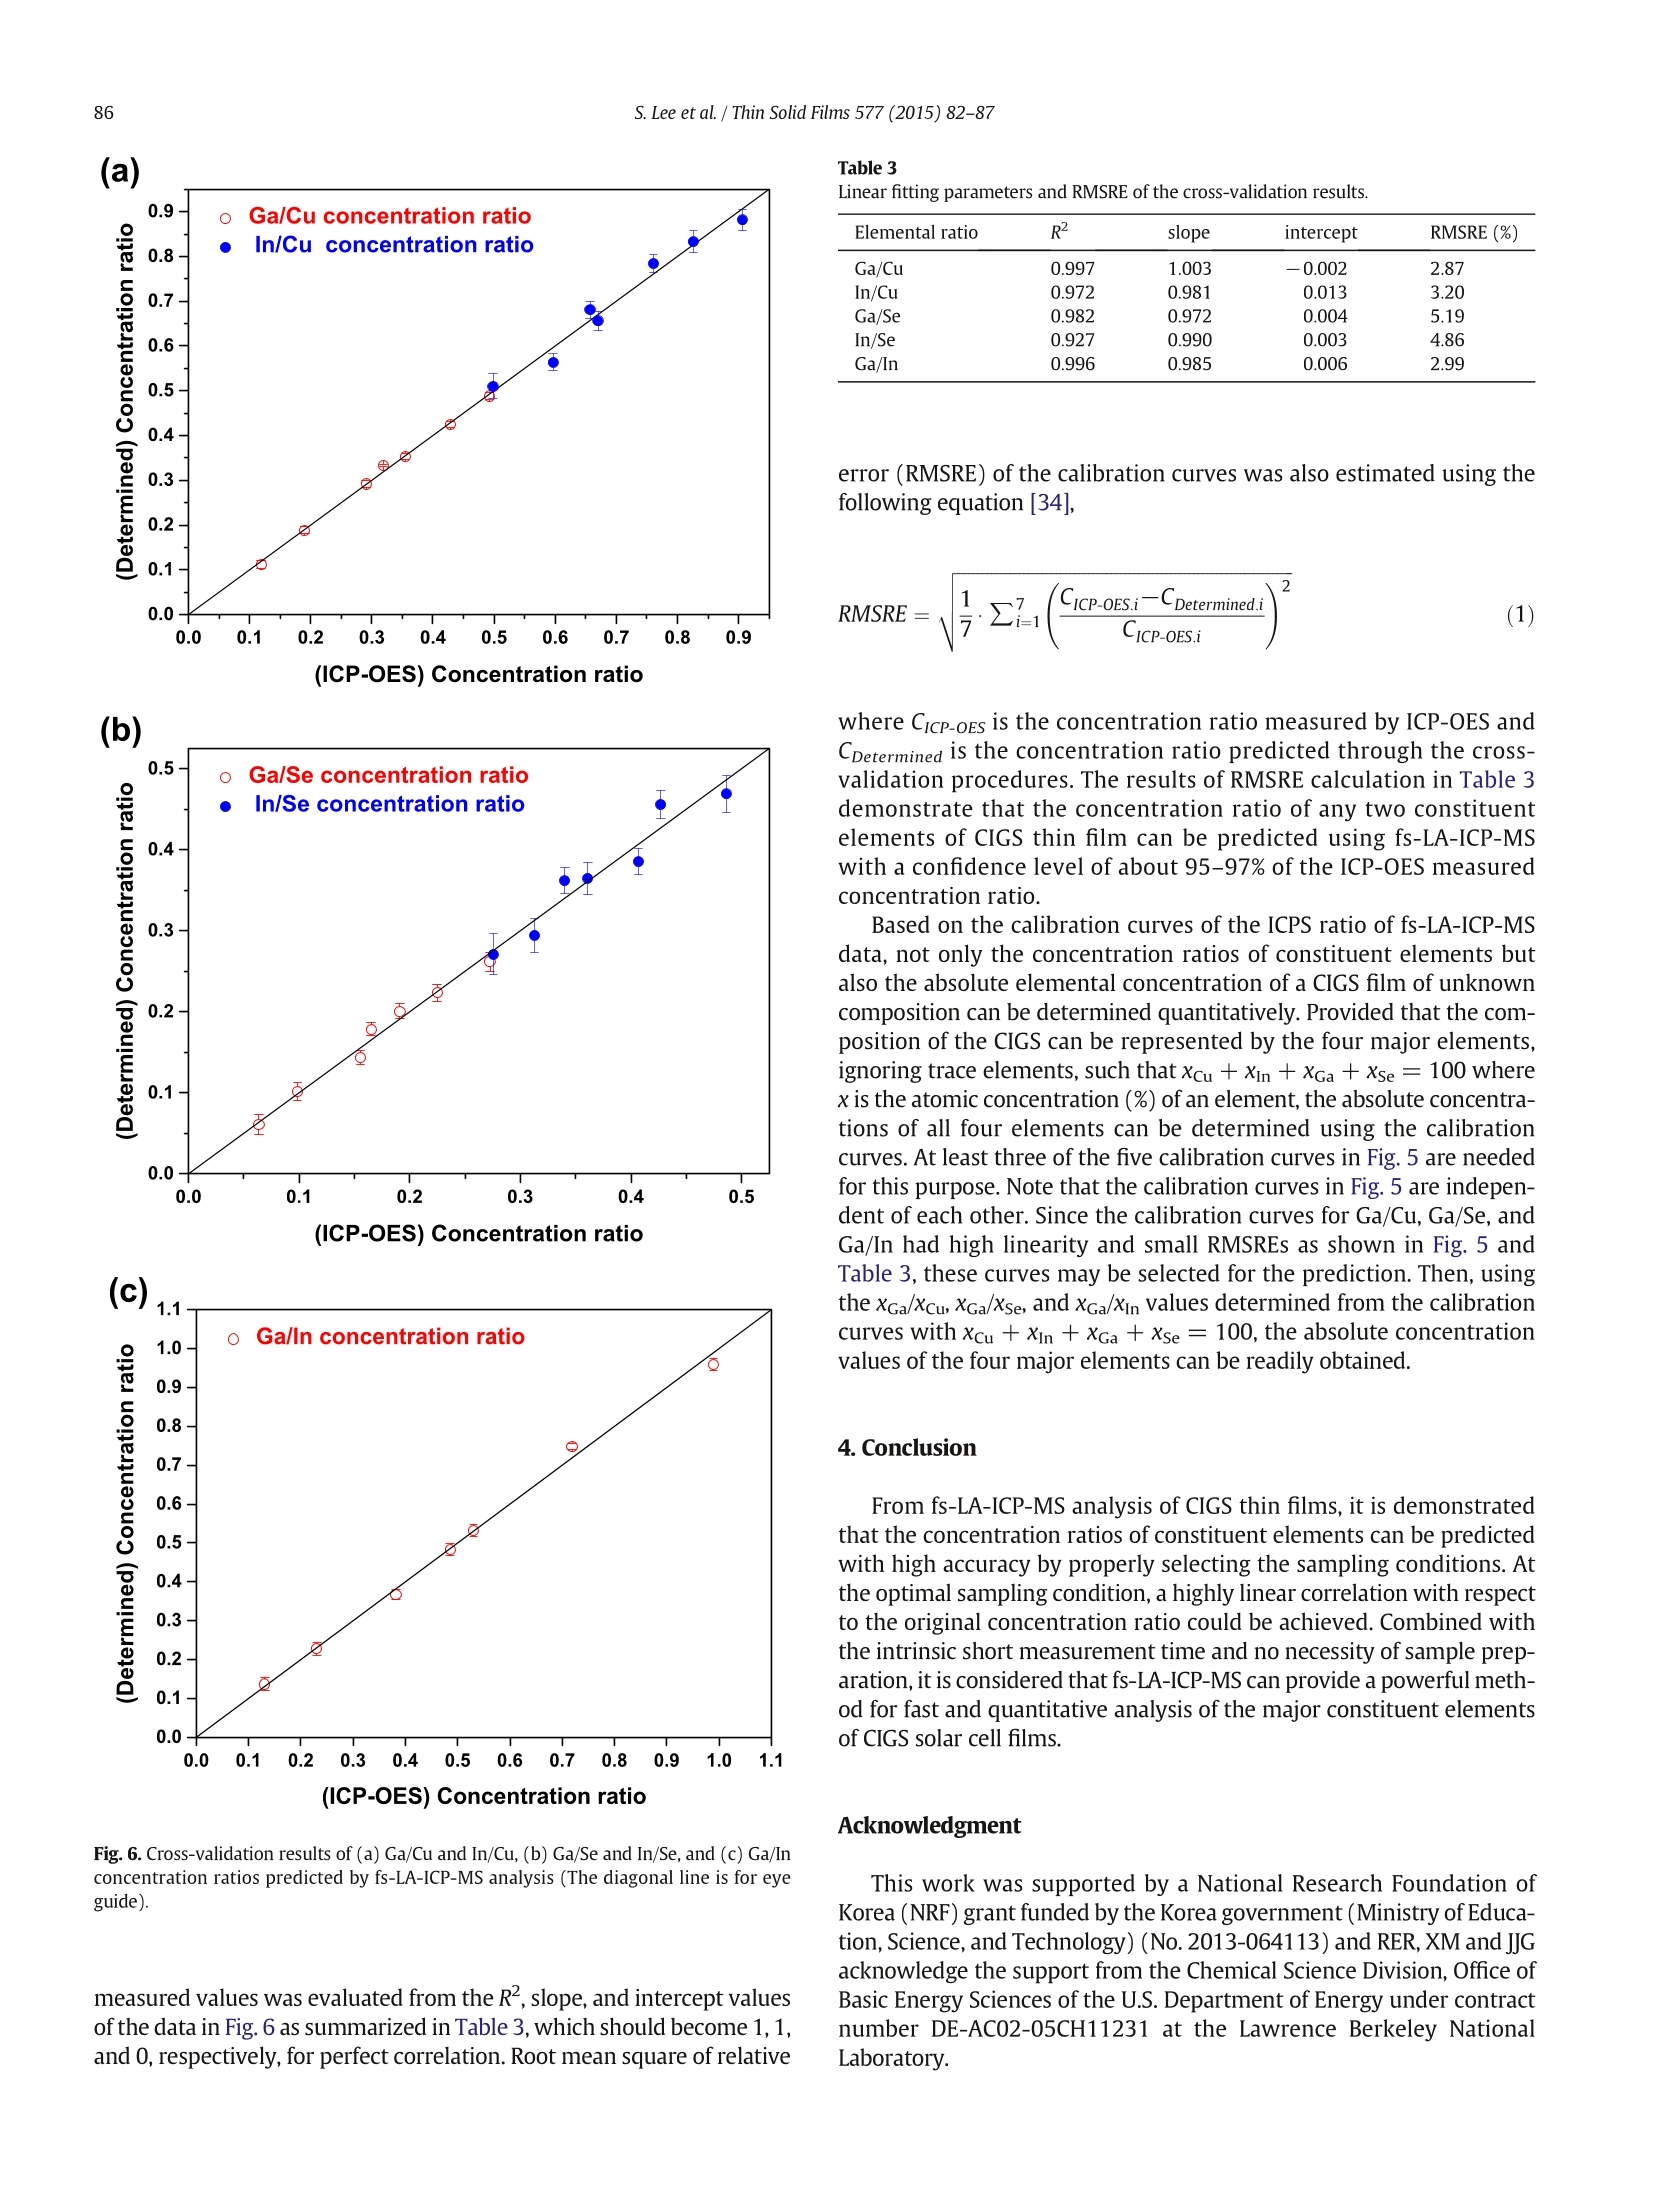
Thin Solid Films 577 (2015)82-87Contents lists available at ScienceDirectThin Solid Filmsjournalhomepage: www.elsevier.com/locate/tsf 83S. Lee et al./Thin Solid Films 577 (2015) 82-87 Application of femtosecond laser ablation inductively coupled plasmamass spectrometry for quantitative analysis of thin Cu(In,Ga)Se2 solarcell flms CrossMark Seokhee Lee, Jhanis J. Gonzalez b., Jong H. Yoo, Jose R. Chirinos b.d, Richard E. Russo b.e, Sungho Jeong a* School of Mechatronics, Gwangju Institute of Science and Technology, 1 Oryong-dong, Buk-gu, Gwangju 500-712, Republic of Korea "Lawrence Berkeley National Laboratory,1 Cyclotron Road, Berkeley, CA 94720, USA ‘ Applied Spectra Inc., 46665 Fremont Boulevard, Fremont, CA 94538, USA “ Facultad de Ciencias, Universidad Central de Venezuela, Caracas 1041A, Venezuela ARTIC L E INF O A BSTRACT Article history:Received 25 August 2014Received in revised form 23 December 2014Accepted 15 January 2015Available online 22 January 2015 Keywords: This work reports that the composition of Cu(In,Ga)Se2 (CIGS) thin solar cell films can be quantitatively predictedwith high accuracy and precision by femtosecond laser ablation-inductively coupled plasma-mass spectrometry(fs-LA-ICP-MS). It is demonstrated that the results are strongly influenced by sampling conditions during fs-laserbeam (入= 1030 nm,T = 450 fs) scanning on the CIGS surface. The fs-LA-ICP-MS signals measured at optimalsampling conditions generally provide a straight line calibration with respect to the reference concentrationsmeasured by inductively coupled plasma optical emission spectroscopy (ICP-OES). The concentration ratiospredicted by fs-LA-ICP-MS showed high accuracy, to 95-97% of the values measured with ICP-OES, for Cu, In,Ga, and Se elements. FemtosecondLA-ICP-MSCIGSSolar cellComposition 2015 Elsevier B.V. All rights reserved. 1.Introduction Cu(In,Ga)Se2 (CIGS) solar cell has many attractive properties such ashigh cell efficiency (>20%) [1], long-term stability [2], and lowmanufacturing cost [3], and thus there has been a tremendous researcheffort to improve the performance of CIGS solar cell. Several factorsinfluence the performance of CIGS thin film solar cell, including opticaltransmission through the front-contact, material and thickness of thebuffer layer, composition of the absorber layer, film growth process,and back-contact material [2,3]. In terms of CIGS film growth, for exam-ple, various methods such as a hybrid process combining evaporationand sputtering [4], CIGS nanoparticle-coating [5] and electro-deposition as a nonvacuum process [6] have been attempted in orderto achieve a higher quality CIGS as well as lower production cost. Theinformation for structure and surface morphology of CIGS producedwith different processes was also of interest [6,7]. Besides the fabrication processes, the composition of major constit-uent elements (Cu, In, Ga, and Se) of a CIGS film is also known to be asignificant factor determining the electrical and optical properties of aCIGS solar cell [8,9]. Accordingly, researches about the analysis ofelemental composition of CIGS thin films have been increasing recently.Various analytical techniques such as Auger electron spectroscopy, ( * C orresponding author. ) ( E-mail address: s hjeo ng @g ist .a c . k r ( S.Jeong). ) ( h t t p:// d x. d oi.org/ 1 0. 1 016/ j .ts f .2 0 15.01. 0 26 0 040-6090/O 2015 Elsevier B.V. All rights reserved. ) X-ray photoelectron spectroscopy, energy dispersive X-ray spectrome-try, inductively coupled plasma optical emission spectroscopy (ICP-OES), and secondary ion mass spectrometry have been used to analyzethe chemical composition of CIGS thin films [10-13]. Depending on themethod employed for analysis, however, the accuracy, measurementtime, spatial resolution, and availability of the technique differ signifi-cantly. In principle, a fast, accurate, and reliable technique that can bereadily applied for the evaluation of CIGS solar cell during device devel-opment or manufacturing processes is most desired by solar cellresearchers and industry [10,14]. The analysis of thin film solar cells is one of the application fields towhich the characteristics of laser ablation-inductively coupled plasma-mass spectrometry (LA-ICP-MS) can be effectively applied. LA-ICP-MSis a powerful method for elemental analysis with advantages of real-time analysis [15,16], minimal sample consumption, no sample prepa-ration [17], little waste, and minimal exposure to toxic samples [18]. Ac-cordingly, LA-ICP-MS has been employed in various areas of applicationsuch as geochemistry [19], forensic science [20], environmental science[21], semiconductors [22], biomedicine [23], nuclear non-proliferationdetection [24], and so forth. The coupling of femtosecond (fs) laser toICP-MS (fs-LA-ICP-MS) has been demonstrated as one of the most accu-rate analytical methods due to the capability of near stoichiometric ab-lation and the generation of mono-disperse nanometer sized particlesthat can be easily digested in the ICP[18,25,26]. The analytical perfor-mance of LA-ICP-MS was significantly enhanced with a fs-laser by reducing errors related to particle size distribution and matrix de-pendence [27,28]. In this work, we report the results for fs-LA-ICP-MS analysis of thinCIGS solar cell films. It is shown that the elemental concentrations ofCIGS films can be accurately predicted by properly choosing samplingparameters. Calibration curves were generated for the fs-LA-ICP-MSsignal ratios of the constituent elements with reference materials thatwere validated by ICP-OES and their accuracy was analyzed. 2. Experimental details 2.1. CIGS film preparation The CIGS thin film samples used in experiments were fabricated onsoda lime glass (SLG) substrates by a three stage co-evaporation meth-od with 1 um thick Mo back contact layer. The CIGS thin films were pro-duced with varying Ga/In ratios by controlling Ga and In evaporationfluxes; the detailed fabrication processes of these samples were report-ed elsewhere [29]. The average composition of fabricated CIGS thinfilms was then verified by ICP-OES (Verian,720-ES) for In, Ga and Se,and atomic absorption spectroscopy (Thermo Scientific, iCE 3000) forCu, and the results are listed in Table 1. The thicknesses of CIGS andMo layers were measured using scanning electron microscope (SEM)(Hitachi,S-4800, operation voltage =15 kV) images of a cross section. 2.2. fs-LA-ICP-MSsystem A commercial laser ablation system (Applied Spectra Inc.,J100, pulsewidth = 450 fs, wavelength=1030 nm) coupled to an ICP-MS (Ther-mo Scientific, XSERIES 2) was used for the fs-LA-ICP-MS measurements.The laser spot diameter and fluence at the sample surface were fixed atabout 30 um and 19.53 J/cm², respectively. The CIGS thin film sampleswere ablated in a chamber to which He was supplied at a flow rate of0.9 L min- as a carrier gas. The ablated mass swept by the He gaswas then entrained into an Ar make-up gas flowing at the rate of0.9 L min-1. The experimental settings for the ICP-MS were forwardpower of 1400 W, Ar flow rates of 13 and 0.7 L min-1 for plasma andauxiliary gases, respectively, voltages of -82,-1150,-80,-195Vfor the extraction, L1,L2, and L3 lenses. The ICP-MS measurements forsix isotopes (65cu, 115In, 71Ga, 82Se,95Mo,23Na) were acquired in thetime resolved mode and each ICP-MS response was integrated withbackground subtraction to obtain the average response per isotope. 3. Results and discussion 3.1. Effects of sampling conditions During fs-LA-ICP-MS measurements, the ICP-MS response variessensitively with respect to ablation conditions. Since the laser spotsize and energy were fixed by the system during the measurement,laser repetition rate and scan speed were varied in the ranges of5-500 Hz and 10-500 um/s, respectively, to examine the effects of Table 1Concentration and thickness of the CIGS thin film samples. Sample No. Concentration (at.%) Concentration Thickness ratio (nm) Cu In Ga Se Ga/In CIGS Mo 1 25.72 23.31 3.05 47.92 0.131 1720 982 2 25.31 20.91 4.82 48.96 0.231 1885 991 3 25.50 19.40 7.41 47.69 0.382 2175 967 4 25.59 16.82 8.16 49.43 0.485 2020 1100 5 25.77 17.27 9.14 47.82 0.529 1885 1085 6 25.43 15.18 10.91 48.49 0.719 1358 1100 7 26.32 13.12 12.97 47.59 0.989 1335 933 ablation conditions. Depending on the combination of repetition rateand scan speed, the number of overlapping pulses on each laser spotchanged from zero to about 30 pulses. Fig.1(a) shows that the integrat-ed counts per second (ICPS) of the four major elements at the conditionsof repetition rate of 5 Hz and scan speed of 300 um/s. At this condition,no overlapping took place between pulses as observed in the cross-sectional profile of craters (inset of Fig. 1(a)) measured using a whitelight interferometric microscope (Zygo New View 6000) and the craterdepth was mostly below 2 um. Each isotope profile (65Cu, 115In,Ga,and 82Se) in Fig. 1(a) represents an accumulated signal from ten abla-tion spots along the scan direction for which the complete ablationtook about 2 s (total ablated volume ≈ 400 um). The 2Na signal isattributed to Na element diffused from soda lime glass during thegrowth of the CIGS film. The accuracy and precision of the ICP-MS response shown inFig. 1(a) are closely related to the ablation conditions. Gonzalez et al.[30] reported that the ICP-MS signal intensity and crater profile differedif the scan speed and repetition rate had changed even at the samenumber of overlapping pulses. The primary reason for these changes inICP-MS response is the variation in particle characteristics such as parti-cle size and size distribution sampled during laser-material interactions.The influence of ablation conditions on the analysis performance of (a) (b) Fig. 1. (a) Transient fs-LA-ICP-MS response during consecutive ablation of ten craters on aCIGS film (Sample No.3) (repetition rate = 5 Hz, scan speed = 300 um/s) and (b)Gaisotope signals measured at different ablation conditions. ICP-MS can be examined by calculating temporal relative standard devi-ation (TRSD) of the ICP-MS response profiles which represents the short-term signal fluctuation on the temporal response [31]. The improvementin TRSD is related to a more consistent particle size distribution and par-ticle chemical composition during repetitive pulsed laser ablation |[27].Fig. 1(b) shows the transient ICP-MS signals ofGa measured at differ-ent pulse repetition rates and scan speeds. Note that the signal intensityofGa increased with scan speed for the same repetition rate. This resultis similar to that by Gonzalez et al. [30] where the low signal intensity atlow scan speed for a fixed repetition rate was attributed to the accumu-lation of particles in front of the surface, decreasing the ablation and/ortransport efficiency due to the absorption/diffusion of the laser beam.The signal increase of lGa for increasing repetition rate at the fixedscan speed of 300 um/s may be due to an increased amount of ablatedmass. The average ICPS and TRSD ofGa calculated at various combina-tions of scan speed and repetition rate are presented in Fig. 2(a). For thesame repetition rate (see the 10 Hz case), the signal intensity and TRSDimproved initially for increasing scan speed but became deteriorated forfurther increase when the signal intensity reached near the maximum.The same trend was observed for the 2Se, as shown in Fig. 2(b). Basedon these results, repetition rate of 200 Hz and scan speed of 500 um/swere selected as the optimal sampling conditions in this study to achievehigh ICP-MS signal and low fluctuation. Fig. 2. Variation of ICPS intensity and TRSD of (a) Ga and (b) 82Se signals at varyingsampling conditions (Sample No.3) (The values next to a data point represent TRSD andscan speed). Fig. 3. SEM image of the ablation craters and their cross-sectional profile produced on aCIGS film (Sample No.3) (repetition rate = 200 Hz, scan speed=500 pm/s). 3.2. Compositional analysis of CIGS thin film Fig. 3 shows the ablation craters and cross-sectional crater profile ofone of the CIGS solar cell films sampled at the conditions of 200 Hz laserrepetition rate and 500 um/s scan speed. Each sample was scanned bythe laser beam in a zig-zag pattern over an area of 200 umx200 umwith a line spacing of 14.3 um. At this condition, the complete ablationof a rectangular crater took about 6.65 s. The cross-sectional profile ofthe rectangular crater showed that the surface between craters was sig-nificantly elevated due to accumulation of ablated particles [30]. Sincethe thickness of CIGS layer of the sample in Fig. 3 was only about2.2 um, the crater depth (>6 um) sampled not only the CIGS film butalso the Mo layer and part of the SLG substrate. The same fs-LA-ICP-MS measurement was repeated over a 3 ×3crater array for each CIGS sample and the average from the nine rectan-gular craters was then used to represent the ICP-MS isotope signal ofeach sample.Fig. 4 shows the ICP-MS responses ofCu, Ga,"Se, andIn isotopes, representing the four major elements of CIGS solar cell films, from the nine rectangular craters sampled at the laser repetitionrate of 200 Hz and scan speed of 500 pm/s. It is observed that the tran-sient responses of ICP-MS are consistent over the nine rectangularcraters, which demonstrates that the CIGS thin film had a spatiallyhomogeneous elemental composition. The detailed time responseprofiles of the ICP-MS can be found from the signals of the first crater Fig. 5. Calibration curves of ICPS ratios for fs-LA-ICP-MS measurements:(a) Ga/Cu and In/Cu, (b) Ga/Se and In/Se, and (c) Ga/In(The number next to a data point represents samplenumber). in Fig. 4. The measurement of Mo in Fig. 4 indicates that the ablationtook place not only through the CIGS layer but also into the Mo layer atthis condition. The relative standard deviation (RSD) of the ICPS intensi-ties of each isotope signal from the nine craters in Fig. 4 was estimated tobe within 1.3-6.8%, implying that highly reproducible measurement canbe performed with fs-LA-ICP-MS at the optimal sampling condition. Incomparison, when the ablation was carried out at the reduced repetitionrate and scan speed of 5 Hz and 300 pm/s, respectively, the conditions atwhich ablation depth became nearly the same as the CIGS film thicknessas shown in the inset of Fig.1(a), the RSD values of average signals fromten measurements (with ten ablation spots per measurement)increasedto the range of 5.8-18.6%. The deterioration of reproducibility at thisreduced repetition rate and scan speed is considered to be related tothe variation in particle characteristics as discussed above. Since the thickness of each CIGS sample was different from others asshown in Table 1, the ablated mass of an element from each samplebecomes proportional to not only the elemental concentration butalso the sample thickness. Thus, absolute ICPS of the ICP-MS isotope sig-nal cannot be directly correlated to the elemental concentration ofeachsample.Alternatively, since the ICPS ratios between elements should re-main proportional to the elemental concentration ratios of each CIGSsample, the measured fs-LA-ICP-MS signal was calibrated with respectto the relative concentrations of constituent elements. Because the con-centrations of Cu and Se were almost constant at around 25 at.% and50 at.%, respectively, among the CIGS solar cell samples, these elementswere utilized as the internal standards for the generation of calibrationcurves. The calibration curve of Ga/In ratio also was established becausethe Ga/In ratio is a crucial factor determining CIGS solar cell efficiency.Fig.5 shows the calibration curves for Ga/Cu, In/Cu, Ga/Se, In/Se, andGa/In established from the ICPS ratio data acquired at the optimal sam-pling condition. Fig. 5 demonstrates that the obtained calibration curveshave a good linear correlation with the ICP-OES measured elementalconcentration ratios. The Rvalues of the linear fitting on the calibrationcurve were close to or over 0.99 except the In/Se ratio (0.96). By takingthe ICPS ratios instead of the absolute intensities, the RSD values of thenine measurements decreased to below 2% in average (maximum 3.24%for Ga/Se) as shown in Table 2. These results confirm that fs-LA-ICP-MSmeasurement provides accurate calibration results for compositionanalysis of CIGS films. In order to evaluate the accuracy of predicted concentration, cross-validation was carried out using the measured fs-LA-ICP-MS data as fol-lows [32-34]. For example, to calculate the concentration ratio of Ga/Inin sample 1 from the fs-LA-ICP-MS data, the ICP-OES measured concen-tration ratios of samples 2-7(y2-7) in Fig.5(c) were fitted into a linearequation as a function of ICPS ratio (x) (y2-7=a+bx),leaving out sam-ple 1. Then,using the y2-7=a +bx equation and measured ICPS ratio ofsample 1, the concentration ratio (Ga/In) of sample 1 was predicted andplotted with respect to the concentration measured by ICP-OES. Thesame procedure was repeated for all samples and the five different cal-ibration curves, and the results are shown in Fig. 6. The closeness of theconcentration ratios predicted by cross-validation to the ICP-OES Table 2Relative standard deviation of the ICPS ratios for nine measurements. Sample No. Relative standard deviation (%) Ga/Cu In/Cu Ga/Se In/Se Ga/In 1 1.06 2.40 1.85 1.10 2.30 2 1.11 1.34 1.85 1.81 1.48 3 1.66 0.86 1.55 1.12 1.25 4 1.32 1.70 1.83 2.07 2.07 5 1.52 1.69 3.24 2.65 1.38 6 1.49 1.62 1.54 1.42 1.15 7 1.90 1.48 2.00 1.22 1.87 average 1.44 1.58 1.98 1.63 1.64 (ICP-OES) Concentration ratio (b) (ICP-OES) Concentration ratio (c) Fig.6. Cross-validation results of (a) Ga/Cu and In/Cu, (b) Ga/Se and In/Se, and (c) Ga/Inconcentration ratios predicted by fs-LA-ICP-MS analysis (The diagonal line is for eyeguide). measured values was evaluated from the R, slope, and intercept valuesof the data in Fig. 6 as summarized in Table 3, which should become 1, 1,and O, respectively, for perfect correlation. Root mean square of relative Table 3Linear fitting parameters and RMSRE of the cross-validation results. Elemental ratio R slope intercept RMSRE (%) Ga/Cu 0.997 1.003 -0.002 2.87 In/Cu 0.972 0.981 0.013 3.20 Ga/Se 0.982 0.972 0.004 5.19 In/Se 0.927 0.990 0.003 4.86 Ga/In 0.996 0.985 0.006 2.99 error (RMSRE) of the calibration curves was also estimated using thefollowing equation [34], where CicP-oEs is the concentration ratio measured by ICP-OES andCDetermined is the concentration ratio predicted through the cross-validation procedures. The results of RMSRE calculation in Table 3demonstrate that the concentration ratio of any two constituentelements of CIGS thin film can be predicted using fs-LA-ICP-MSwith a confidence level of about 95-97% of the ICP-OES measuredconcentration ratio. Based on the calibration curves of the ICPS ratio of fs-LA-ICP-MSdata,not only the concentration ratios of constituent elements butalso the absolute elemental concentration of a CIGS film of unknowncomposition can be determined quantitatively. Provided that the com-position of the CIGS can be represented by the four major elements,ignoring trace elements, such that Xcu + Xin + XGa + Xse= 100 wherex is the atomic concentration (%) of an element, the absolute concentra-tions of all four elements can be determined using the calibrationcurves. At least three of the five calibration curves in Fig. 5 are neededfor this purpose. Note that the calibration curves in Fig. 5 are indepen-dent of each other. Since the calibration curves for Ga/Cu, Ga/Se, andGa/In had high linearity and small RMSREs as shown in Fig. 5 andTable 3, these curves may be selected for the prediction. Then, usingthe xGa/xcu, XGa/Xse,and xGa/xin values determined from the calibrationcurves with xcu + xin +xGa +xse = 100, the absolute concentrationvalues of the four major elements can be readily obtained. 4. Conclusion From fs-LA-ICP-MS analysis of CIGS thin films, it is demonstratedthat the concentration ratios of constituent elements can be predictedwith high accuracy by properly selecting the sampling conditions. Atthe optimal sampling condition, a highly linear correlation with respectto the original concentration ratio could be achieved. Combined withthe intrinsic short measurement time and no necessity of sample prep-aration, it is considered that fs-LA-ICP-MS can provide a powerful meth-od for fast and quantitative analysis of the major constituent elementsof CIGS solar cell films. Acknowledgment This work was supported by a National Research Foundation ofKorea (NRF) grant funded by the Korea government (Ministry of Educa-tion, Science, and Technology) (No. 2013-064113) and RER, XM and JJGacknowledge the support from the Chemical Science Division, Office ofBasic Energy Sciences of the U.S. Department of Energy under contractnumber DE-AC02-05CH11231 at the Lawrence Berkeley NationalLaboratory. ( [1] P . Jac k son, D . H a rishos , E . Lot t e r, S . Pa e t el , R. Wuerz, R. Me n ner, W. W i sc hman n , M. P o w all a , N ew w o r l d r ec o r d e ffic i e nc y fo r C u ( In , Ga ) S e 2 th i n - film s ola r c e l ls b e y o nd 2 0%,P r o g . P ho t o vo lt . R e s . App l . 1 9 (20 1 1 ) 8 9 4. ) ( [2] S . Ni k i, M. Co ntreras, I. Repins,M.Po wal la, K . Kushiy a , S. I sh i zu ka , K. Ma t s u b ara, C I GS a b sor ber s an d p r oc esses , Pr og . Ph o to v o l t. R e s. Ap p l . 18 (20 10 ) 4 5 3. ) ( [3] A . R o m eo, M. T erh e gg en, D. Abo u-R as, D . L . Ba t zn er , R . J. Ha u g, M. Ka li n , D . R u d m an n , A .N. T i wari , D evelopment of t h i n-film C u (In, Ga ) S e an d C dT e sol a r ce ll s, Pr og. P h ot o v o l t . Re s. Appl. 12 ( 2 004) 93 . ) ( [4] A.E . De lahoy, L . C he n , M . A kh t ar, B . S a ng, S. G u o , Ne w te c h no l o gi es fo r C I G S p ho t ovo l taics, S ol . E nergy 7 7 ( 2 0 0 4 ) 7 8 5. ) ( [5] C .P. L i u , C . L . Ch u ang , F abr ic atio n o f c o pper- i n di um-gall i um - diselen id e ab s orb e r l a y e r by q u ate rn a r y-a l l oy na nop arti cl e s f o r so l a r c el l a pp li c a t i on s , Sol . En e rgy 86 ( 2 012) 2 79 5 . ) ( [6] O. Bam i d u r o , G . Chen n a m adha v a,R. M u n dle, R. Ko n da, B. Robins o n, M. B a h o ura , A. K . P r a d h a n , S ynt h es is a nd c h a r ac t e ri zati on of one- s tep el e ctro d e p osit e d Cu In ( 1 - x ) G a x Sez / Mo/glas s fi l m s a t a tm o s pher i c c o n di t io n s , S o l . E n e r gy 8 5 (20 11 )5 45. ) ( [7] L . P . De sh mukh , R . V. S urya wansh i , E .U. M asumd a r, M. S ha r o n , C u 1 - x I n ,Sez t h i n f i lm s : de p o s it ion b y s p r ay p y ro l ys i s a nd ch a rac te risti cs , Sol . Ener g y 86 (2 012)19 1 0. ) ( [8] M .I . A lons o , M . G a rri g a, C . A . D u ran te Rinc o n, E . H er n a nde z , M . Le o n , O pt ic al f unc t io n s o f ch a lcopy ri te Cu G axIn1 -x S e z a llo y s, A pp l . P h y s . A Mat er . Sc i. P ro cess. 7 4 ( 20 02) 6 59. ) [9] S.Theodoropoulou, D. Papadimitriou, K. Anestou, C. Cobet, N. Esser, Optical propertiesof CuIn1 -xGawSe2 quaternary alloys for solar-energy conversion, Semicond. Sci.Technol. 24(2009)015014. ( [10] D . Abo u -Ra s ,R. C ab a l lero, C. - H . Fi s che r , C.A. Kau fm a n n, I. L au e rma n n, R. M a in z , H . M on i g, A. Sch o p k e , C . S t ephan , C. S tre ec k , S. S c hor r , A. Ei cke, M. Dobeli , B . G a de, J . H i n r ic h s , T . Nun ne y , H. D i j kst r a , V. Ho f f m an n,D . K l e mm,V. E fi m o va, A. B e rg m a i er, G . Do lli n ger , T. Wirth, W . Ung e r, A.A. Rocket t , A. Pere z -Rod r iguez, J. Alv a rez-G a rci a, V .I z quierdo-Roc a, T . S c h m i d, P.-P . Ch o i, M. M ul l e r , F . Bertram , J. C hrist en , H . K ha t ri , R . W. C o l l i ns , S. M ars il lac , I. K ot sch a u , Compr ehensi v e c o m pa r iso n of va r i o u s t ec h - n i q ue s f o r th e a n al y sis o f e l e m ental dist r ib u t i ons i n t h in films , Mi c rosc. Mic r oanal. 17 ( 2 01 1 ) 7 28. ) [11] H.-R. Hsu, S.-C. Hsu, Y.S. Liu, Improvement of Ga distribution and enhancement ofgrain growth of CulnGaSez by incorporating a thin CuGa layer on the single CulnGaprecursor, Sol. Energy 86 (2012) 48. ( [12 ] C . I nsig n a r e s-C u el l o , V . Izq ui e r do-Ro c a , J. L o pe z-G arcia, L . Calv o- Bar r i o , E .S auced o , S .Kr e tzsch m ar , T. U no ld, C . B r ou s sil lou, T . G o i s lard de Monsa bert, V.B e rm u dez , A . Perez-Ro d ri g ue z , C o mbi n ed Ra m an s ca t tering/photol u min e scence anal y s i s of C u( I n, G a ) S e e le ctro de pos ited la ye r s , Sol. E n e rgy 1 0 3 ( 2 0 1 4 ) 8 9 . ) ( [13] T . N a k ada, Y . Hir ab a y as hi, T . T oka do , D. O hm o r i, T . M i se, N ov el d e v ice st r u ct ure for C u(I n , G a)Se 2 t h i n fil m s olar cel l s using t ransparen t con du cting ox i de back and f ro n t c o n t ac ts, Sol . E ne rg y 7 7 (20 0 4) 7 39 . ) ( [ 1 4] K. Du r o se, S . E . Ash e r , W . J aeg er man n , D . L e vi , B.E . McCa ndl es s, W . M etz g e r , H . Mou t i n h o , P . D . P auls on, C .L. Per k in s , J.R. S i t es ,G. T eeter, M . T er h e ggen, P hy s i cal ) characterization of thin-film solar cells, Prog. Photovolt. Res. Appl. 12 (2004) 177. ( [ 1 5] B . F ern an dez, F. Cl averi e , C. P e chey r a n , O . F . X. D o n a r d , D i r e c t a n al y sis of so l i d s ample s by fs-LA-IC P- MS , Tr en d s Anal. C hem .26 ( 2007 ) 9 5 1. ) [16] R.E.Russo, X. Mao,JJ. Gonzalez, V. Zorba,J. Yoo, Laser ablation in analytical chemistry,Anal. Chem. 85 (2013) 6162. ( [17] R . E. R us s o, X . M a o, H . L i u , J . G o nza l ez, S.S. Ma o, L as e r abl a t i o n in a na l y t i ca l ch em i str y-a r e view, T a la nta 5 7 (200 2 ) 4 2 5. ) [18] J.J. Gonzalez, D. Oropeza, X. Mao, R.E. Russo, Assessment of the precision andaccuracy of thorium (23"Th) and uranium (238U) measured by quadrupole basedinductively coupled plasma-mass spectrometry using liquid nebulization, nanosecondand femtosecond laser ablation, J. Anal. At. Spectrom. 23 (2008) 229. ( [19] C . A . Hei nr ich, T . P e t t k e, W.E . Ha lt er , M. A i g n er- T o rr es , A . Aud et a t , D . G un t he r , B . . 1 . . . : H attendo r f, D . Blein e r, M. G u i l l ong, I . Ho rn, Quan t itative m u l t i - e l e m e nt a n a l ysis of m i n e ra ls, f l u id a nd m el t i nc l us i o n s b y l ase r- a blat i o n i nd u ct i vel y - c o u p le d-p l a s ma m a s s -spe ct ro met ry, G eo ch i m. C osmo c h i m . Acta 6 7 ( 2 00 3 )3 4 7 3 . ) ( [20] T . Tr e j os, S . M o n t e ro, J. R . Alm i r a ll, An a l y sis an d c o mp arison of glass fra g men t s b y l ase r a b la tio n i nduct ivel y c o up le d pla s ma mas s s pectr omet r y(LA-ICP- M S) a n d I CP - M S , A n a l. B io an a l. Ch e m . 3 76 (200 3) 1 2 5 5. ) ( [21] | 1 M. D . S eltzer, K.H. B erry, Laser ablati o n I C P -M S profilin g and se m iq u a n titat i ve d e t er m in a ti o n o f trac e e l em en t conc e n t r a ti on s i n de s ert t ort o ise s he ll s : d o c um e ntin g t h e u pta ke o f el eme nt al to x ica n ts , S ci. To tal En v i r o n. 3 3 9 ( 2 005) 253 . ) [22V].Margetic, K. Niemax, R. Hergenroder, Application of femtosecond laser ablationtime-of-flight mass spectrometry to in-depth multilayer analysis, Anal. Chem. 75(2003)3435. [23]S.D. Muller, R.A. Diaz-Bone,J. Feliz, W. Goedecke, Detection of specific proteins bylaser ablation inductively coupled plasma mass spectrometry (LA-ICP-MS) usinggold cluster labelled antibodies, J. Anal. At. Spectrom. 20 (2005) 907. [24]| jJ.S. Becker, Inductively coupled plasma mass spectrometry (ICP-MS) and laserablation ICP-MS for isotope analysis of long-lived radionuclides, Int. J. MassSpectrom. 242 (2005)183. [25] S.H. Jeong,O.V. Borisov,J.H. Yoo,X.L. Mao, R.E. Russo, Effects of particle size distributionon inductively coupled plasma mass spectrometry signal intensity during laserablation of glass samples, Anal. Chem. 71 (1999) 5123. [26]C. Liu, X.L. Mao, S.S. Mao, X. Zeng, R. Greif, R.E. Russo, Nanosecond and femtosecondlaser ablation of brass: particulate and ICPMS measurements, Anal. Chem. 76(2004)379. [27]J. Gonzalez, S.H. Dundas, C. Liu, X. Mao,R.E. Russo, UV-femtosecond and nanosecondlaser ablation-ICP-MS: internal and external repeatability,J. Anal. At. Spectrom. 21(2006)778. [28]C.C. Garcia, H.Lindner, K. Niemax, Transport efficiency in femtosecond laser ablationinductively coupled plasma mass spectrometry applying ablation cells with shortand long washout times, Spectrochim. Acta B 62 (2007) 13. ( [29 S ] . H. Le e , C. K . K im , J . H. In, H . S. S h i m , S. H . J eong , Sel ecti v e r e mo v a l o fC u In j -x Ga x Sea b sorber l a yer w i th n o e d ge me l t i n g us i ng a n ano s ec ond Nd: YA G l a se r , J . P h y s . D .Appl. P hys. 46 ( 2 0 13 ) 1 0 5502 . ) ( [ 30] J J . G on z al e z, A. F e rnan d e z, D . Or o peza, X. Mao , R .E . R u sso, Fe mt o s econ d laser a blati on : e xp e rime n ta l s t u dy of th e r e p e ti t ion ra te inf l ue n ce on i nd u ct iv e ly coup l e d ; A +D plasma mas s s pect r ome t ry p e rfor m an c e , Spe c tro c him . A ct a B 6 3 ( 2 0 0 8 ) 27 7 . ) [31]C.Y. Liu, X.L. Mao, J. Gonzalez, R.E. Russo, Study of particle size influence on laserablation inductively coupled plasma spectrometry using an in-line cascadeimpactor,J. Anal. At. Spectrom. 20 (2005)200. [32]1R.G. Brereton, Introduction to multivariate calibration in analytical chemistry,Analyst 125 (2000)2125. [33|] A.M. Leach, G.M. Hieftje, Standardless semiquantitative analysis of metals usingsingle-shot laser ablation inductively coupled plasma time-of-flight mass spectrometry,Anal.Chem. 73 (2001)2959. [34]] J.N. Miller, J.c. Miller, Statistics and Chemometrics for Analytical Chemistry, fourthed. Prentice Hall, England, 2001. 图1. (a) CIGS膜上连续剥蚀10个剥蚀坑时的瞬态fs-LA-ICP-MS响应(样品3号)(重复率=5Hz,扫描速度=300μm/s);(b)在不同剥蚀条件下测得的71Ga同位素信号。图4. 9个采样矩剥蚀坑(3号样品) 65Cu、71Ga、82Se、115In和95Mo同位素的瞬态fs-LA-ICP-MS信号 图5. fs-LA-ICP-MS检测ICPS比的校准曲线:(a)Ga/Cu和In/ Cu,(b)Ga/Cu和In/ Cu,(c)Ga/In(数据点旁边的数字表示样品号)
确定
还剩4页未读,是否继续阅读?

北京富尔邦科技发展有限责任公司为您提供《Cu(In,Ga)Se2薄膜太阳能电池中铜、铟、镓、硒检测方案(激光剥蚀进样)》,该方案主要用于太阳能电池中铜、铟、镓、硒检测,参考标准--,《Cu(In,Ga)Se2薄膜太阳能电池中铜、铟、镓、硒检测方案(激光剥蚀进样)》用到的仪器有
相关方案
更多
该厂商其他方案
更多