


方案详情
文
研究结果表明,利用飞秒激光烧蚀-电感耦合等离子体质谱法可以对太阳电池薄膜的成分进行高精度的定量分析。结果表明,在飞秒激光束(λ = 1030 nm, τ = 450 fs)扫描CIGS表面时,采样条件对扫描结果有较大的影响。在最佳采样条件下测得的fs-LA-ICP-MS信号,通常与电感耦合等离子体发射光谱法(ICP-OES)测量的参考浓度呈一条校准直线。fs-LA-ICP-MS预测的铜、铟、镓、硒元素的浓度比准确度较高,达到ICP-OES测定值的95% - 97%。
方案详情

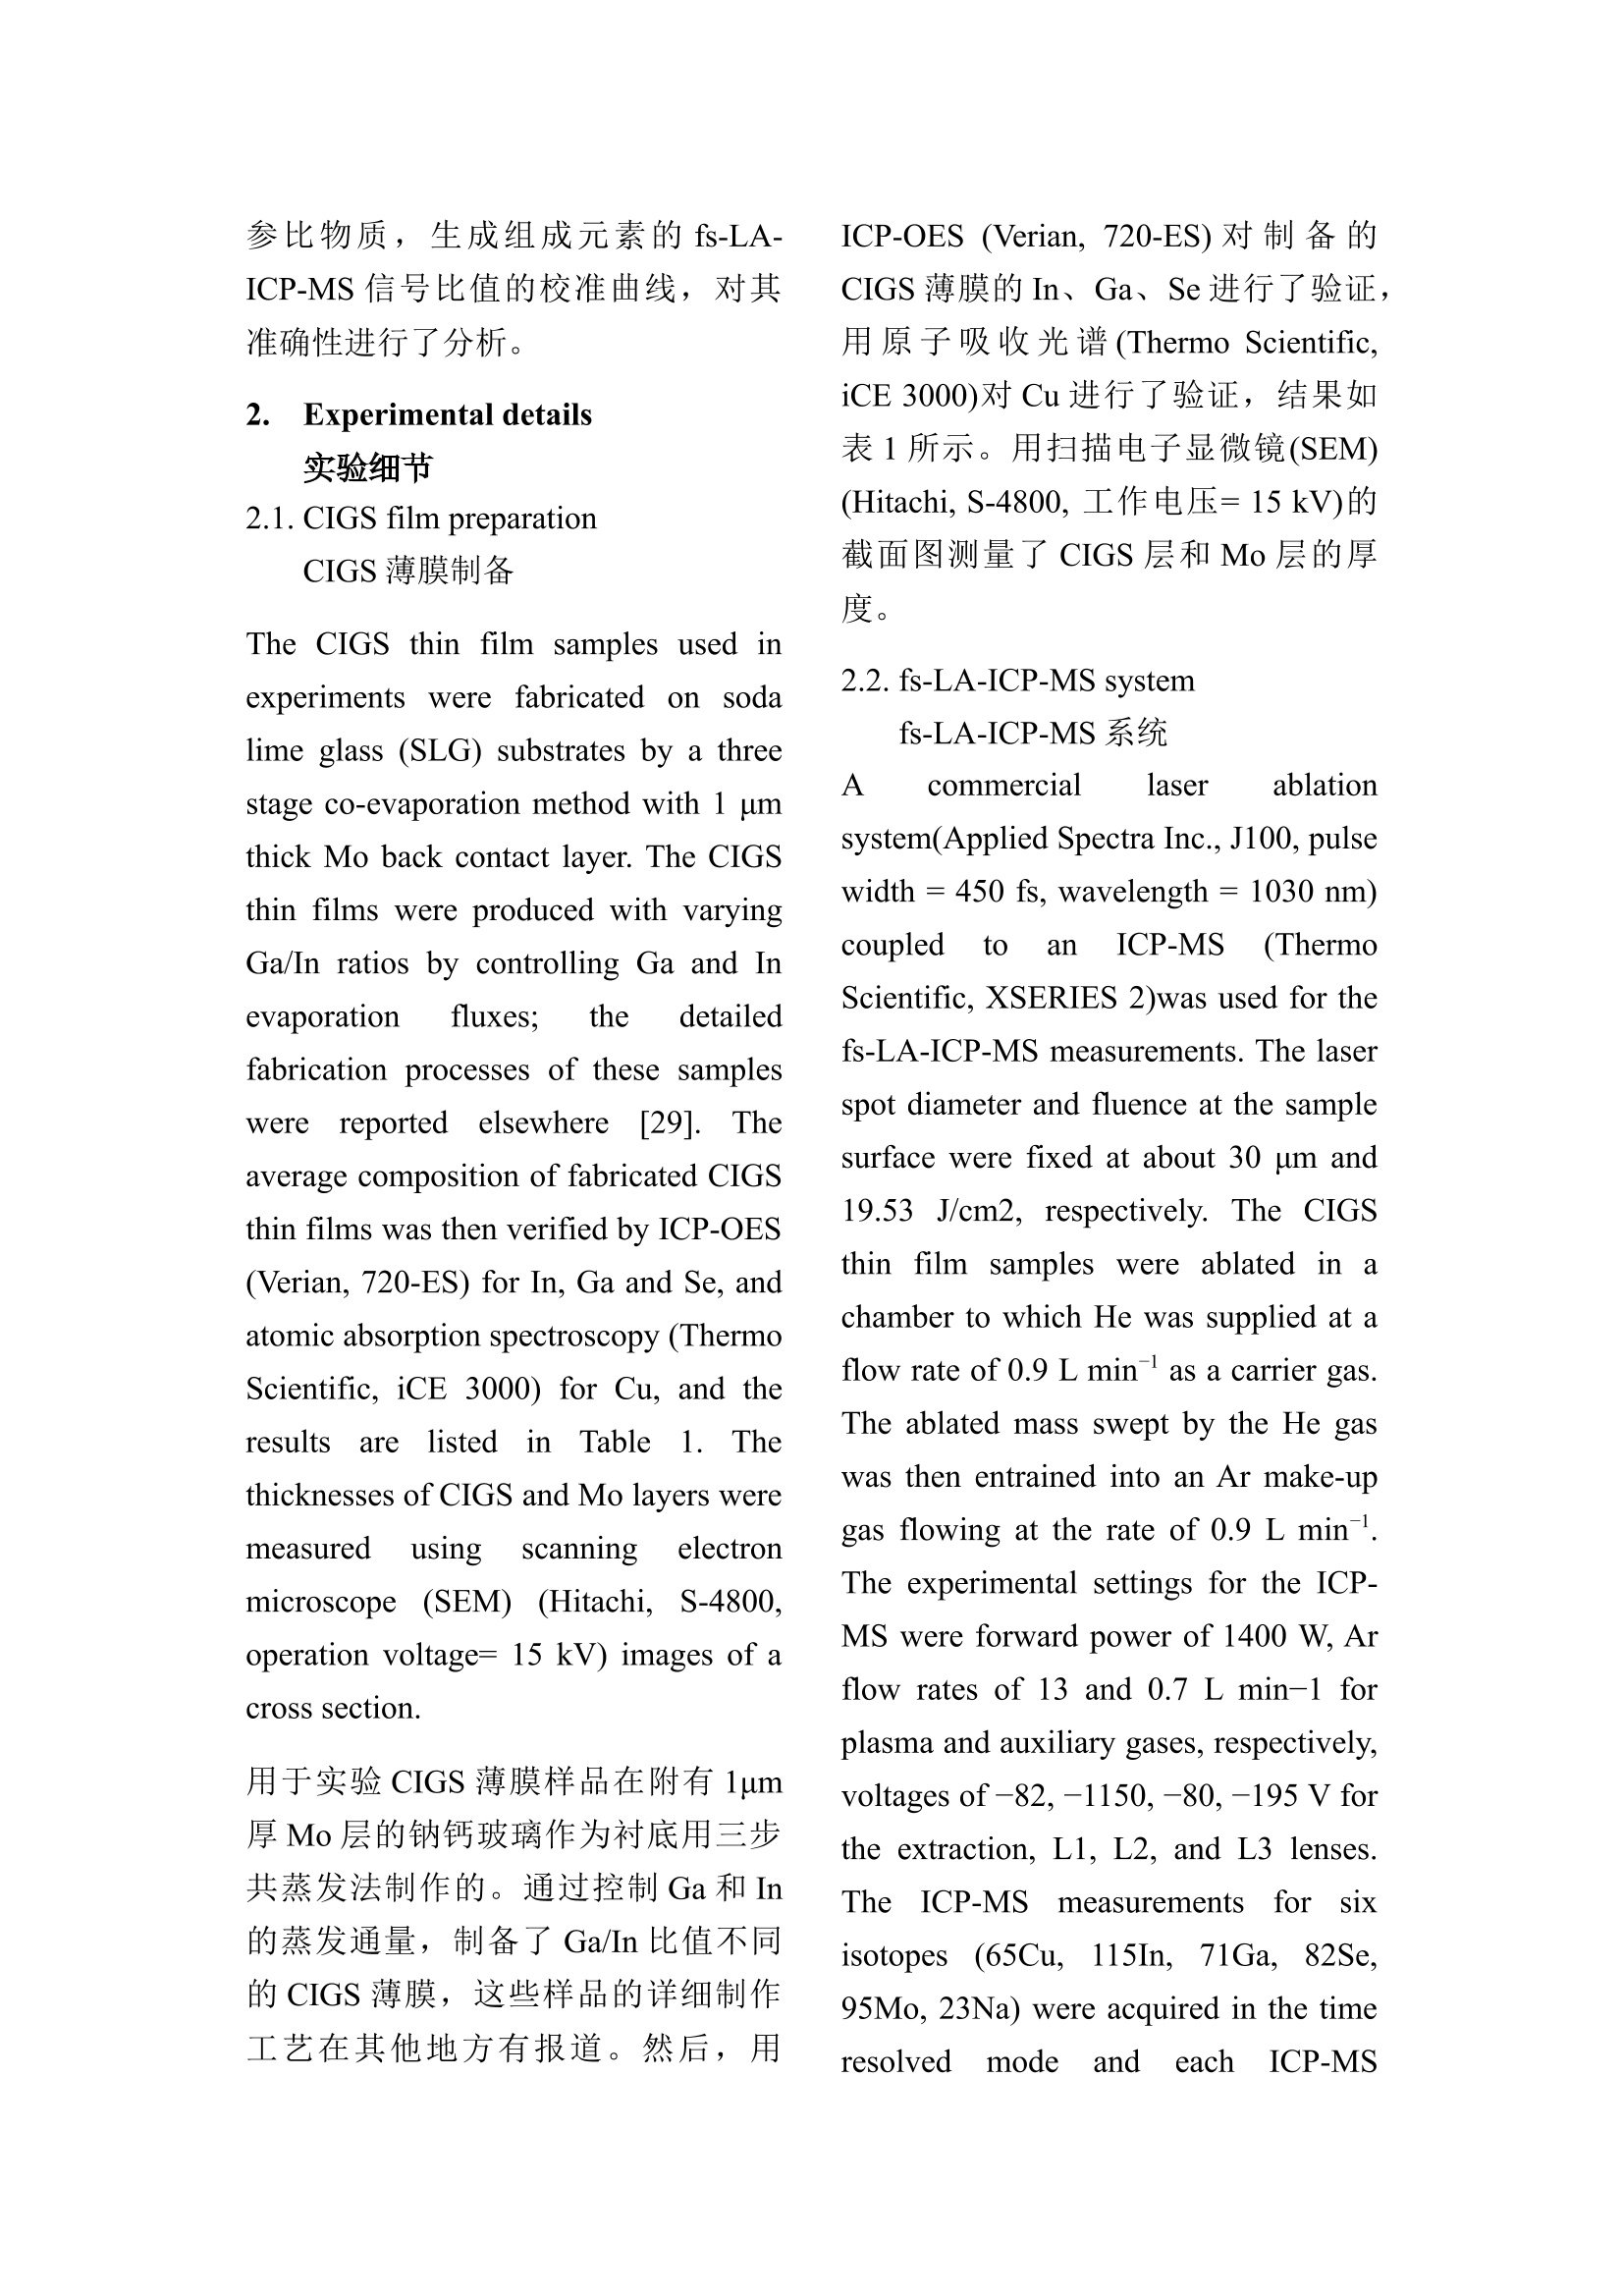
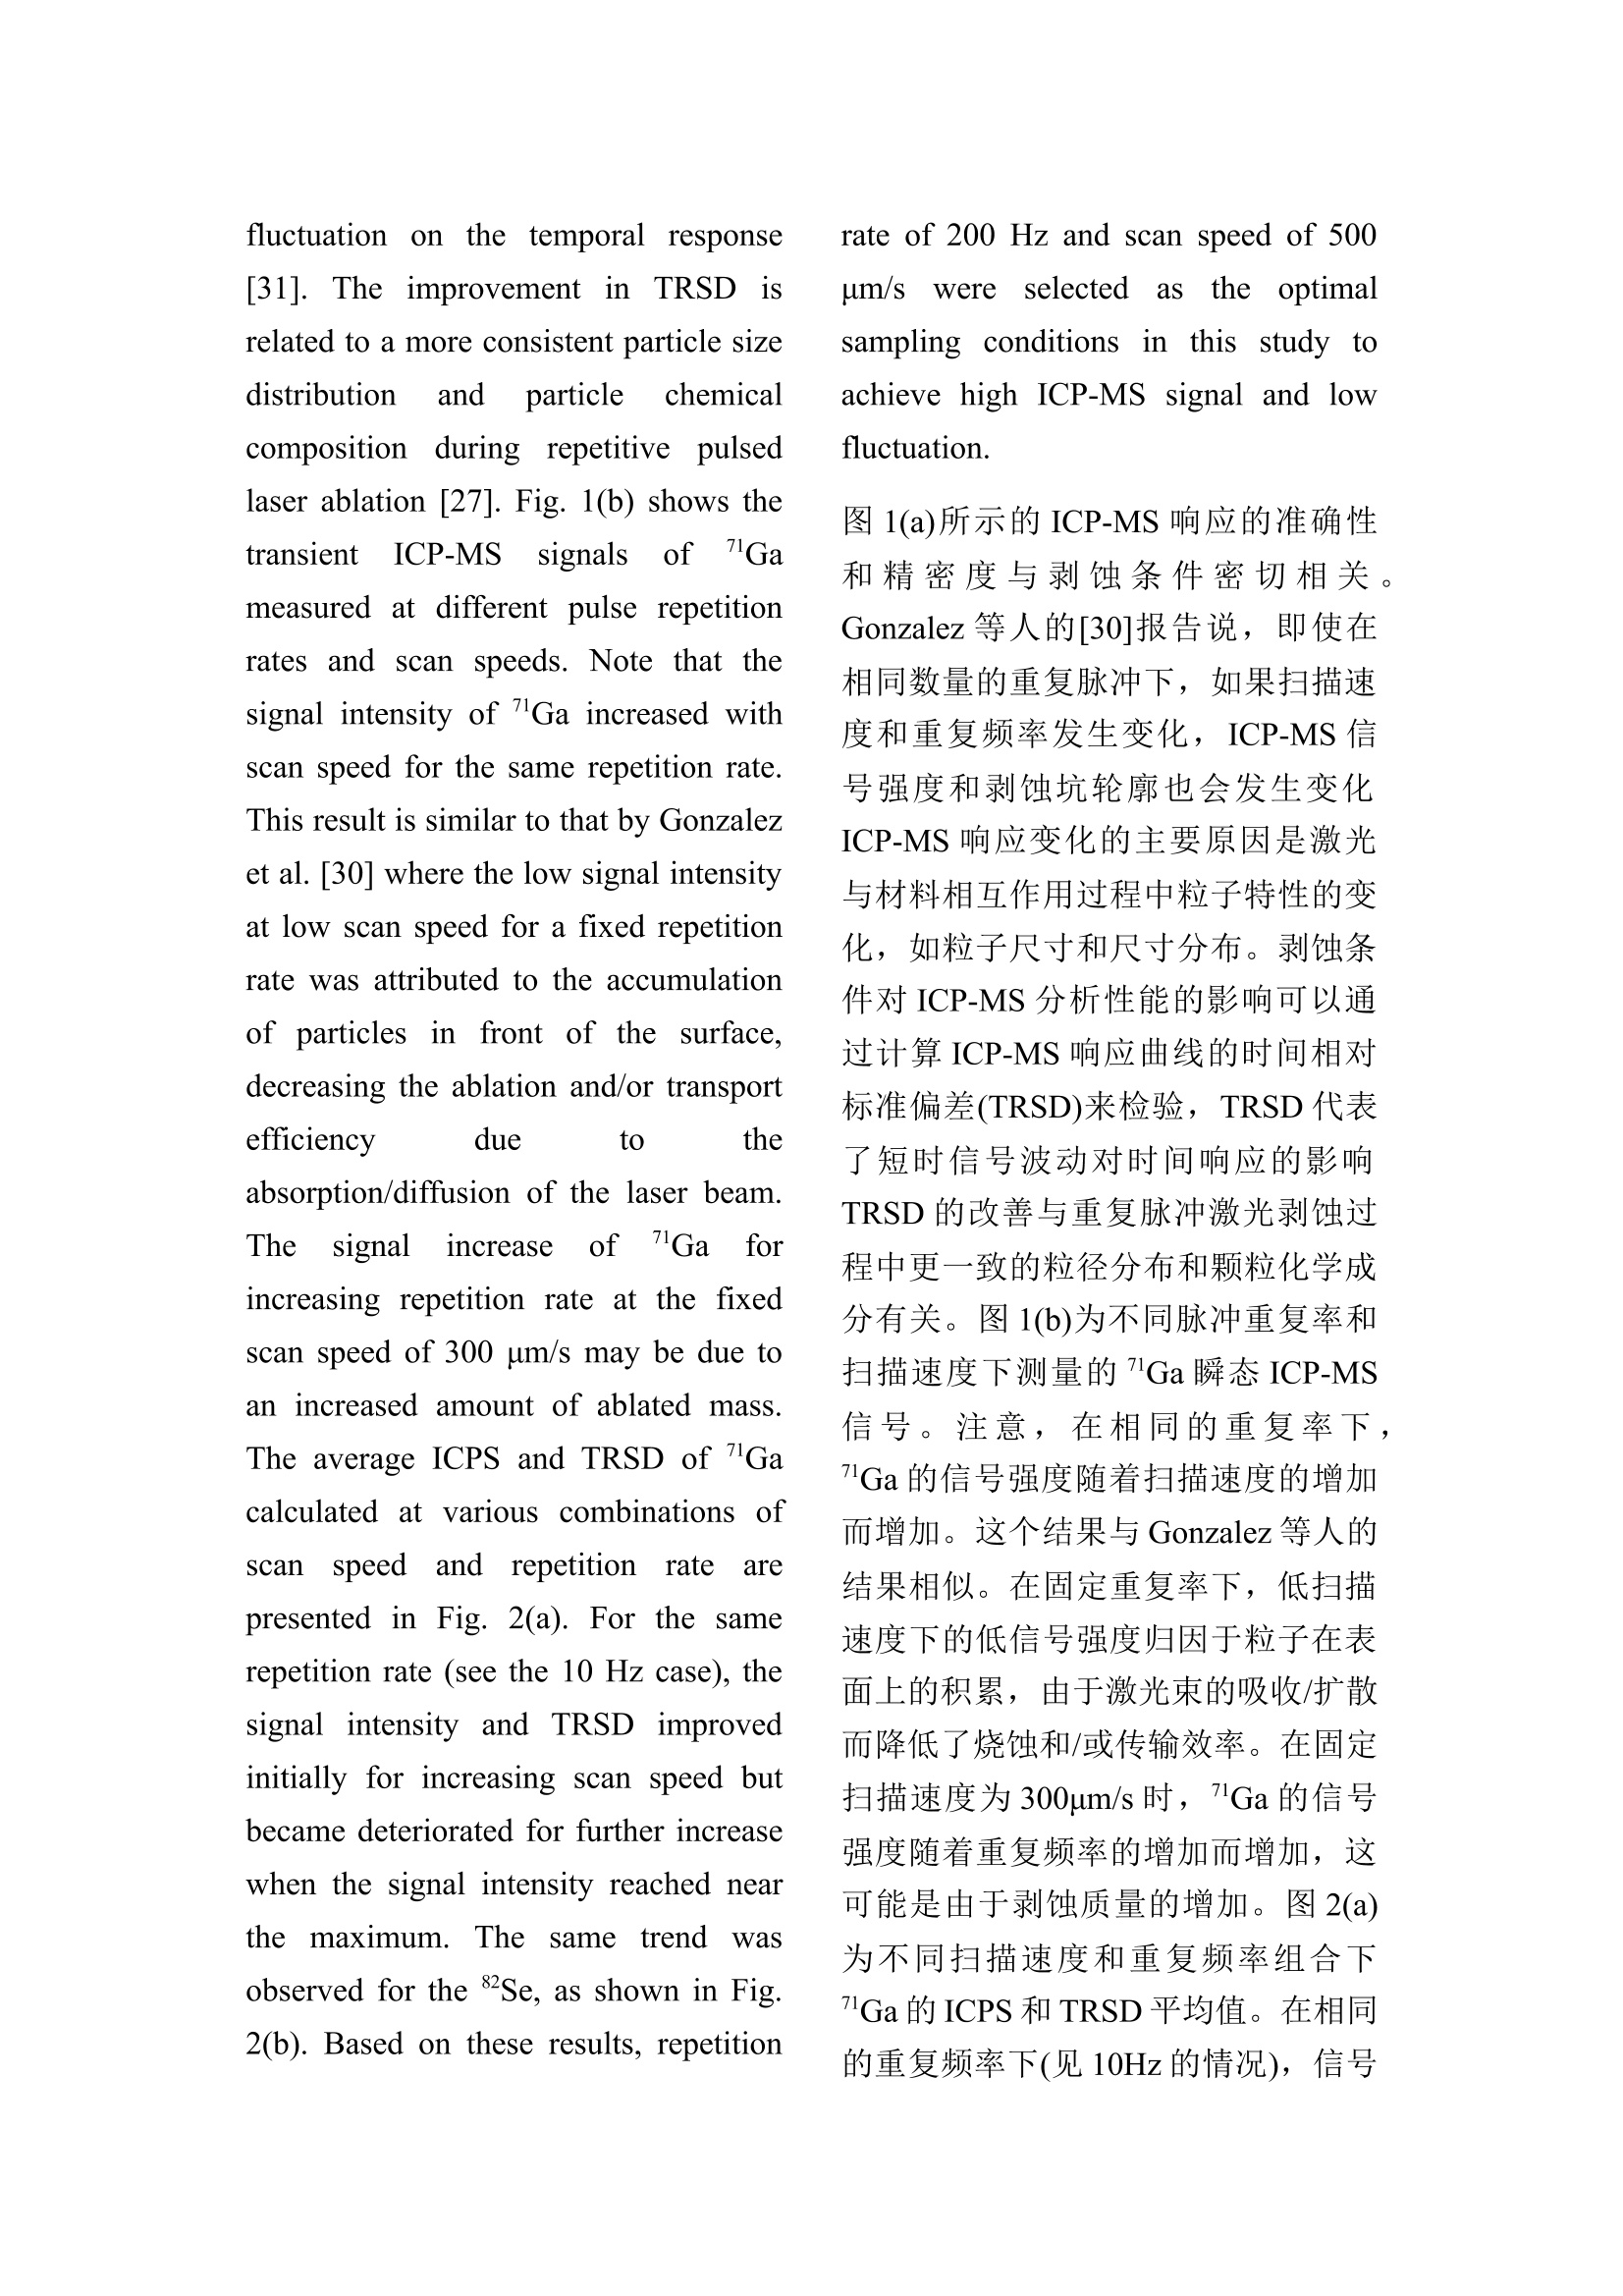
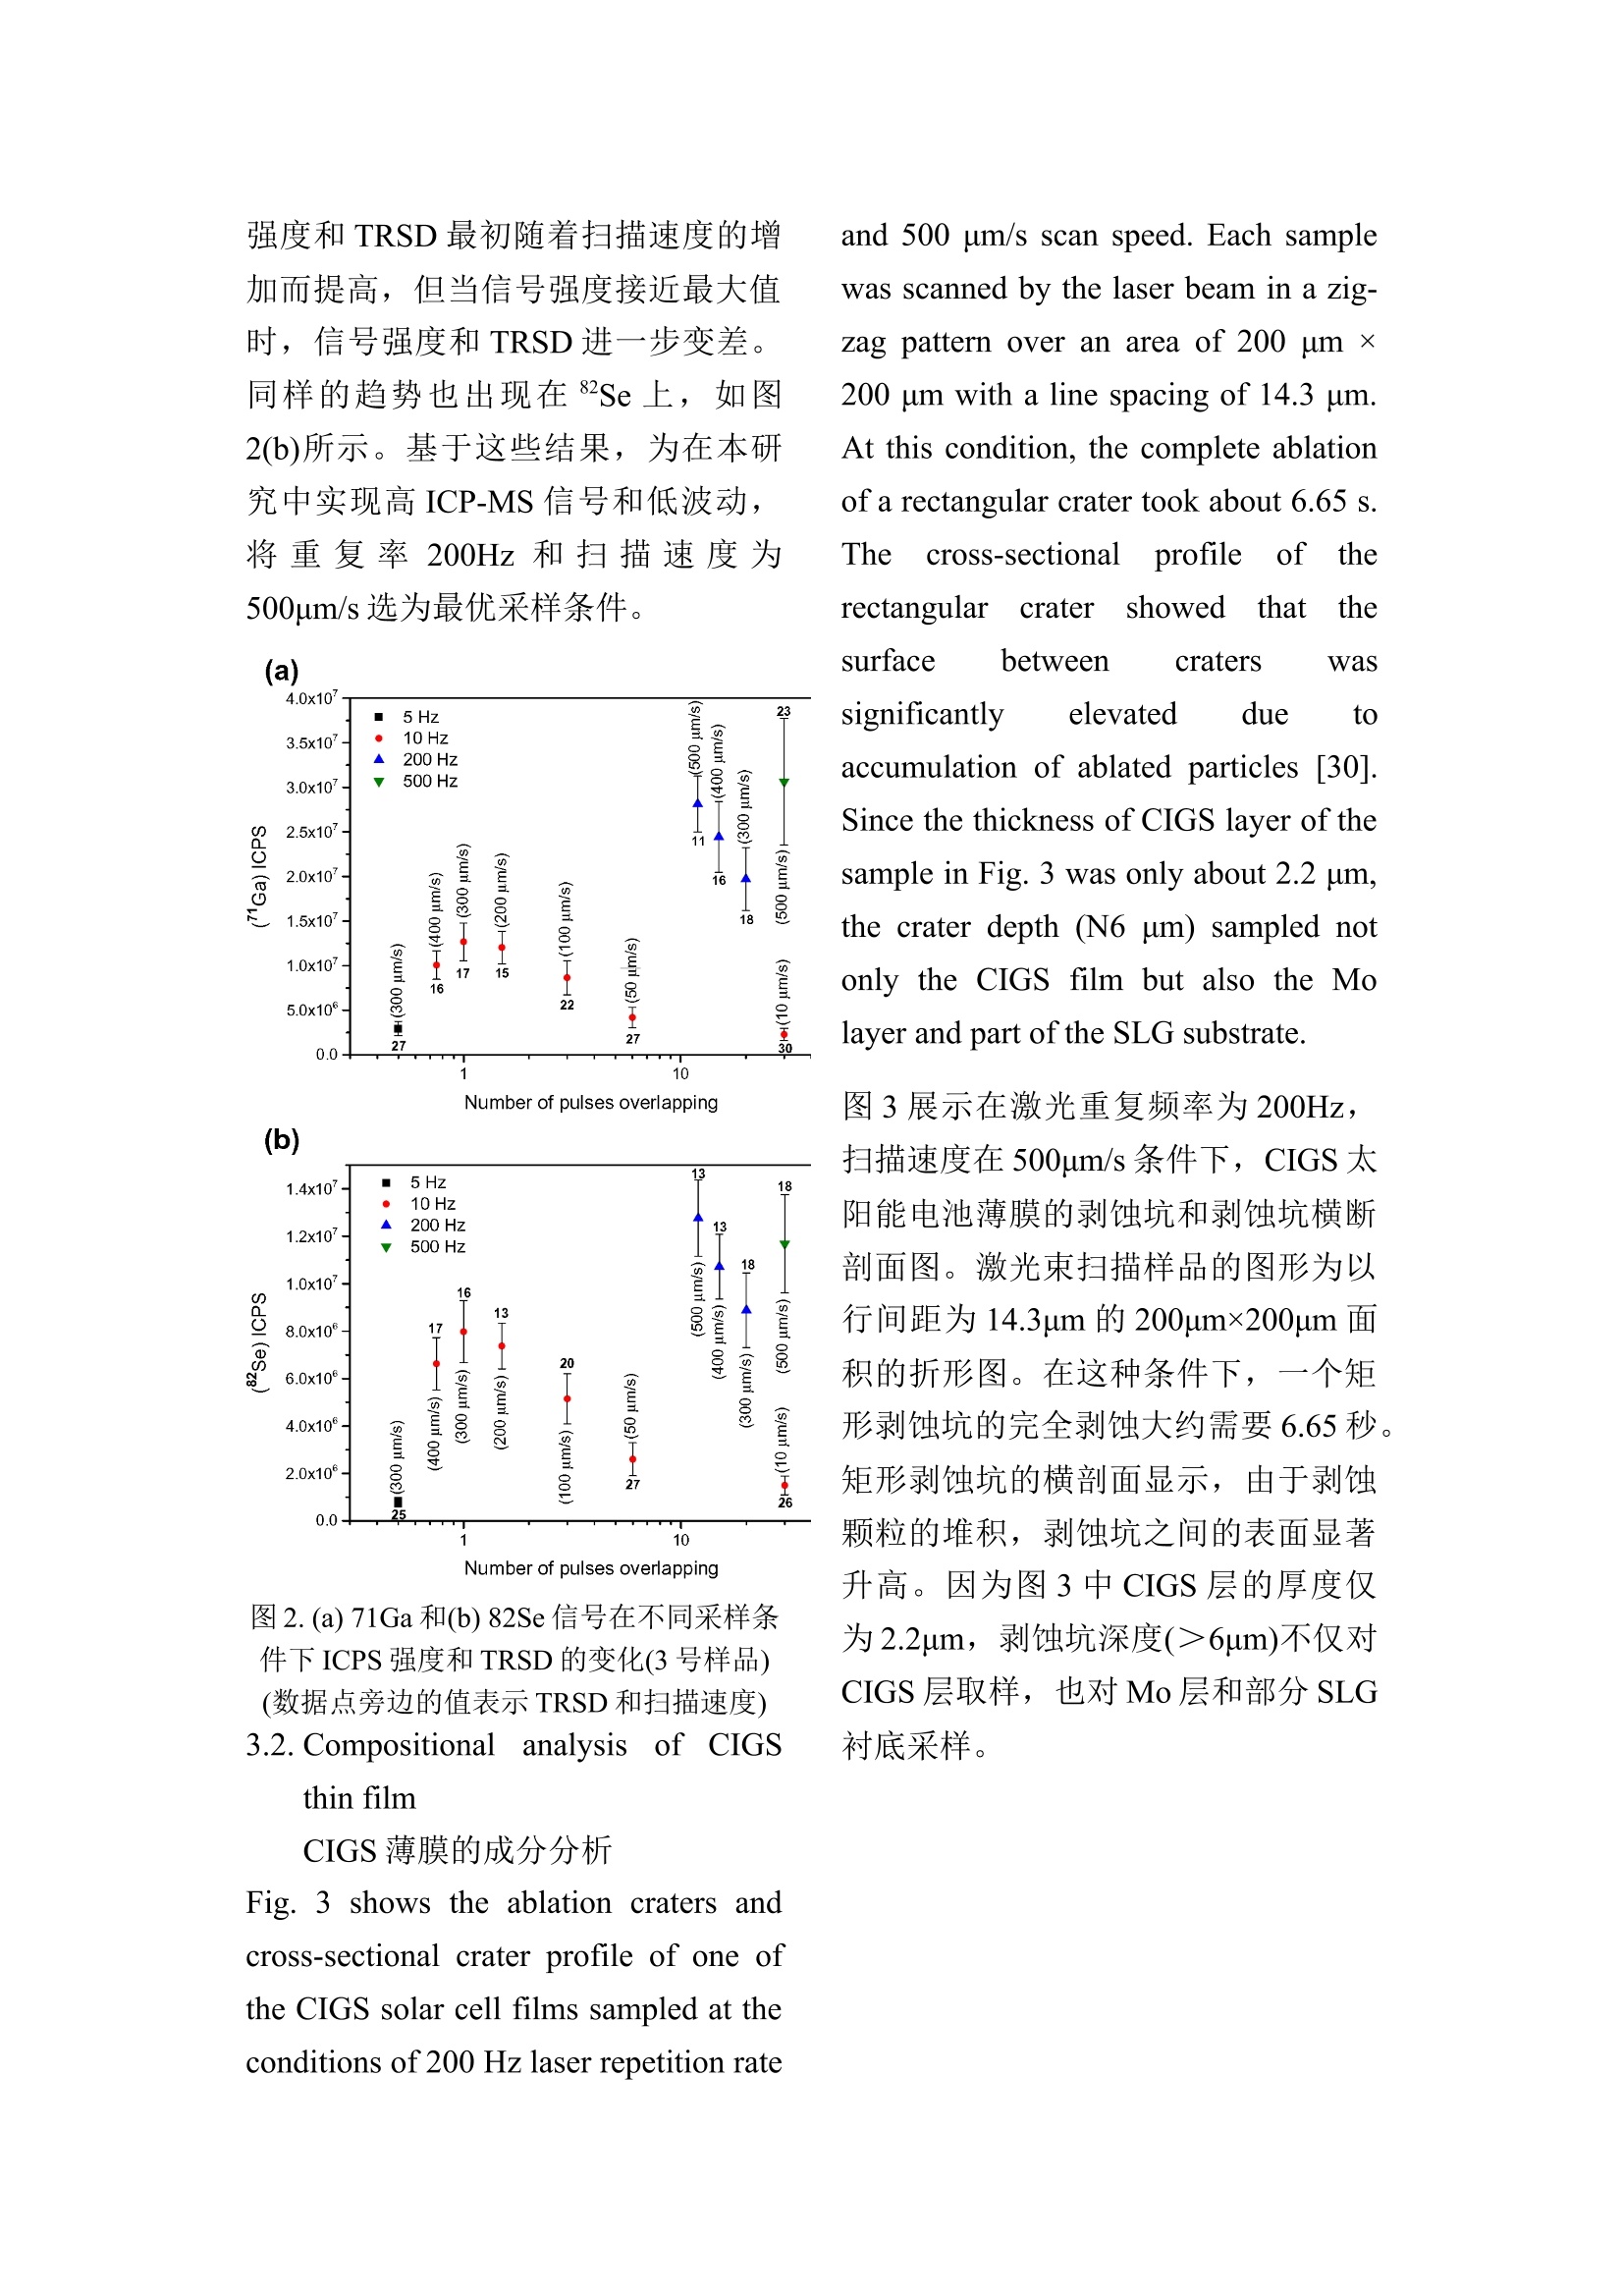
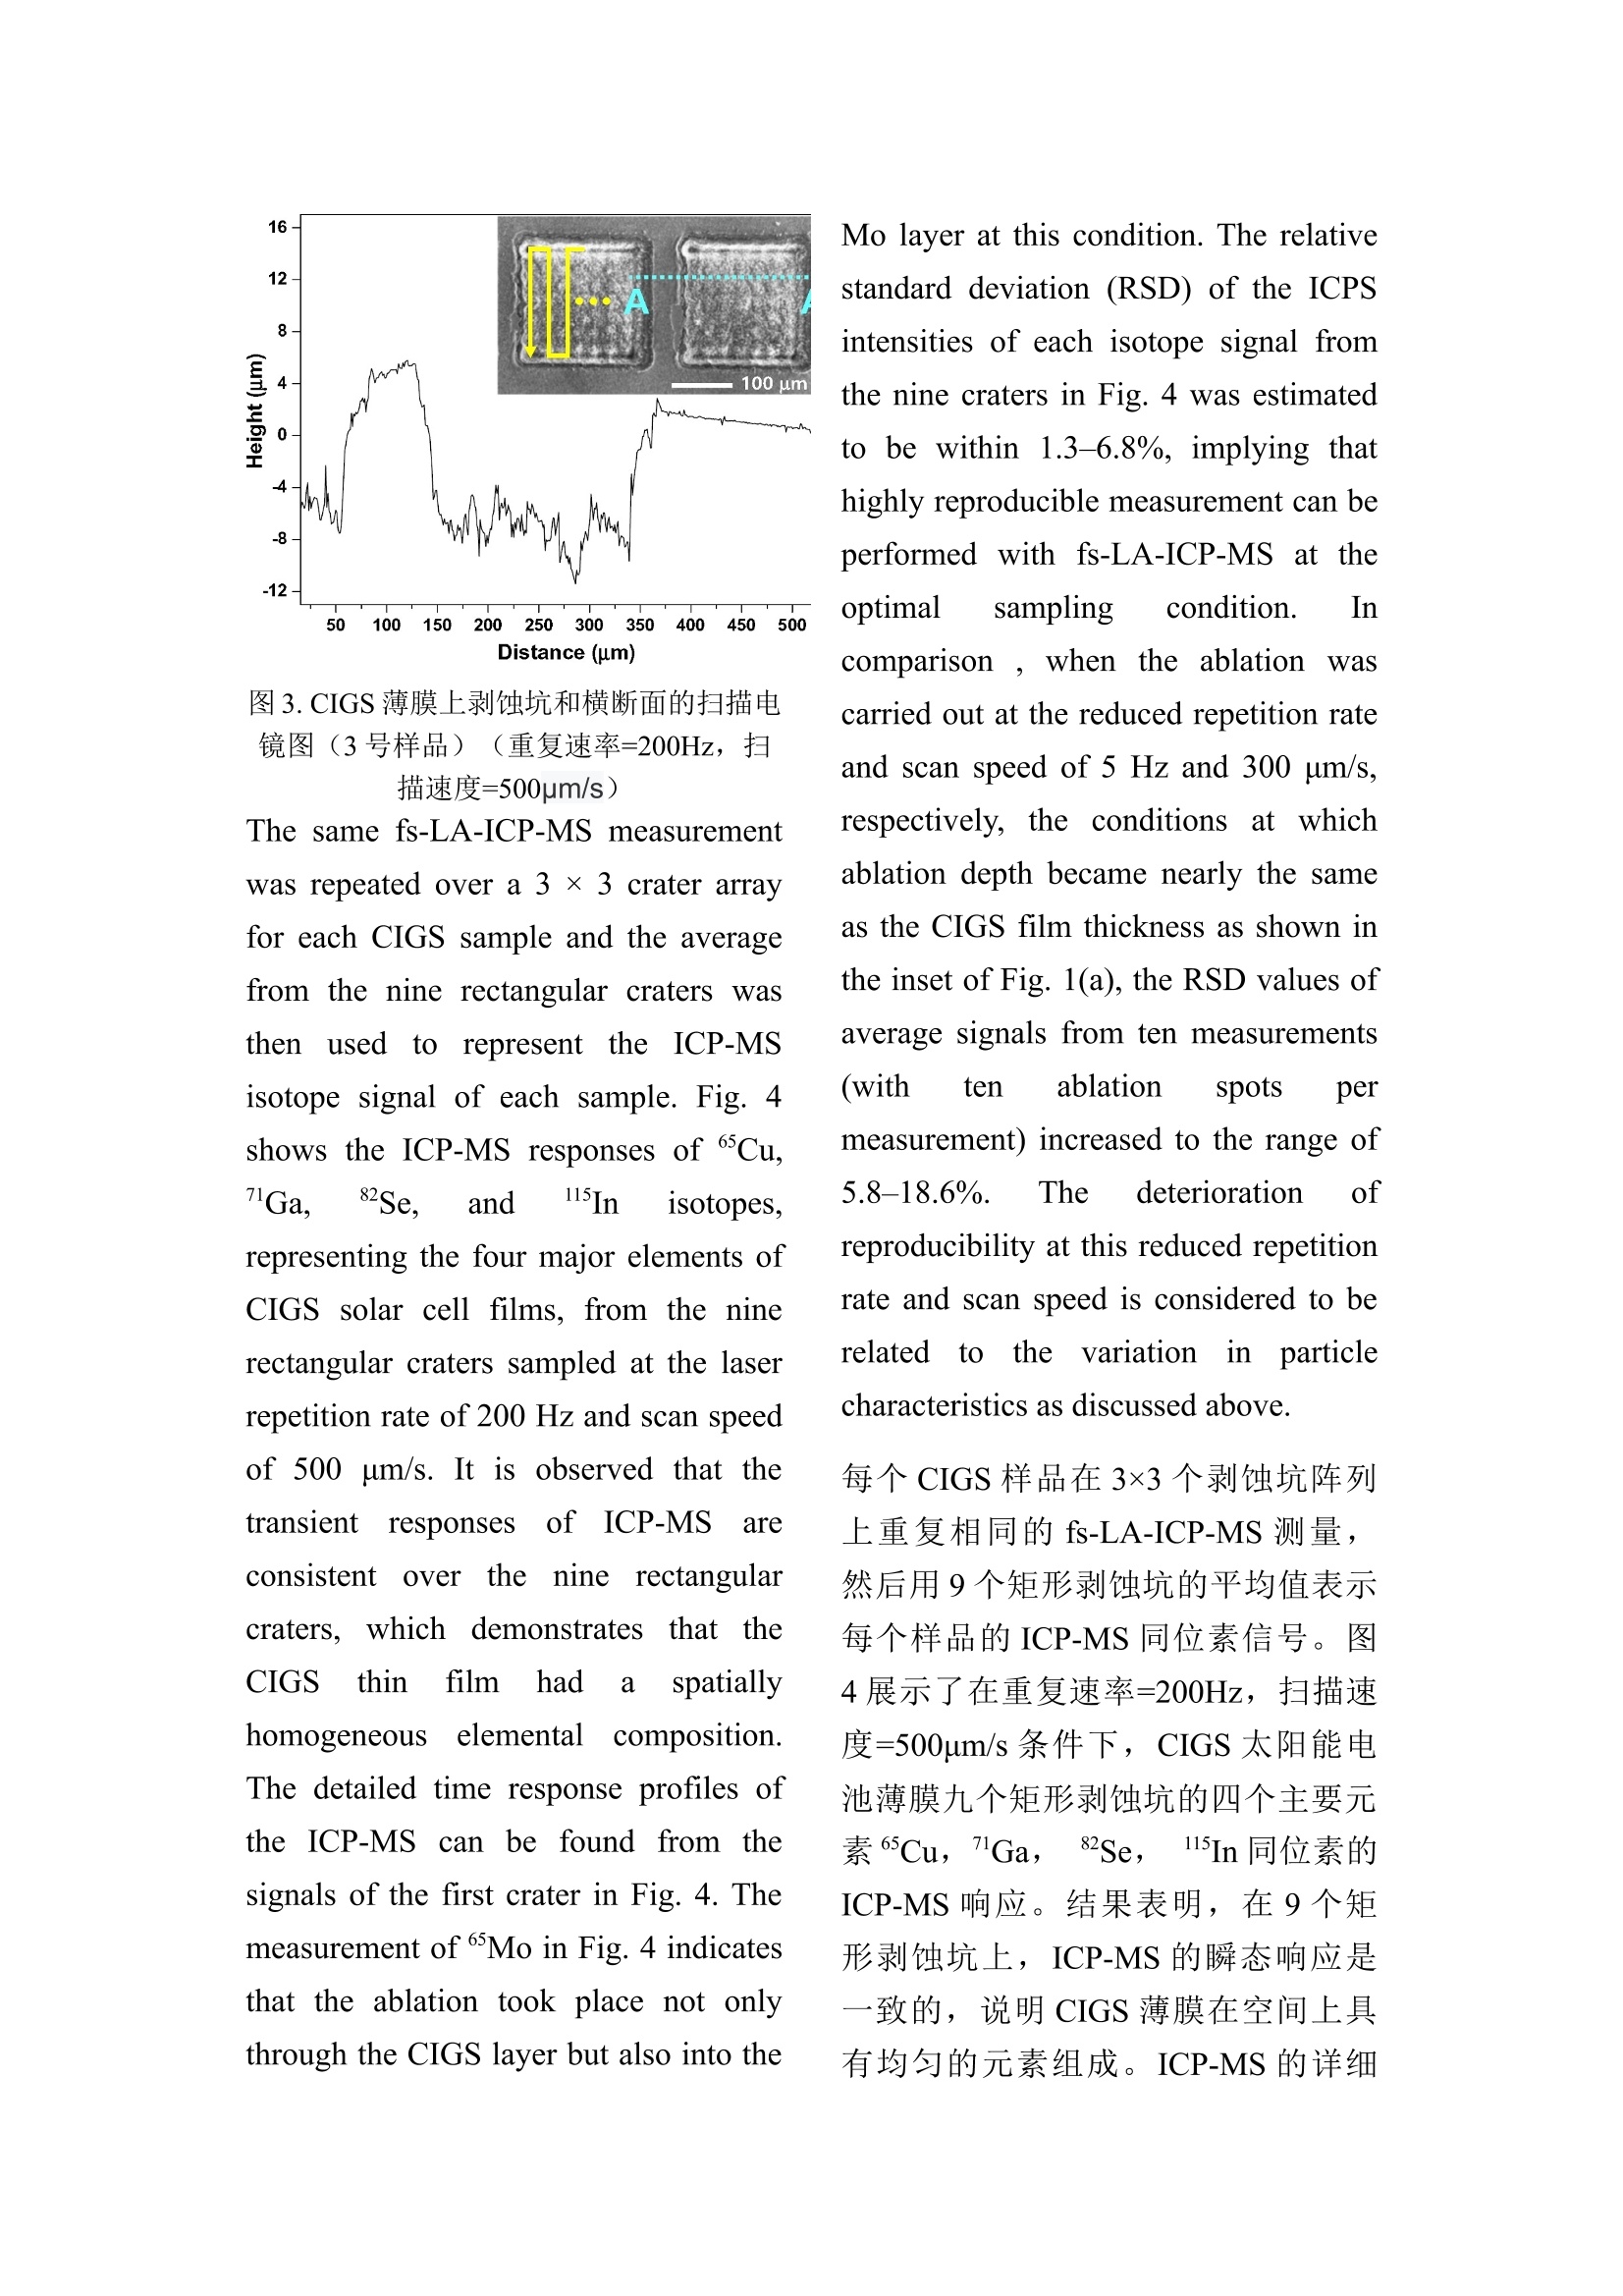
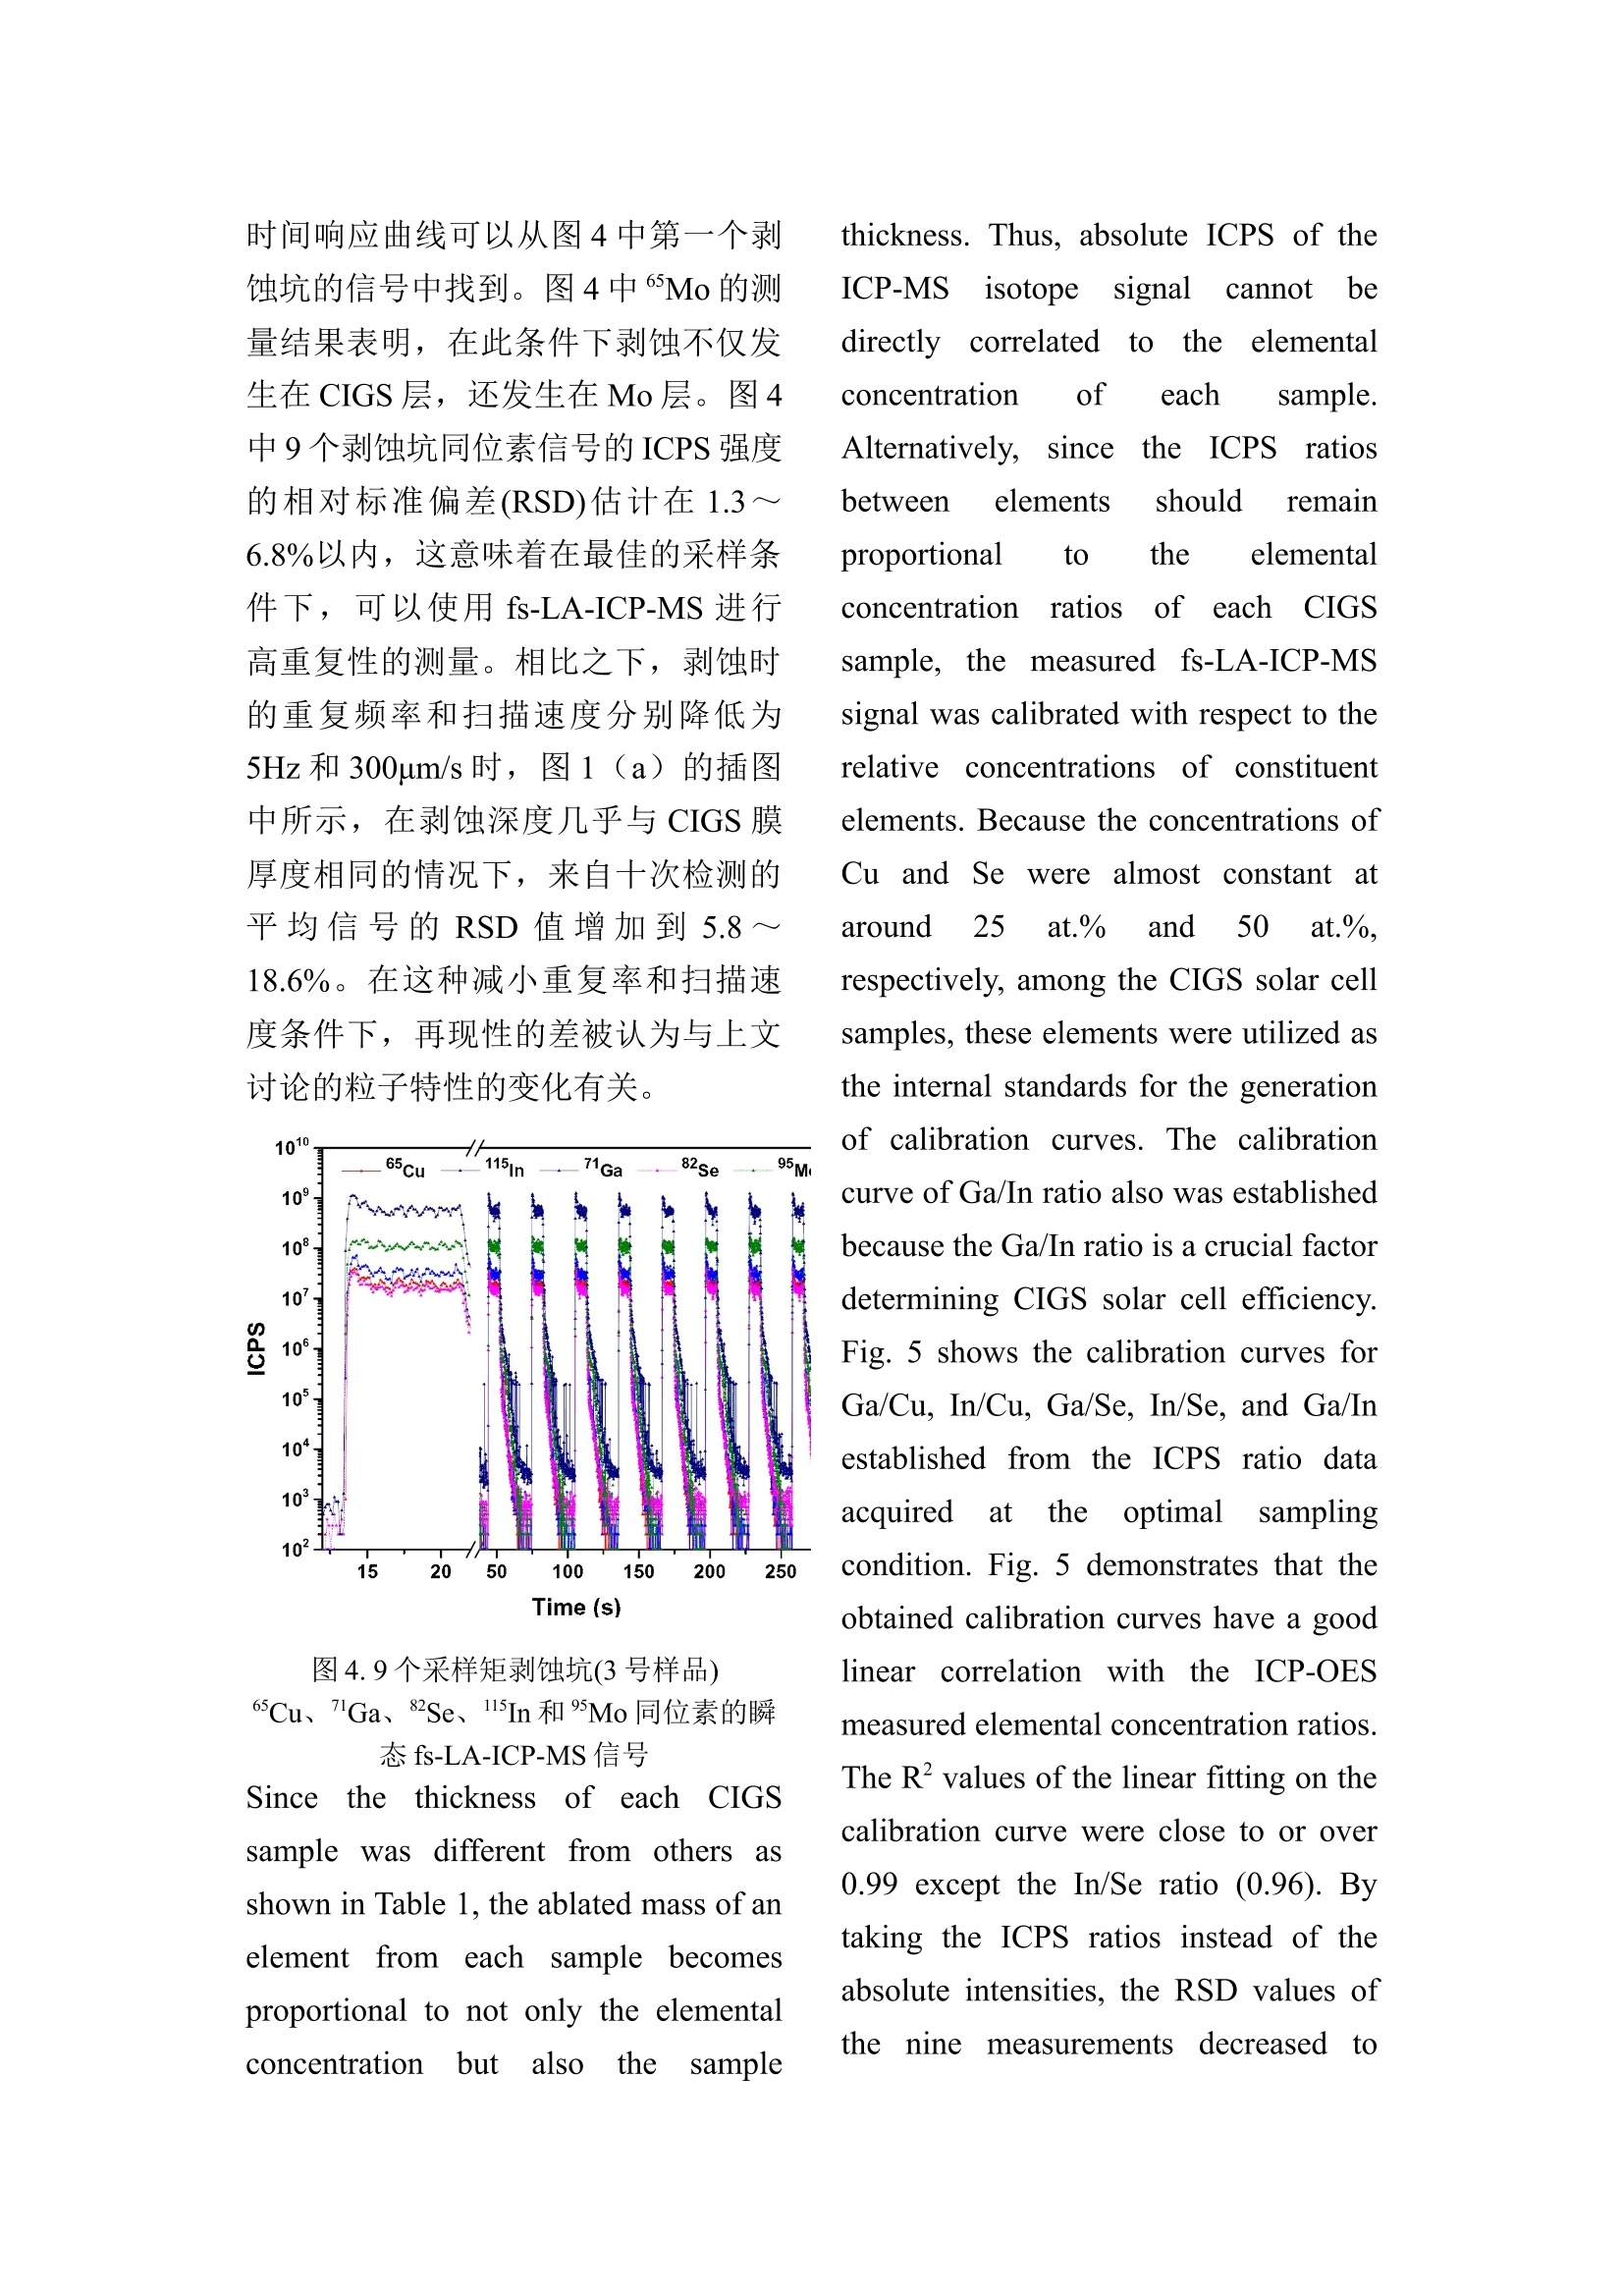
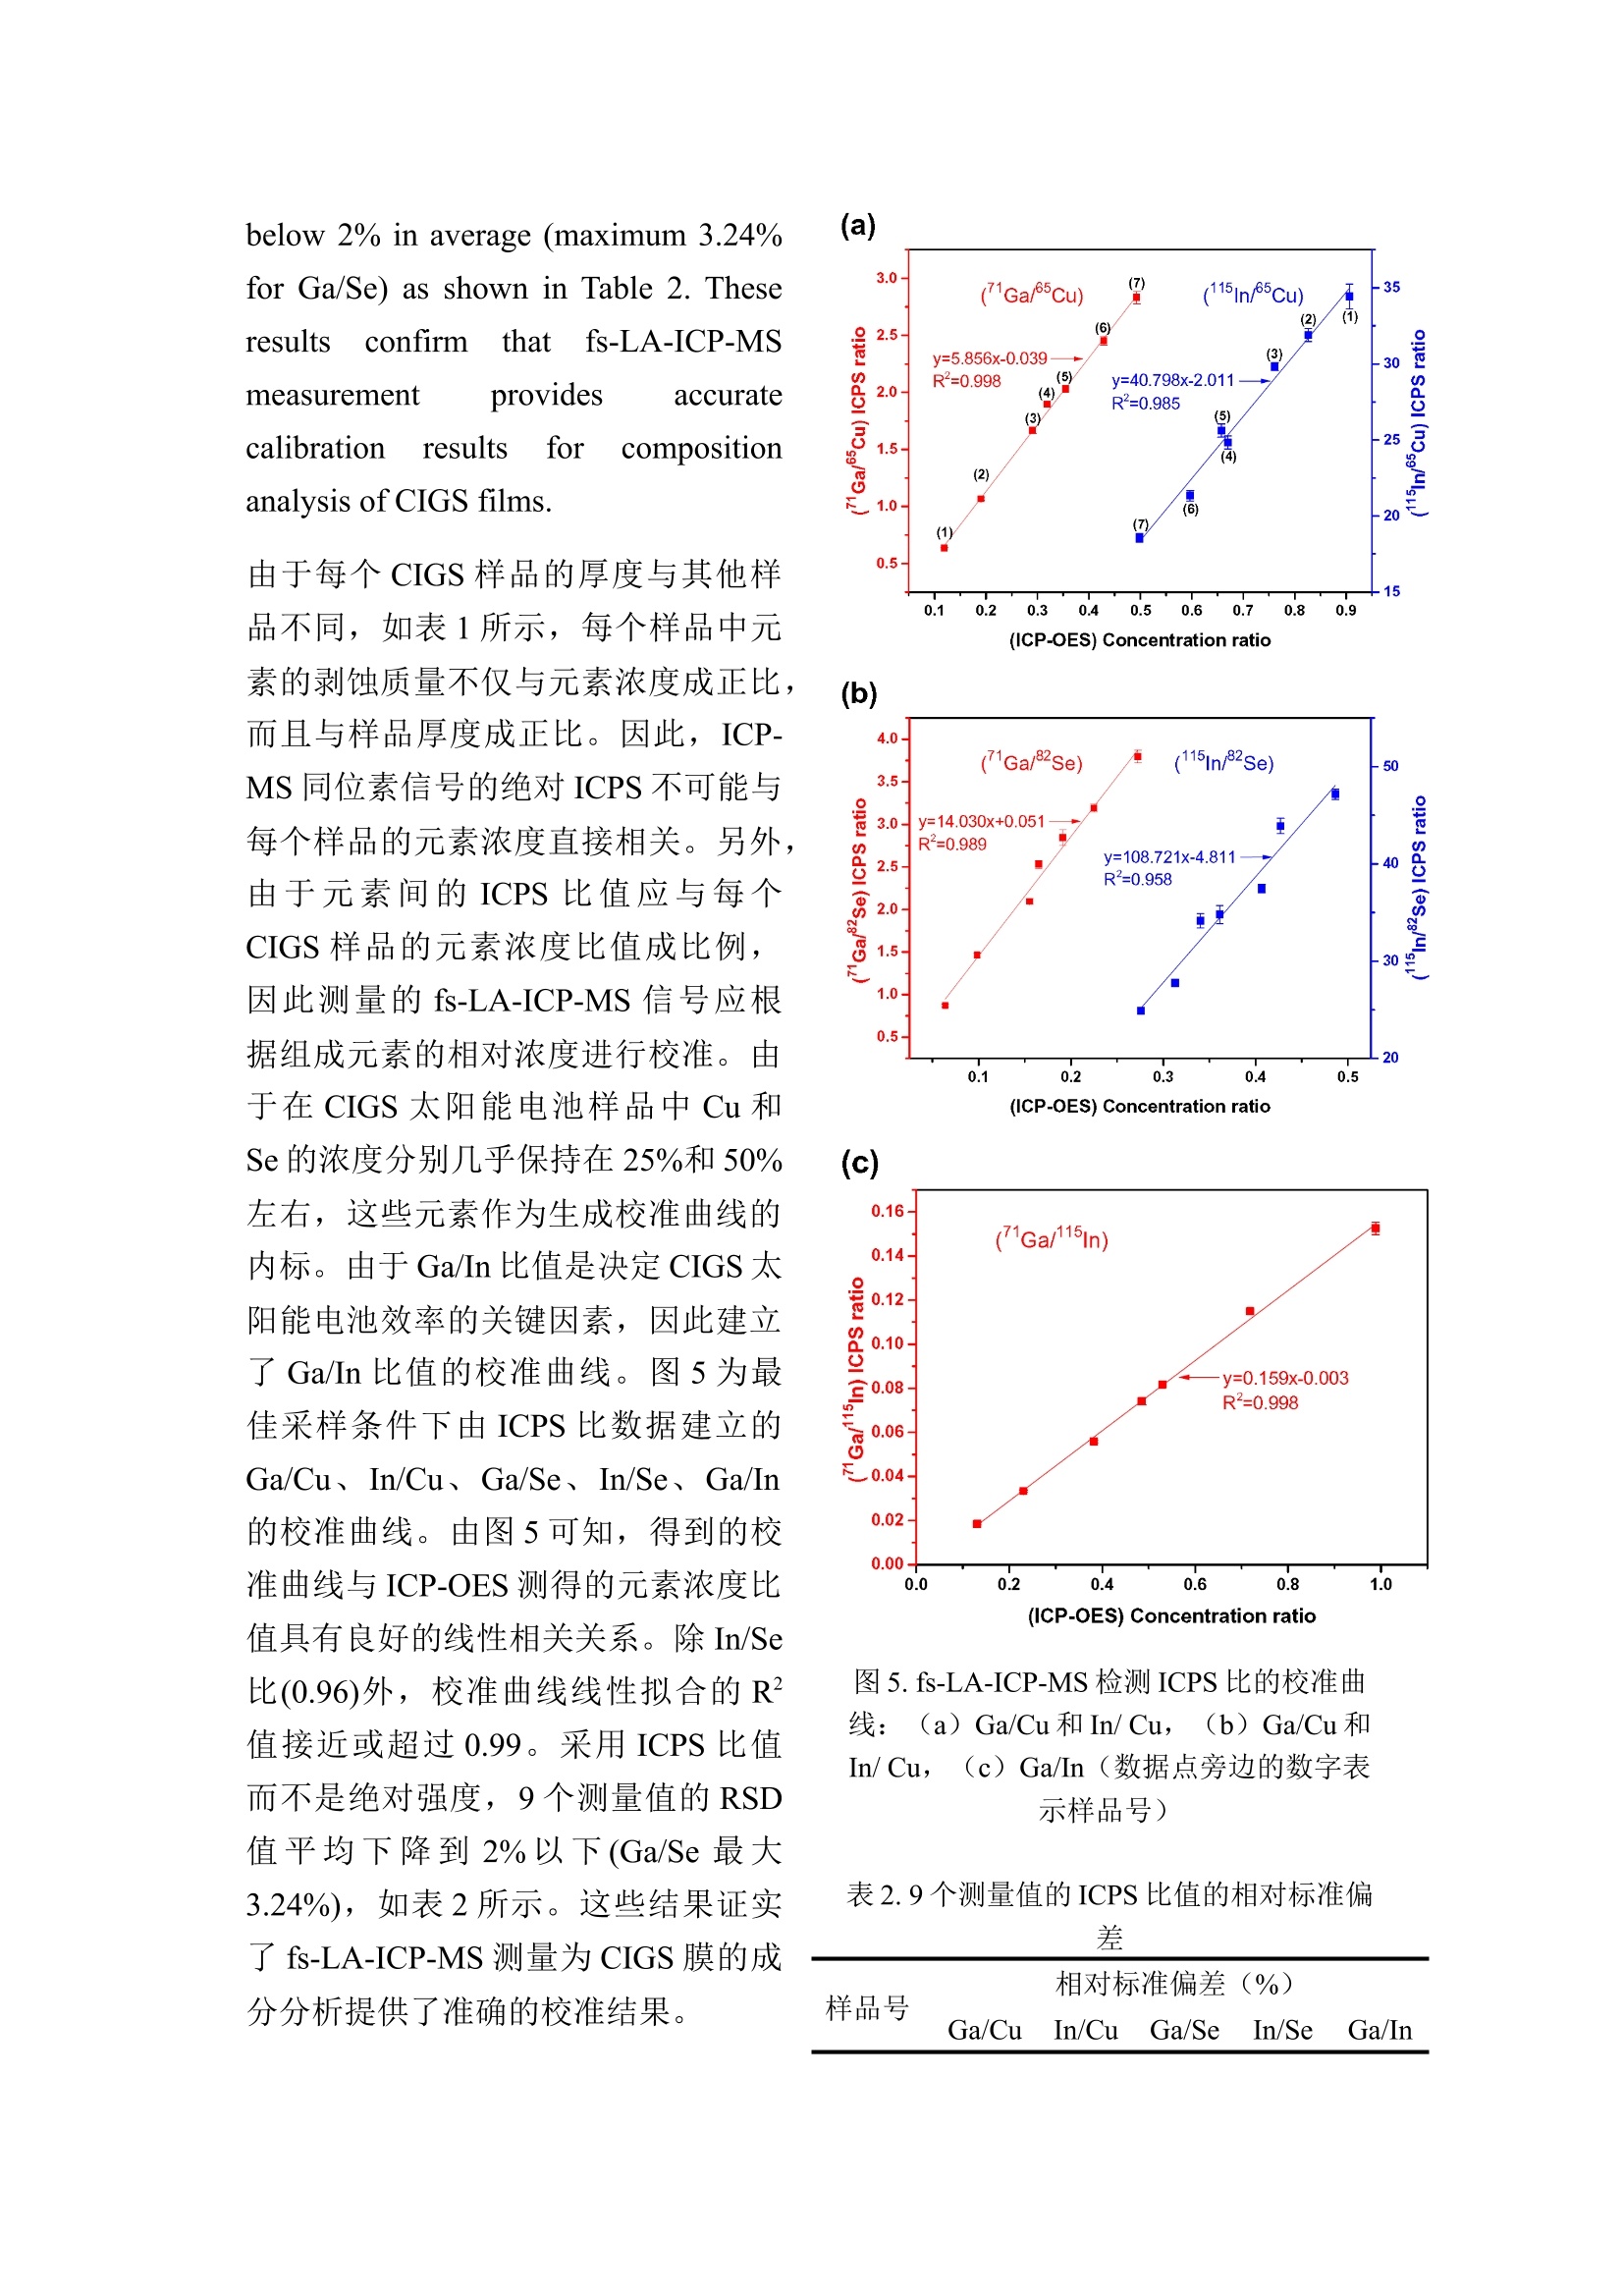
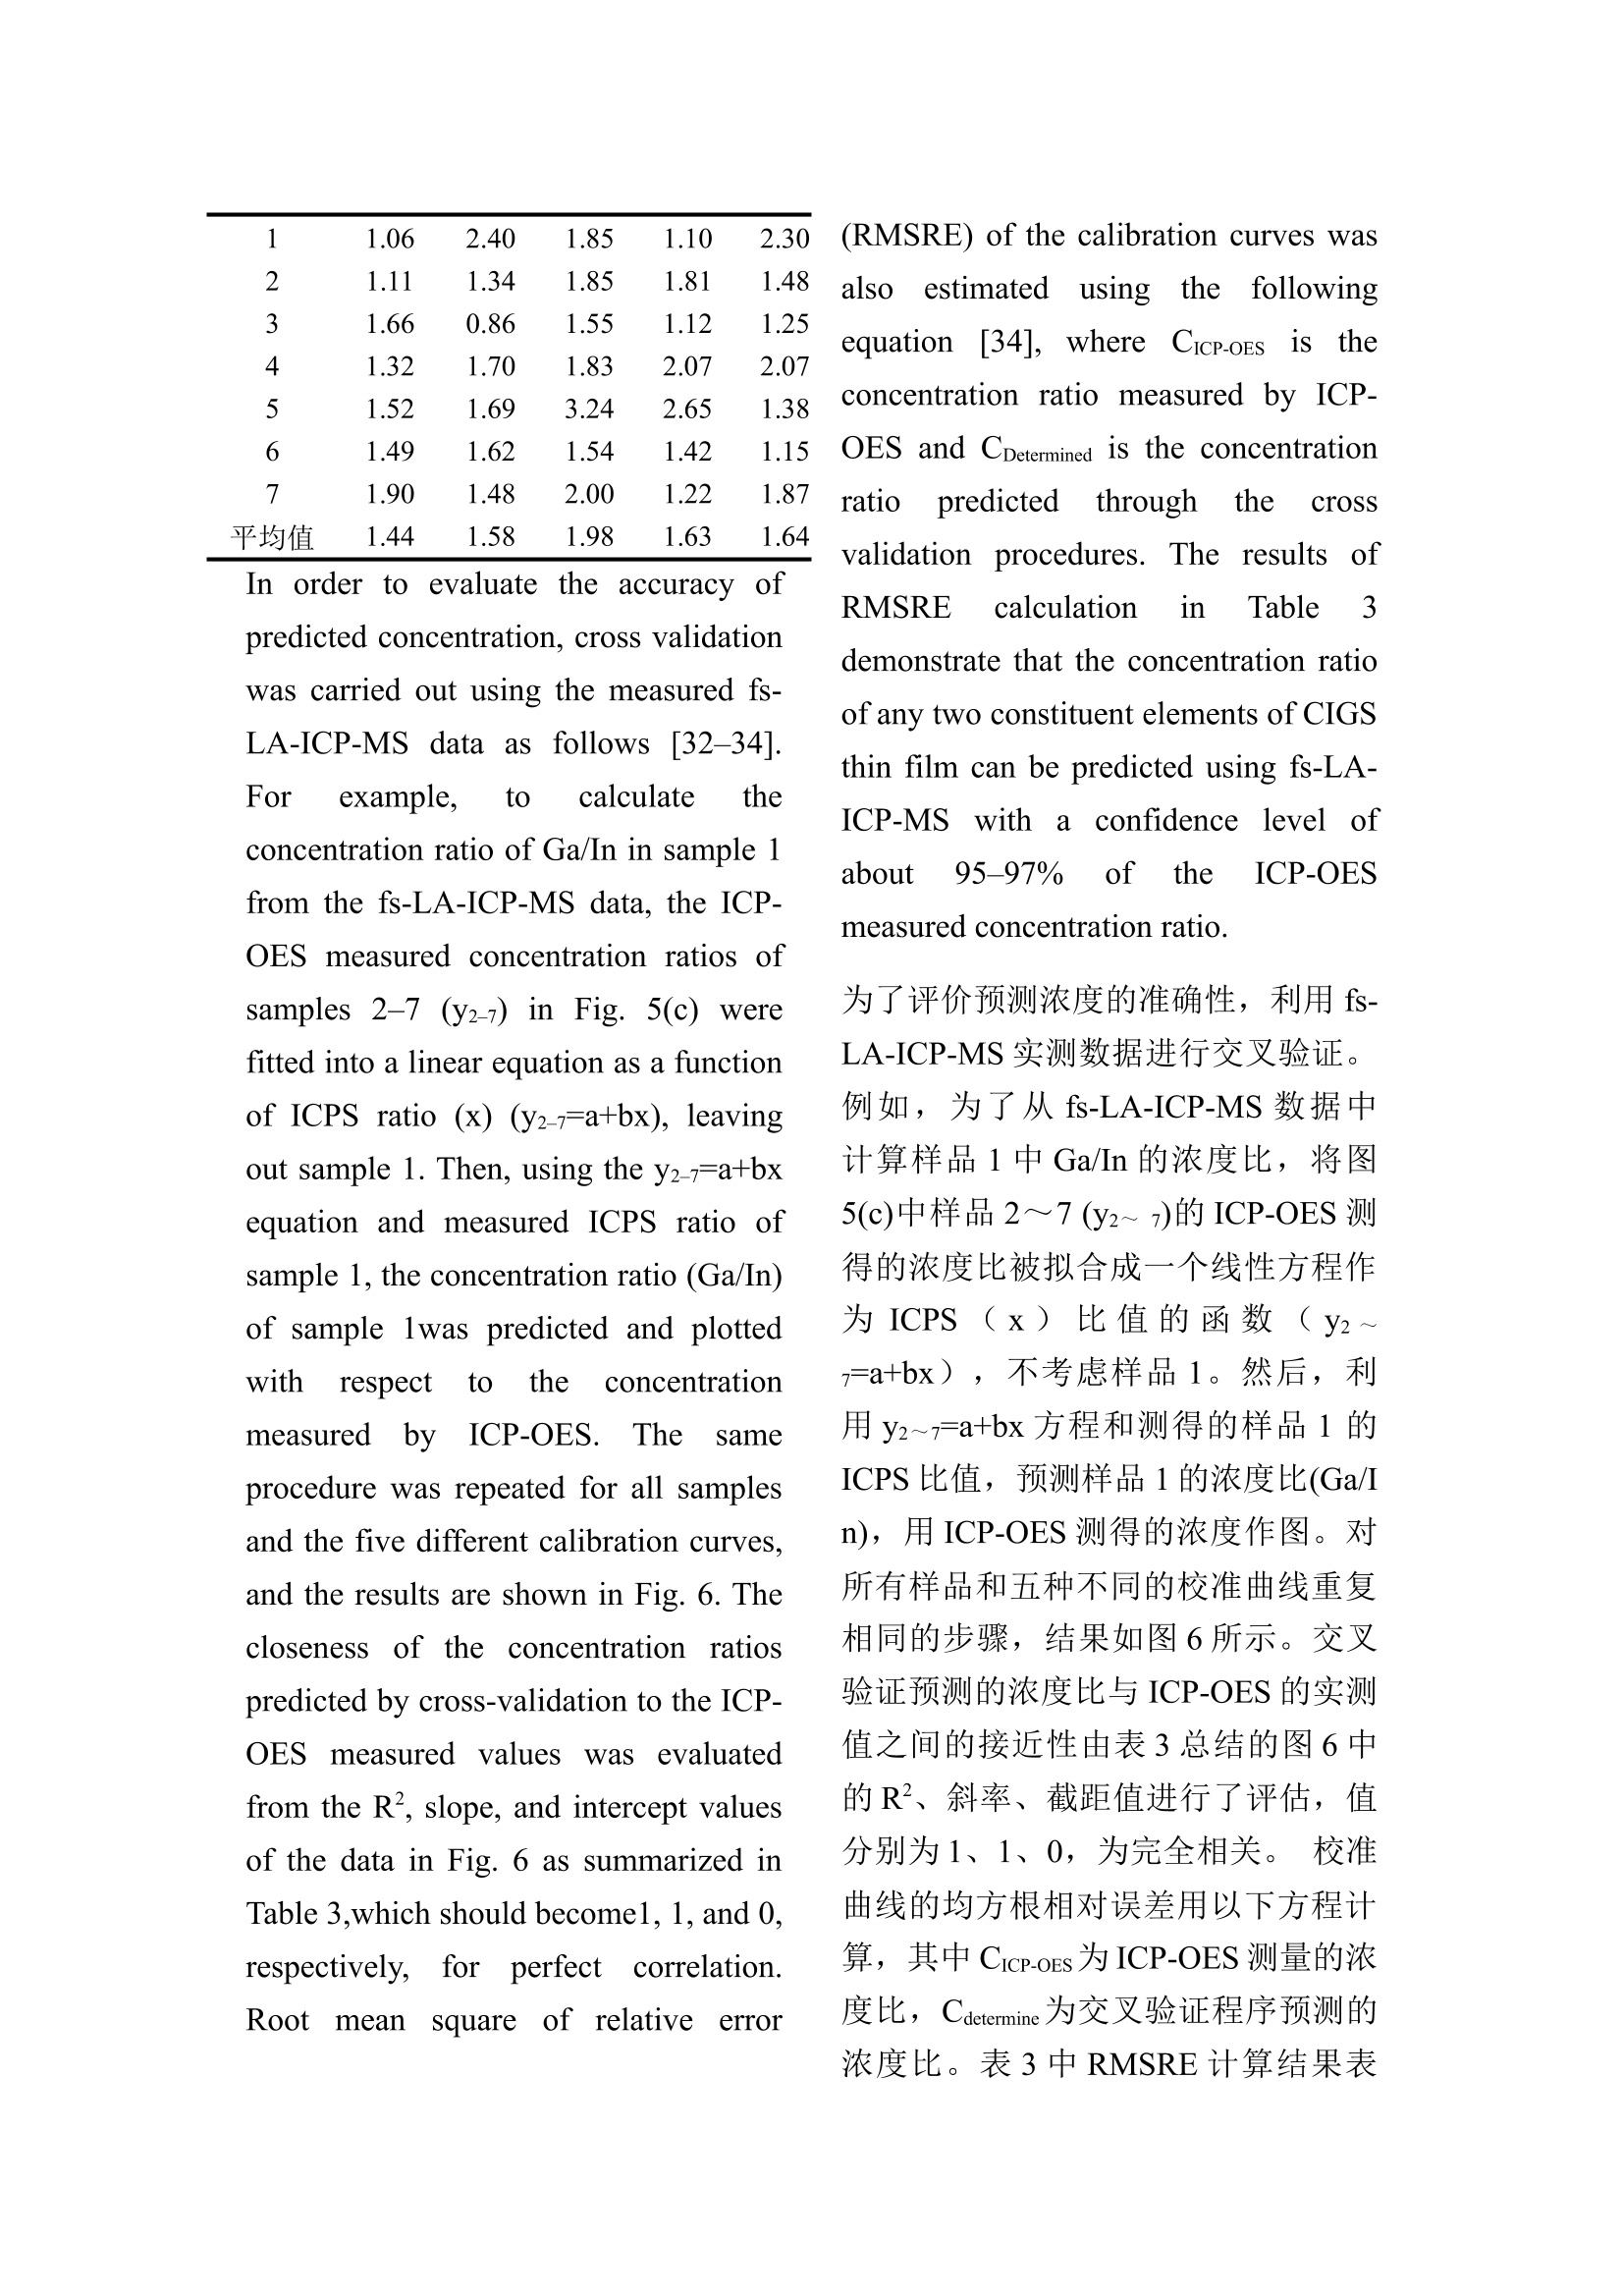
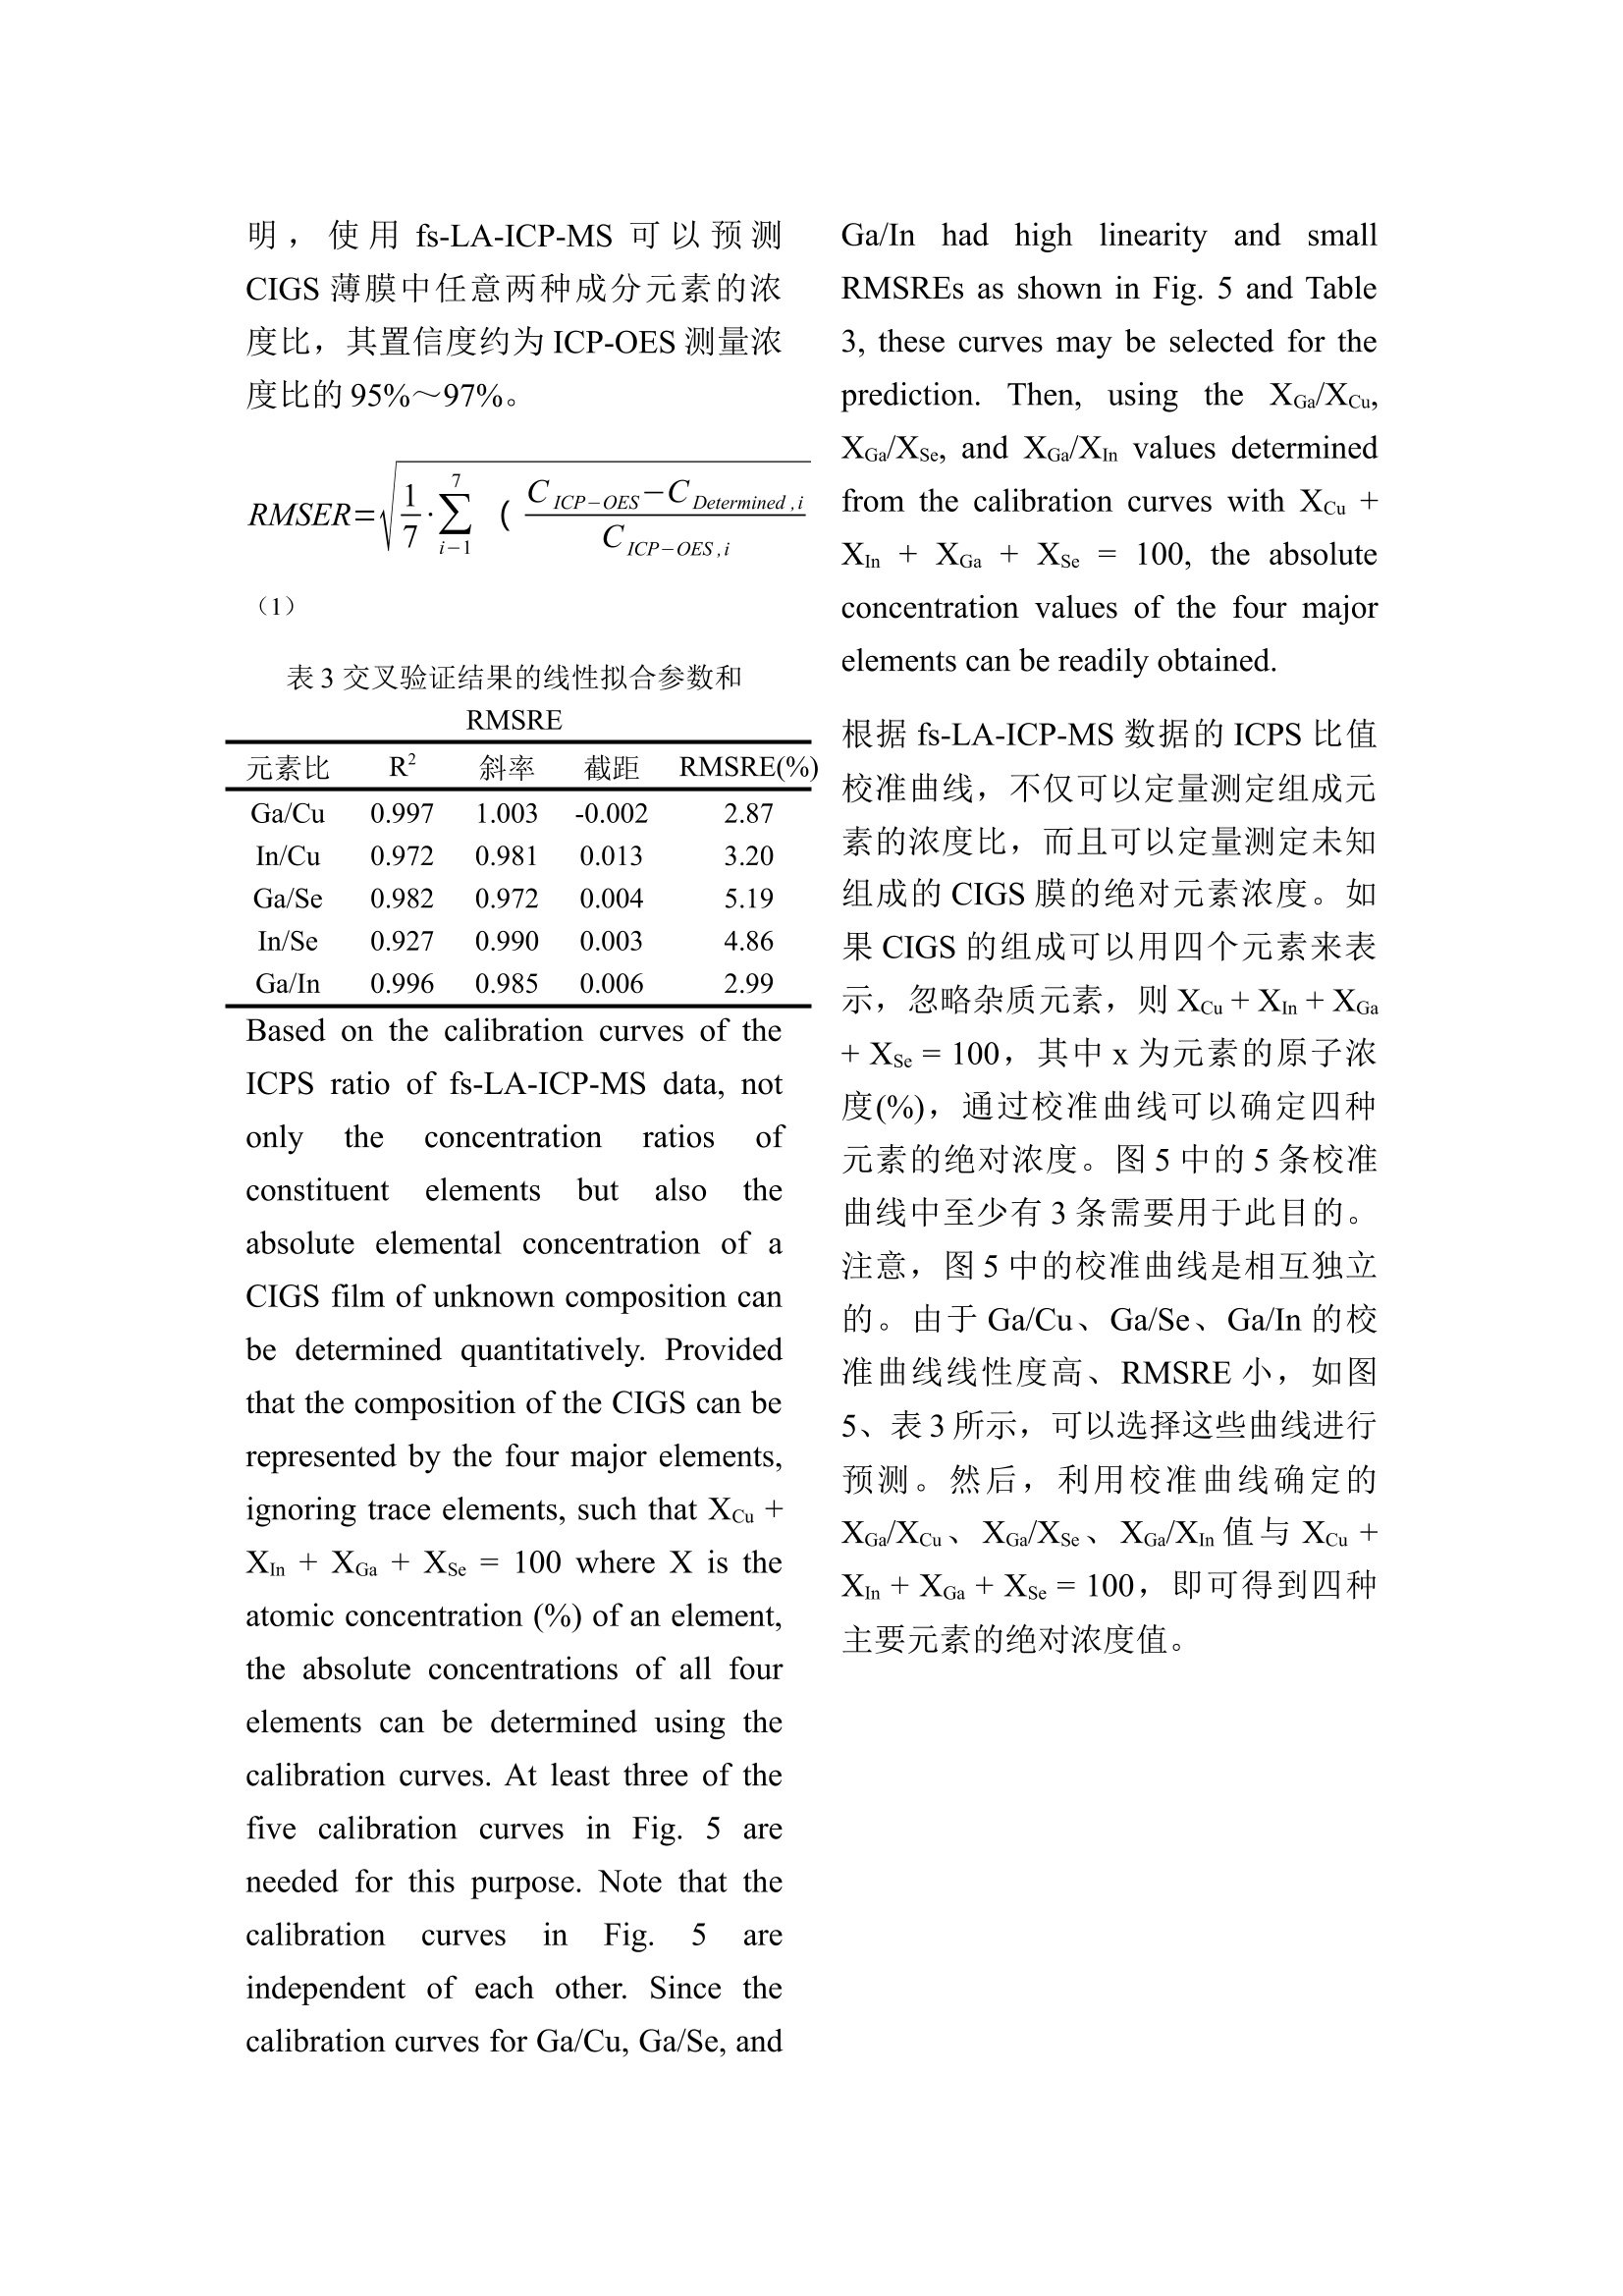
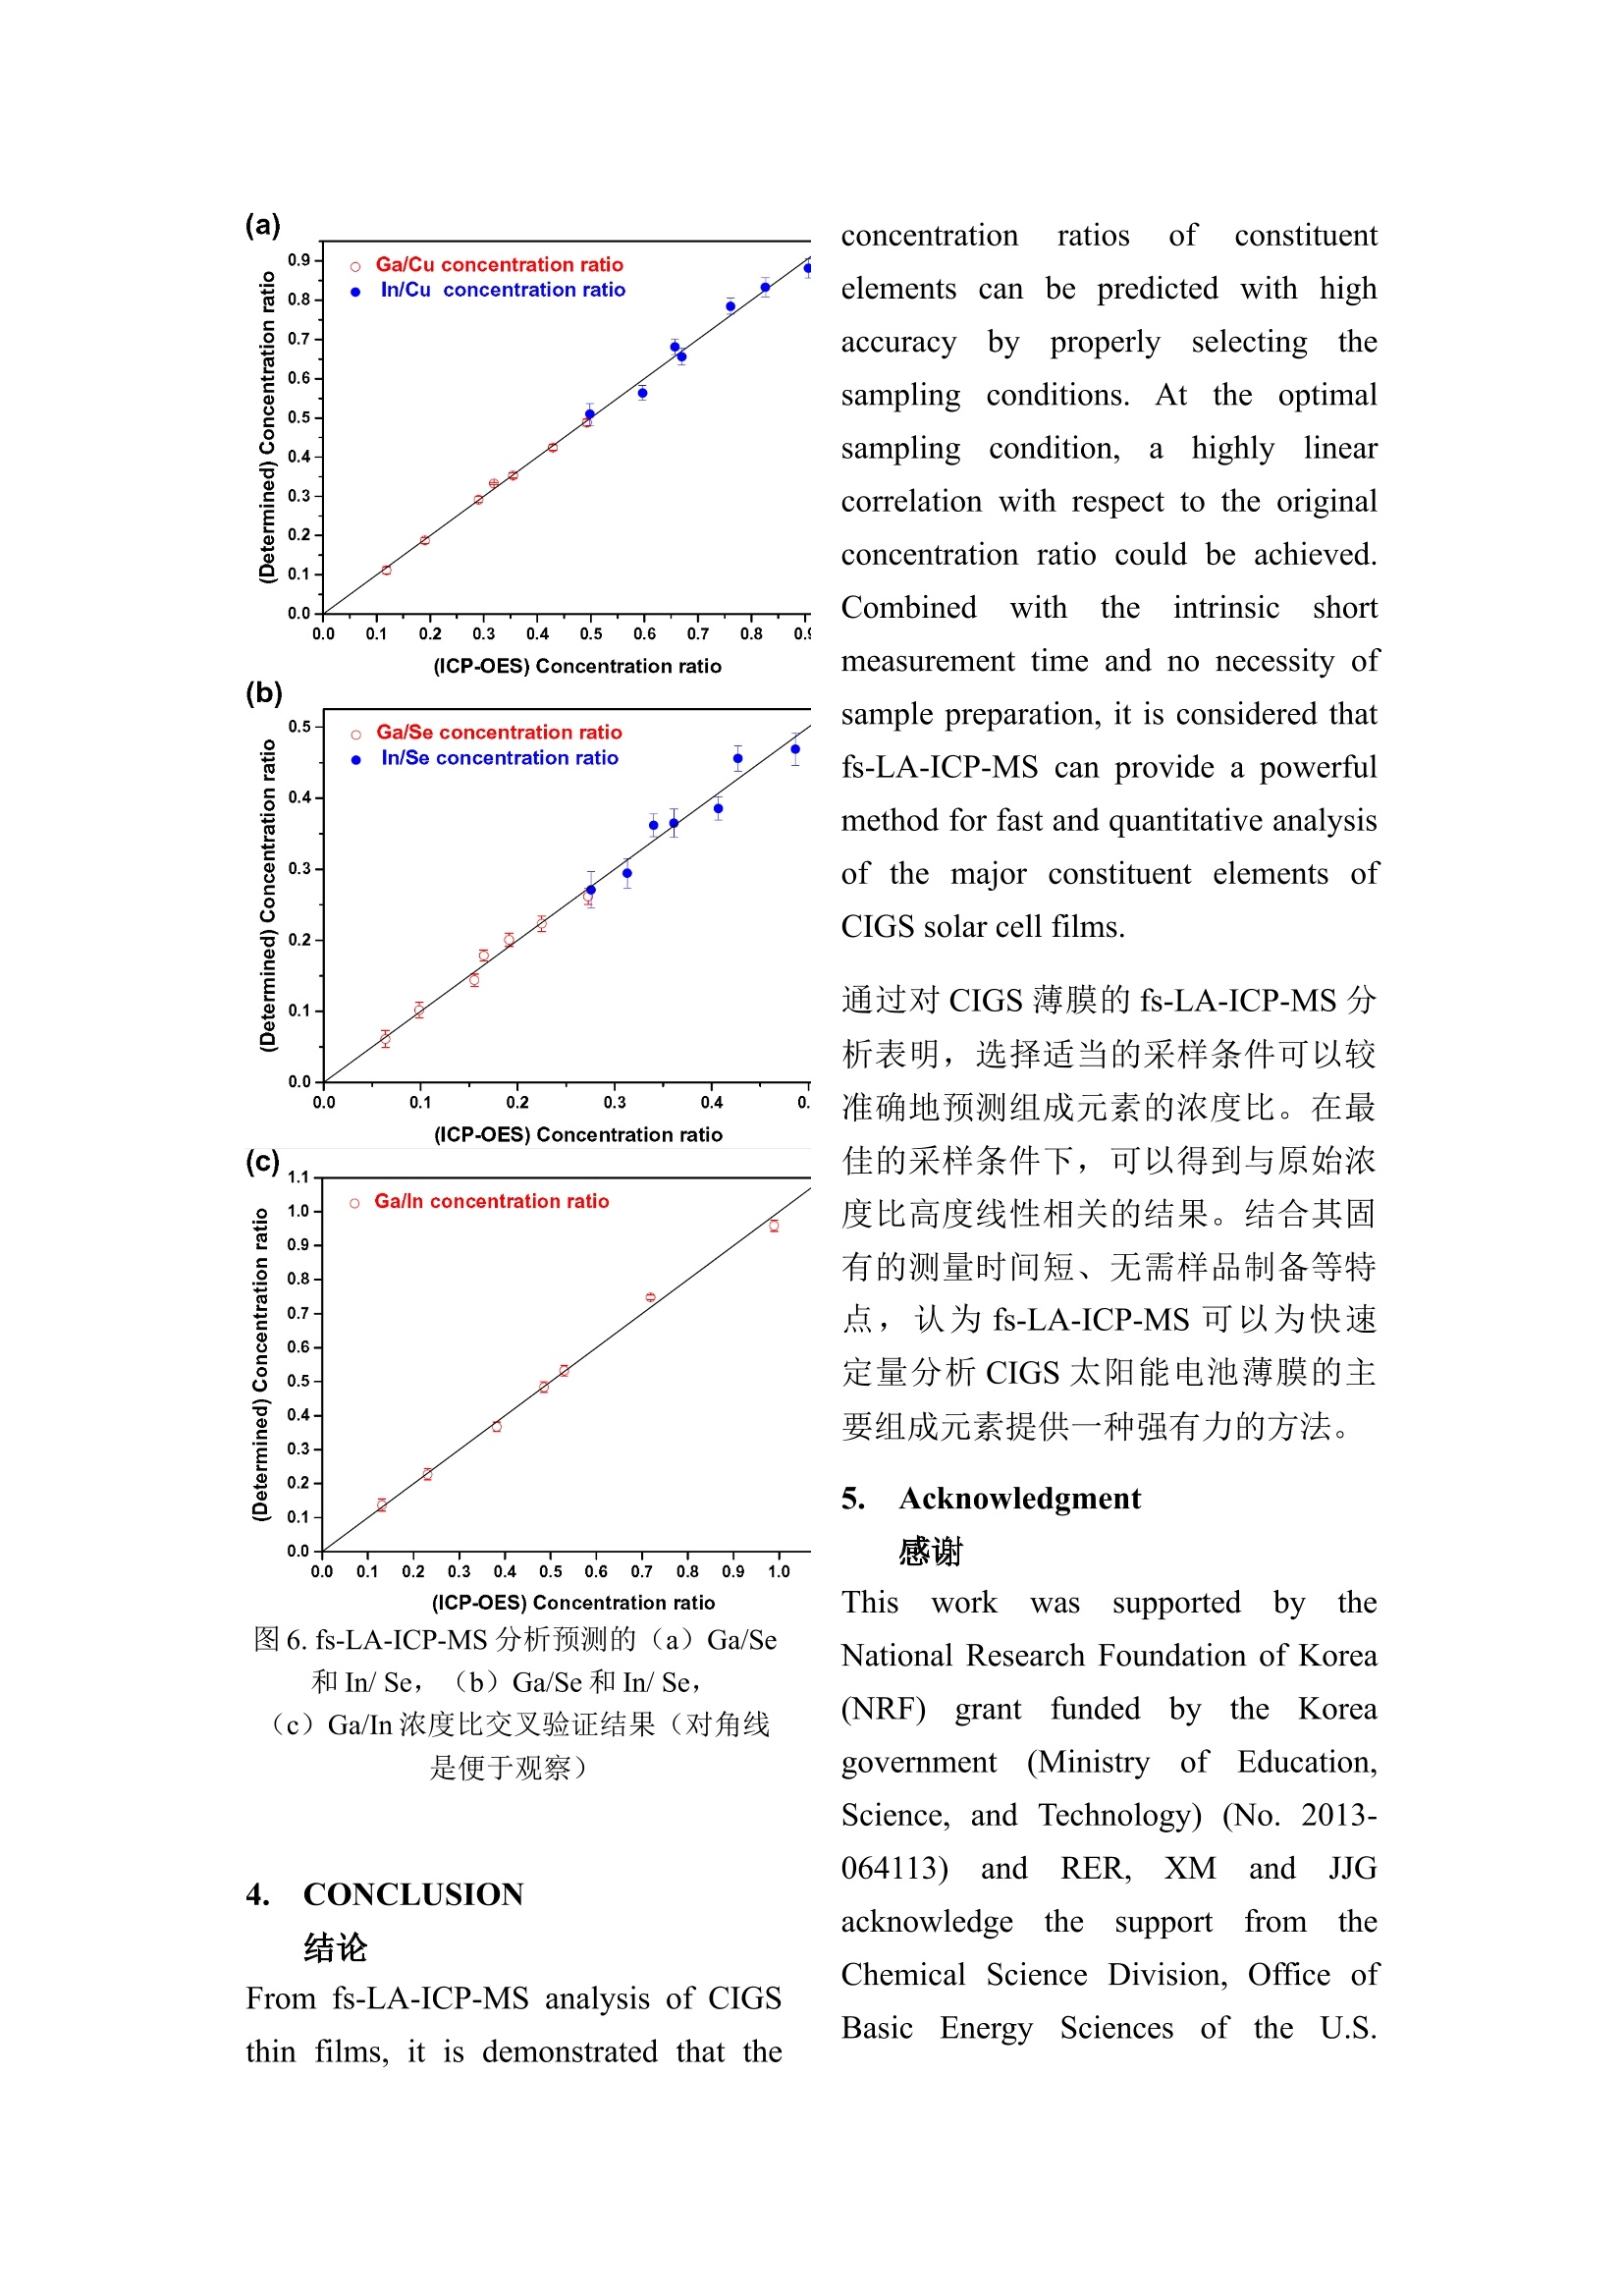
Application of femtosecond laser ablation inductively coupled plasma mass spectrometry for quantitative analysis of thin Cu(In,Ga)Se2 solar cell films 飞秒激光烧蚀电感耦合等离子体质谱法在Cu(In,Ga)Se2薄膜太阳能电池定量分析中的应用 This work reports that the composition of Cu(In,Ga)Se2 (CIGS) thin solar cell films can be quantitatively predicted with high accuracy and precision by femtosecond laser ablation-inductively coupled plasma-mass spectrometry (fs-LA-ICP-MS). It is demonstrated that the results are strongly influenced by sampling conditions during fs-laser beam (λ = 1030 nm, τ = 450 fs) scanning on the CIGS surface. The fs-LA-ICP-MS signals measured at optimal sampling conditions generally provide a straight line calibration with respect to the reference concentrations measured by inductively coupled plasma optical emission spectroscopy (ICP-OES). The concentration ratios predicted by fs-LA-ICP-MS showed high accuracy, to 95–97% of the values measured with ICP-OES, for Cu, In,Ga, and Se elements. 研究结果表明,利用飞秒激光烧蚀-电感耦合等离子体质谱法可以对太阳电池薄膜的成分进行高精度的定量分析。结果表明,在飞秒激光束(λ = 1030 nm, τ = 450 fs)扫描CIGS表面时,采样条件对扫描结果有较大的影响。在最佳采样条件下测得的fs-LA-ICP-MS信号,通常与电感耦合等离子体发射光谱法(ICP-OES)测量的参考浓度呈一条校准直线。fs-LA-ICP-MS预测的铜、铟、镓、硒元素的浓度比准确度较高,达到ICP-OES测定值的95% - 97%。 Introduction 引言 Cu(In,Ga)Se2 (CIGS) solar cell has many attractive properties such as high cell efficiency (N20%) [1], long-term stability [2], and low manufacturing cost [3], and thus there has been a tremendous research effort to improve the performance of CIGS solar cell. Several factors influence the performance of CIGS thin film solar cell, including optical transmission through the front-contact, material and thickness of the buffer layer, composition of the absorber layer, film growth process, and back-contactmaterial [2,3]. In terms of CIGS film growth, for example, various methods such as a hybrid process combining evaporation and sputtering [4], CIGS nanoparticle-coating [5] and electrodeposition as a nonvacuum process [6] have been attempted in order to achieve a higher quality CIGS as well as lower production cost. The information for structure and surface morphology of CIGS produced with different processes was also of interest [6,7]. Cu(In,Ga)Se2 (CIGS)太阳能电池具有电池效率高(N20%)、长期稳定性好([1])、制造成本低([3])等诸多吸引人的特性,因此人们对CIGS太阳能电池的性能进行了大量的研究。影响CIGS薄膜太阳能电池性能的因素有:通过正面接触的光传输、缓冲层的材料和厚度、吸收层的组成、薄膜的生长过程、反接触材料等。在薄膜生长方面,为了提高CIGS的质量和降低生产成本,尝试了多种方法,例如蒸发和溅射混合工艺、CIGS纳米涂层、真空电沉积等。对不同工艺生产的CIGS的结构和表面形态的信息也很有兴趣。 Besides the fabrication processes, the composition of major constituent elements (Cu, In, Ga, and Se) of a CIGS film is also known to be a significant factor determining the electrical and optical properties of a CIGS solar cell [8,9]. Accordingly, researches about the analysis of elemental composition of CIGS thin films have been increasing recently. Various analytical techniques such as Auger electron spectroscopy, X-ray photoelectron spectroscopy, energy dispersive X-ray spectrometry, inductively coupled plasma optical emission spectroscopy (ICP-OES), and secondary ion mass spectrometry have been used to analyze the chemical composition of CIGS thin films [10–13]. Depending on the method employed for analysis, however, the accuracy, measurement time, spatial resolution, and availability of the technique differ significantly. In principle, a fast, accurate, and reliable technique that can be readily applied for the evaluation of CIGS solar cell during device development or manufacturing processes is most desired by solar cell researchers and industry [10,14]. 除了制造工艺外,CIGS薄膜的主要组成元素(Cu、In、Ga和Se)的组成也被认为是决定CIGS太阳能电池电学和光学性能的重要因素。因此,近年来对CIGS薄膜元素组成分析的研究越来越多。利用俄歇电子能谱、x射线光电子能谱、能量色散x射线光谱、电感耦合等离子体发射光谱、二次离子质谱等多种分析技术对CIGS薄膜的化学成分进行了分析。然而,根据所采用的分析方法,该技术的准确性、测量时间、空间分辨率和可用性存在显著差异。原则上,一种快速、准确、可靠、易于在器件开发或制造过程中用于CIGS太阳能电池评估的技术是太阳能电池研究人员和工业界最渴望的。 The analysis of thin film solar cells is one of the application fields to which the characteristics of laser ablation-inductively coupled plasma mass spectrometry (LA-ICP-MS) can be effectively applied. LA-ICP-MS is a powerful method for elemental analysis with advantages of realtime analysis [15,16], minimal sample consumption, no sample preparation [17], little waste, and minimal exposure to toxic samples [18]. Accordingly, LA-ICP-MS has been employed in various areas of application such as geochemistry [19], forensic science [20], environmental science [21], semiconductors [22], biomedicine [23], nuclear non-proliferation detection [24], and so forth. The coupling of femtosecond (fs) laser to ICP-MS (fs-LA-ICP-MS) has been demonstrated as one of the most accurate analytical methods due to the capability of near stoichiometric ablation and the generation of mono-disperse nanometer sized particles that can be easily digested in the ICP [18,25,26]. The analytical performance of LA-ICP-MS was significantly enhanced with a fs-laser by reducing errors related to particle size distribution and matrix dependence [27,28]. 薄膜太阳能电池的分析是激光烧蚀-电感耦合等离子体质谱(LA-ICP-MS)的特性得以有效应用的应用领域之一。LA-ICP-MS是一种功能强大的元素分析方法,具有实时分析、样品消耗少、无样品制备、浪费少、对有毒样品接触少等优点。相应地,LA-ICP-MS也被广泛应用于地球化学、法医学、环境科学、半导体、生物医学、核不扩散检测等领域。飞秒(fs)激光与ICP- ms (fs- LA -ICP- MS)的耦合已被证明是最精确的分析方法之一,因为它具有近化学计量剥蚀的能力,并能产生易于在ICP中激发的单分散纳米颗粒。通过减少与粒度分布和基质相关的误差,fs激光显著提高了LA-ICP-MS的分析性能。 In this work, we report the results for fs-LA-ICP-MS analysis of thin CIGS solar cell films. It is shown that the elemental concentrations of CIGS films can be accurately predicted by properly choosing sampling parameters. Calibration curves were generated for the fs-LA-ICP-MS signal ratios of the constituent elements with reference materials that were validated by ICP-OES and their accuracy was analyzed. 在这项工作中,我们报告了对CIGS太阳能电池薄膜的fs-LA-ICP-MS分析结果。结果表明,通过合理选择采样参数,可以准确地检测CIGS薄膜的元素浓度。利用ICP-OES验证过的参比物质,生成组成元素的fs-LA-ICP-MS信号比值的校准曲线,对其准确性进行了分析。 Experimental details 实验细节 CIGS film preparation CIGS薄膜制备 The CIGS thin film samples used in experiments were fabricated on soda lime glass (SLG) substrates by a three stage co-evaporation method with 1 μm thick Mo back contact layer. The CIGS thin films were produced with varying Ga/In ratios by controlling Ga and In evaporation fluxes; the detailed fabrication processes of these samples were reported elsewhere [29]. The average composition of fabricated CIGS thin films was then verified by ICP-OES (Verian, 720-ES) for In, Ga and Se, and atomic absorption spectroscopy (Thermo Scientific, iCE 3000) for Cu, and the results are listed in Table 1. The thicknesses of CIGS and Mo layers were measured using scanning electron microscope (SEM) (Hitachi, S-4800, operation voltage= 15 kV) images of a cross section. 用于实验CIGS薄膜样品在附有1μm厚Mo层的钠钙玻璃作为衬底用三步共蒸发法制作的。通过控制Ga和In的蒸发通量,制备了Ga/In比值不同的CIGS薄膜,这些样品的详细制作工艺在其他地方有报道。然后,用ICP-OES (Verian, 720-ES)对制备的CIGS薄膜的In、Ga、Se进行了验证,用原子吸收光谱(Thermo Scientific, iCE 3000)对Cu进行了验证,结果如表1所示。用扫描电子显微镜(SEM) (Hitachi, S-4800, 工作电压= 15 kV)的截面图测量了CIGS层和Mo层的厚度。 fs-LA-ICP-MS system fs-LA-ICP-MS系统 A commercial laser ablation system(Applied Spectra Inc., J100, pulse width = 450 fs, wavelength = 1030 nm) coupled to an ICP-MS (Thermo Scientific, XSERIES 2)was used for the fs-LA-ICP-MS measurements. The laser spot diameter and fluence at the sample surface were fixed at about 30 μm and 19.53 J/cm2, respectively. The CIGS thin film samples were ablated in a chamber to which He was supplied at a flow rate of 0.9 L min−1 as a carrier gas. The ablated mass swept by the He gas was then entrained into an Ar make-up gas flowing at the rate of 0.9 L min−1. The experimental settings for the ICP-MS were forward power of 1400 W, Ar flow rates of 13 and 0.7 L min−1 for plasma and auxiliary gases, respectively, voltages of −82, −1150, −80, −195 V for the extraction, L1, L2, and L3 lenses. The ICP-MS measurements for six isotopes (65Cu, 115In, 71Ga, 82Se, 95Mo, 23Na) were acquired in the time resolved mode and each ICP-MS response was integrated with background subtraction to obtain the average response per isotope. 商用激光剥蚀系统(Applied spectrum Inc., J100,脉宽= 450 fs,波长= 1030 nm)与ICP-MS (Thermo Scientific, XSERIES 2)耦合用于fs- LA -ICP-MS测量。样品表面的激光光斑直径和激光能量密度被分别设定为约30μm和19.53 J / cm2。CIGS薄膜样品在He作为载气以0.9 L·min−1的流速供应的样品室中剥蚀。剥蚀的物质被He气体以0.9 L·min−1的速率带入Ar补充气体中。ICP-MS的实验设置为正向功率为1400 W,用于等离子体和辅助气体的Ar流量分别为13和0.7 L·min−1,L1、L2和L3透镜的提取电压分别为- 82、- 1150、- 80和- 195 V。在时间分辨模式下获得了6种同位素的ICP-MS测量值,并将ICP-MS各响应与背景扣除相结合,得到各同位素的平均响应。 表1 CIGS薄膜样品的浓度和厚度 样品号 浓度(wt%) 浓度比 厚度(nm) Cu In Ga Se Ga/ In CIGS Mo 1 25.72 23.31 3.05 47.92 0.131 1720 982 2 25.31 20.91 4.82 48.96 0.231 1885 991 3 25.50 19.40 7.41 47.69 0.382 2175 967 4 25.59 16.82 8.16 49.43 0.485 2020 1100 5 25.77 17.27 9.14 47.82 0.529 1885 1085 6 25.43 15.18 10.91 48.49 0.719 1358 1100 7 26.32 13.12 12.97 47.59 0.989 1335 933 Results and discussion 结果与讨论 Effects of sampling conditions 采样条件的影响 During fs-LA-ICP-MS measurements, the ICP-MS response varies sensitively with respect to ablation conditions. Since the laser spot size and energy were fixed by the system during the measurement, laser repetition rate and scan speed were varied in the ranges of 5–500 Hz and 10–500 μm/s, respectively, to examine the effects of ablation conditions. Depending on the combination of repetition rate and scan speed, the number of overlapping pulses on each laser spot changed from zero to about 30 pulses. Fig. 1(a) shows that the integrated counts per second (ICPS) of the four major elements at the conditions of repetition rate of 5 Hz and scan speed of 300 μm/s. At this condition, no overlapping took place between pulses as observed in the cross sectional profile of craters (inset of Fig. 1(a)) measured using a white light interferometric microscope (Zygo New View 6000) and the crater depth was mostly below 2 μm. Each isotope profile (65Cu, 115In, 71Ga, and 82Se) in Fig. 1(a) represents an accumulated signal from ten ablation spots along the scan direction for which the complete ablation took about 2 s (total ablated volume ≈ 400 μm3). The 23Na signal is attributed to Na element diffused from soda lime glass during the growth of the CIGS film. 图1. (a) CIGS膜上连续剥蚀10个剥蚀坑时的瞬态fs-LA-ICP-MS响应(样品3号)(重复率=5Hz,扫描速度=300μm/s);(b)在不同剥蚀条件下测得的71Ga同位素信号。 在fs-LA-ICP-MS检测中,ICP-MS的响应敏感地随剥蚀条件而变化。在检测中系统设定了激光光斑大小和能量,激光重复频率和扫描速度变化范围为5 – 500Hz和10 - 500μm/s,研究剥蚀条件的影响。根据重复频率和扫描速度的组合,每个激光点上重复脉冲的数量从0变化到大约30个脉冲。图1 (a)表明,在重复率条件5Hz和扫描速度300 μm/s条件下,获得四种主要元素的每秒综合计数(ICPS)。在这个条件下,在用白光干涉显微镜(Zygo New View 6000)测量的陨石坑的横截面剖面(图1(a)插图)上,观察到脉冲之间没有重叠,剥蚀坑深度远小于2μm。图1中每个同位素剖面(65 Cu,115In,71Ga,和82 Se)代表了延扫描方向的十个剥蚀点的累计信号,整个剥蚀大约需要2s (总剥蚀体积≈400μm3)。23Na信号是CIGS膜生长过程中钠钙玻璃中扩散的钠元素。 The accuracy and precision of the ICP-MS response shown in Fig. 1(a) are closely related to the ablation conditions. Gonzalez et al. [30] reported that the ICP-MS signal intensity and crater profile differed if the scan speed and repetition rate had changed even at the same number of overlapping pulses. The primary reason for these changes in ICP-MS response is the variation in particle characteristics such as particle size and size distribution sampled during laser–material interactions. The influence of ablation conditions on the analysis performance of ICP-MS can be examined by calculating temporal relative standard deviation (TRSD) of the ICP-MS response profiles which represents the short term signal fluctuation on the temporal response [31]. The improvement in TRSD is related to a more consistent particle size distribution and particle chemical composition during repetitive pulsed laser ablation [27]. Fig. 1(b) shows the transient ICP-MS signals of 71Ga measured at different pulse repetition rates and scan speeds. Note that the signal intensity of 71Ga increased with scan speed for the same repetition rate. This result is similar to that by Gonzalez et al. [30] where the low signal intensity at low scan speed for a fixed repetition rate was attributed to the accumulation of particles in front of the surface, decreasing the ablation and/or transport efficiency due to the absorption/diffusion of the laser beam. The signal increase of 71Ga for increasing repetition rate at the fixed scan speed of 300 μm/s may be due to an increased amount of ablated mass. The average ICPS and TRSD of 71Ga calculated at various combinations of scan speed and repetition rate are presented in Fig. 2(a). For the same repetition rate (see the 10 Hz case), the signal intensity and TRSD improved initially for increasing scan speed but became deteriorated for further increase when the signal intensity reached near the maximum. The same trend was observed for the 82Se, as shown in Fig. 2(b). Based on these results, repetition rate of 200 Hz and scan speed of 500 μm/s were selected as the optimal sampling conditions in this study to achieve high ICP-MS signal and low fluctuation. 图1(a)所示的ICP-MS响应的准确性和精密度与剥蚀条件密切相关。Gonzalez等人的[30]报告说,即使在相同数量的重复脉冲下,如果扫描速度和重复频率发生变化,ICP-MS信号强度和剥蚀坑轮廓也会发生变化。ICP-MS响应变化的主要原因是激光与材料相互作用过程中粒子特性的变化,如粒子尺寸和尺寸分布。剥蚀条件对ICP-MS分析性能的影响可以通过计算ICP-MS响应曲线的时间相对标准偏差(TRSD)来检验,TRSD代表了短时信号波动对时间响应的影响。TRSD的改善与重复脉冲激光剥蚀过程中更一致的粒径分布和颗粒化学成分有关。图1(b)为不同脉冲重复率和扫描速度下测量的71Ga瞬态ICP-MS信号。注意,在相同的重复率下,71Ga的信号强度随着扫描速度的增加而增加。这个结果与Gonzalez等人的结果相似。在固定重复率下,低扫描速度下的低信号强度归因于粒子在表面上的积累,由于激光束的吸收/扩散而降低了烧蚀和/或传输效率。在固定扫描速度为300μm/s时,71Ga的信号强度随着重复频率的增加而增加,这可能是由于剥蚀质量的增加。图2(a)为不同扫描速度和重复频率组合下71Ga的ICPS和TRSD平均值。在相同的重复频率下(见10Hz的情况),信号强度和TRSD最初随着扫描速度的增加而提高,但当信号强度接近最大值时,信号强度和TRSD进一步变差。同样的趋势也出现在82Se上,如图2(b)所示。基于这些结果,为在本研究中实现高ICP-MS信号和低波动,将重复率200Hz和扫描速度为500μm/s选为最优采样条件。 图2. (a) 71Ga和(b) 82Se信号在不同采样条件下ICPS强度和TRSD的变化(3号样品)(数据点旁边的值表示TRSD和扫描速度) Compositional analysis of CIGS thin film CIGS薄膜的成分分析 Fig. 3 shows the ablation craters and cross-sectional crater profile of one of the CIGS solar cell films sampled at the conditions of 200 Hz laser repetition rate and 500 μm/s scan speed. Each sample was scanned by the laser beam in a zig-zag pattern over an area of 200 μm × 200 μm with a line spacing of 14.3 μm. At this condition, the complete ablation of a rectangular crater took about 6.65 s. The cross-sectional profile of the rectangular crater showed that the surface between craters was significantly elevated due to accumulation of ablated particles [30]. Since the thickness of CIGS layer of the sample in Fig. 3 was only about 2.2 μm, the crater depth (N6 μm) sampled not only the CIGS film but also the Mo layer and part of the SLG substrate. 图3展示在激光重复频率为200Hz,扫描速度在500μm/s条件下,CIGS太阳能电池薄膜的剥蚀坑和剥蚀坑横断剖面图。激光束扫描样品的图形为以行间距为14.3μm的200μm×200μm面积的折形图。在这种条件下,一个矩形剥蚀坑的完全剥蚀大约需要6.65秒。矩形剥蚀坑的横剖面显示,由于剥蚀颗粒的堆积,剥蚀坑之间的表面显著升高。因为图3中CIGS层的厚度仅为2.2μm,剥蚀坑深度(>6μm)不仅对CIGS层取样,也对Mo层和部分SLG衬底采样。 图3. CIGS薄膜上剥蚀坑和横断面的扫描电镜图(3号样品)(重复速率=200Hz,扫描速度=500μm/s) The same fs-LA-ICP-MS measurement was repeated over a 3 × 3 crater array for each CIGS sample and the average from the nine rectangular craters was then used to represent the ICP-MS isotope signal of each sample. Fig. 4 shows the ICP-MS responses of 65Cu, 71Ga, 82Se, and 115In isotopes, representing the four major elements of CIGS solar cell films, from the nine rectangular craters sampled at the laser repetition rate of 200 Hz and scan speed of 500 μm/s. It is observed that the transient responses of ICP-MS are consistent over the nine rectangular craters, which demonstrates that the CIGS thin film had a spatially homogeneous elemental composition. The detailed time response profiles of the ICP-MS can be found from the signals of the first crater in Fig. 4. The measurement of 65Mo in Fig. 4 indicates that the ablation took place not only through the CIGS layer but also into the Mo layer at this condition. The relative standard deviation (RSD) of the ICPS intensities of each isotope signal from the nine craters in Fig. 4 was estimated to be within 1.3–6.8%, implying that highly reproducible measurement can be performed with fs-LA-ICP-MS at the optimal sampling condition. In comparison , when the ablation was carried out at the reduced repetition rate and scan speed of 5 Hz and 300 μm/s, respectively, the conditions at which ablation depth became nearly the same as the CIGS film thickness as shown in the inset of Fig. 1(a), the RSD values of average signals from ten measurements (with ten ablation spots per measurement) increased to the range of 5.8–18.6%. The deterioration of reproducibility at this reduced repetition rate and scan speed is considered to be related to the variation in particle characteristics as discussed above. 每个CIGS样品在3×3个剥蚀坑阵列上重复相同的fs-LA-ICP-MS测量,然后用9个矩形剥蚀坑的平均值表示每个样品的ICP-MS同位素信号。图4展示了在重复速率=200Hz,扫描速度=500μm/s条件下,CIGS太阳能电池薄膜九个矩形剥蚀坑的四个主要元素65Cu,71Ga, 82Se, 115In同位素的ICP-MS响应。结果表明,在9个矩形剥蚀坑上,ICP-MS的瞬态响应是一致的,说明CIGS薄膜在空间上具有均匀的元素组成。ICP-MS的详细时间响应曲线可以从图4中第一个剥蚀坑的信号中找到。图4中65Mo的测量结果表明,在此条件下剥蚀不仅发生在CIGS层,还发生在Mo层。图4中9个剥蚀坑同位素信号的ICPS强度的相对标准偏差(RSD)估计在1.3~6.8%以内,这意味着在最佳的采样条件下,可以使用fs-LA-ICP-MS进行高重复性的测量。相比之下,剥蚀时的重复频率和扫描速度分别降低为5Hz和300μm/s时,图1(a)的插图中所示,在剥蚀深度几乎与CIGS膜厚度相同的情况下,来自十次检测的平均信号的RSD值增加到5.8~18.6%。在这种减小重复率和扫描速度条件下,再现性的差被认为与上文讨论的粒子特性的变化有关。 图4. 9个采样矩剥蚀坑(3号样品) 65Cu、71Ga、82Se、115In和95Mo同位素的瞬态fs-LA-ICP-MS信号 Since the thickness of each CIGS sample was different from others as shown in Table 1, the ablated mass of an element from each sample becomes proportional to not only the elemental concentration but also the sample thickness. Thus, absolute ICPS of the ICP-MS isotope signal cannot be directly correlated to the elemental concentration of each sample. Alternatively, since the ICPS ratios between elements should remain proportional to the elemental concentration ratios of each CIGS sample, the measured fs-LA-ICP-MS signal was calibrated with respect to the relative concentrations of constituent elements. Because the concentrations of Cu and Se were almost constant at around 25 at.% and 50 at.%, respectively, among the CIGS solar cell samples, these elements were utilized as the internal standards for the generation of calibration curves. The calibration curve of Ga/In ratio also was established because the Ga/In ratio is a crucial factor determining CIGS solar cell efficiency. Fig. 5 shows the calibration curves for Ga/Cu, In/Cu, Ga/Se, In/Se, and Ga/In established from the ICPS ratio data acquired at the optimal sampling condition. Fig. 5 demonstrates that the obtained calibration curves have a good linear correlation with the ICP-OES measured elemental concentration ratios. The R2 values of the linear fitting on the calibration curve were close to or over 0.99 except the In/Se ratio (0.96). By taking the ICPS ratios instead of the absolute intensities, the RSD values of the nine measurements decreased to below 2% in average (maximum 3.24% for Ga/Se) as shown in Table 2. These results confirm that fs-LA-ICP-MS measurement provides accurate calibration results for composition analysis of CIGS films. 由于每个CIGS样品的厚度与其他样品不同,如表1所示,每个样品中元素的剥蚀质量不仅与元素浓度成正比,而且与样品厚度成正比。因此,ICP-MS同位素信号的绝对ICPS不可能与每个样品的元素浓度直接相关。另外,由于元素间的ICPS比值应与每个CIGS样品的元素浓度比值成比例,因此测量的fs-LA-ICP-MS信号应根据组成元素的相对浓度进行校准。由于在CIGS太阳能电池样品中Cu和Se的浓度分别几乎保持在25%和50%左右,这些元素作为生成校准曲线的内标。由于Ga/In比值是决定CIGS太阳能电池效率的关键因素,因此建立了Ga/In比值的校准曲线。图5为最佳采样条件下由ICPS比数据建立的Ga/Cu、In/Cu、Ga/Se、In/Se、Ga/In的校准曲线。由图5可知,得到的校准曲线与ICP-OES测得的元素浓度比值具有良好的线性相关关系。除In/Se比(0.96)外,校准曲线线性拟合的R2值接近或超过0.99。采用ICPS比值而不是绝对强度,9个测量值的RSD值平均下降到2%以下(Ga/Se最大3.24%),如表2所示。这些结果证实了fs-LA-ICP-MS测量为CIGS膜的成分分析提供了准确的校准结果。 图5. fs-LA-ICP-MS检测ICPS比的校准曲线:(a)Ga/Cu和In/ Cu,(b)Ga/Cu和In/ Cu,(c)Ga/In(数据点旁边的数字表示样品号) 表2. 9个测量值的ICPS比值的相对标准偏差 样品号 相对标准偏差(%) Ga/Cu In/Cu Ga/Se In/Se Ga/In 1 1.06 2.40 1.85 1.10 2.30 2 1.11 1.34 1.85 1.81 1.48 3 1.66 0.86 1.55 1.12 1.25 4 1.32 1.70 1.83 2.07 2.07 5 1.52 1.69 3.24 2.65 1.38 6 1.49 1.62 1.54 1.42 1.15 7 1.90 1.48 2.00 1.22 1.87 平均值 1.44 1.58 1.98 1.63 1.64 In order to evaluate the accuracy of predicted concentration, cross validation was carried out using the measured fs-LA-ICP-MS data as follows [32–34]. For example, to calculate the concentration ratio of Ga/In in sample 1 from the fs-LA-ICP-MS data, the ICP-OES measured concentration ratios of samples 2–7 (y2–7) in Fig. 5(c) were fitted into a linear equation as a function of ICPS ratio (x) (y2–7=a+bx), leaving out sample 1. Then, using the y2–7=a+bx equation and measured ICPS ratio of sample 1, the concentration ratio (Ga/In) of sample 1was predicted and plotted with respect to the concentration measured by ICP-OES. The same procedure was repeated for all samples and the five different calibration curves, and the results are shown in Fig. 6. The closeness of the concentration ratios predicted by cross-validation to the ICP-OES measured values was evaluated from the R2, slope, and intercept values of the data in Fig. 6 as summarized in Table 3,which should become1, 1, and 0, respectively, for perfect correlation. Root mean square of relative error (RMSRE) of the calibration curves was also estimated using the following equation [34], where CICP-OES is the concentration ratio measured by ICP-OES and CDetermined is the concentration ratio predicted through the cross validation procedures. The results of RMSRE calculation in Table 3 demonstrate that the concentration ratio of any two constituent elements of CIGS thin film can be predicted using fs-LA-ICP-MS with a confidence level of about 95–97% of the ICP-OES measured concentration ratio. 为了评价预测浓度的准确性,利用fs-LA-ICP-MS实测数据进行交叉验证。例如,为了从fs-LA-ICP-MS数据中计算样品1中Ga/In的浓度比,将图5(c)中样品2~7 (y2~ 7)的ICP-OES测得的浓度比被拟合成一个线性方程作为ICPS(x)比值的函数(y2~7=a+bx),不考虑样品1。然后,利用y2~7=a+bx方程和测得的样品1 的ICPS比值,预测样品1的浓度比(Ga/In),用ICP-OES测得的浓度作图。对所有样品和五种不同的校准曲线重复相同的步骤,结果如图6所示。交叉验证预测的浓度比与ICP-OES的实测值之间的接近性由表3总结的图6中的R2、斜率、截距值进行了评估,值分别为1、1、0,为完全相关。 校准曲线的均方根相对误差用以下方程计算,其中CICP-OES为ICP-OES测量的浓度比,Cdetermine为交叉验证程序预测的浓度比。表3中RMSRE计算结果表明,使用fs-LA-ICP-MS可以预测CIGS薄膜中任意两种成分元素的浓度比,其置信度约为ICP-OES测量浓度比的95%~97%。 (1) 表3 交叉验证结果的线性拟合参数和RMSRE 元素比 R2 斜率 截距 RMSRE(%) Ga/Cu 0.997 1.003 -0.002 2.87 In/Cu 0.972 0.981 0.013 3.20 Ga/Se 0.982 0.972 0.004 5.19 In/Se 0.927 0.990 0.003 4.86 Ga/In 0.996 0.985 0.006 2.99 Based on the calibration curves of the ICPS ratio of fs-LA-ICP-MS data, not only the concentration ratios of constituent elements but also the absolute elemental concentration of a CIGS film of unknown composition can be determined quantitatively. Provided that the composition of the CIGS can be represented by the four major elements, ignoring trace elements, such that XCu + XIn + XGa + XSe = 100 where X is the atomic concentration (%) of an element, the absolute concentrations of all four elements can be determined using the calibration curves. At least three of the five calibration curves in Fig. 5 are needed for this purpose. Note that the calibration curves in Fig. 5 are independent of each other. Since the calibration curves for Ga/Cu, Ga/Se, and Ga/In had high linearity and small RMSREs as shown in Fig. 5 and Table 3, these curves may be selected for the prediction. Then, using the XGa/XCu, XGa/XSe, and XGa/XIn values determined from the calibration curves with XCu + XIn + XGa + XSe = 100, the absolute concentration values of the four major elements can be readily obtained. 根据fs-LA-ICP-MS数据的ICPS比值校准曲线,不仅可以定量测定组成元素的浓度比,而且可以定量测定未知组成的CIGS膜的绝对元素浓度。如果CIGS的组成可以用四个元素来表示,忽略杂质元素,则XCu + XIn + XGa + XSe = 100,其中x为元素的原子浓度(%),通过校准曲线可以确定四种元素的绝对浓度。图5中的5条校准曲线中至少有3条需要用于此目的。注意,图5中的校准曲线是相互独立的。由于Ga/Cu、Ga/Se、Ga/In的校准曲线线性度高、RMSRE小,如图5、表3所示,可以选择这些曲线进行预测。然后,利用校准曲线确定的XGa/XCu、XGa/XSe、XGa/XIn值与XCu + XIn + XGa + XSe = 100,即可得到四种主要元素的绝对浓度值。 图6. fs-LA-ICP-MS分析预测的(a)Ga/Se和In/ Se,(b)Ga/Se和In/ Se,(c)Ga/In浓度比交叉验证结果(对角线是便于观察) CONCLUSION 结论 From fs-LA-ICP-MS analysis of CIGS thin films, it is demonstrated that the concentration ratios of constituent elements can be predicted with high accuracy by properly selecting the sampling conditions. At the optimal sampling condition, a highly linear correlation with respect to the original concentration ratio could be achieved. Combined with the intrinsic short measurement time and no necessity of sample preparation, it is considered that fs-LA-ICP-MS can provide a powerful method for fast and quantitative analysis of the major constituent elements of CIGS solar cell films. 通过对CIGS薄膜的fs-LA-ICP-MS分析表明,选择适当的采样条件可以较准确地预测组成元素的浓度比。在最佳的采样条件下,可以得到与原始浓度比高度线性相关的结果。结合其固有的测量时间短、无需样品制备等特点,认为fs-LA-ICP-MS可以为快速定量分析CIGS太阳能电池薄膜的主要组成元素提供一种强有力的方法。 Acknowledgment 感谢 This work was supported by the National Research Foundation of Korea (NRF) grant funded by the Korea government (Ministry of Education, Science, and Technology) (No. 2013-064113) and RER, XM and JJG acknowledge the support from the Chemical Science Division, Office of Basic Energy Sciences of the U.S. Department of Energy under contract number DE-AC02-05CH11231 at the Lawrence Berkeley National Laboratory. 这项工作得到了韩国政府(教育、科学和技术部)资助的国家研究基金会(NRF)的支持(No. 2013-064113)(No. 2010-0028271)。感谢美国能源部基础能源科学办公室化学科学部对劳伦斯伯克利国家实验室DE-AC02-05CH11231号合同的支持。 Thin Solid Films 577 (2015) 82–87 图1. (a) CIGS膜上连续剥蚀10个剥蚀坑时的瞬态fs-LA-ICP-MS响应(样品3号)(重复率=5Hz,扫描速度=300μm/s);(b)在不同剥蚀条件下测得的71Ga同位素信号。图4. 9个采样矩剥蚀坑(3号样品) 65Cu、71Ga、82Se、115In和95Mo同位素的瞬态fs-LA-ICP-MS信号 图5. fs-LA-ICP-MS检测ICPS比的校准曲线:(a)Ga/Cu和In/ Cu,(b)Ga/Cu和In/ Cu,(c)Ga/In(数据点旁边的数字表示样品号)
确定
还剩13页未读,是否继续阅读?

产品配置单
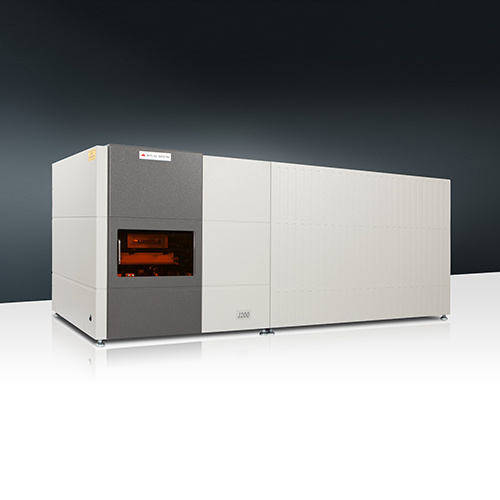
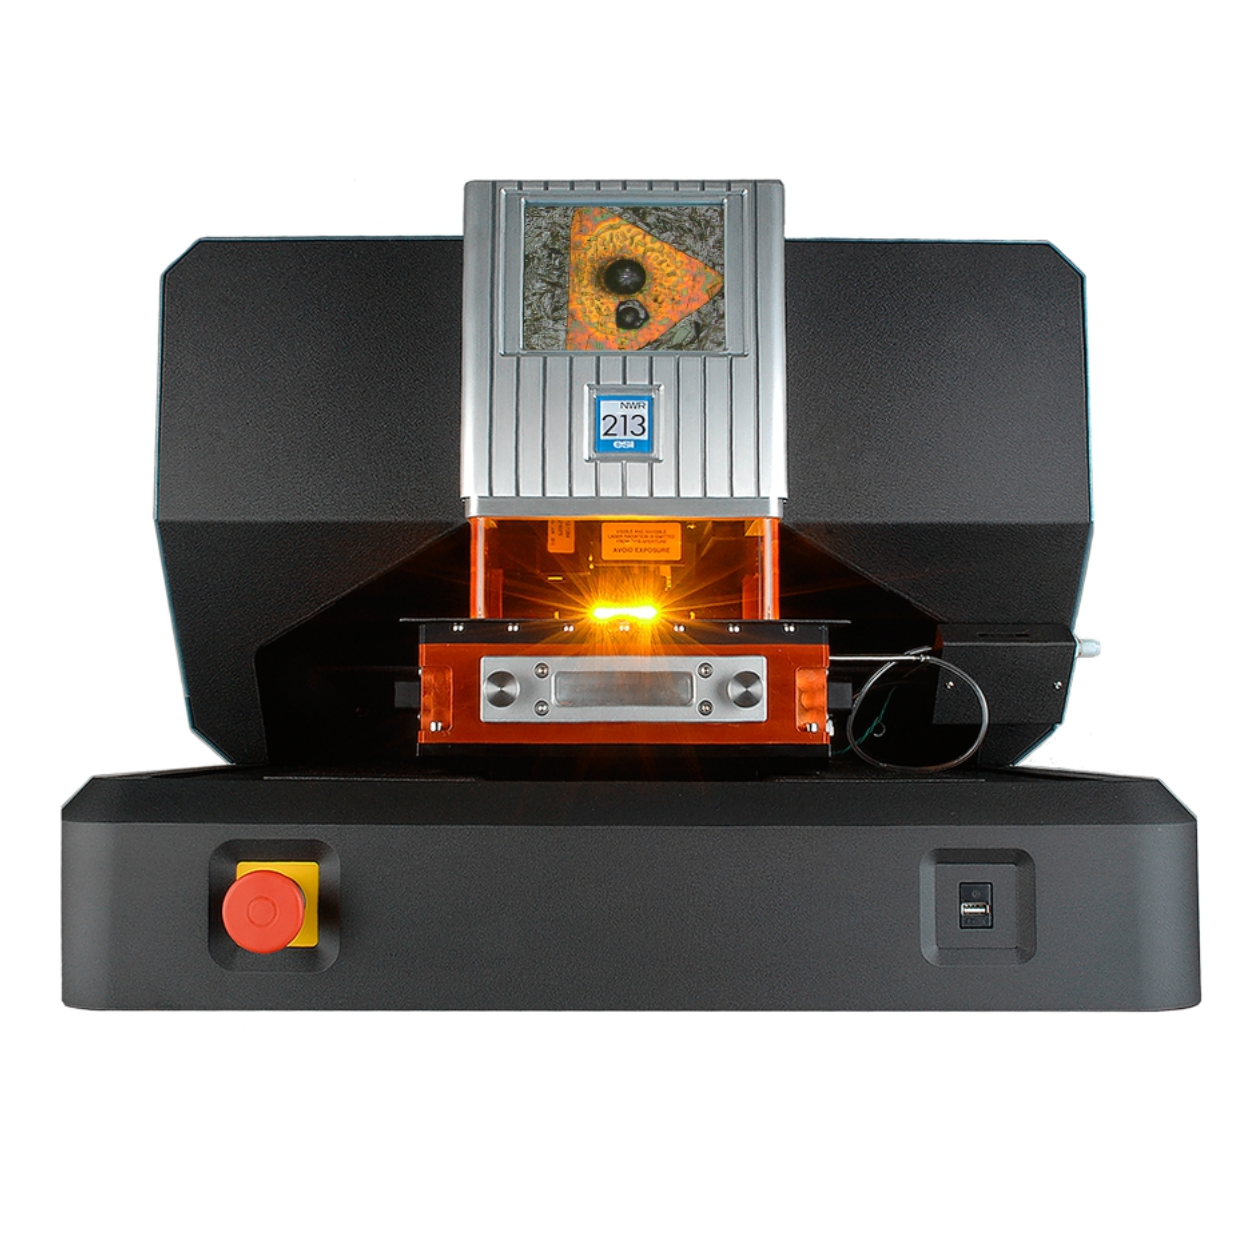
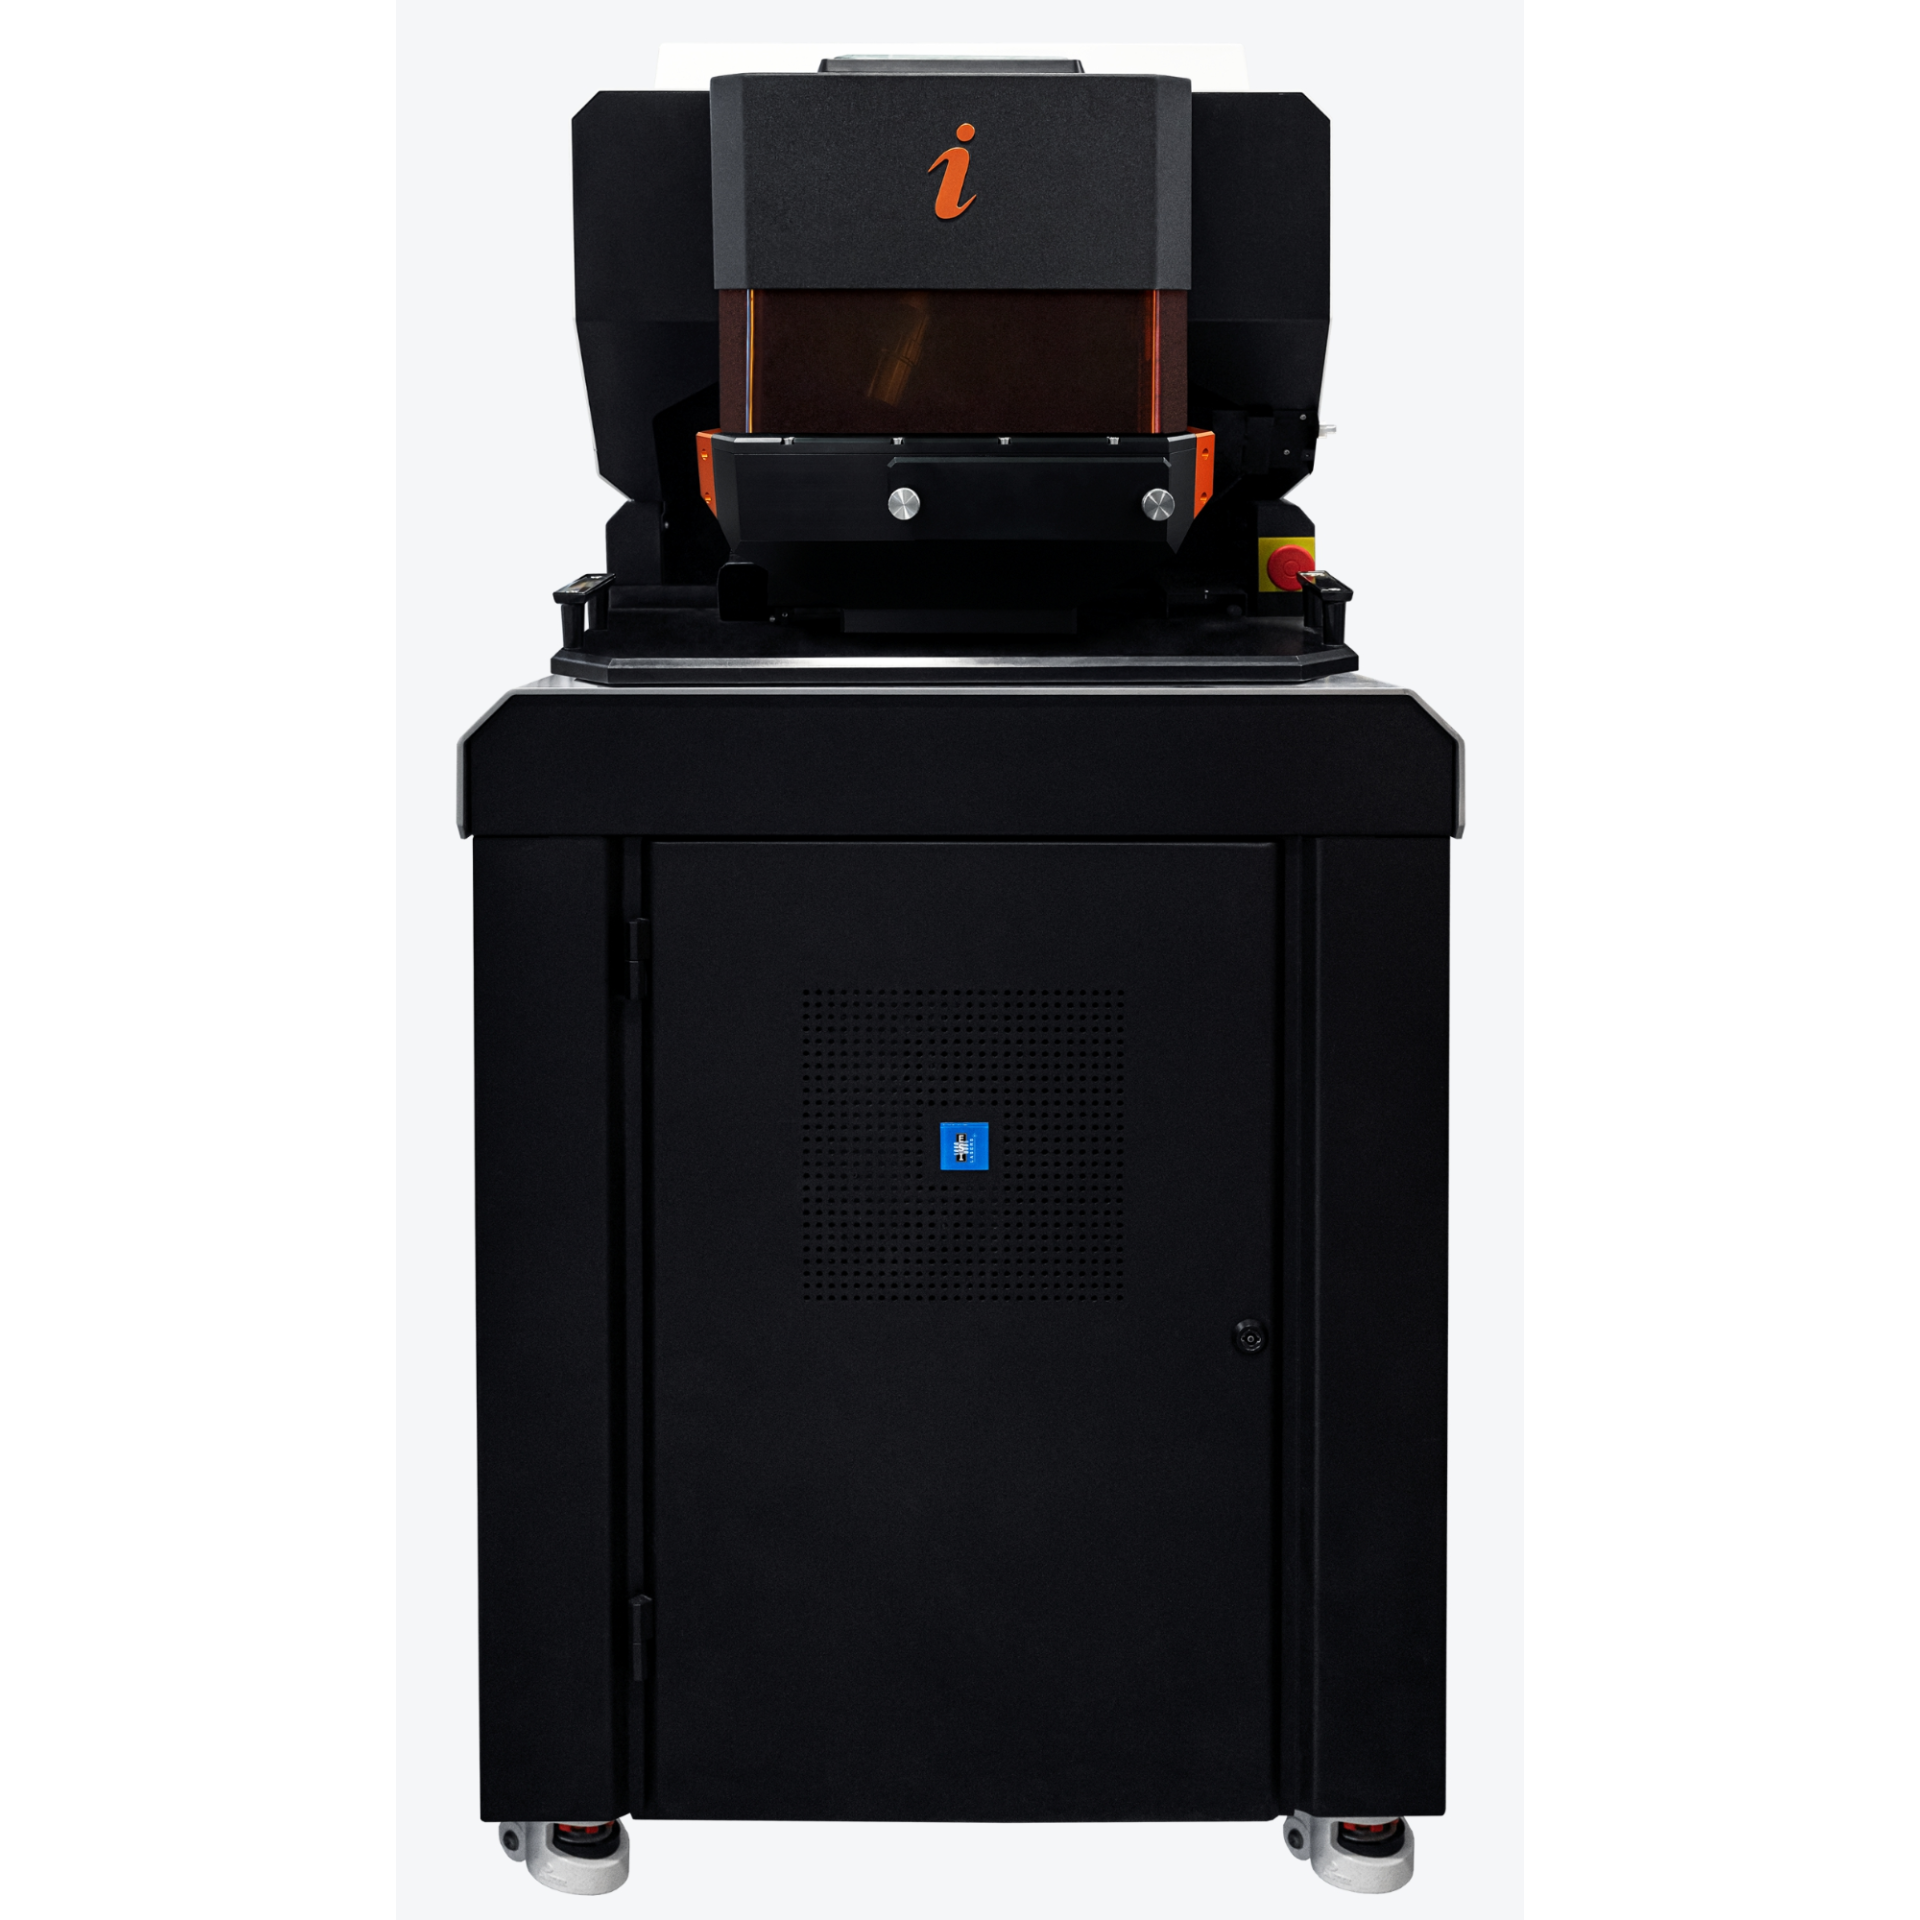
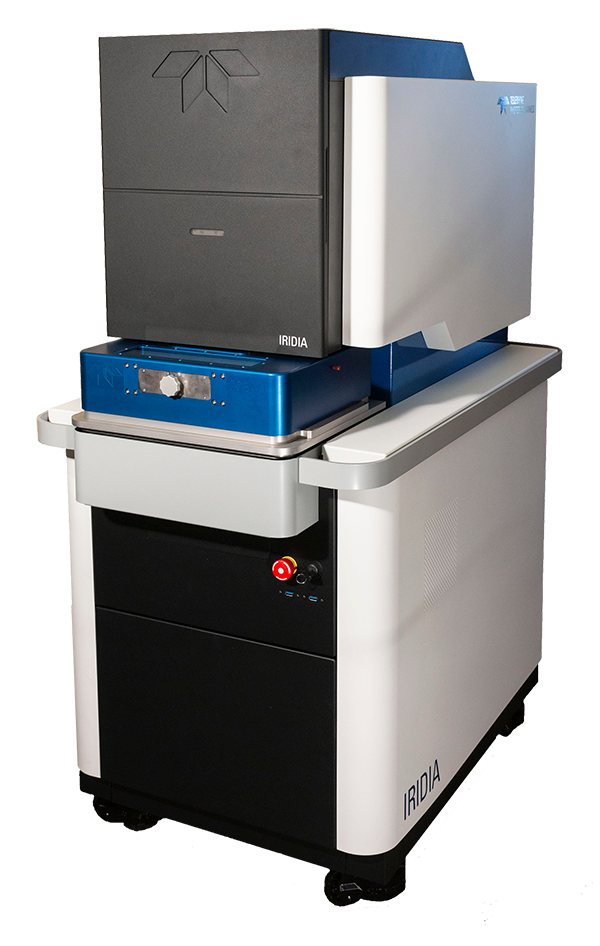
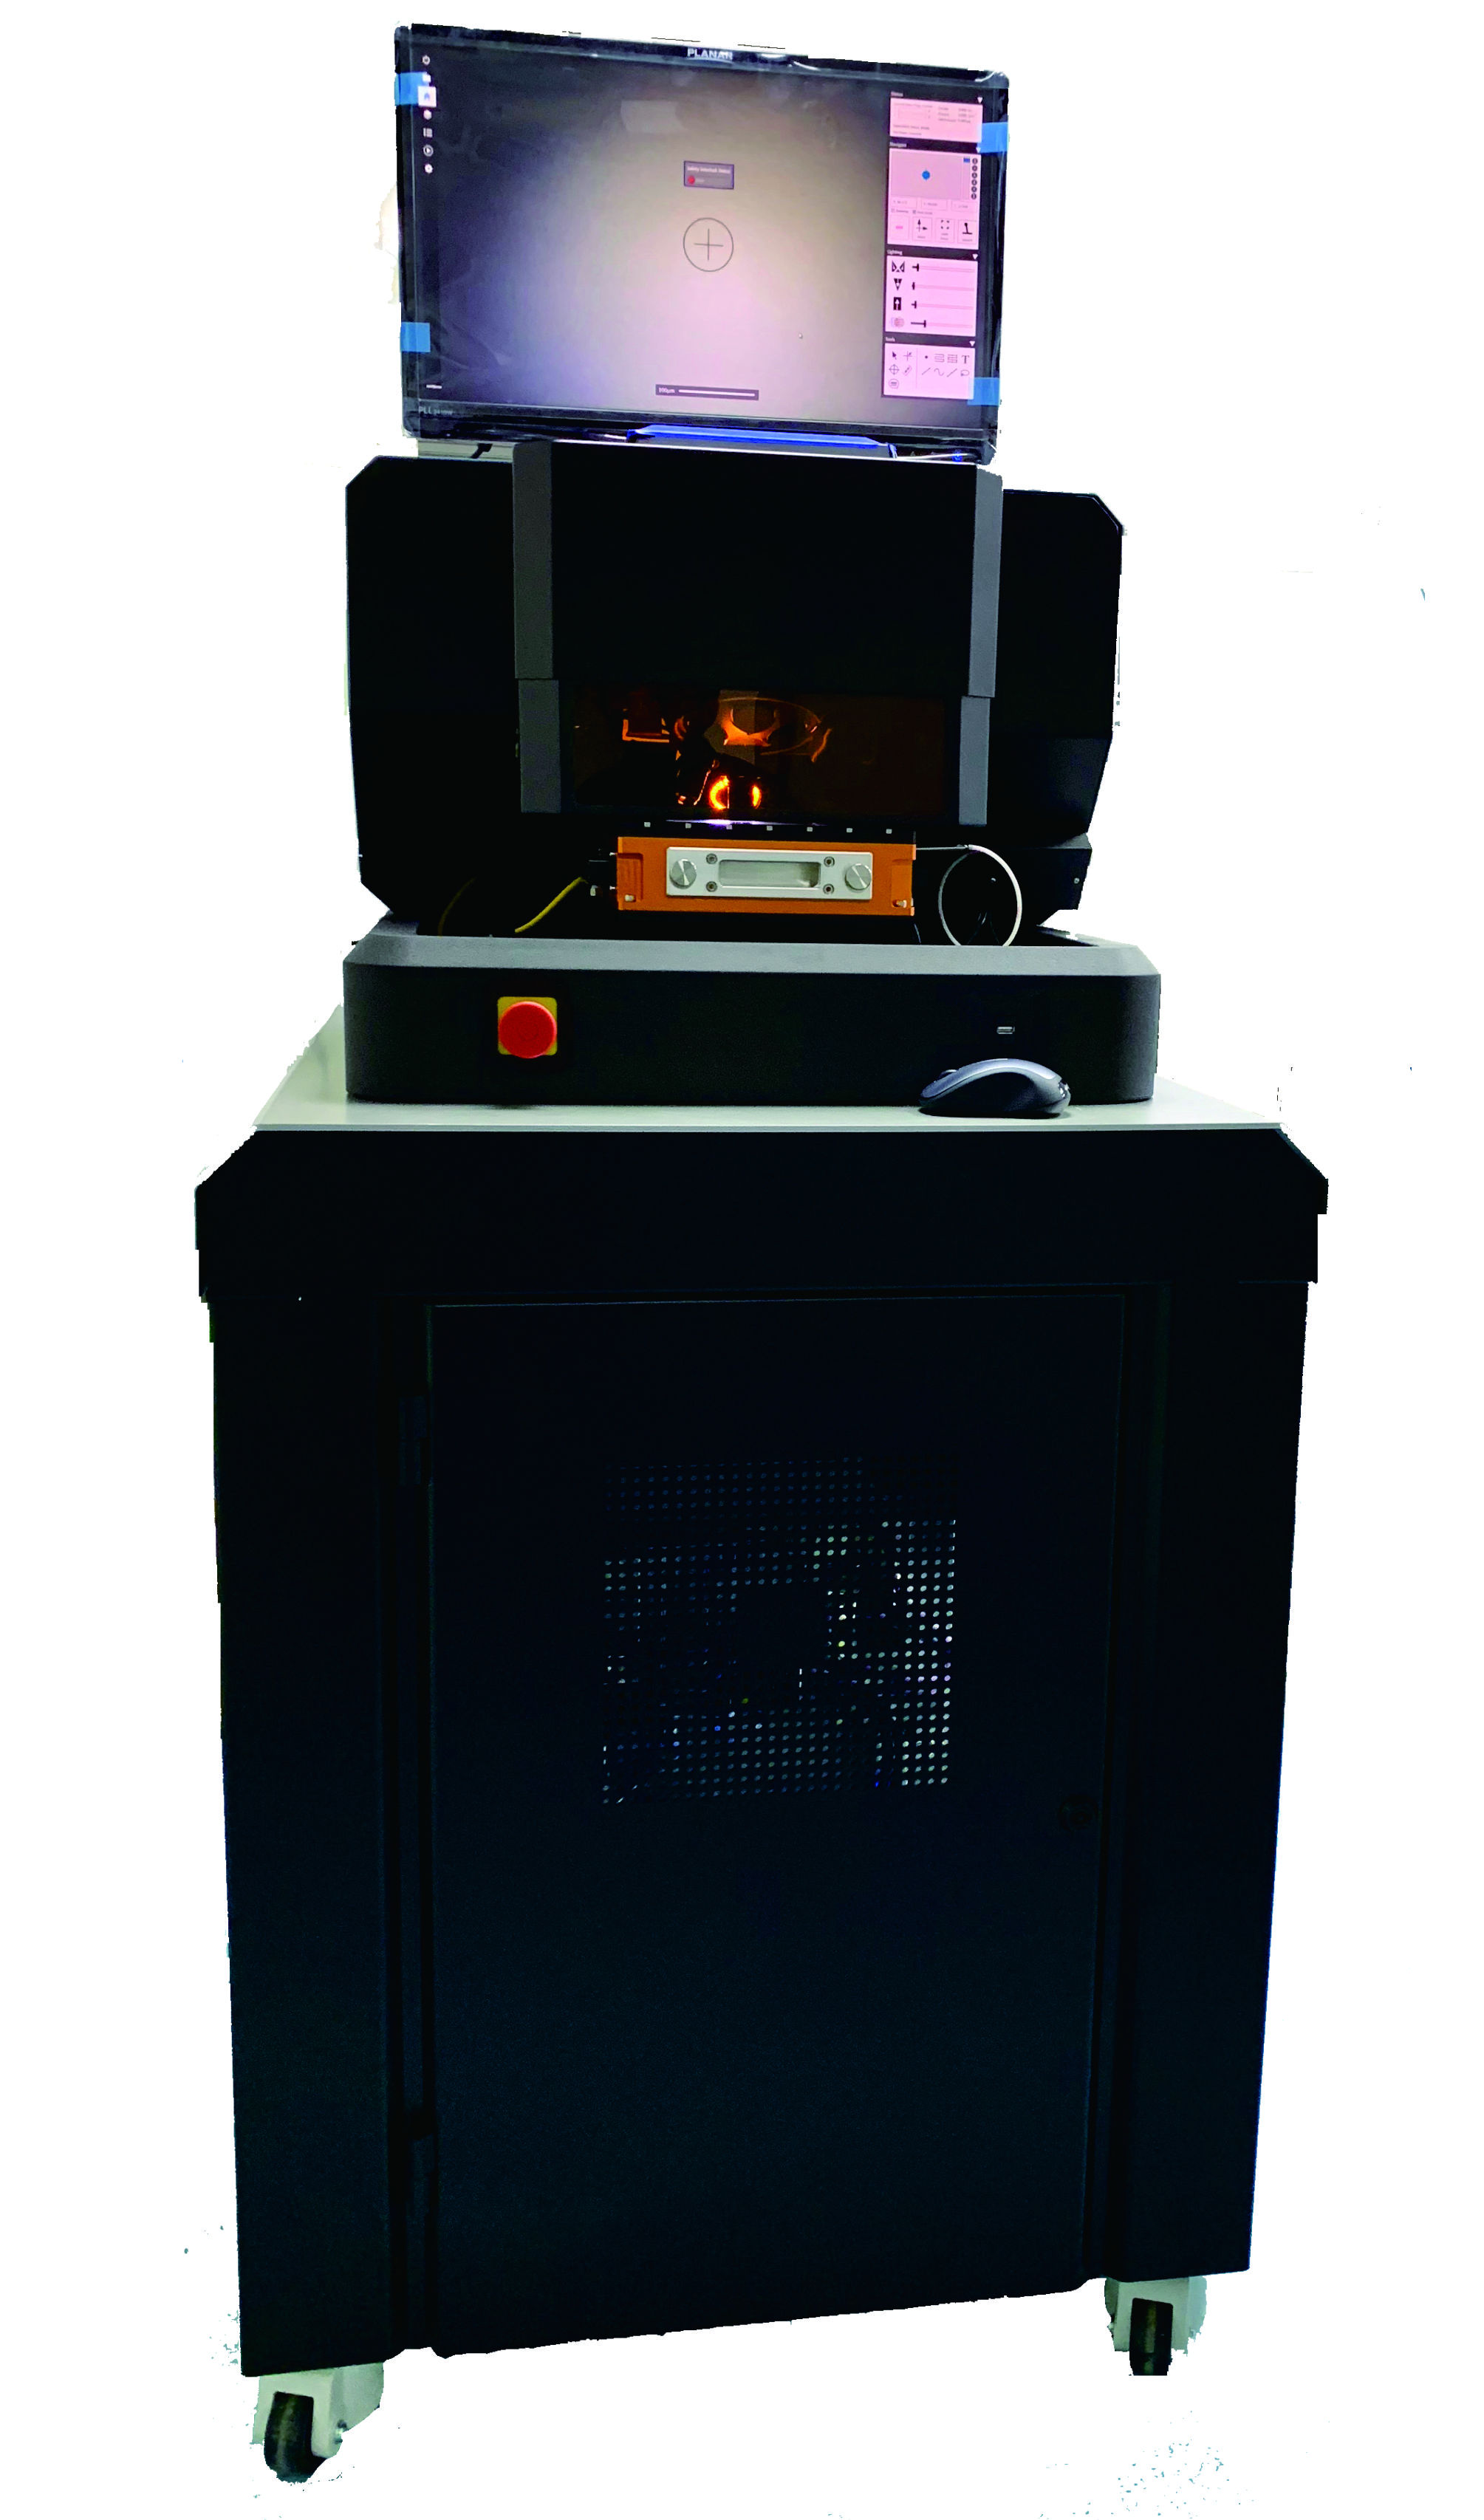
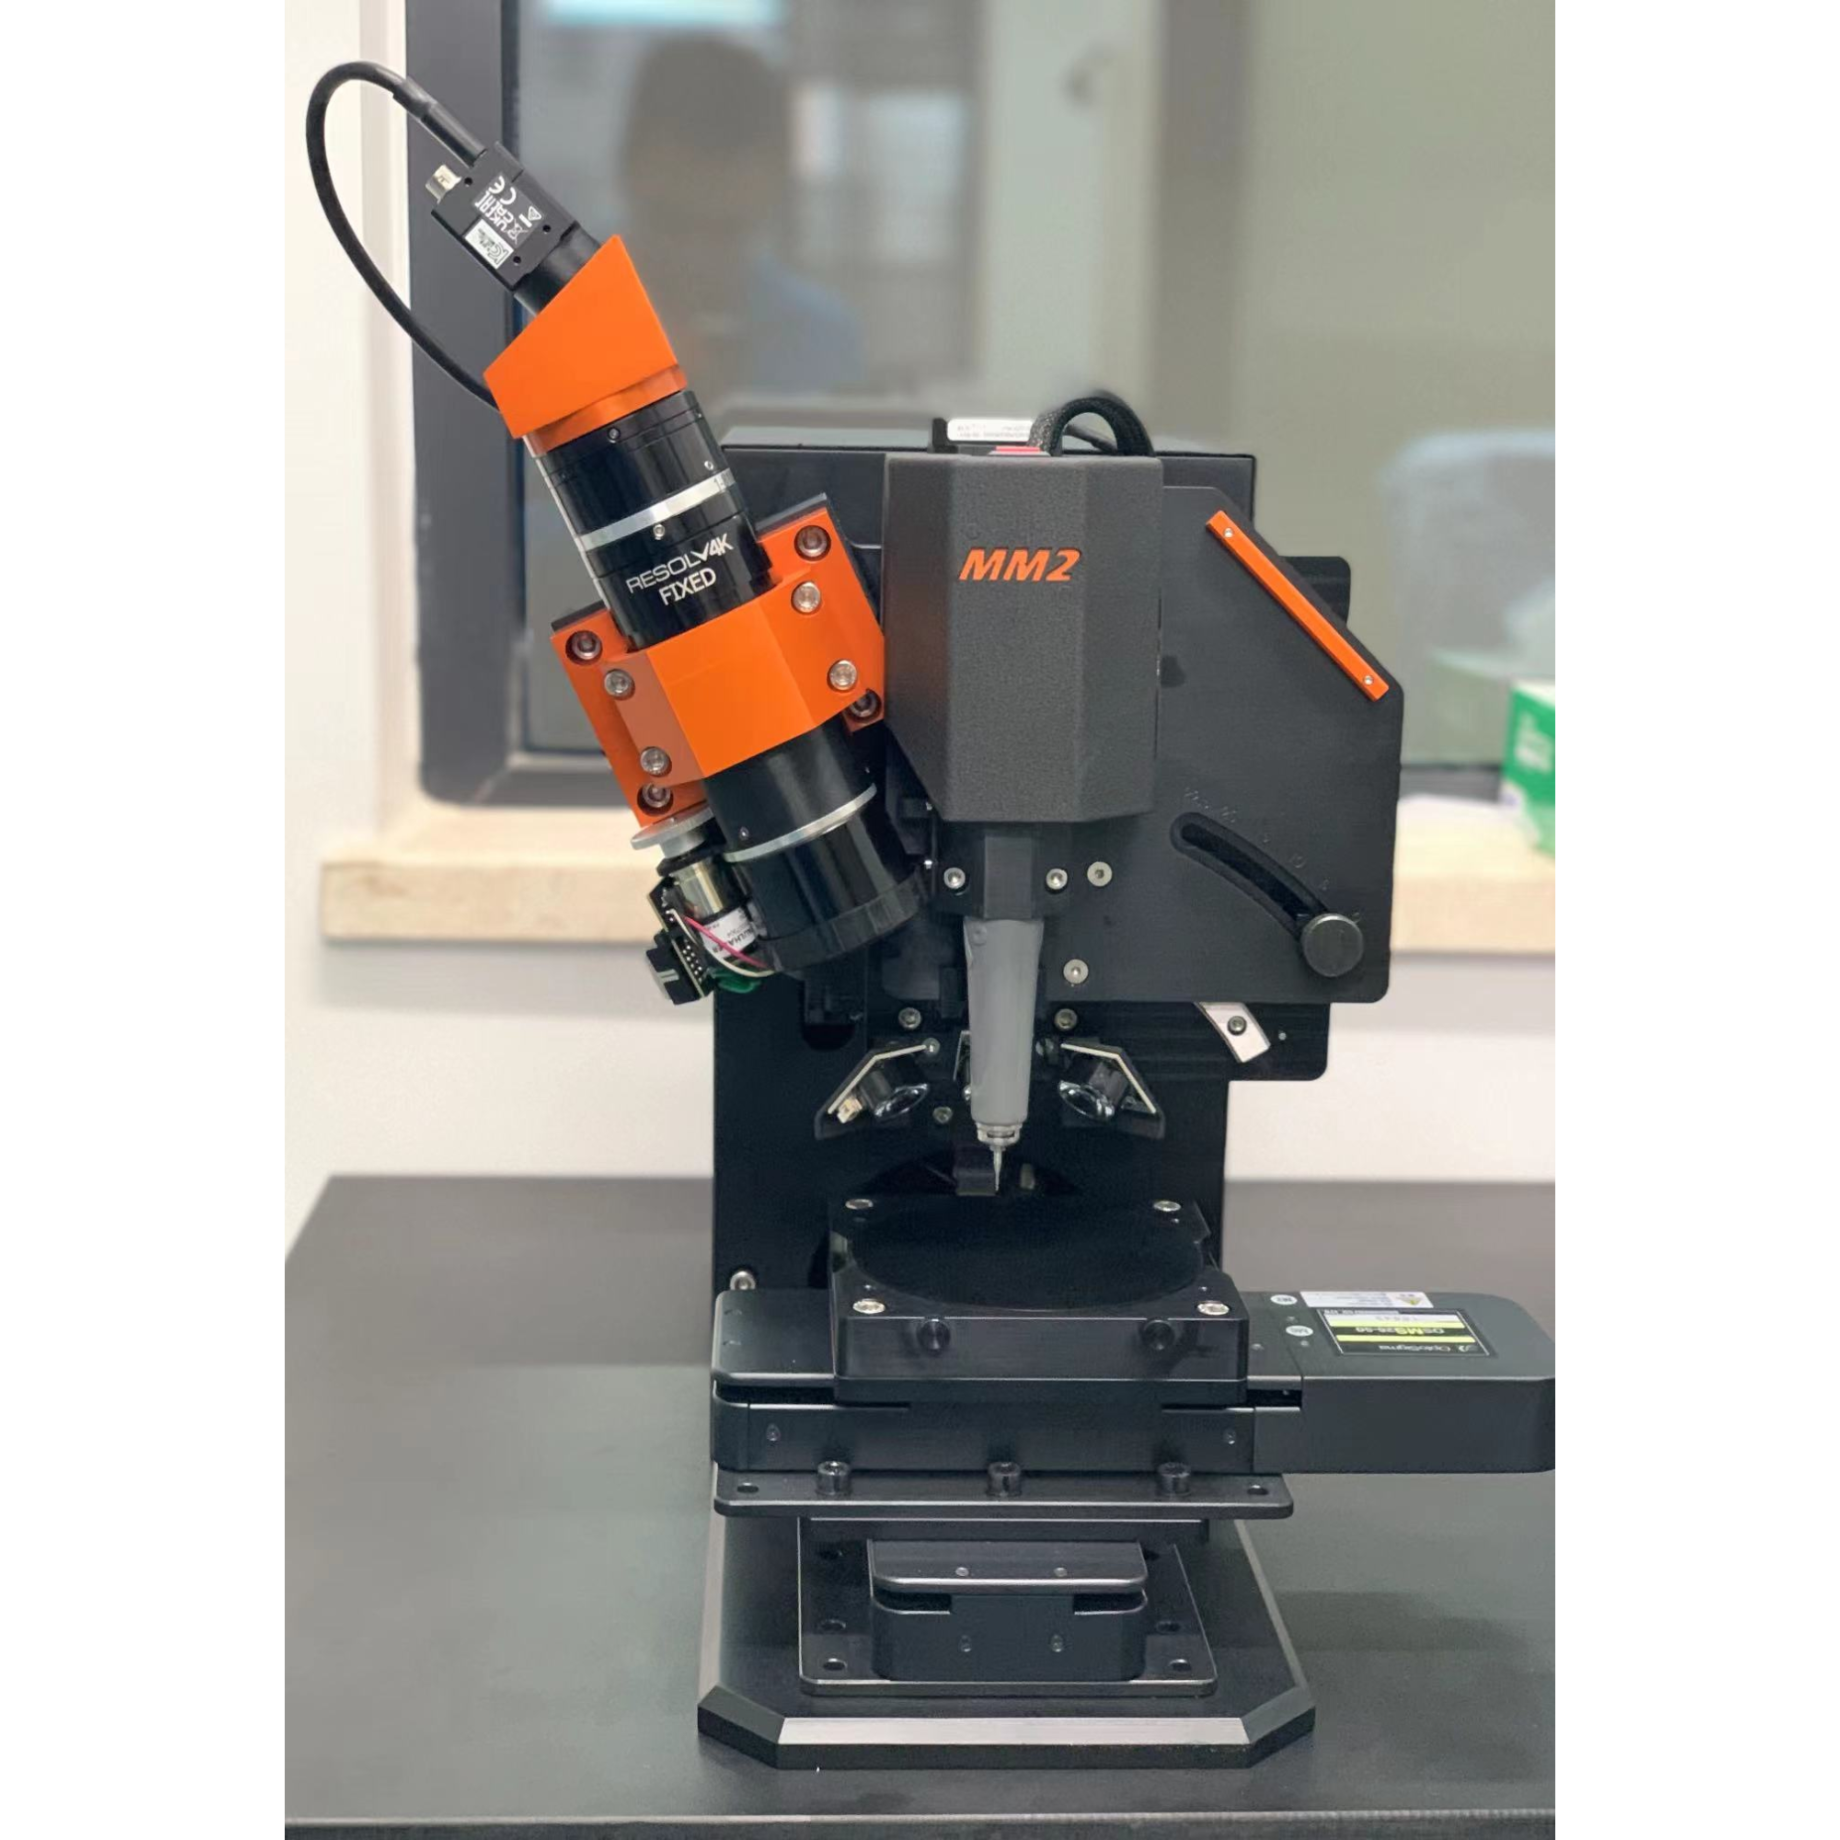
北京富尔邦科技发展有限责任公司为您提供《Cu(In,Ga)Se2薄膜太阳能电池中铜、铟、镓、硒检测方案(激光剥蚀进样)》,该方案主要用于太阳能电池中铜、铟、镓、硒检测,参考标准--,《Cu(In,Ga)Se2薄膜太阳能电池中铜、铟、镓、硒检测方案(激光剥蚀进样)》用到的仪器有美国ASI 飞秒激光剥蚀进样系统(LA)
推荐专场
相关方案
更多
该厂商其他方案
更多