


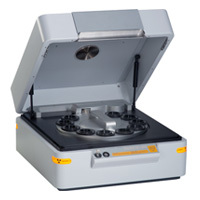
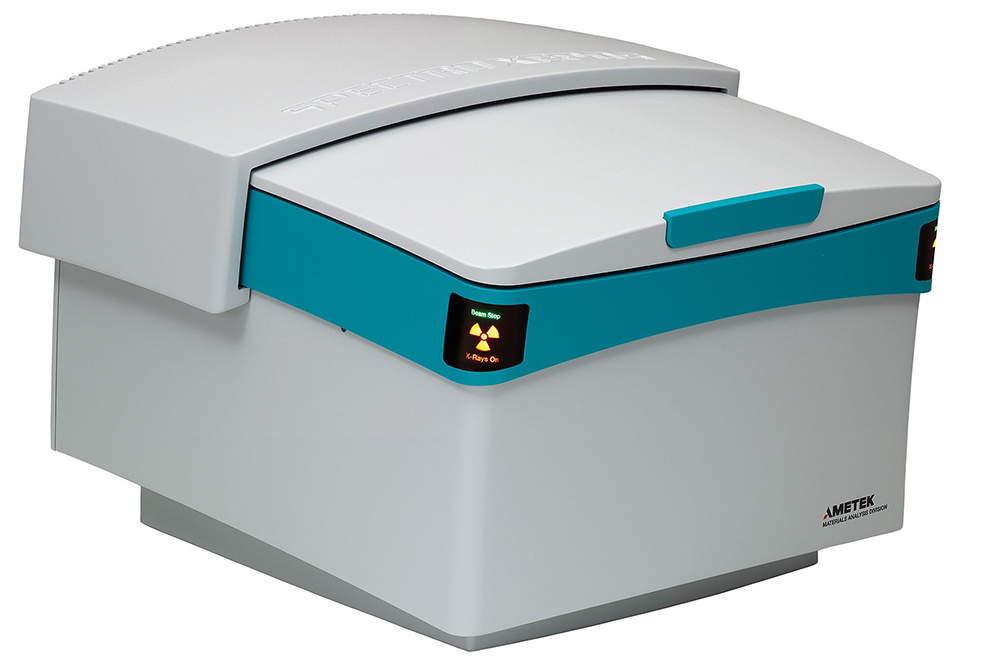
使用Xenemetrix公司Genius IF能量色散X射线荧光光谱仪对织物中的元素进行定量分析,以体现荧光光谱仪在织物领域中的应用。
Xenemetrix公司的Genius IF荧光光谱仪被证明可以应用到织物中的元素分析。
方案详情

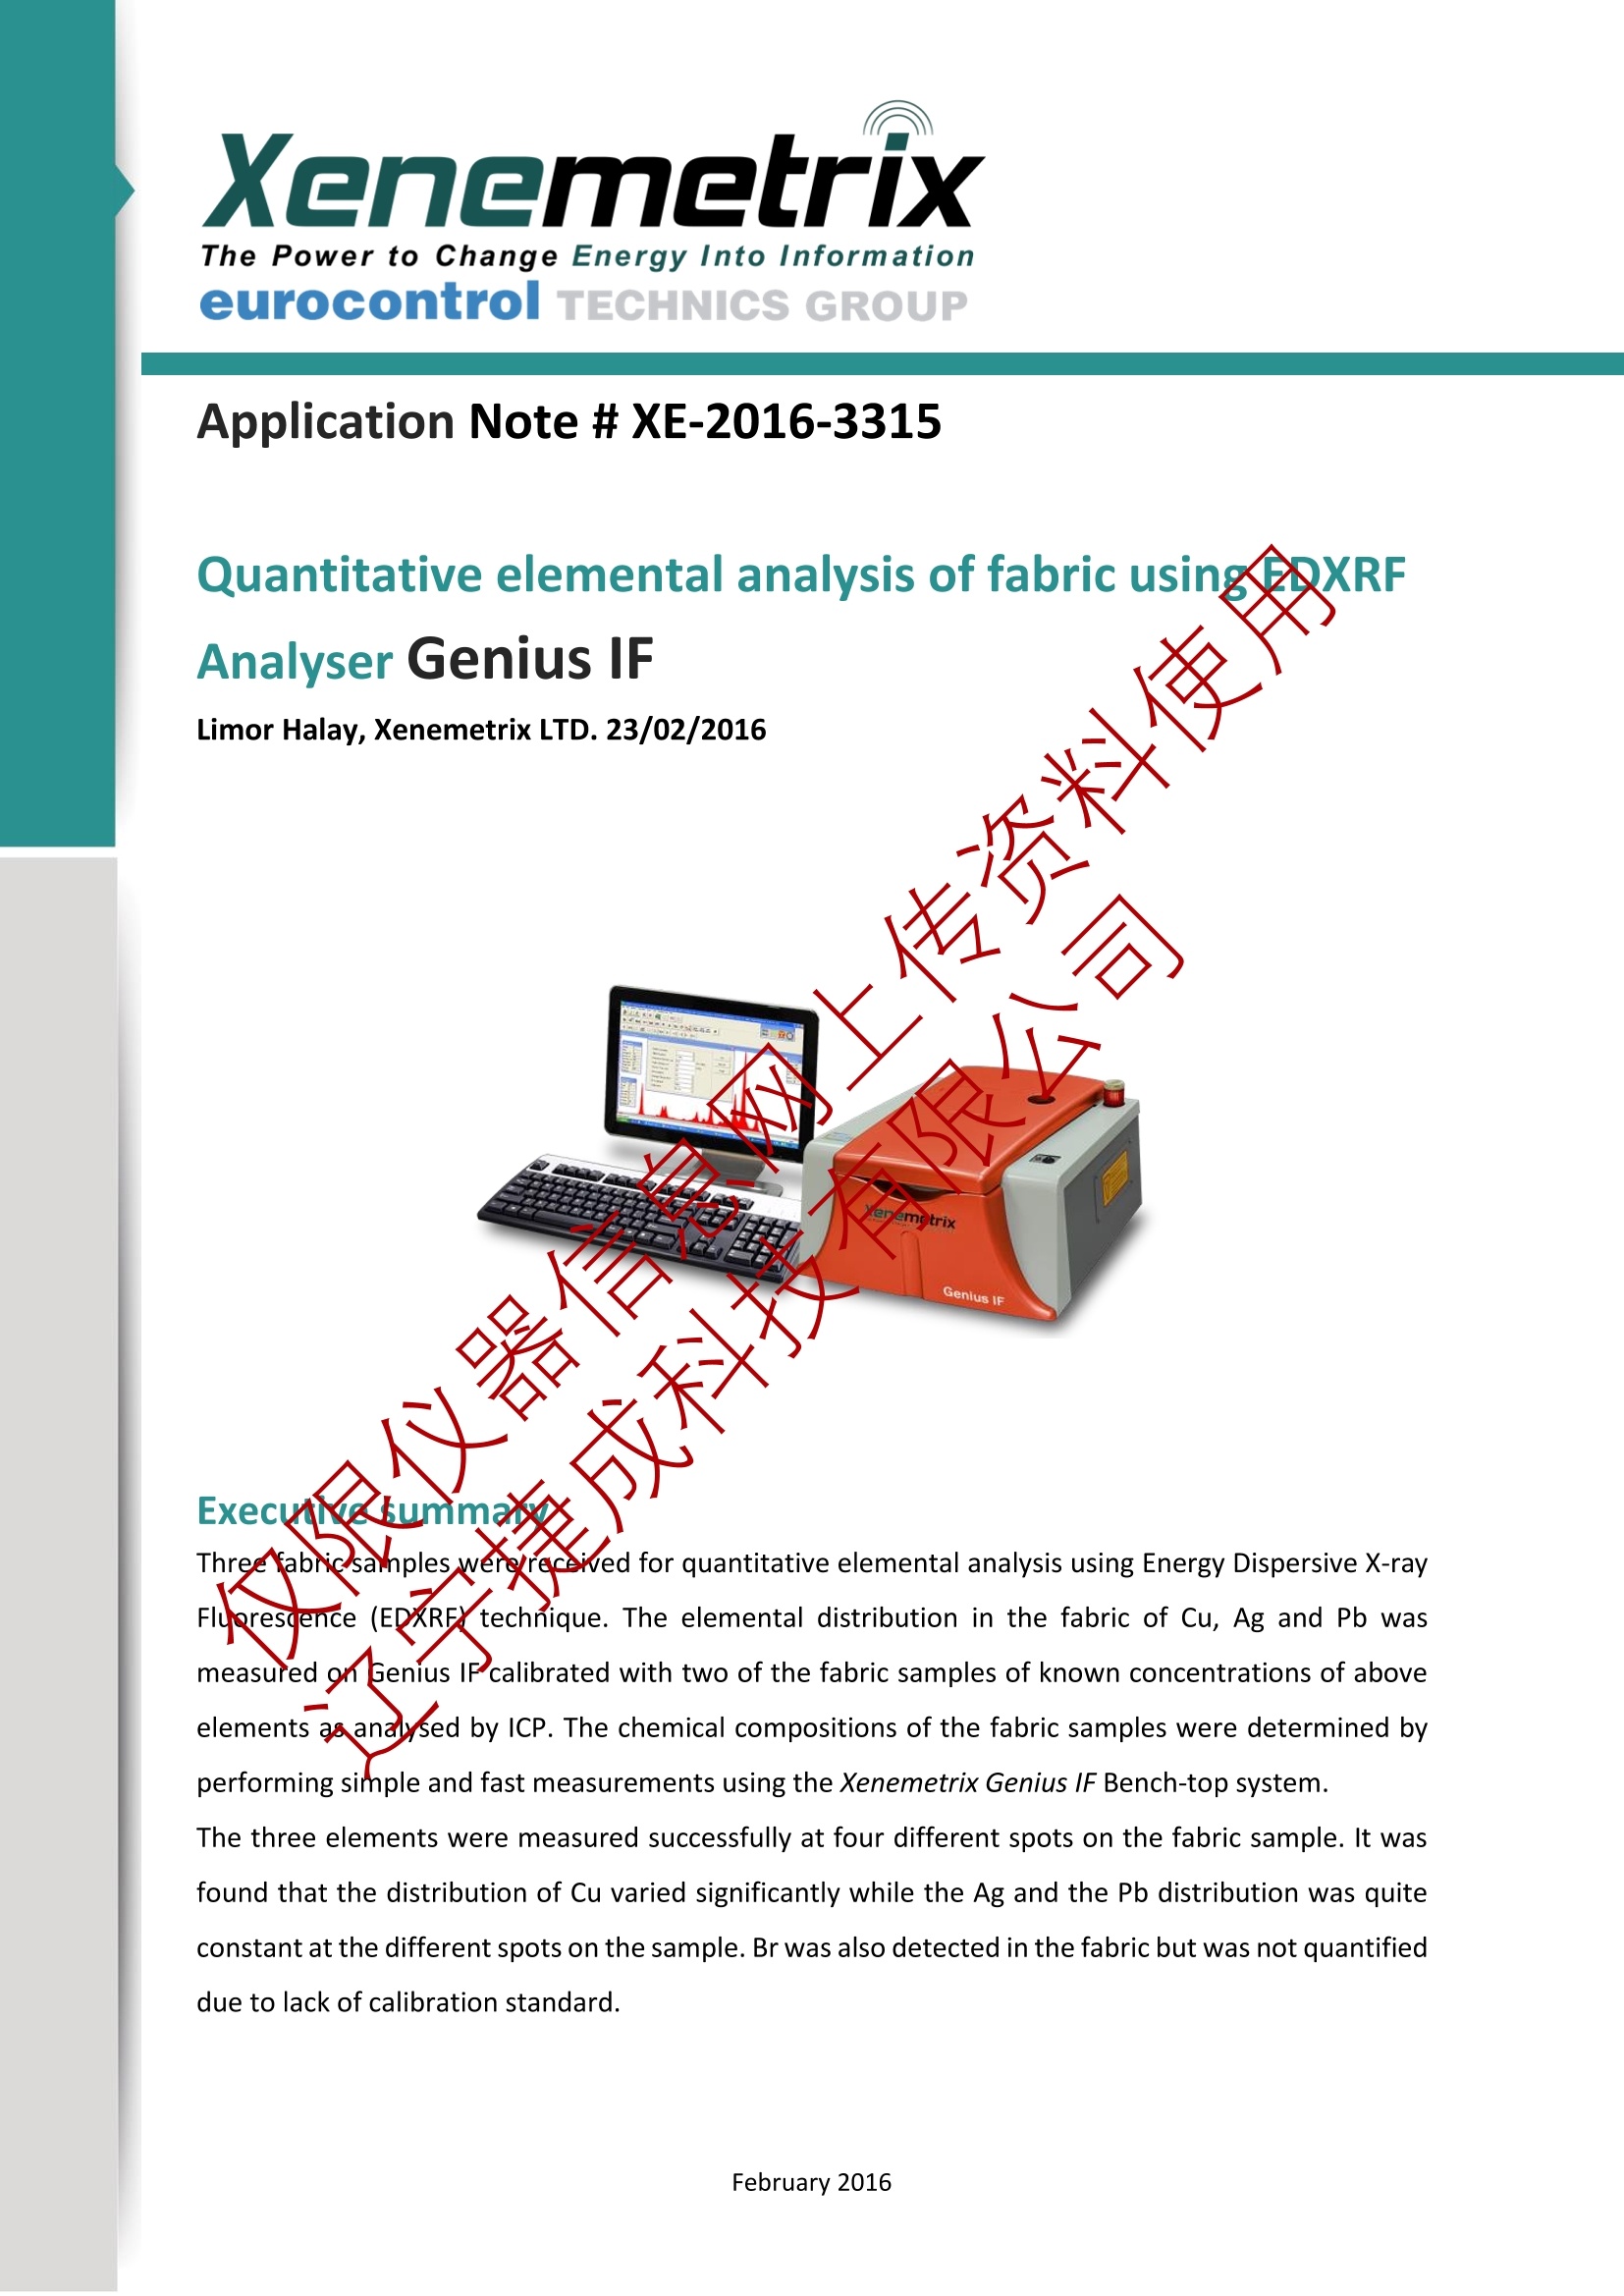
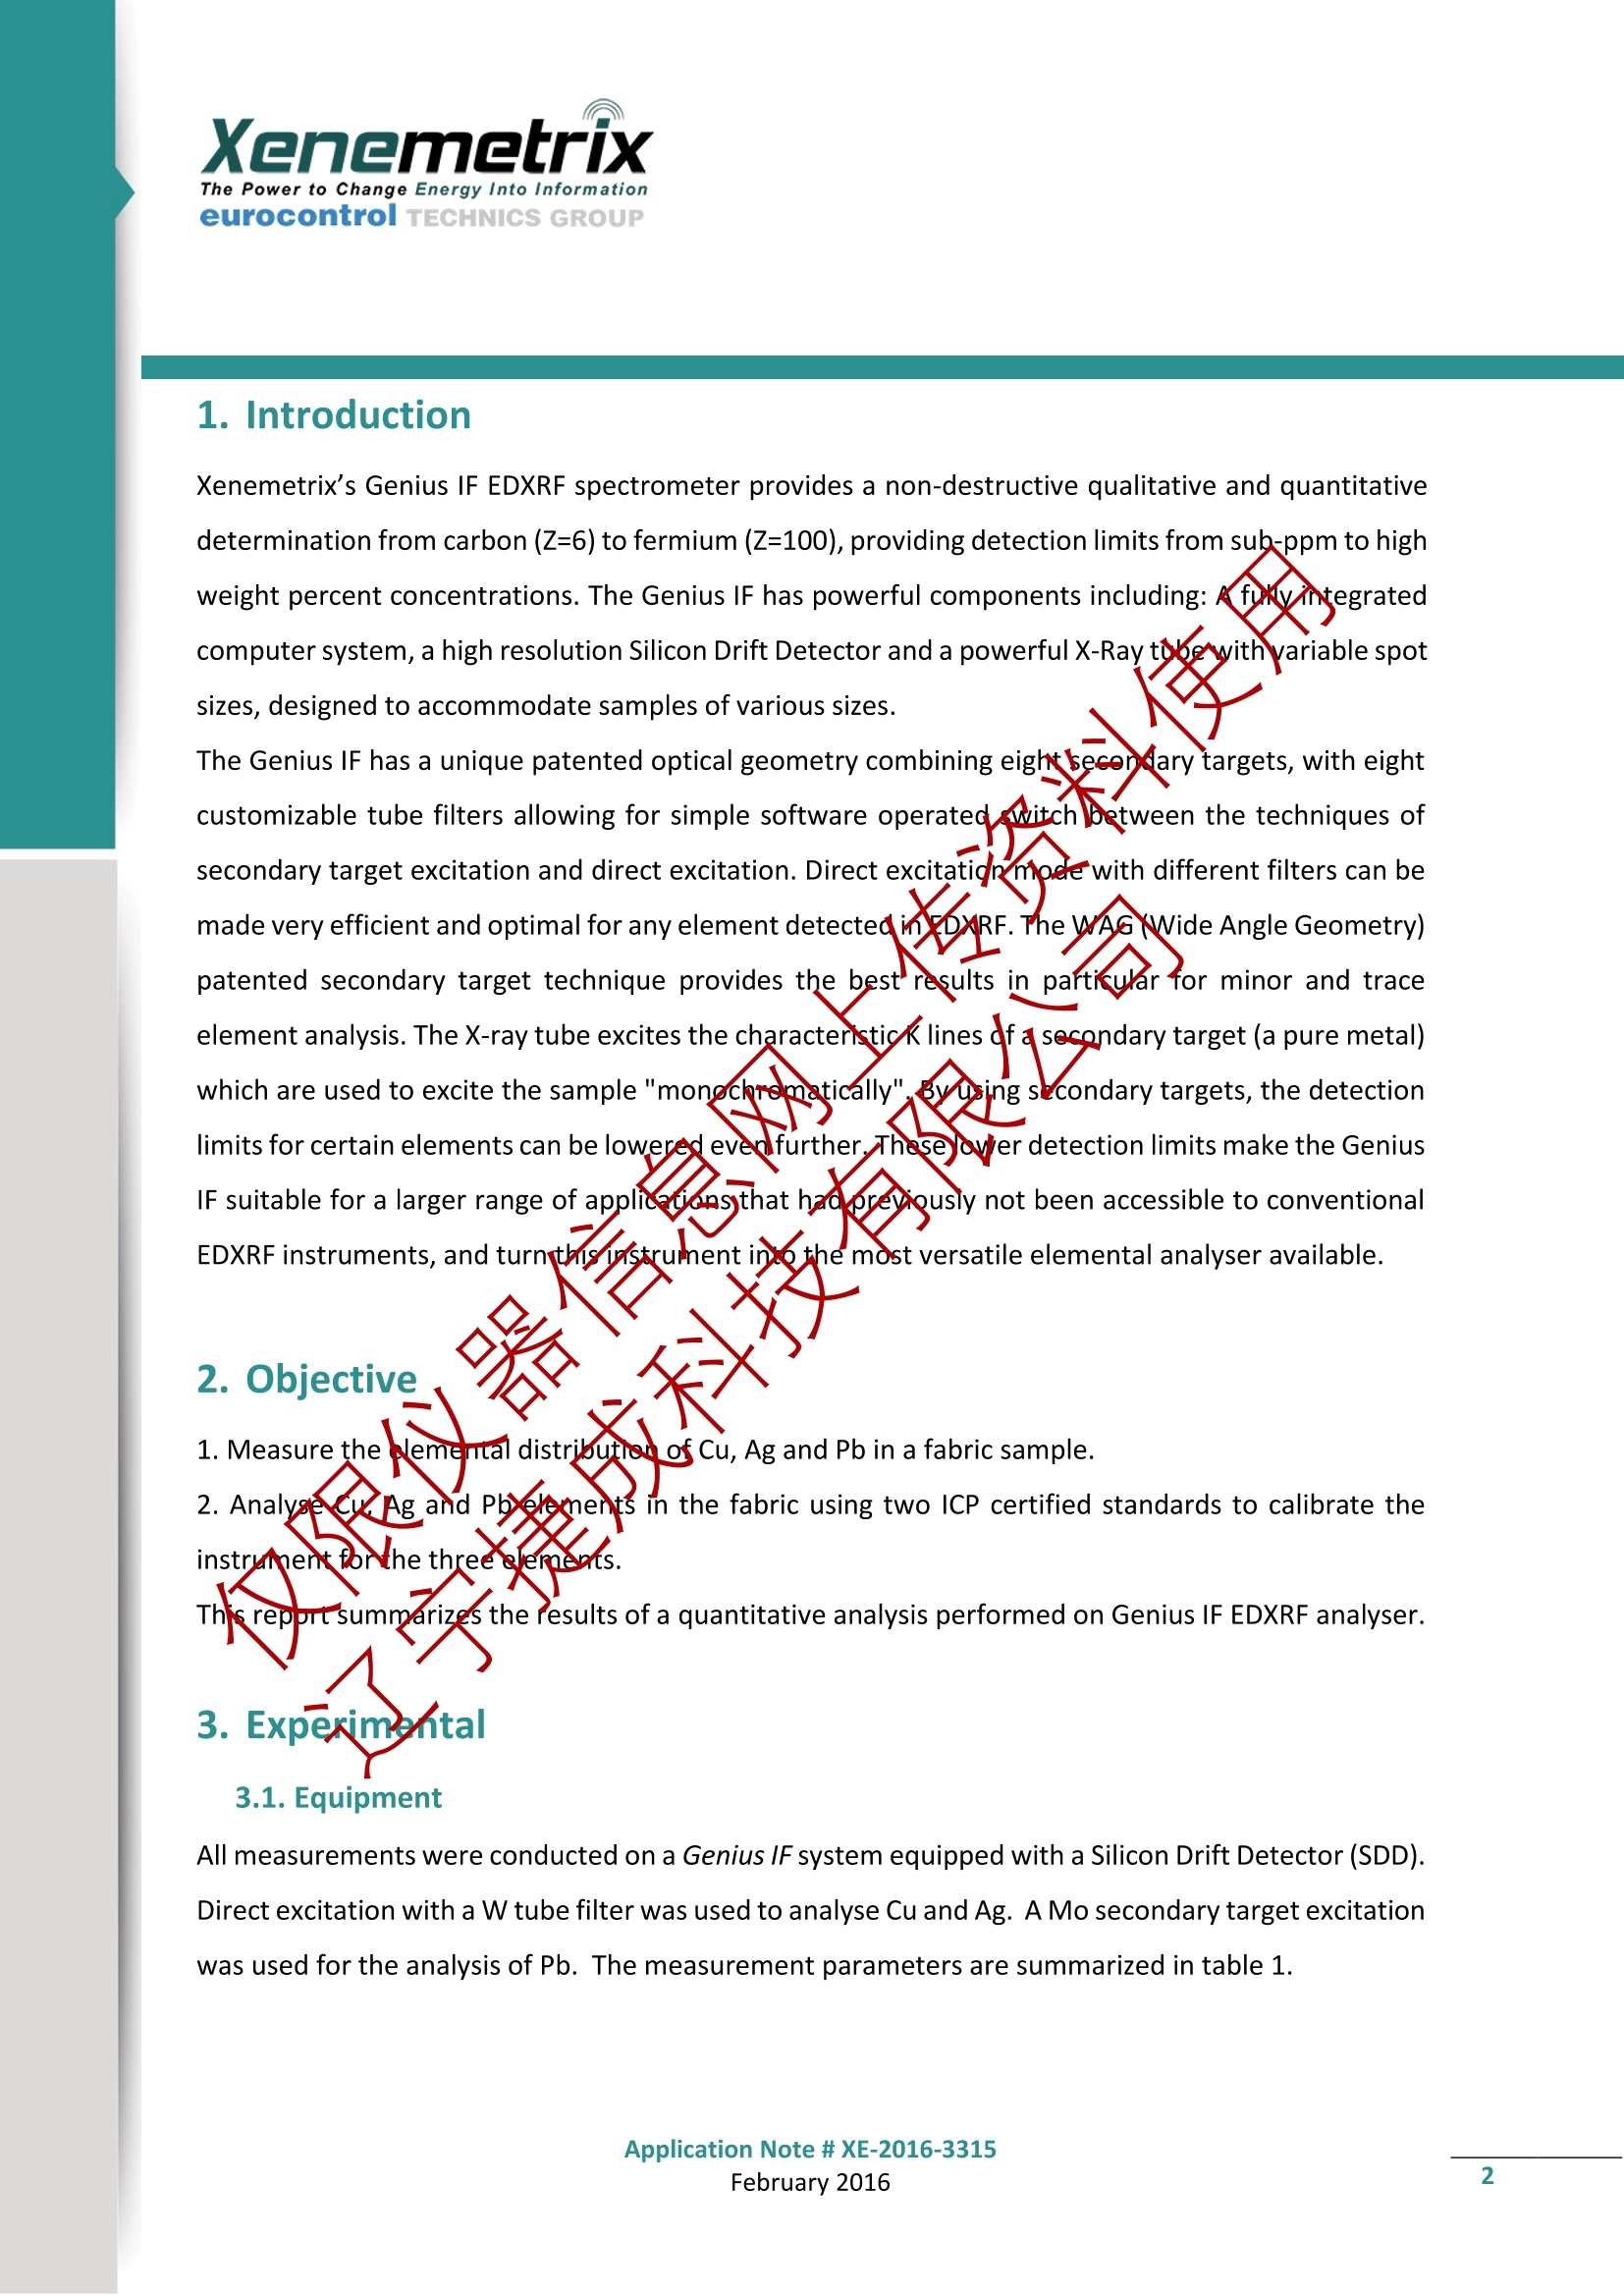
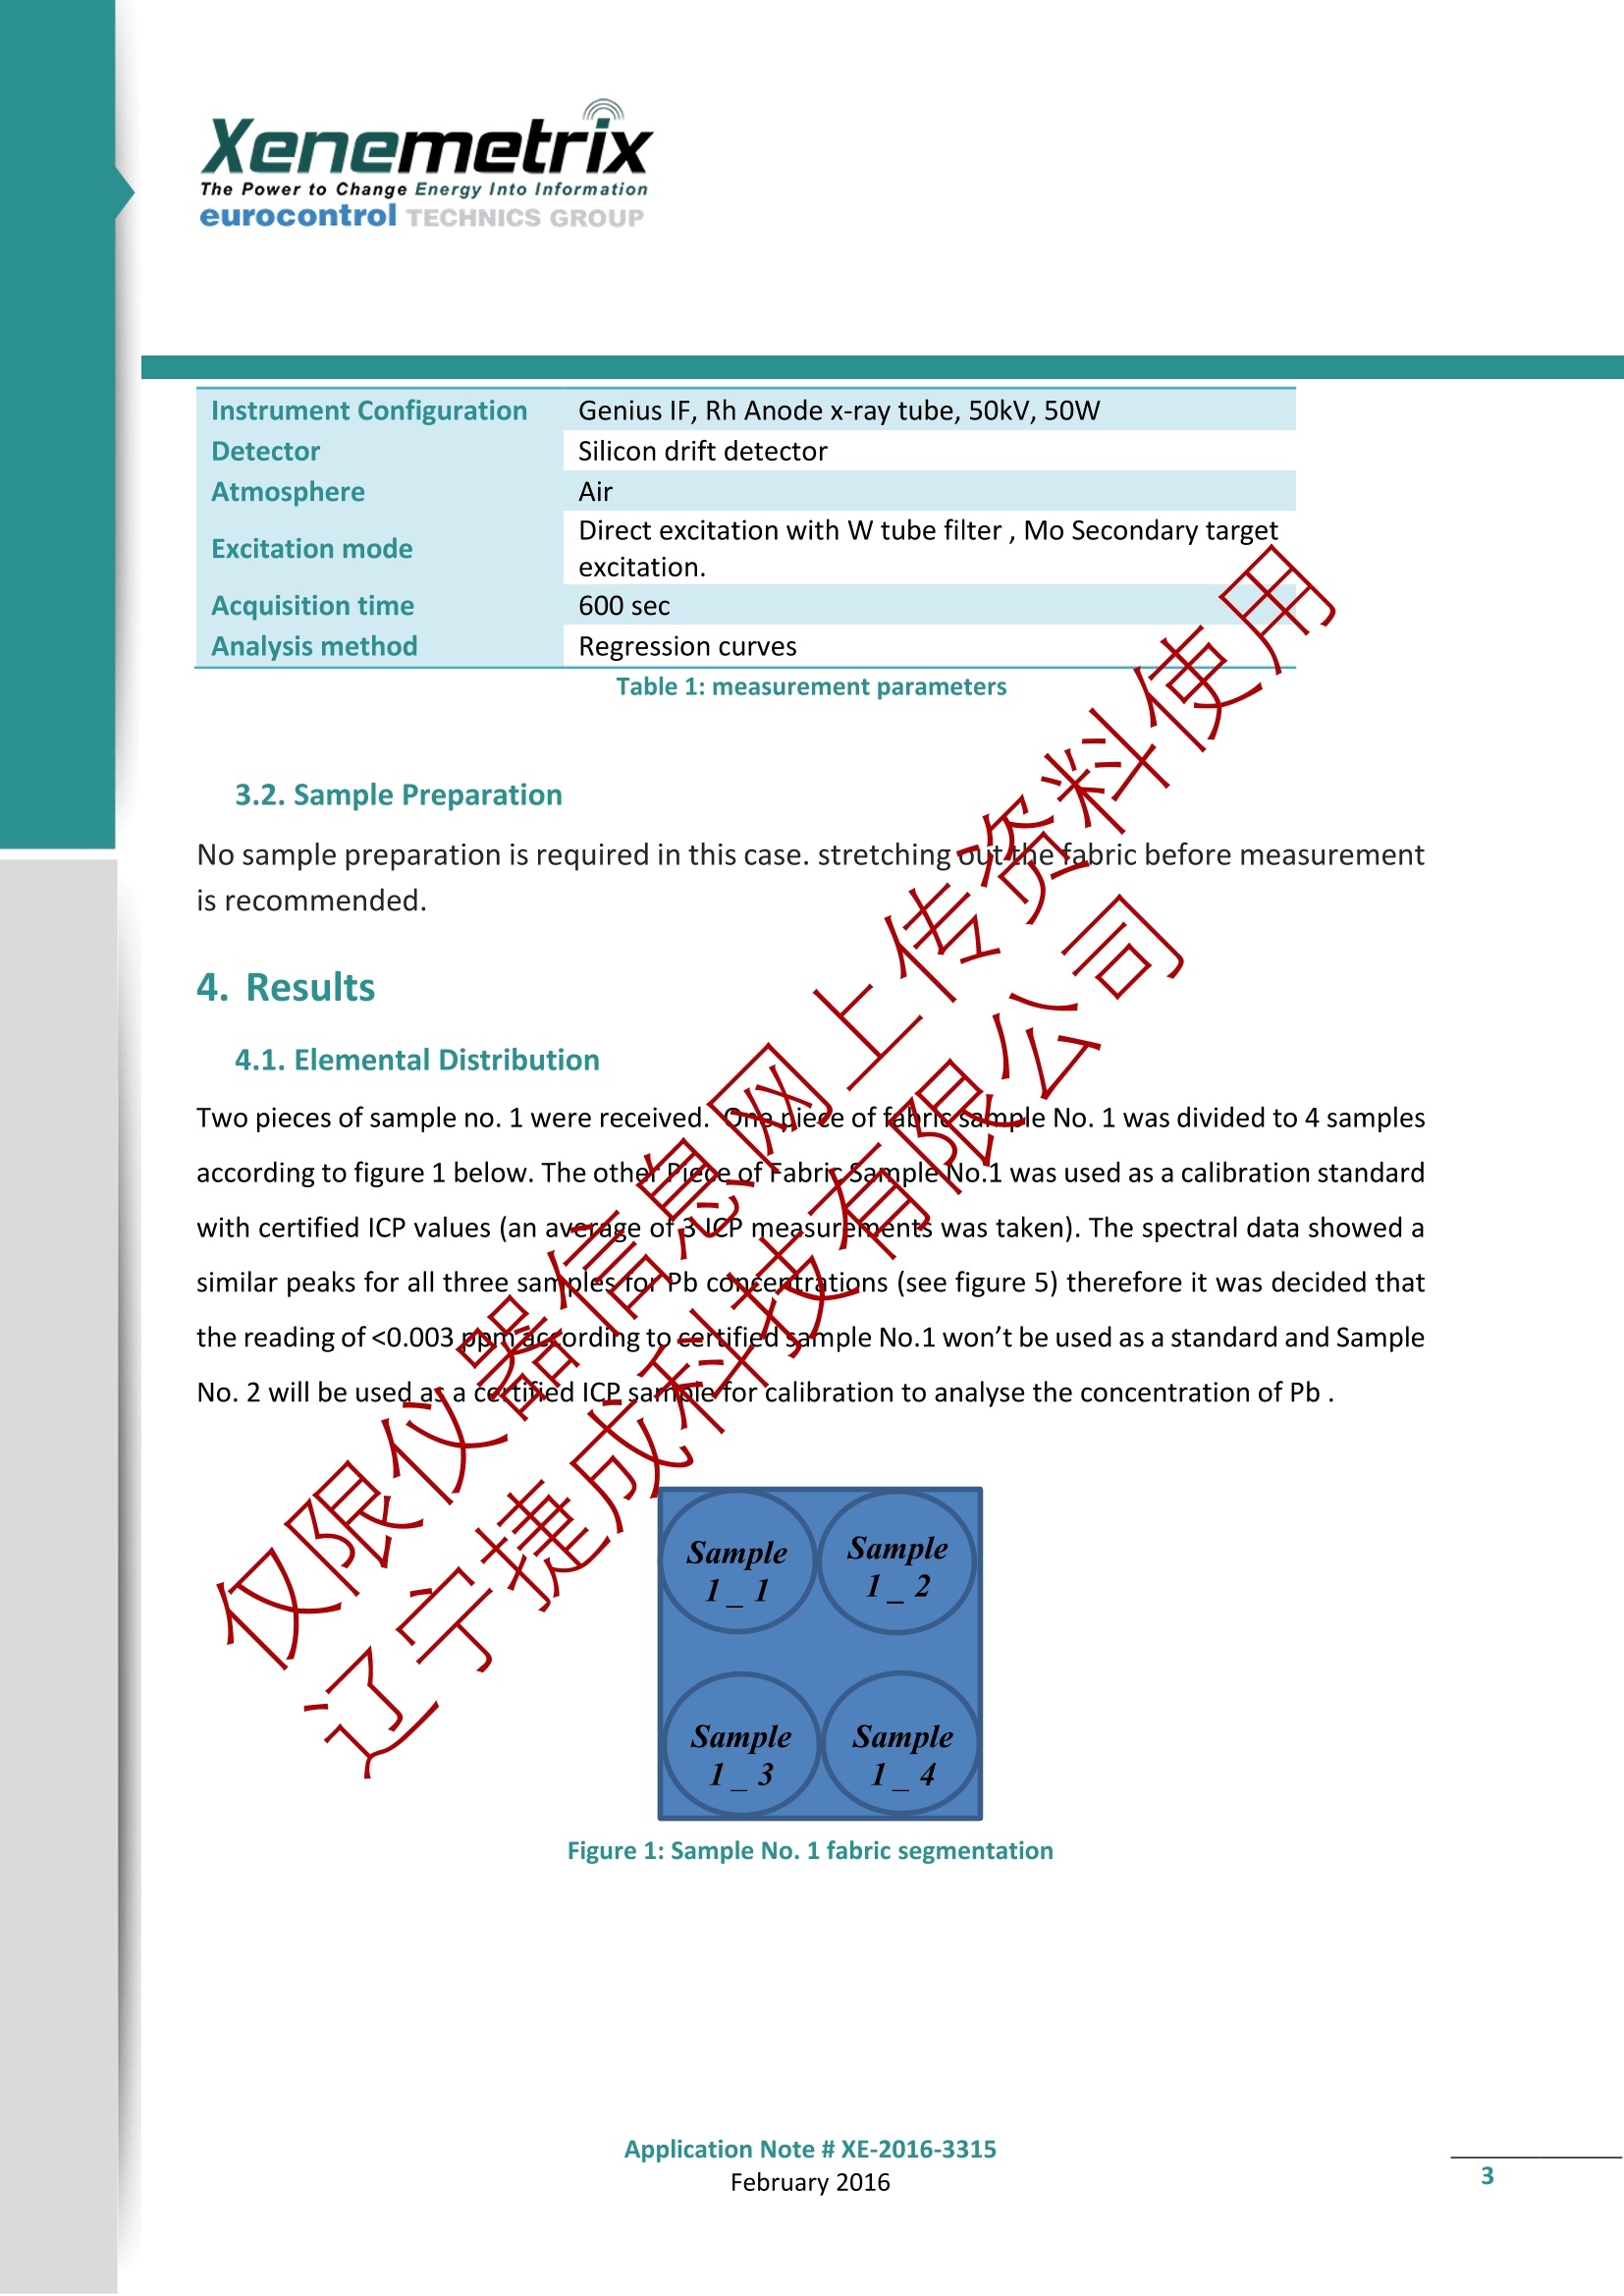
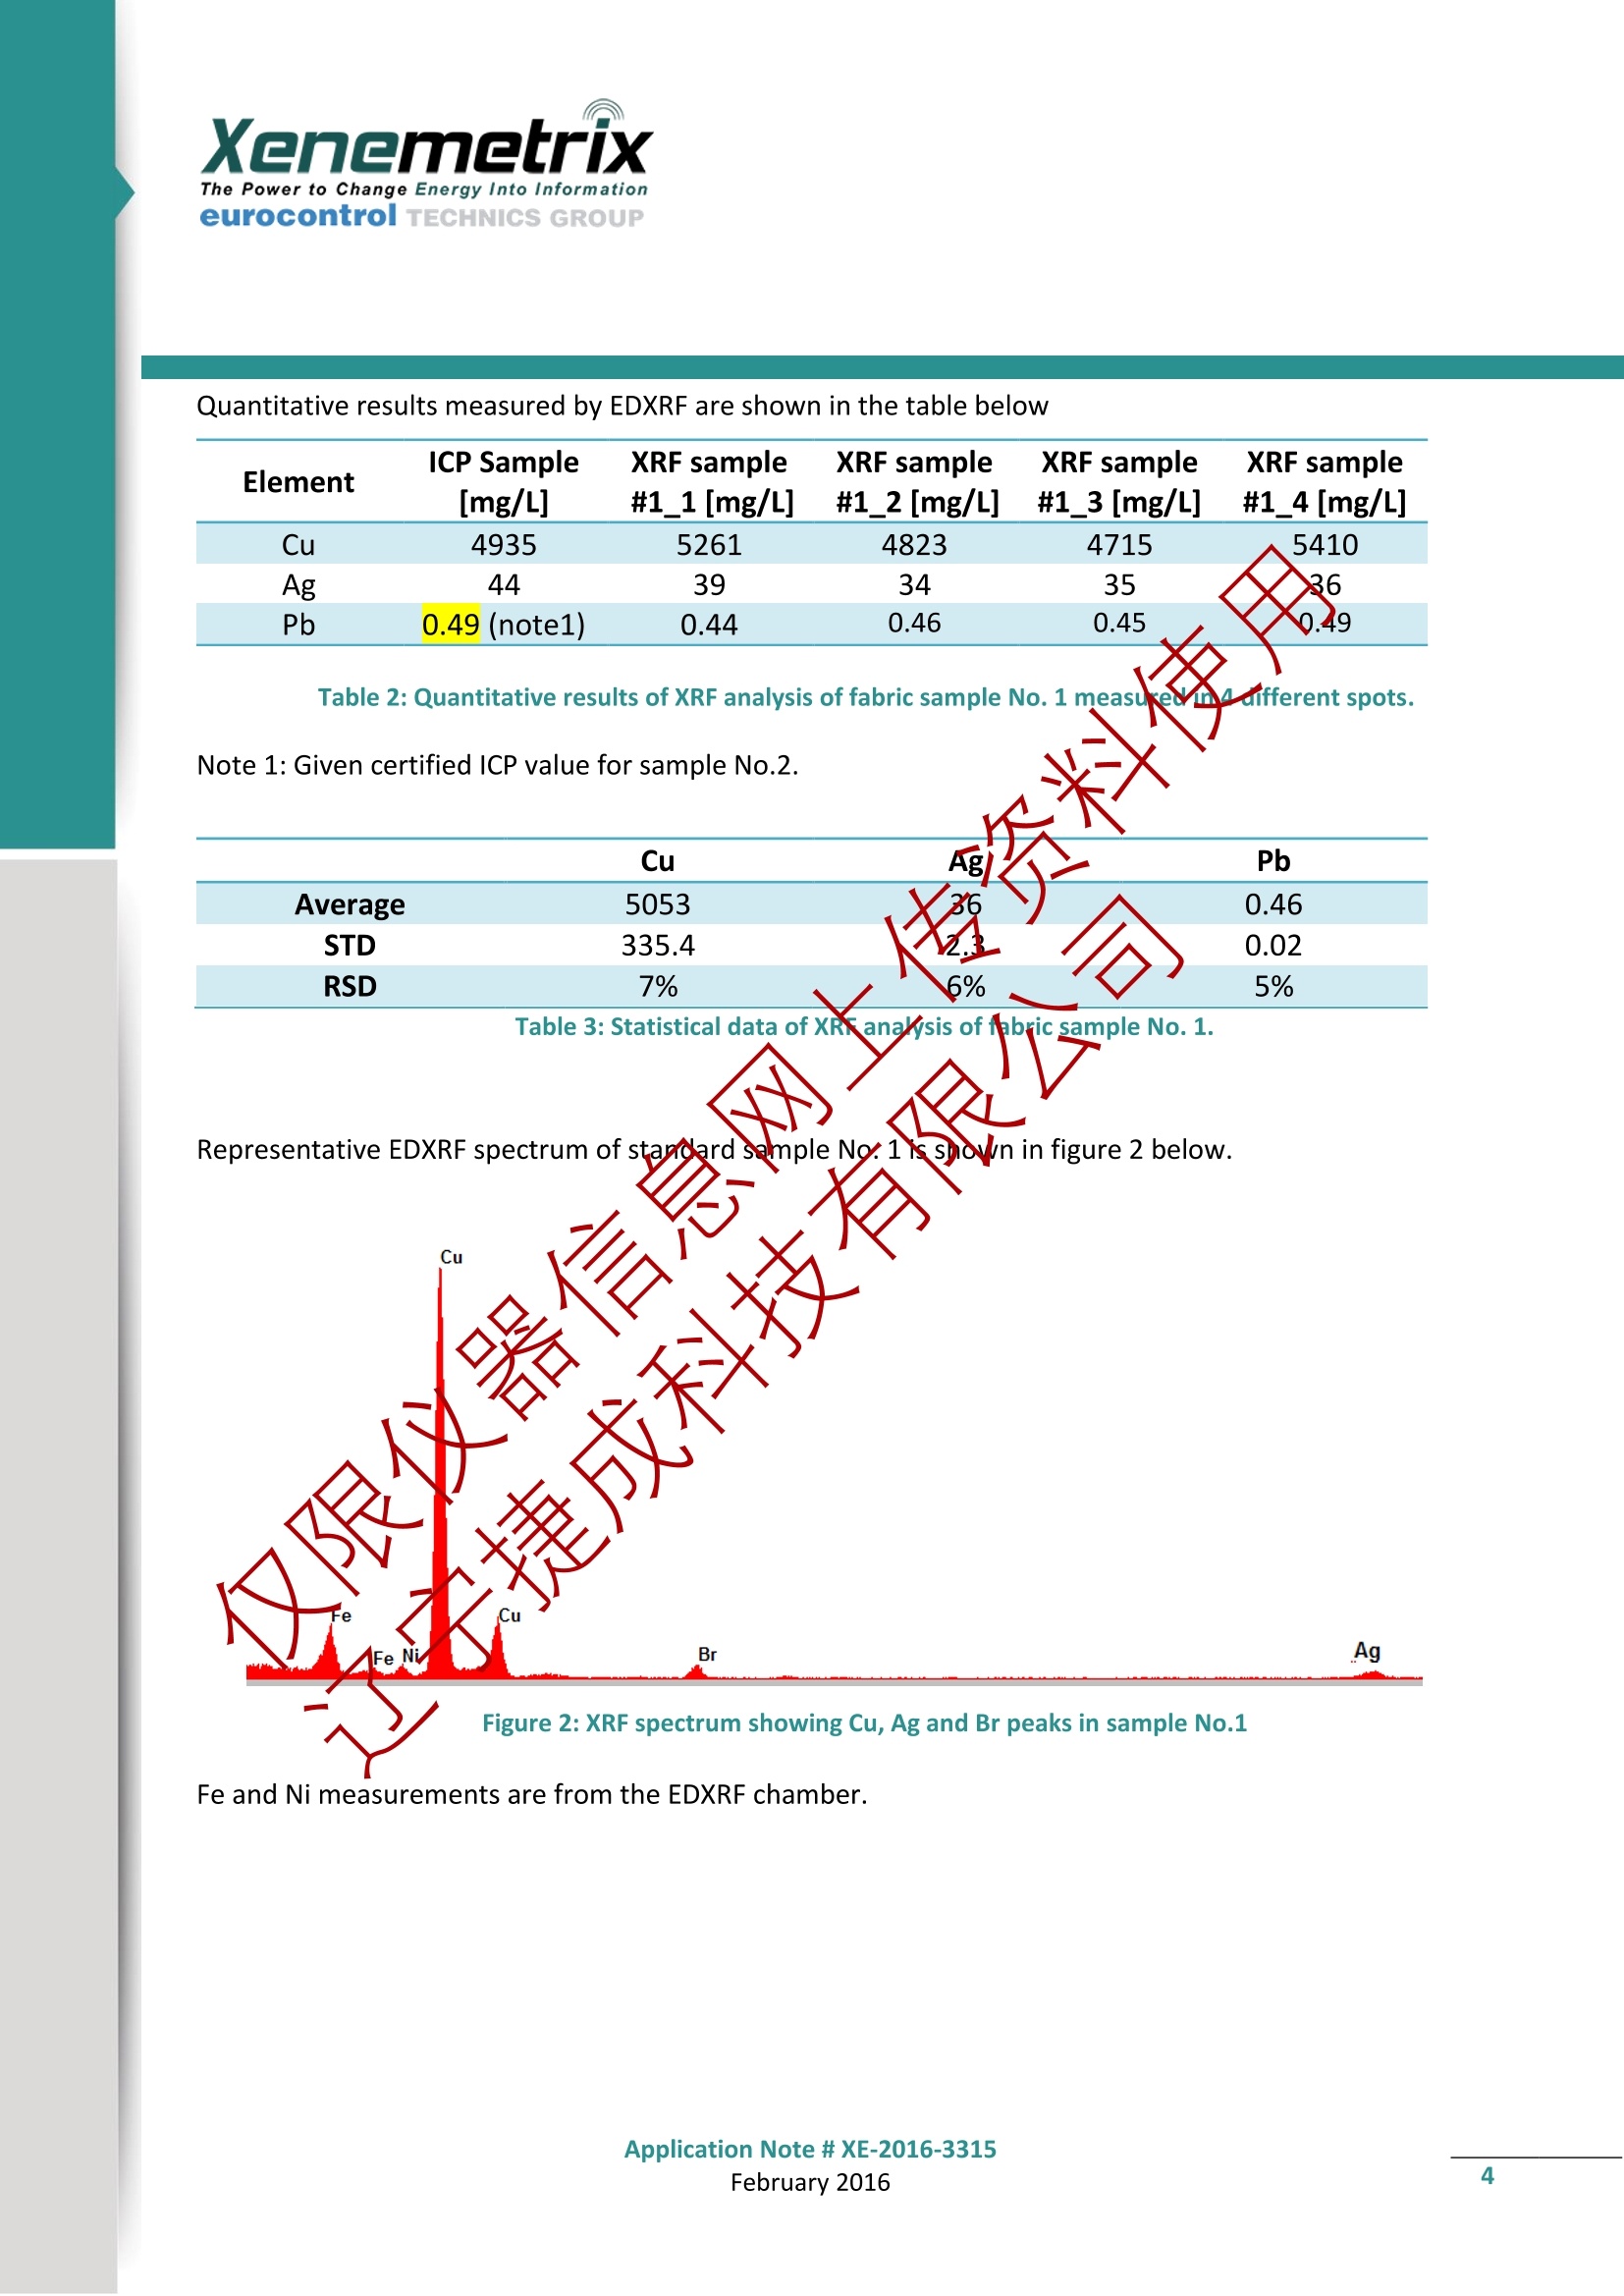
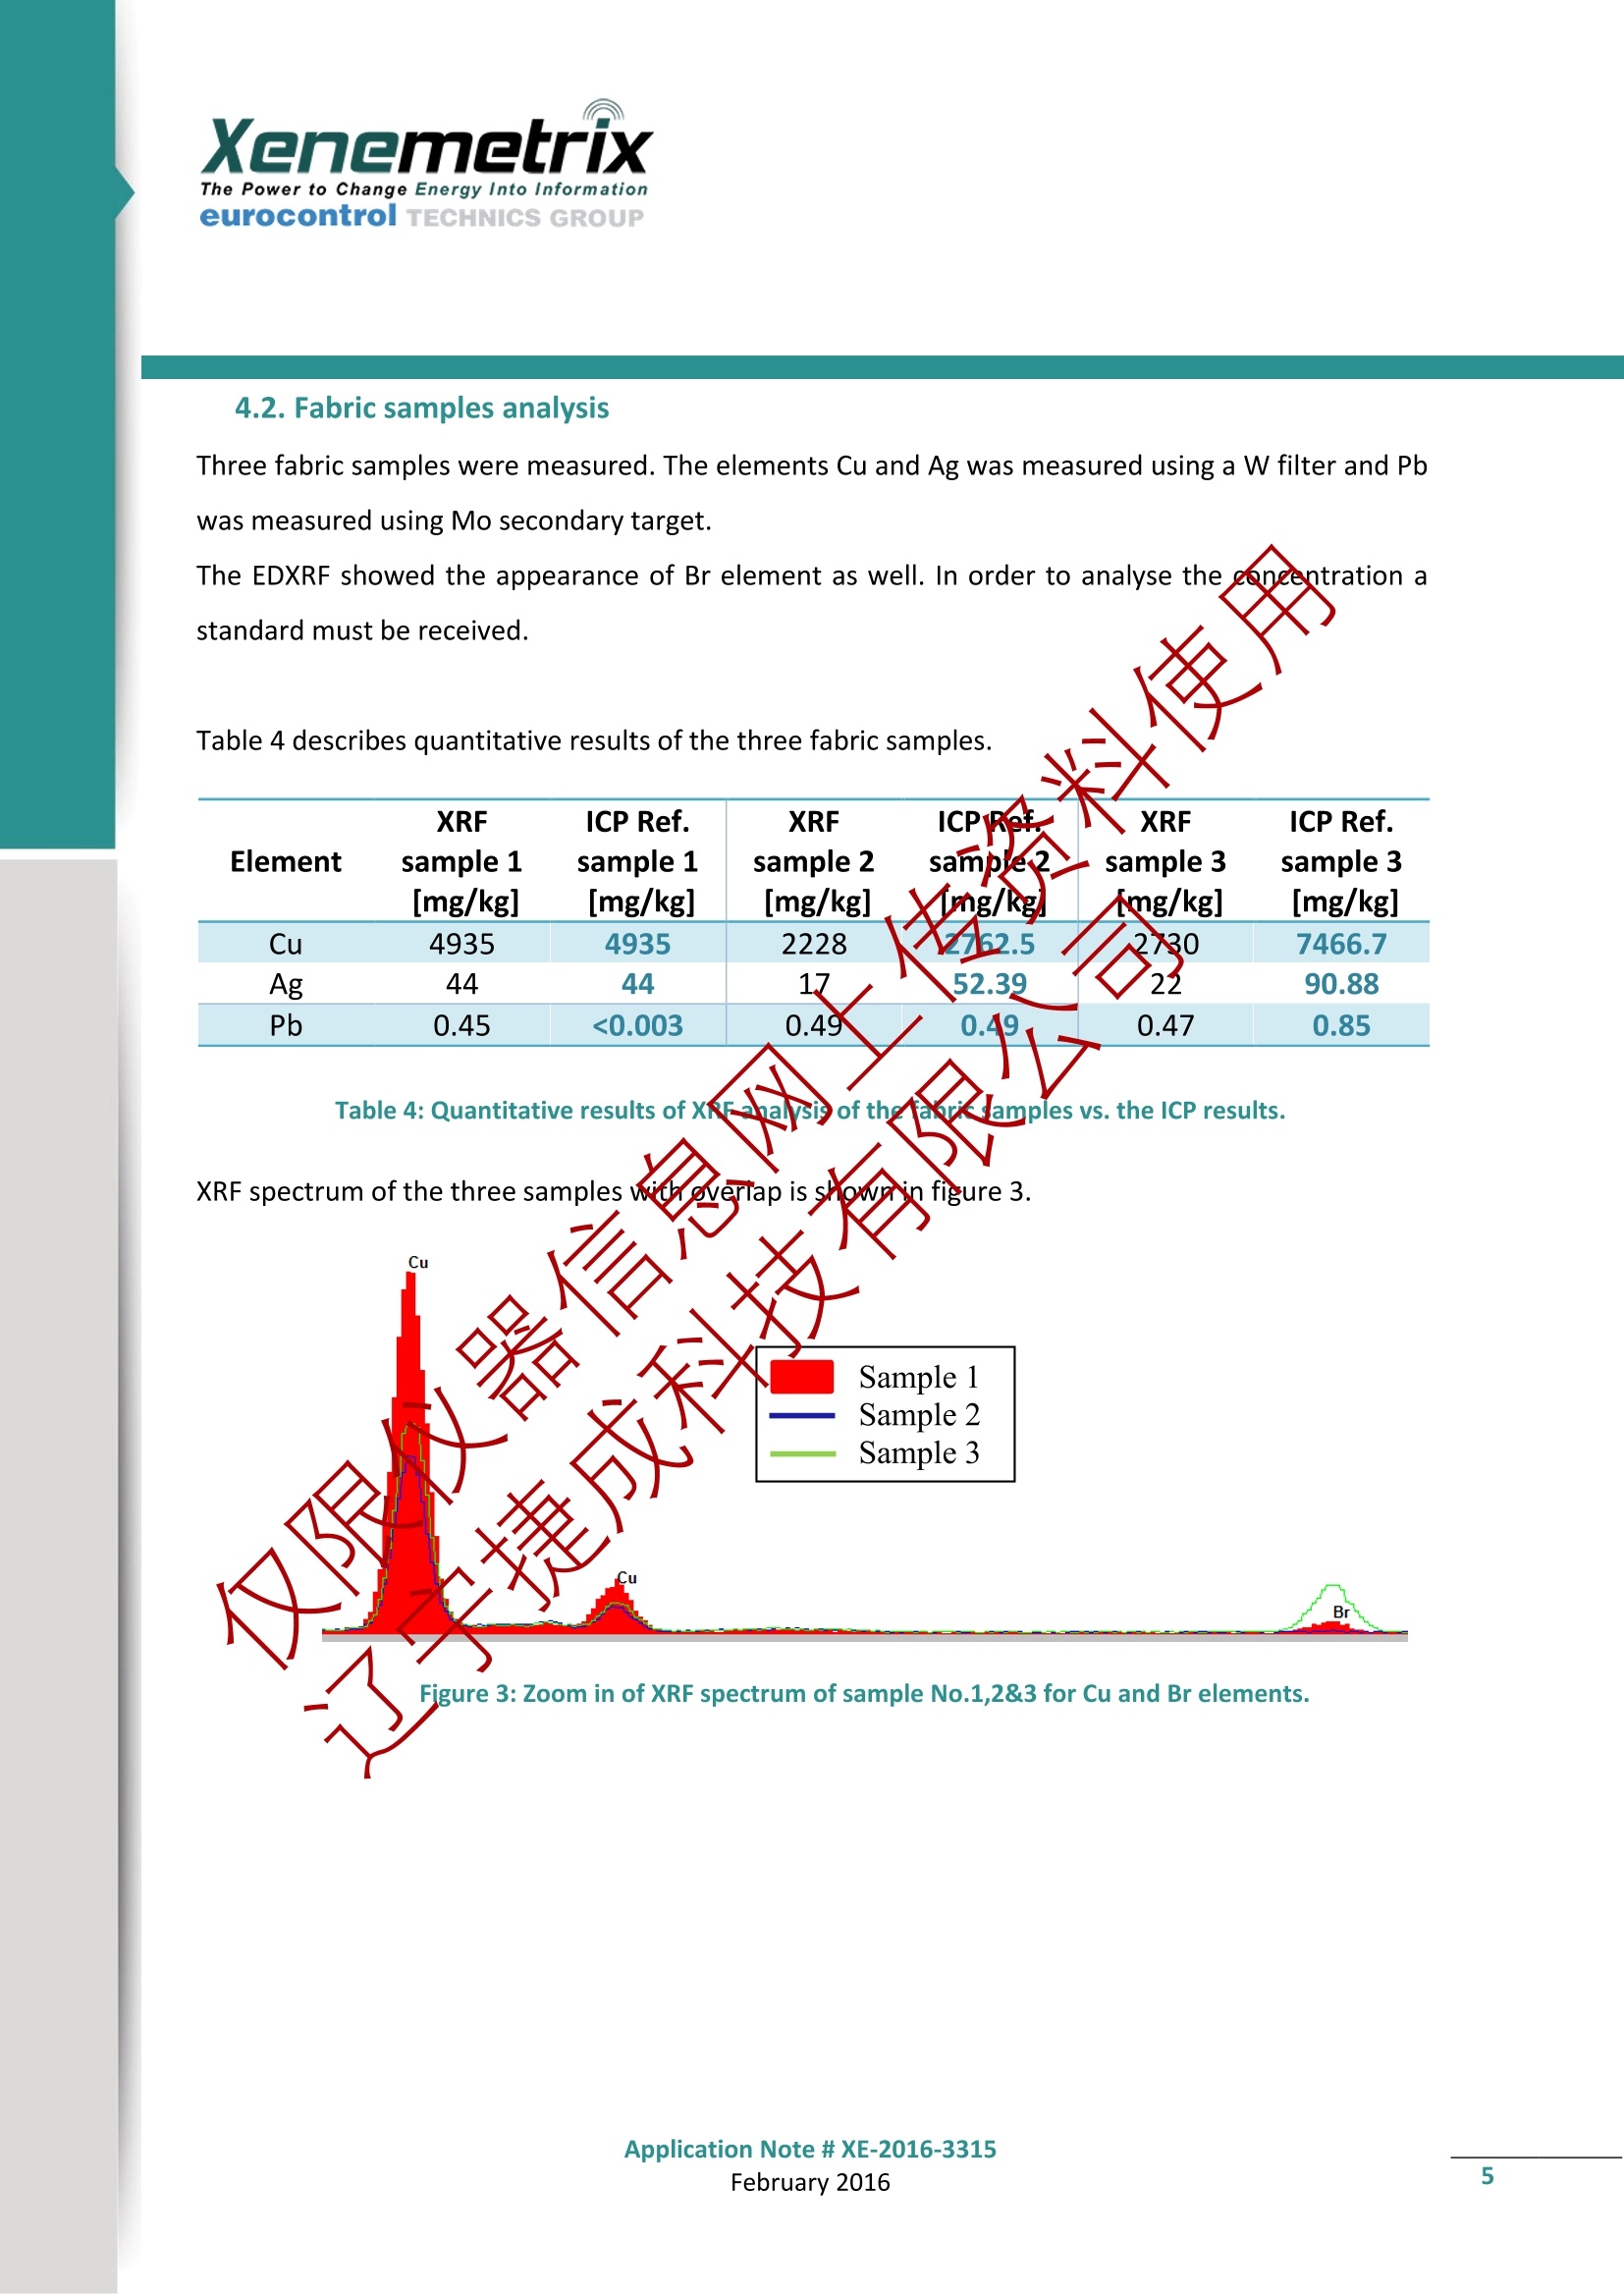
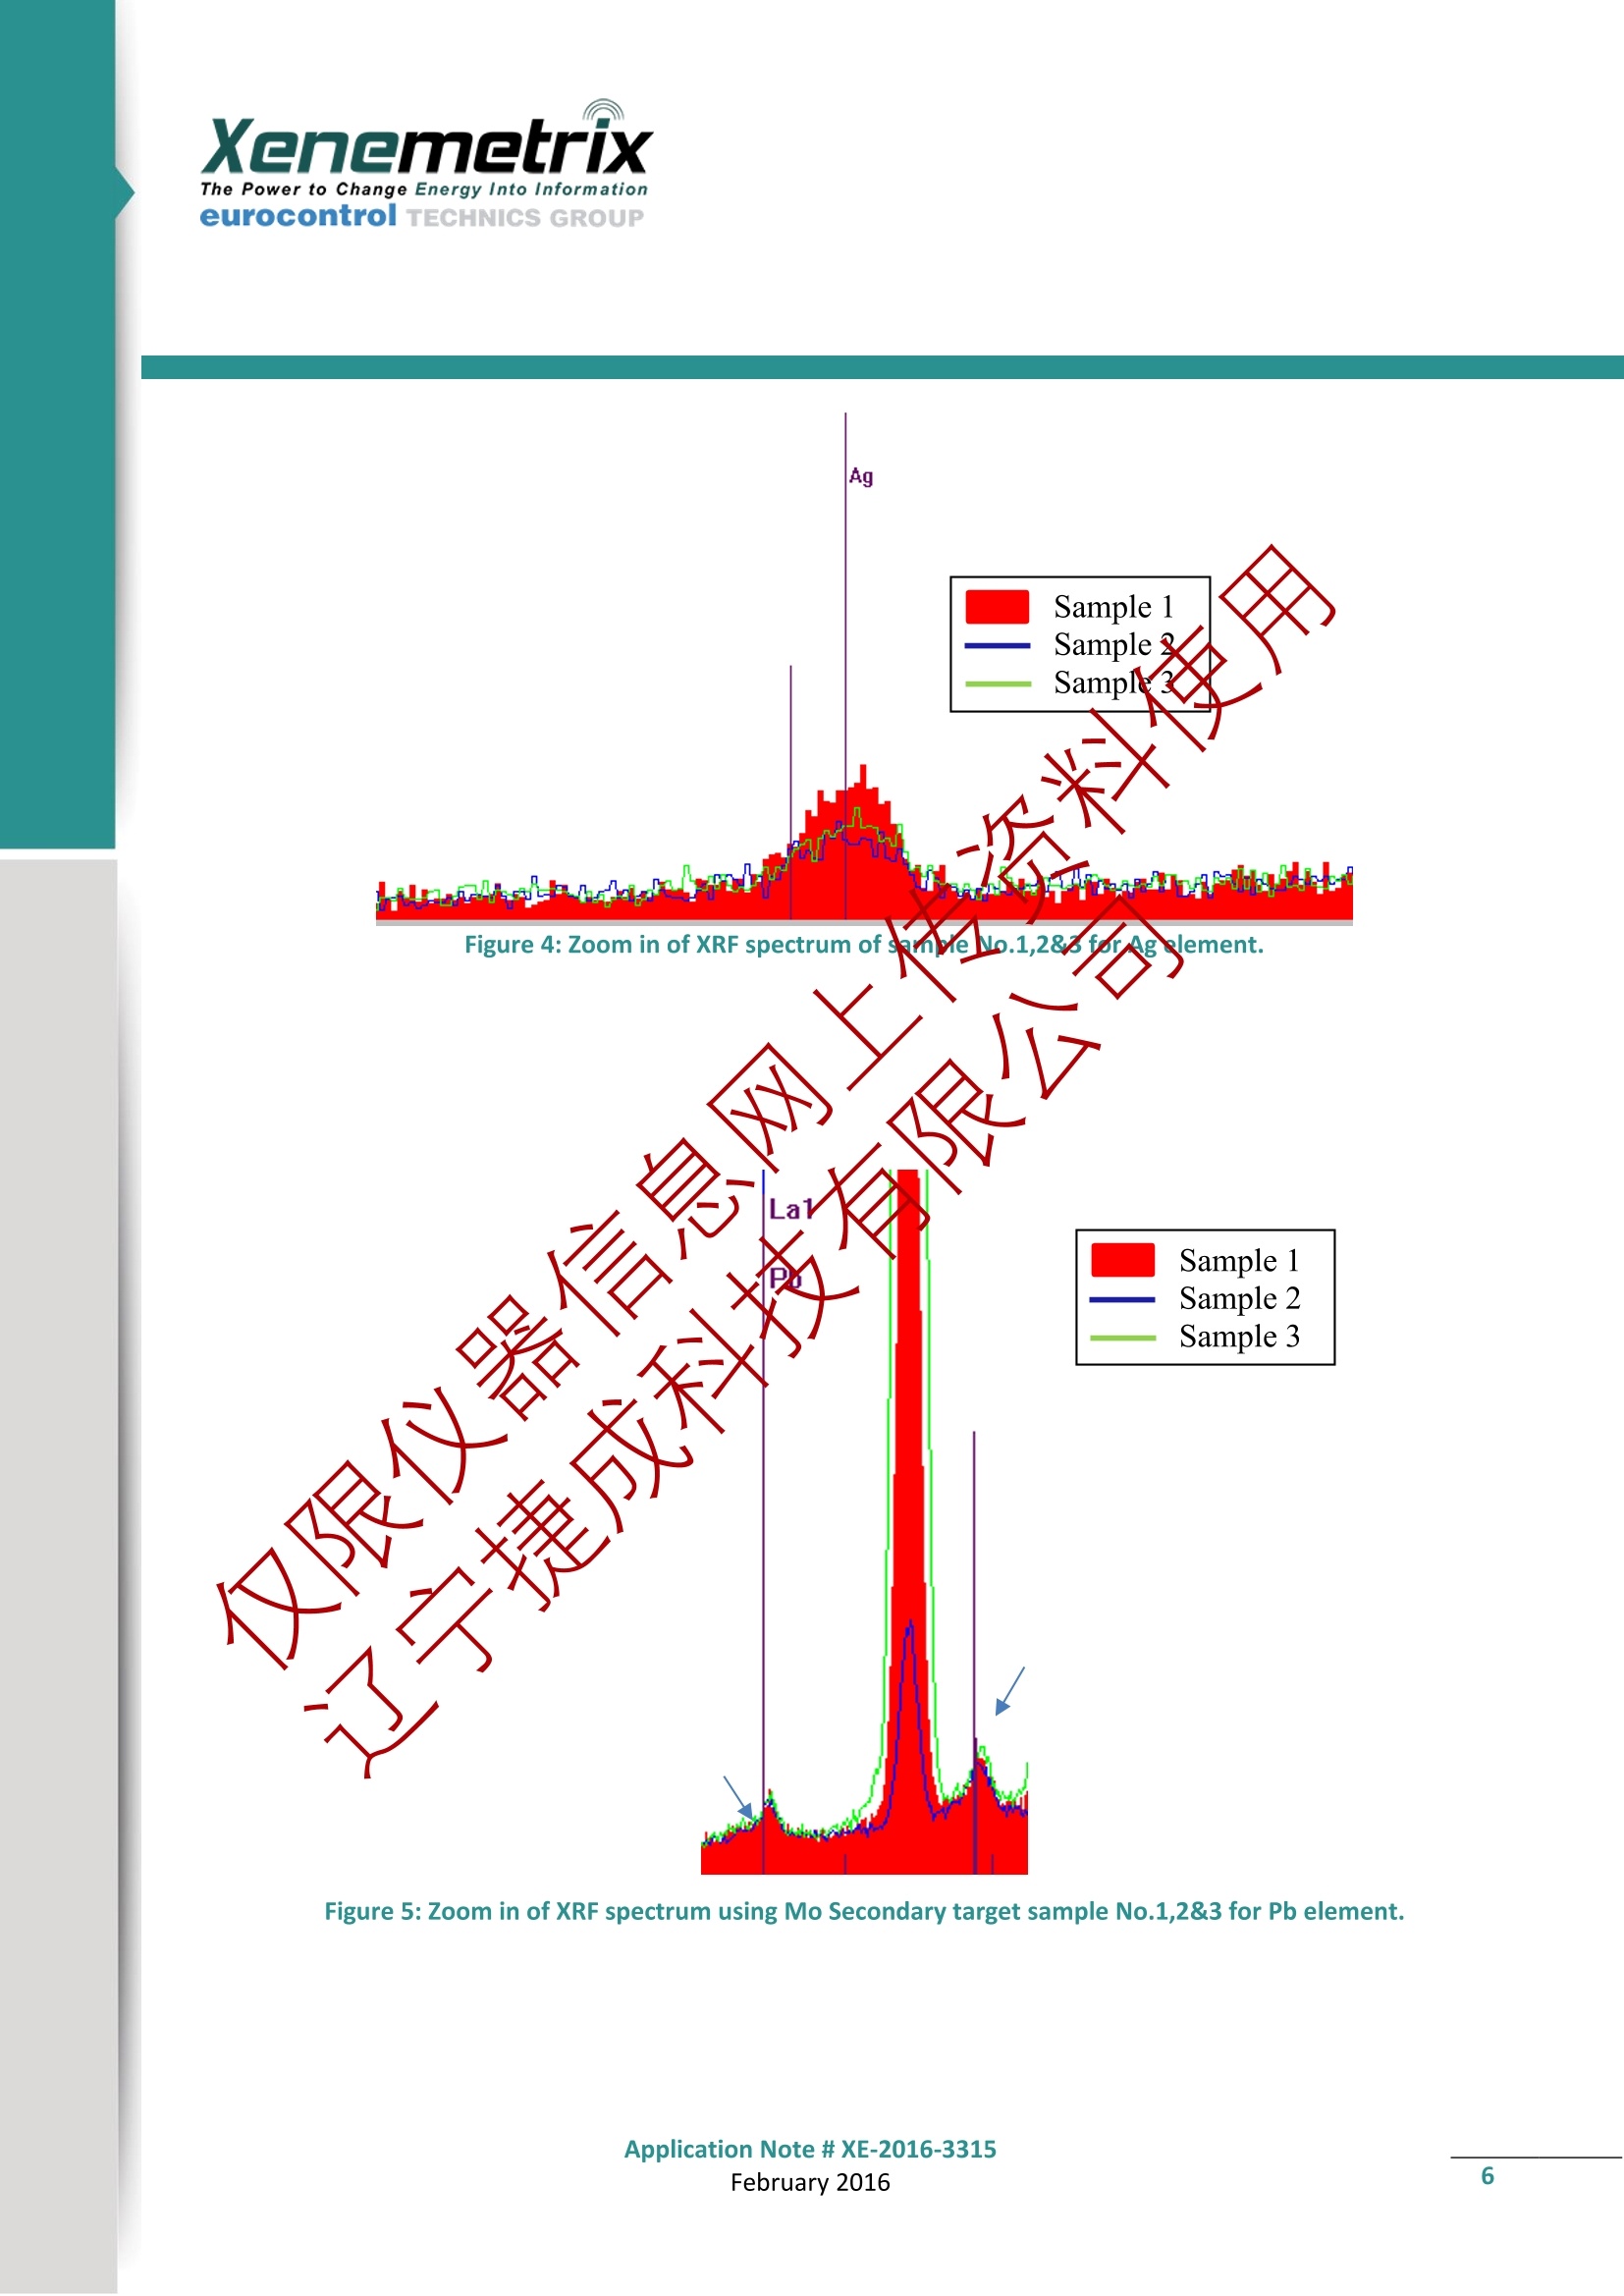
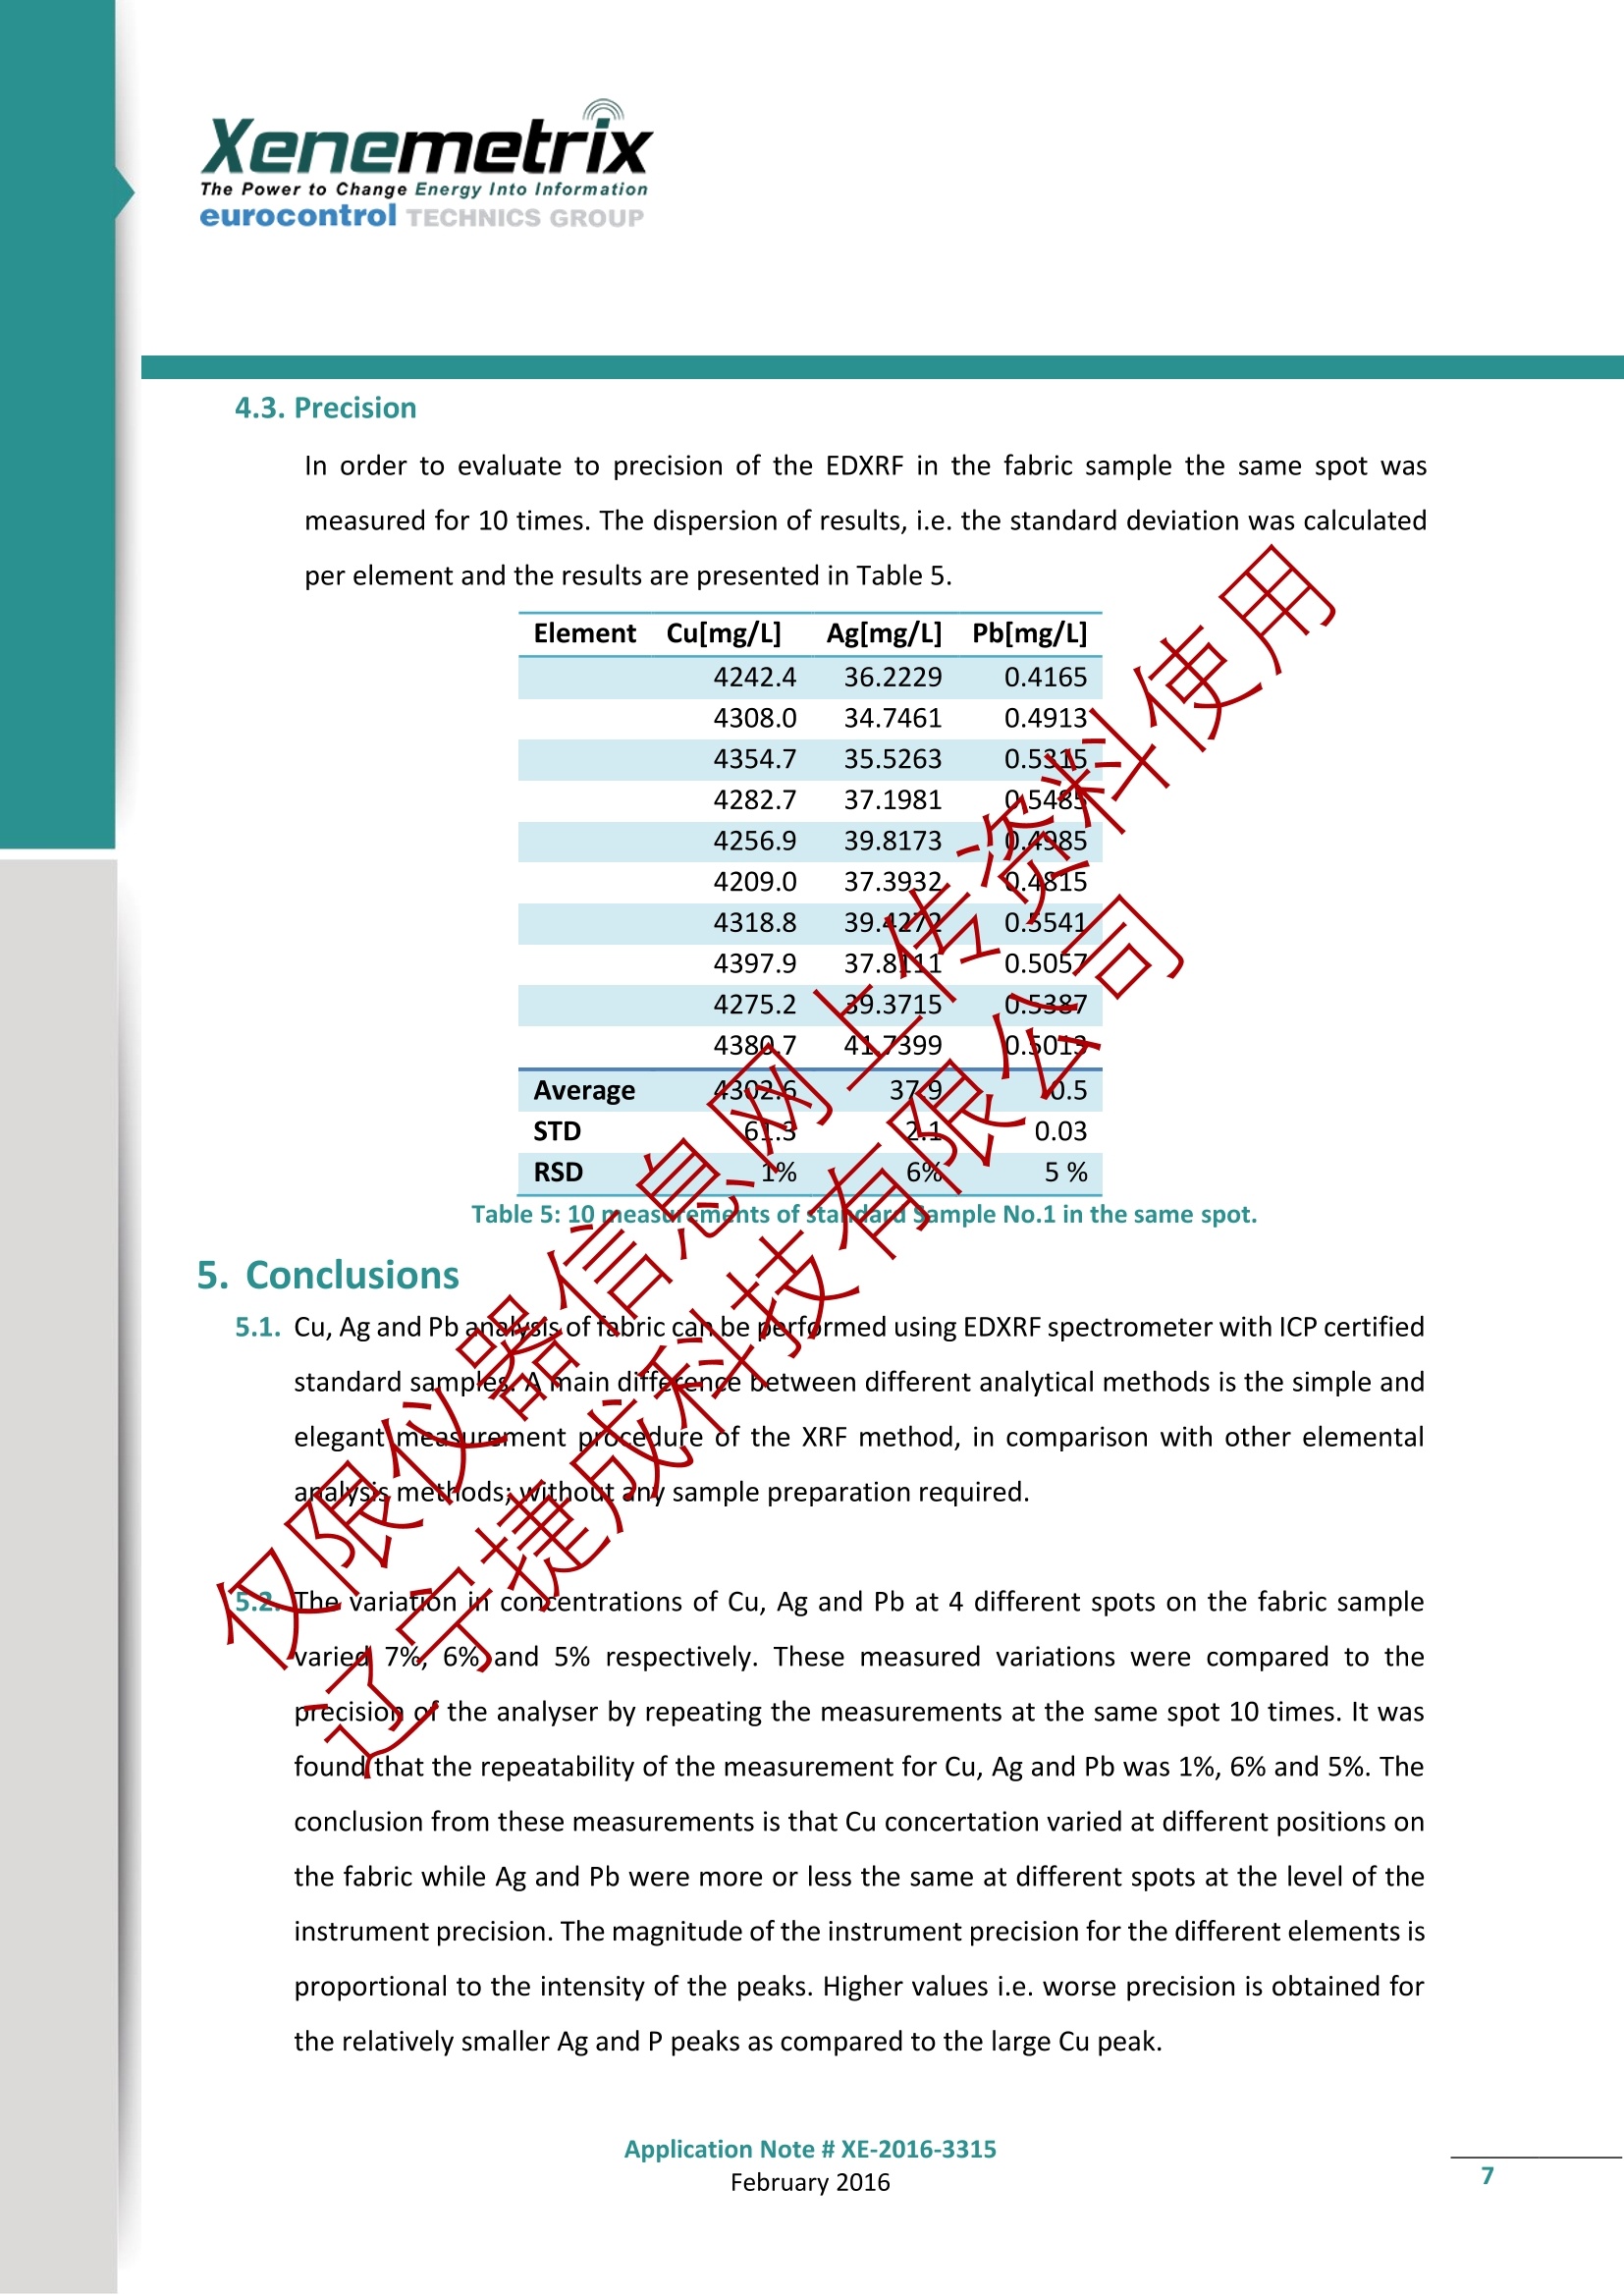
XenemetrixThe Power to Change Energy Into InformationeurocontrolI TECHNICS GROUP Application Note # XE-2016-3315 Quantitative elemental analysis of fabric usingGOXRFAnalyser Genius IF Limor Halay, Xenemetrix LTD. 23/02/2016 Execytngtumma Three fabric sainples were received for quantitative elemental analysis using Energy Dispersive X-rayFluoresdence (EDXRE) technique. The elemental distribution in the fabric of Cu, Ag and Pb wasmeasured on Genius IF calibrated with two of the fabric samples of known concentrations of aboveelements as analysed by ICP. The chemical compositions of the fabric samples were determined byperforming simple and fast measurements using the Xenemetrix Genius IF Bench-top system. The three elements were measured successfully at four different spots on the fabric sample. It wasfound that the distribution of Cu varied significantly while the Ag and the Pb distribution was quiteconstant at the different spots on the sample. Br was also detected in the fabric but was not quantifieddue to lack of calibration standard. The Power to Change Energy Into Information eurocontrol TECHNICS GROUP 1. Introduction Xenemetrix's Genius IF EDXRF spectrometer provides a non-destructive qualitative and quantitativedetermination from carbon (Z=6) to fermium (Z=100), providing detection limits from sub-ppm to highweight percent concentrations. The Genius IF has powerful components including: Kfuxy integratedcomputer system, a high resolution Silicon Drift Detector and a powerful X-Ray tooe with variable spotsizes, designed to accommodate samples of various sizes. The Genius IF has a unique patented optical geometry combining eight ecordary targets, with eightcustomizable tube filters allowing for simple software operatedwitch between the techniques ofsecondary target excitation and direct excitation. Direct excitation mode with different filters can bemade very efficient and optimal for any element detected inXDXRF. The WAG (Wide Angle Geometry)patented secondary target technique provides the best results in partiular for minor and traceelement analysis. The X-ray tube excites the characteristic K lines of a secondary target (a pure metal)which are used to excite the sample "mongchrematically"Bysing secondary targets, the detectionlimits for certain elements can be lowered even further.These cver detection limits make the GeniusIF suitable for a larger range of applicetionsythat had preyiously not been accessible to conventionalEDXRF instruments, and turnthis instrument into the most versatile elemental analyser available. 2. Objective 1. Measure the Nemental distributren of Cu, Ag and Pb in a fabric sample. 2.AnalyeCwAgand Pbyolements in the fabric using two ICP certified standards to calibrate theinstrument fbnthe three eements. This repprt summarizes the results of a quantitative analysis performed on Genius IF EDXRF analyser. 3. Experimental 3.1.Equipment All measurements were conducted on a Genius IF system equipped with a Silicon Drift Detector (SDD).Direct excitation with a W tube filter was used to analyse Cu and Ag. A Mo secondary target excitationwas used for the analysis of Pb. The measurement parameters are summarized in table 1. The Power to Change Energy Into Informationeurocontrol TECHNICS GROUP Instrument Configuration Genius IF, Rh Anode x-ray tube, 50kV, 50W Detector Silicon drift detector Atmosphere Air Excitation mode Direct excitation with W tube filter,Mo Secondary target excitation. Acquisition time 600 sec Analysis method Regression curves Table 1: measurement parameters 使3.2. Sample Preparation 料 No sample preparation is required in this case. stretching out the fabric before measurementis recommended. 4.Results 4.1.Elemental Distribution Two pieces of sample no. 1 were received.me niede of fabrie Sakople No. 1 was divided to 4 samplesaccording to figure 1 below. The other Pieoe of FabriySample No.1 was used as a calibration standardwith certified ICP values (an avevage of 3CP measuremgents was taken). The spectral data showed asimilar peaks for all three san ples forpb concertrations (see figure 5) therefore it was decided thatthe reading of<0.003mactording to certified sample No.1 won’t be used as a standard and SampleNo.2 will be used asa cetiied ICP sarofe forcalibration to analyse the concentration of Pb. Figure 1: Sample No. 1 fabric segmentation Quantitative results measured by EDXRF are shown in the table below Element ICP Sample XRF sample XRF sample XRF sample XRF sample [mg/L] #1_1[mg/L] #1_2[mg/L] #1_3[mg/L] #1_4[mg/L] Cu 4935 5261 4823 4715 5410 Ag 44 39 34 35 36 Pb 0.49(note1) 0.44 0.46 0.45 0.49 Table 2: Quantitative results of XRF analysis of fabric sample No. 1 measured imd different spots. Note 1: Given certified ICP value for sample No.2. Cu Pb Average 5053 > 0.46 STD 335.4 0.02 RSD 7% 5% Table 3: Statistical data of XRF analysis of tabric sample No. 1. Representative EDXRF spectrum of standard sample No: 1 is shon in figure 2 below. Cu有技科成Cu Br Figure 2: XRF spectrum showing Cu,Ag and Br peaks in sample No.1 Fe and Ni measurements are from the EDXRF chamber. The Power to Change Energy Into Information eurocontrol TECHNICS GROUP 4.2. Fabric samples analysis Three fabric samples were measured. The elements Cu and Ag was measured using a W filter and Pbwas measured using Mo secondary target. The EDXRF showed the appearance of Br element as well. In order to analyse the concentration astandard must be received. ·用Table 4 describes quantitative results of the three fabric samples.使料 XRF ICP Ref. XRF ICPRe XRF ICP Ref. Element sample 1 sample 1 sample 2 sample2 sample 3 sample 3 [mg/kg] [mg/kg] [mg/kg] 8/g img/kg] [mg/kg] Cu 4935 4935 2228 Z62.5 2730 7466.7 Ag 44 44 17 52.39 22 90.88 Pb 0.45 <0.003 0.49 0.49 0.47 0.85 Table 4: Quantitative results of XNF ahalysig of the anrsiamples vs. the ICP results. XRF spectrum of the three samples withovertap is show in figure 3. Xenemetrix The Power to Change Energy Into InformationeurocontrolTECHNICS GROUP Figure 4: Zoom in of XRF spectrum of sainyeeNNo.1,2&3forAglement. Figure 5: Zoom in of XRF spectrum using Mo Secondary target sample No.1,2&3 for Pb element. Application Note # XE-2016-3315 The Power to Change Energy Into Information 4.3. Precision In order to evaluate to precision of the EDXRF in the fabric sample the same spot wasmeasured for 10 times. The dispersion of results, i.e. the standard deviation was calculatedper element and the results are presented in Table 5. Element Cu[mg/L] Ag[mg/L] Pb[mg/L] 4242.4 36.2229 0.4165 4308.0 34.7461 0.49131 4354.7 35.5263 0.5315. 4282.7 37.1981 05465 4256.9 39.8173 0.4985 4209.0 37.3932 Q.4815 4318.8 39.4270 0.5541 Average 4397.9 37.8111 0.5057 4275.2 39.3715 0.5387 4380.7 417399 0.5019 4302.6 379 W0.5 0.03 Table 5: 10 measwemehts of stalldard Sample No.1 in the same spot. 5. Conclusions 5.1. Cu,Ag and Pb analysis of tabric can be performed using EDXRF spectrometer with ICP certifiedstandard samplesnmain diffeenge between different analytical methods is the simple andelegant measurement procedure of the XRF method, in comparison with other elementalardlySis methodsjwithout any sample preparation required. 5.2.The variatron in concentrations of Cu, Ag and Pb at 4 different spots on the fabric samplevaried7%,6% and 5% respectively. These measured variations were compared to theprecision of the analyser by repeating the measurements at the same spot 10 times. It wasfound that the repeatability of the measurement for Cu, Ag and Pb was 1%, 6% and 5%. Theconclusion from these measurements is that Cu concertation varied at different positions onthe fabric while Ag and Pb were more or less the same at different spots at the level of theinstrument precision.The magnitude of the instrument precision for the different elements isproportional to the intensity of the peaks. Higher values i.e. worse precision is obtained forthe relatively smaller Ag and P peaks as compared to the large Cu peak. 5.3. The results accuracy can easily be improved by measuring additional calibration standards ofknown concentrations and adding them to the calibration curve which correlate intensity andconcentration. 5.4. The spectral data showed that the highest peak for copper is for sampleo. .thereforeaccording to the EDXRF it seems less possible that sample no. 3 has 7466 ppmofC. 5.5. Due to surface of the fabric we recommend to stretch out the fabric befornmeasurement. 6.Summary EDXRF is a fast and non-destructive technique that can quantify any type of sample: solid, powderor liquid, within a few minutes. EDXRF spectrometers can play an important role in assuring thatconsistent quality of samples is retained throughout anmnanulfacturing process. EDXRF is an ideal method for elemental analysis offering the fotlewing advantages: Minimal sample preparation √Fast and automated analysis process √ Limited or no exposure to comesive reagents used by otHer analytical techniques √ Ease of use for operatien by non technicafor Mon-secialized personnel. 技科 Xeningtix The Power飞 o Information Ramat pabriel ladustrial Zone, 6 Hatikshoret St., Migdal Haemek 2310901, Israel Emailinfokenemetrix.com Web: www.xenehetrix.com Tel: +972-4-9891313 www.linkedin.com/company/xenemetrix-ltd. www.facebook.com/Xenemetrix www.youtube.com/user/Xenemetrix February Application Note # XE-ebruary 使用Xenemetrix公司Genius IF能量色散X射线荧光光谱仪对织物中的元素进行定量分析,以体现荧光光谱仪在织物领域中的应用。Xenemetrix公司的Genius IF荧光光谱仪被证明可以应用到织物中的元素分析。
确定

还剩6页未读,是否继续阅读?

产品配置单
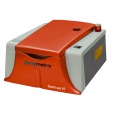
辽宁捷成科技有限公司为您提供《织物中元素分析检测方案(能散型XRF)》,该方案主要用于纺织品/服装/帽中化学成分检测,参考标准--,《织物中元素分析检测方案(能散型XRF)》用到的仪器有Xenemetrix 能量色散X射线荧光光谱仪 Genius IF
推荐专场
X荧光光谱、XRF(能量色散型X荧光光谱仪)

相关方案
更多