


采用LaVision的突发式PLIF测量系统及双像器,对非定常火焰放热区进行了突发模式OH/CH2O平面激光诱导荧光成像测量研究。
方案详情

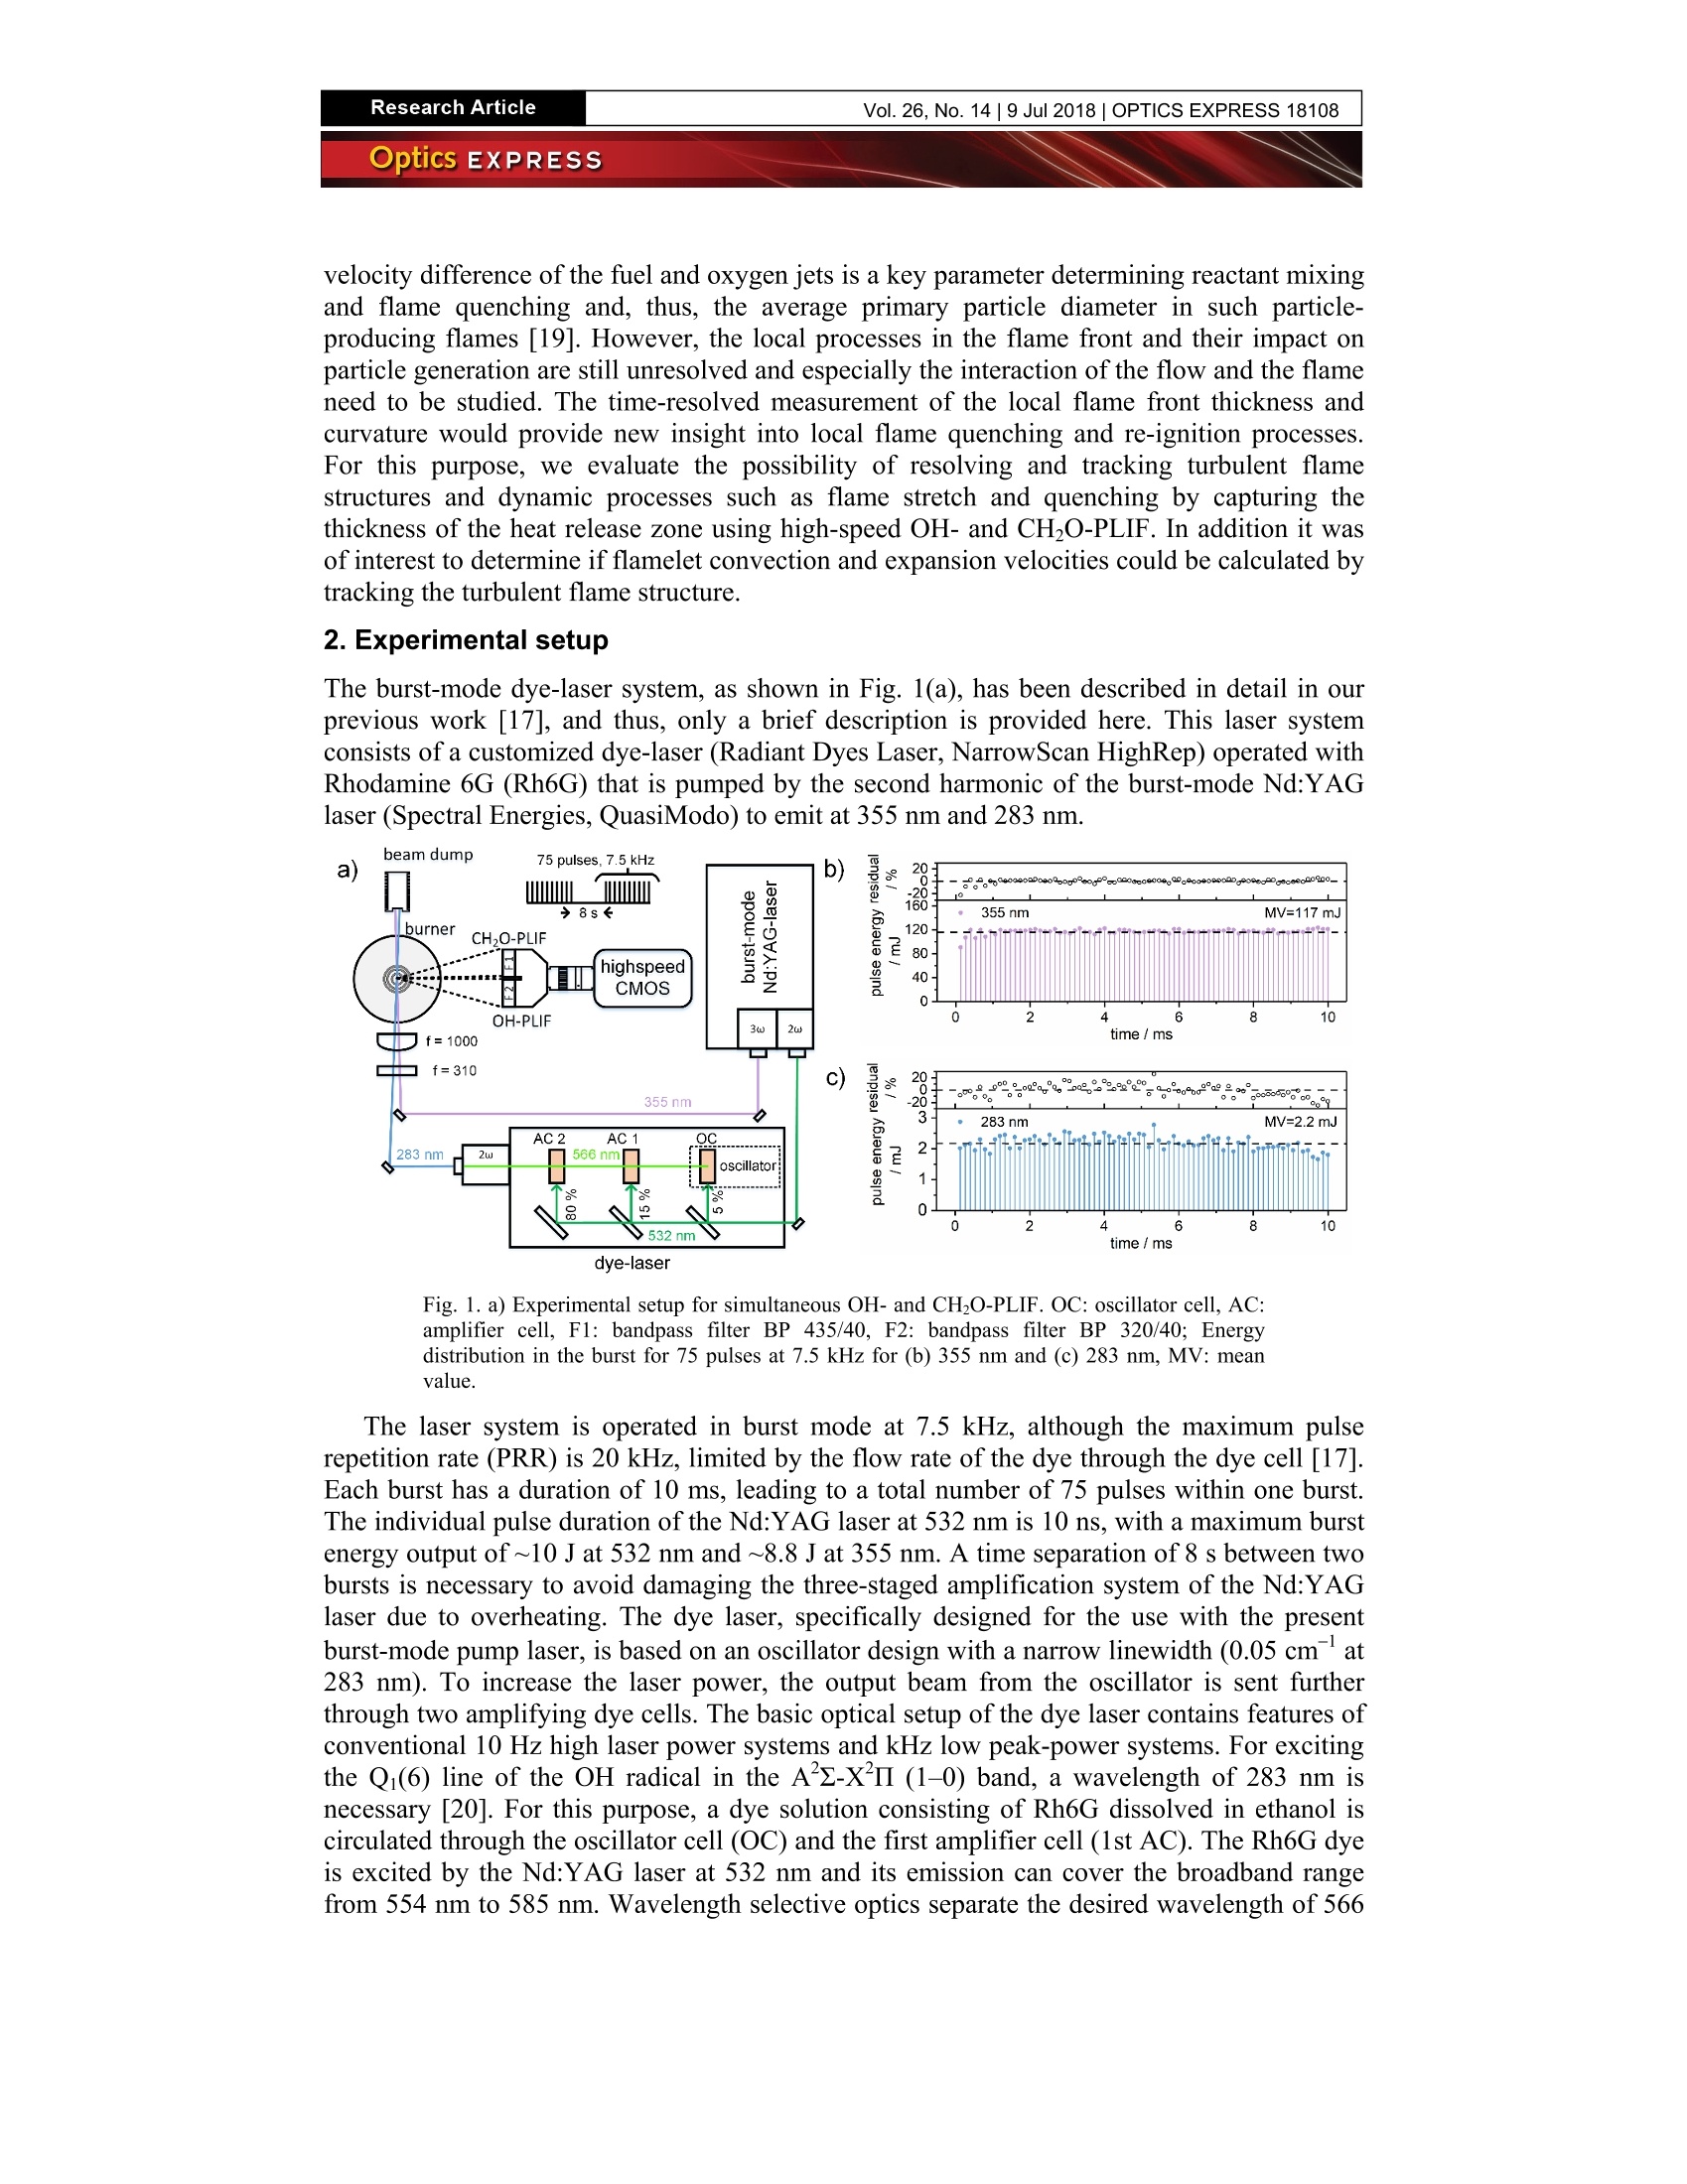
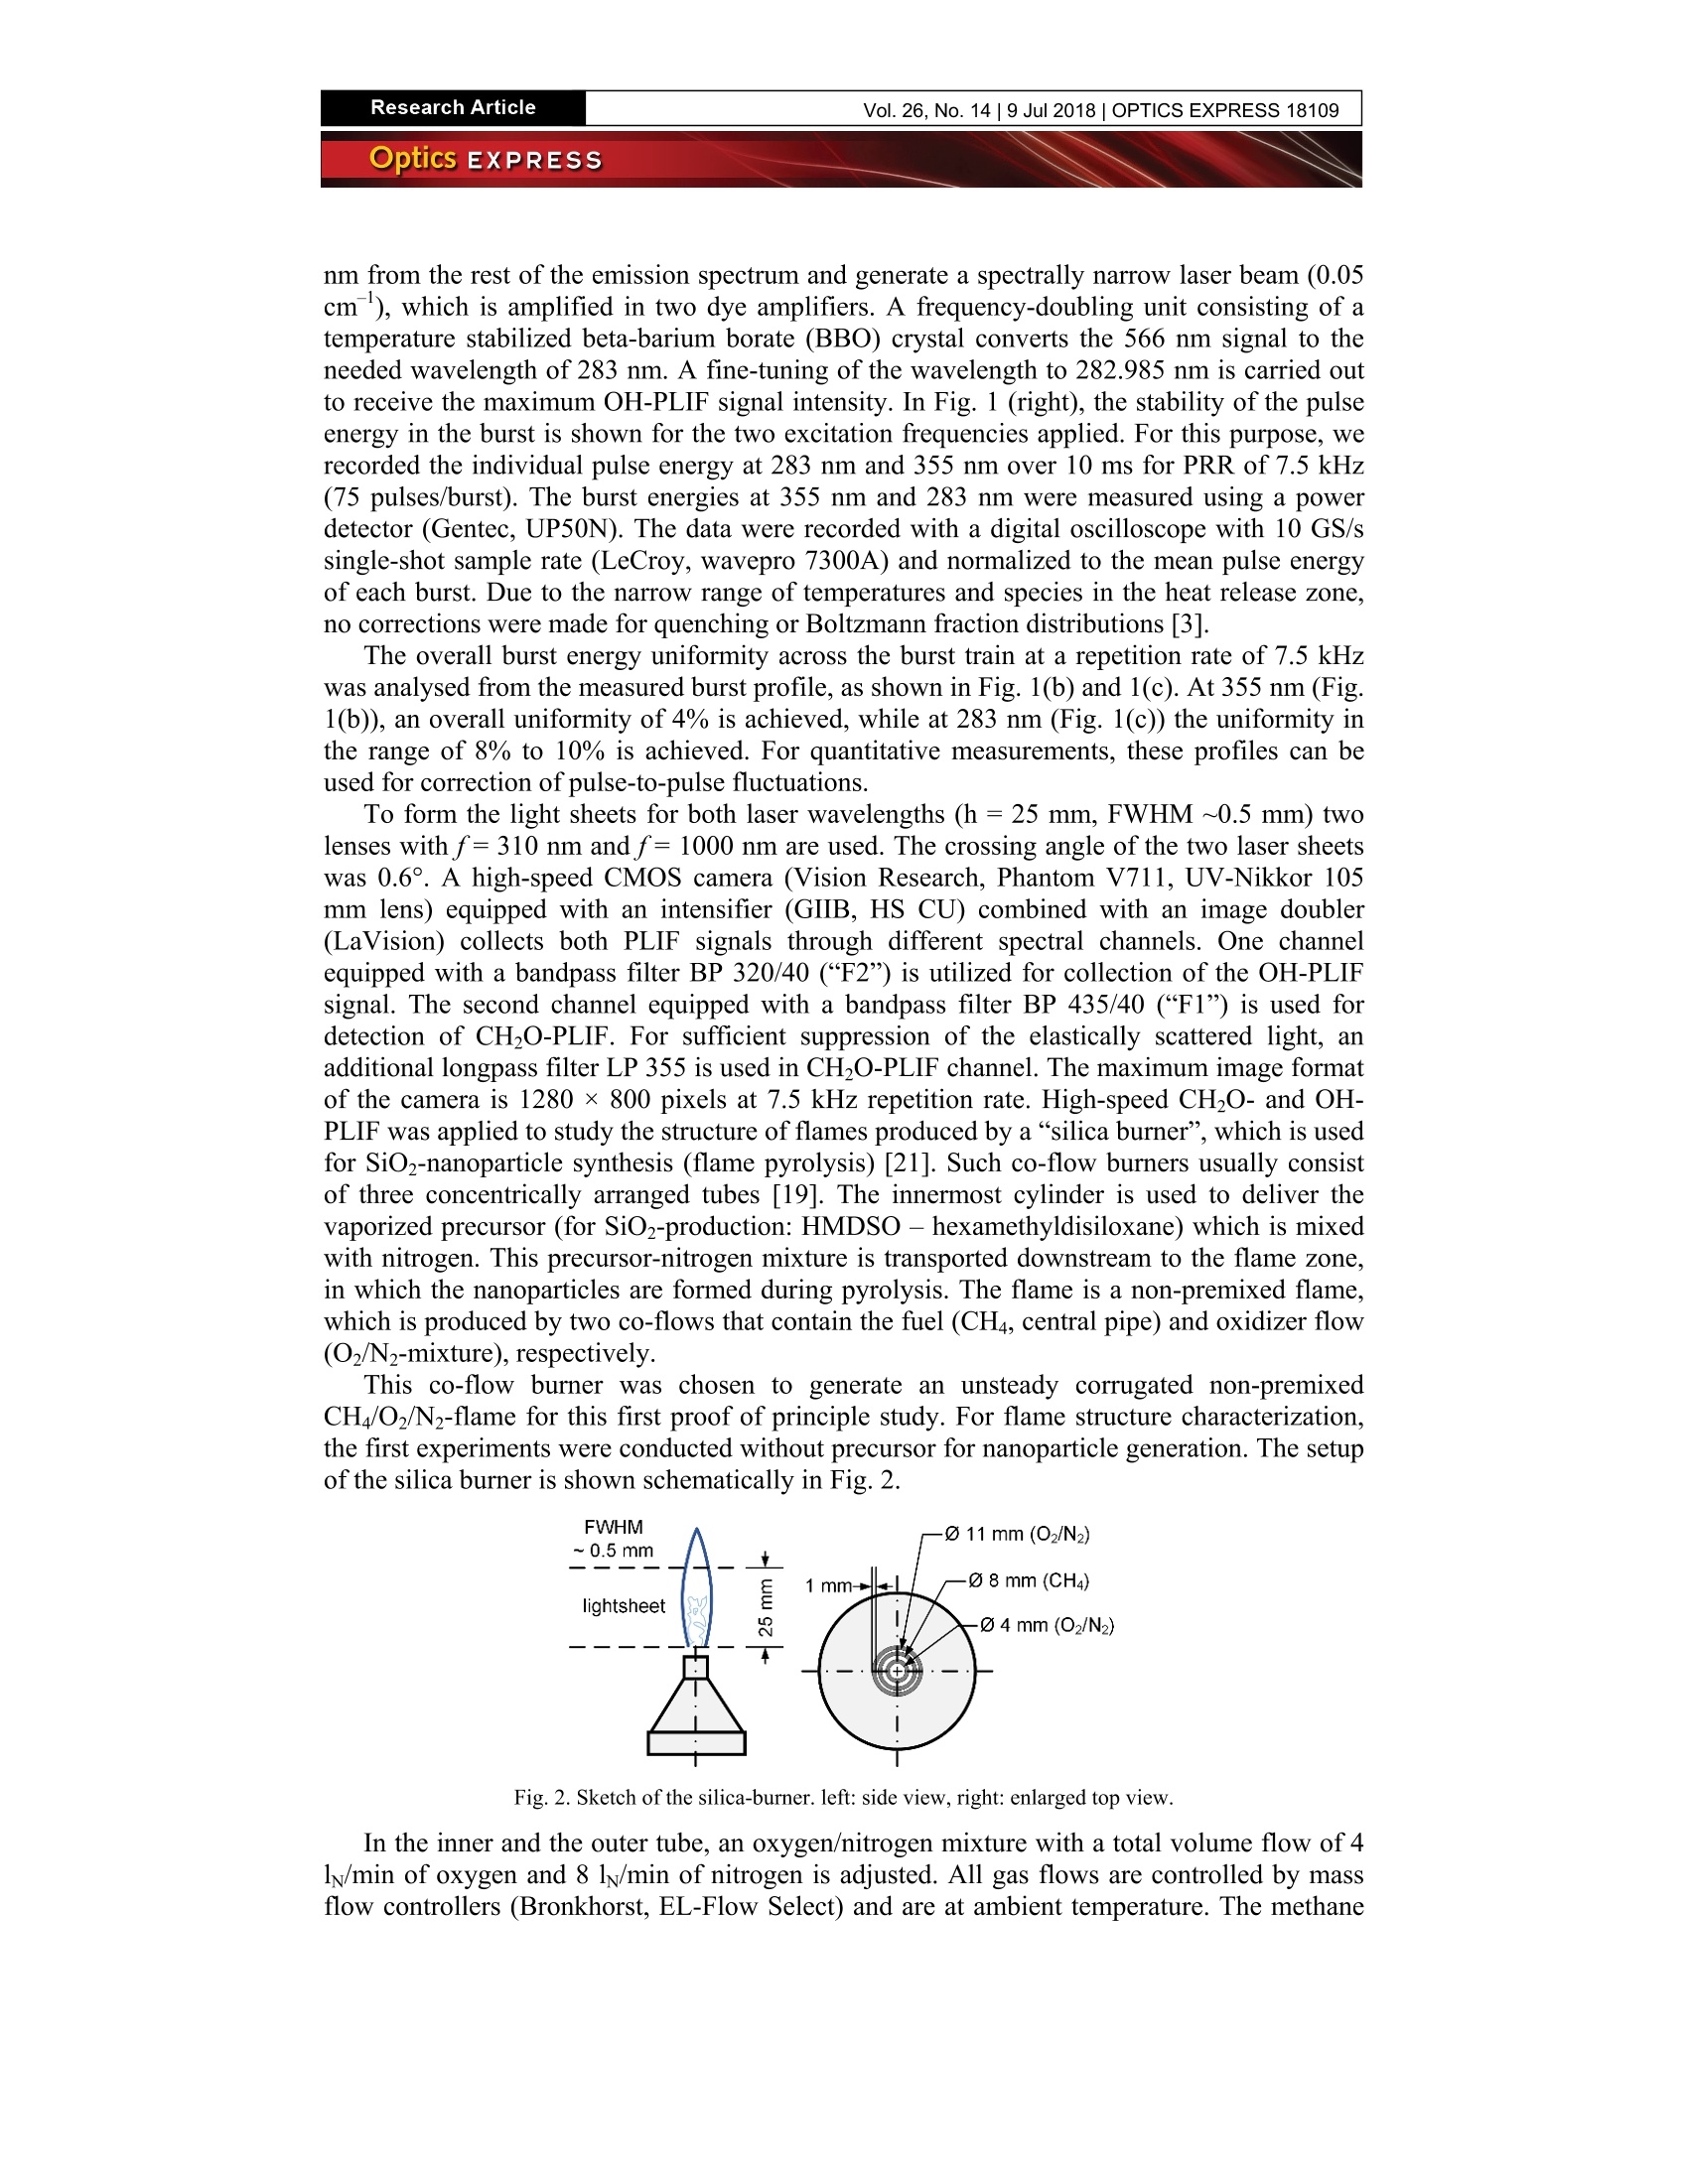
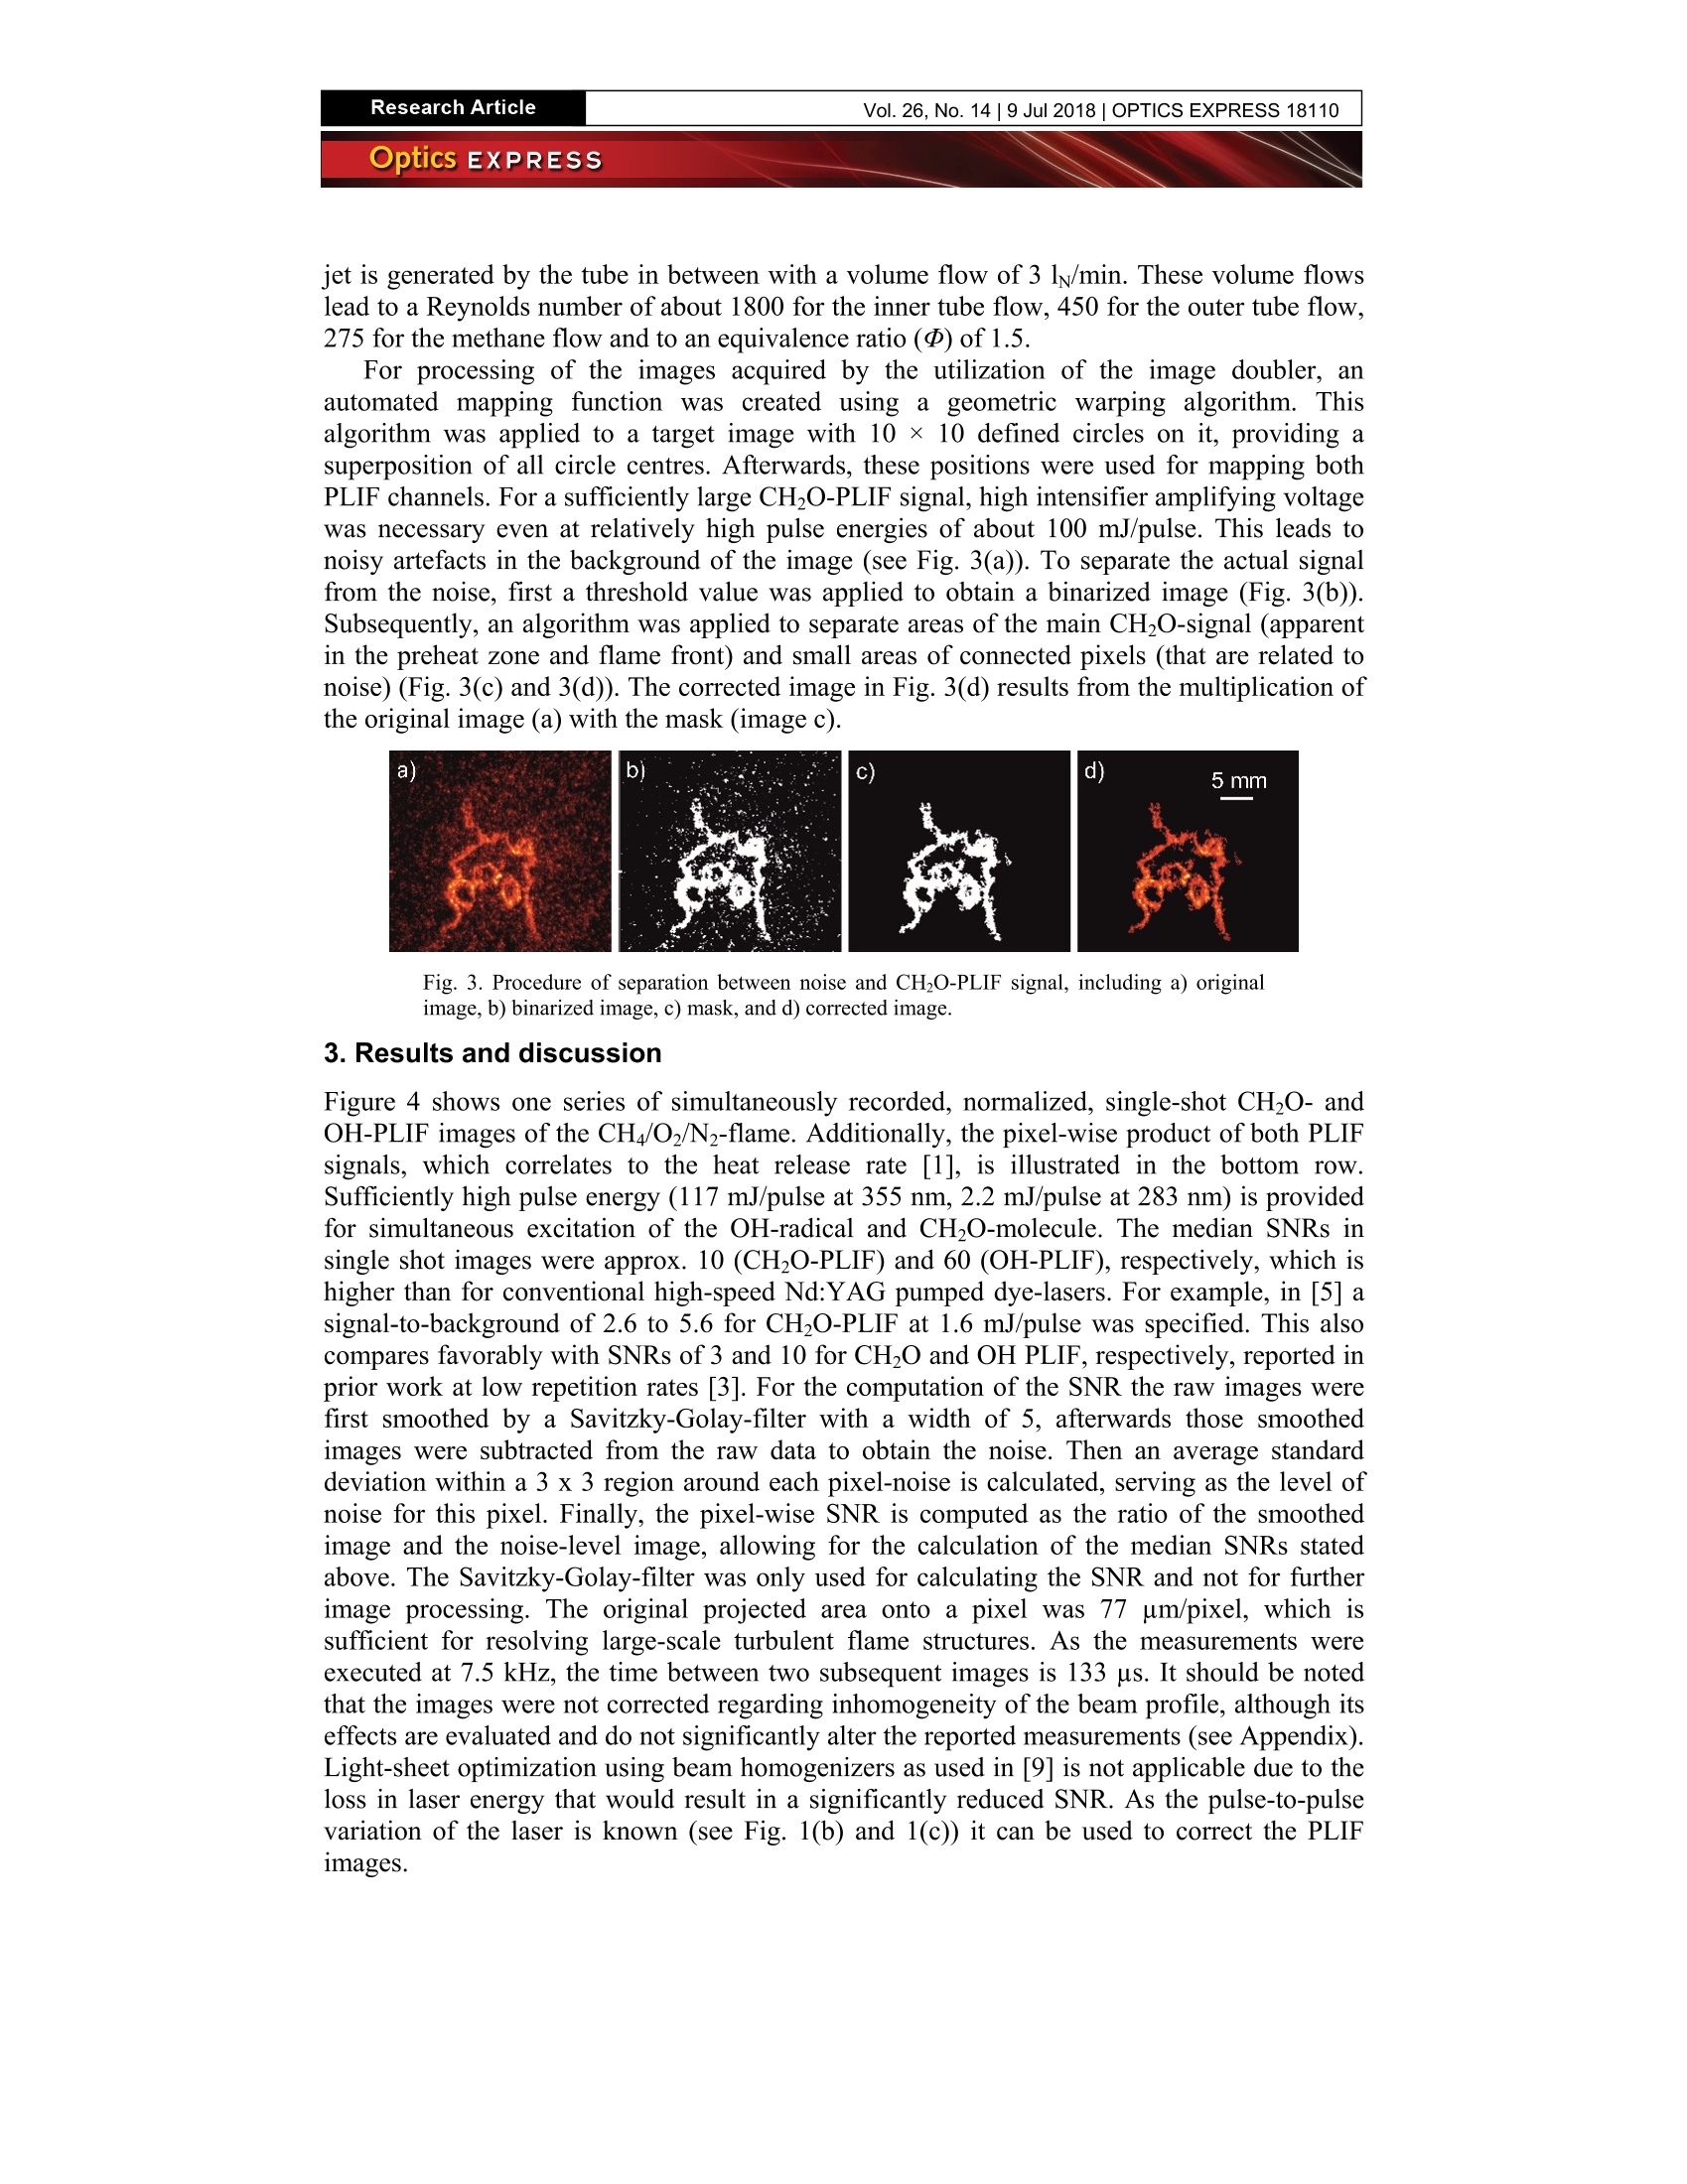
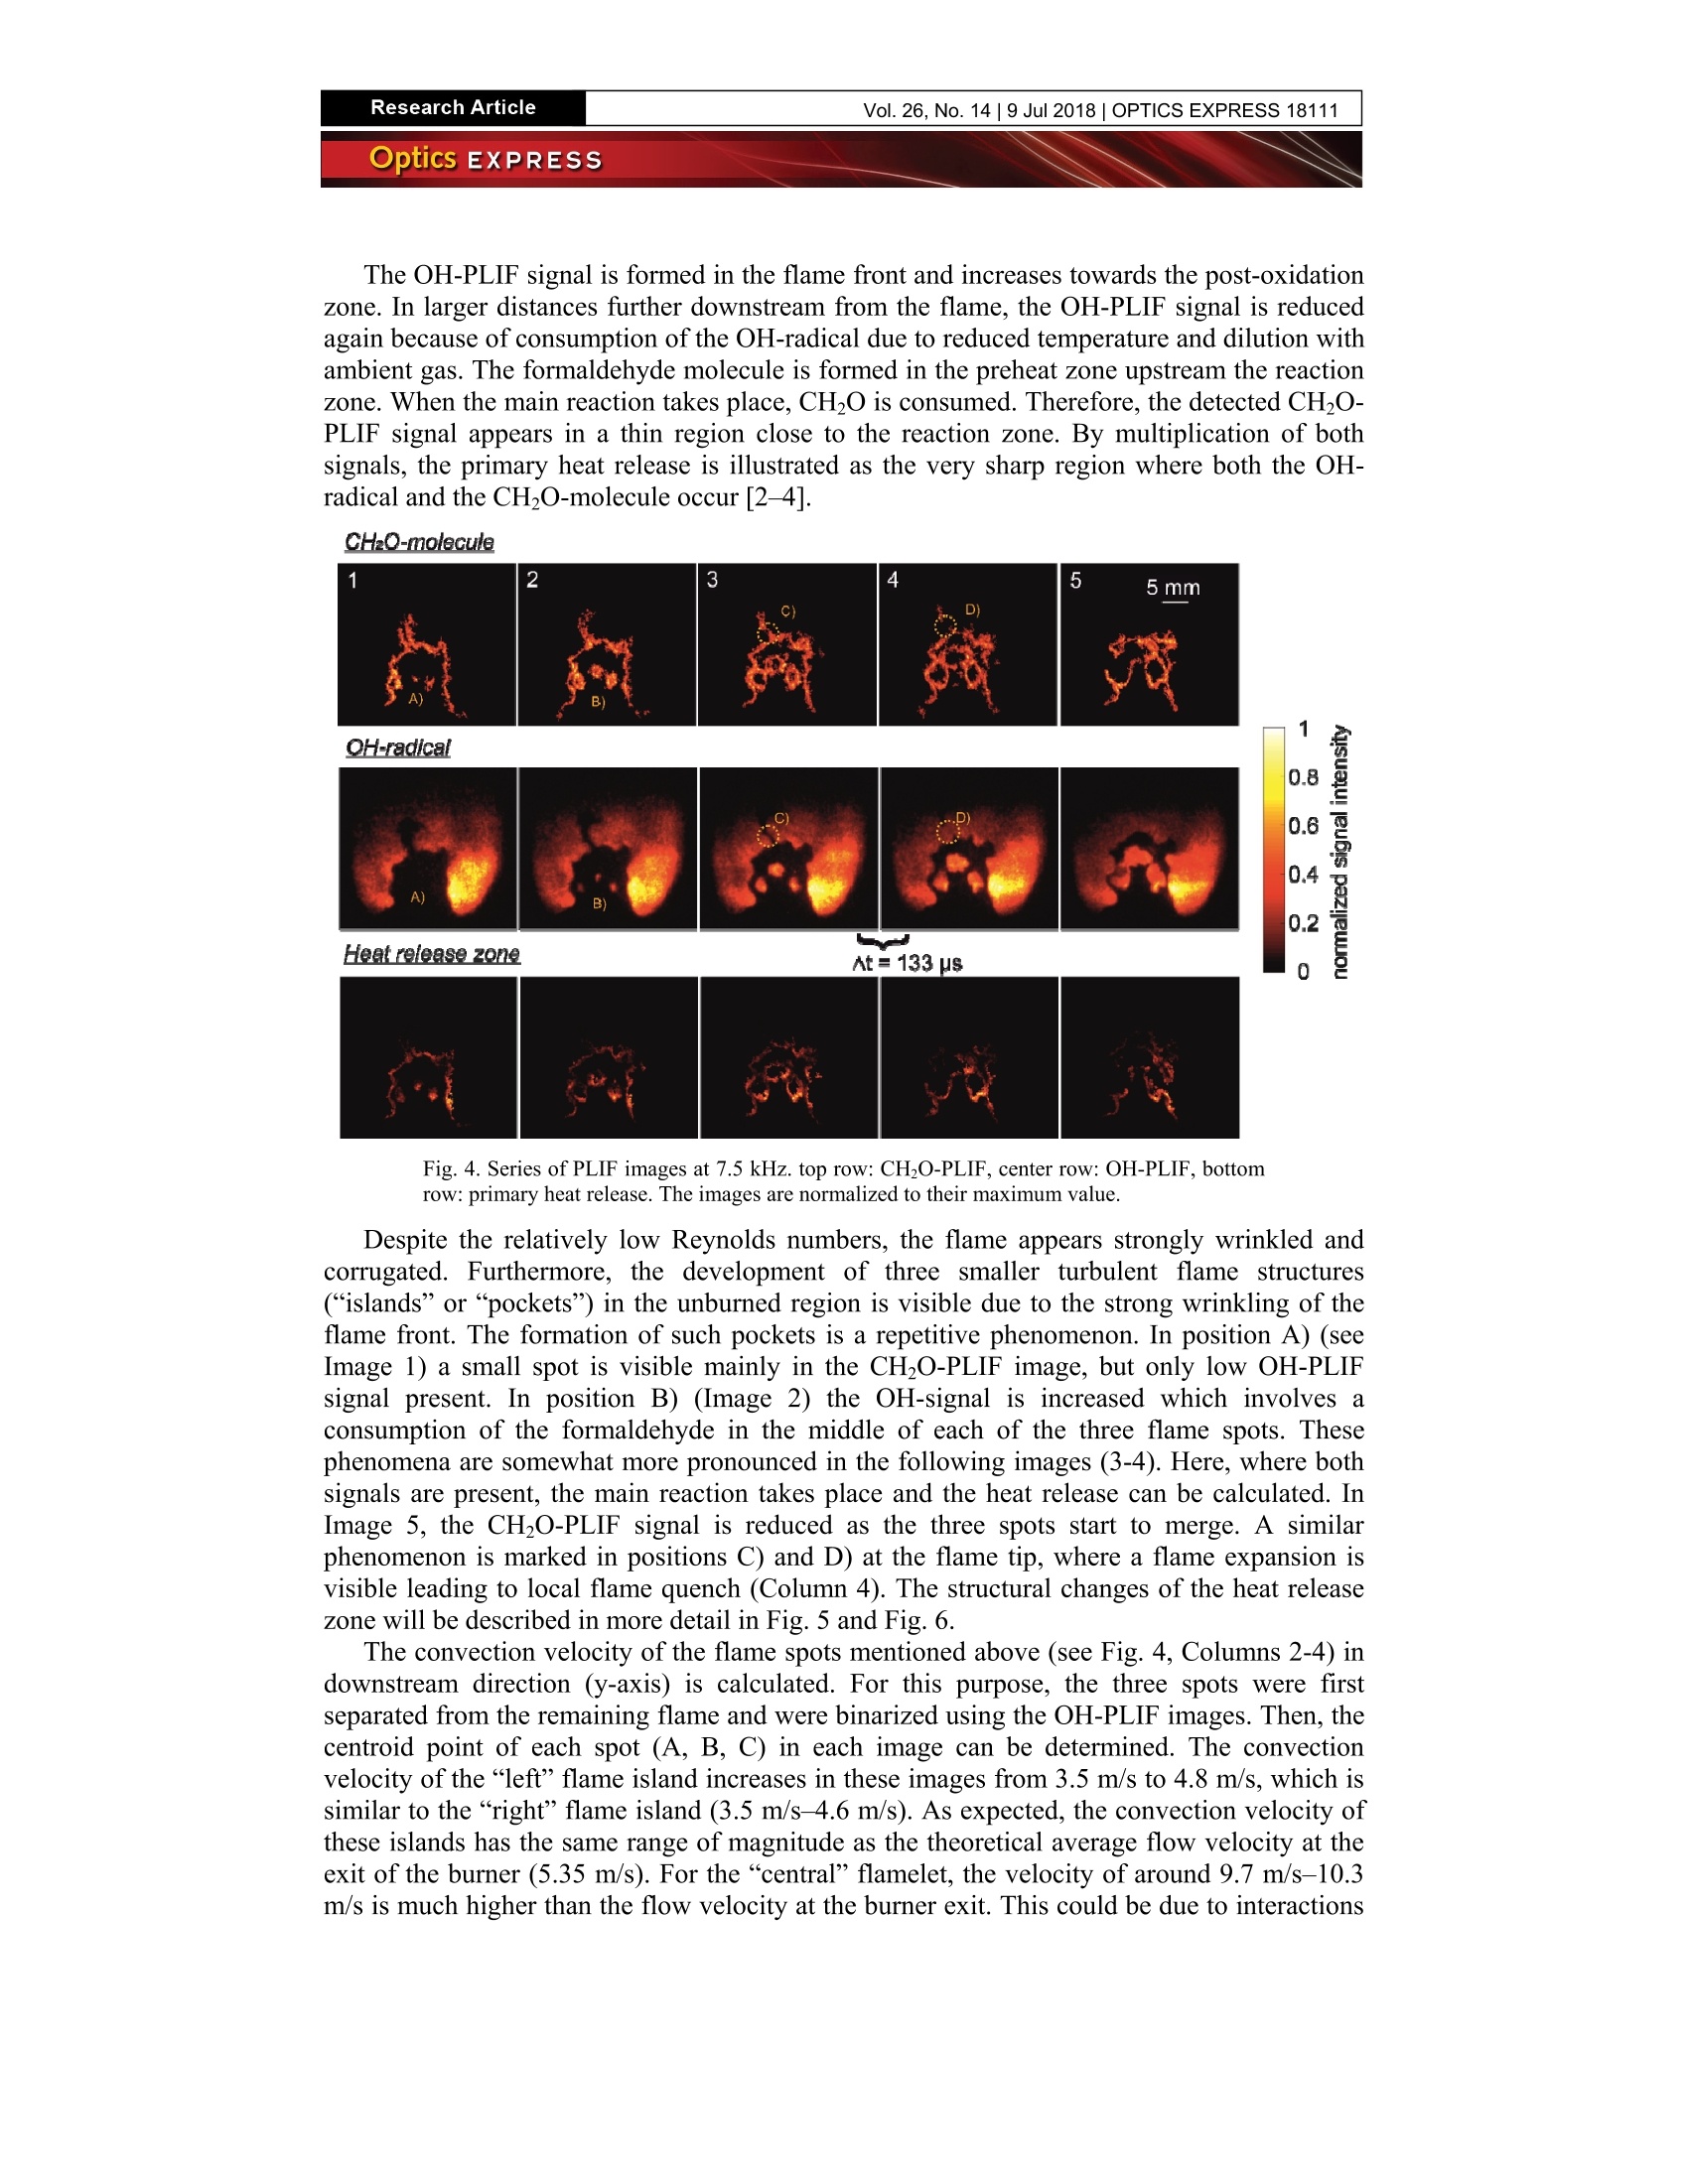
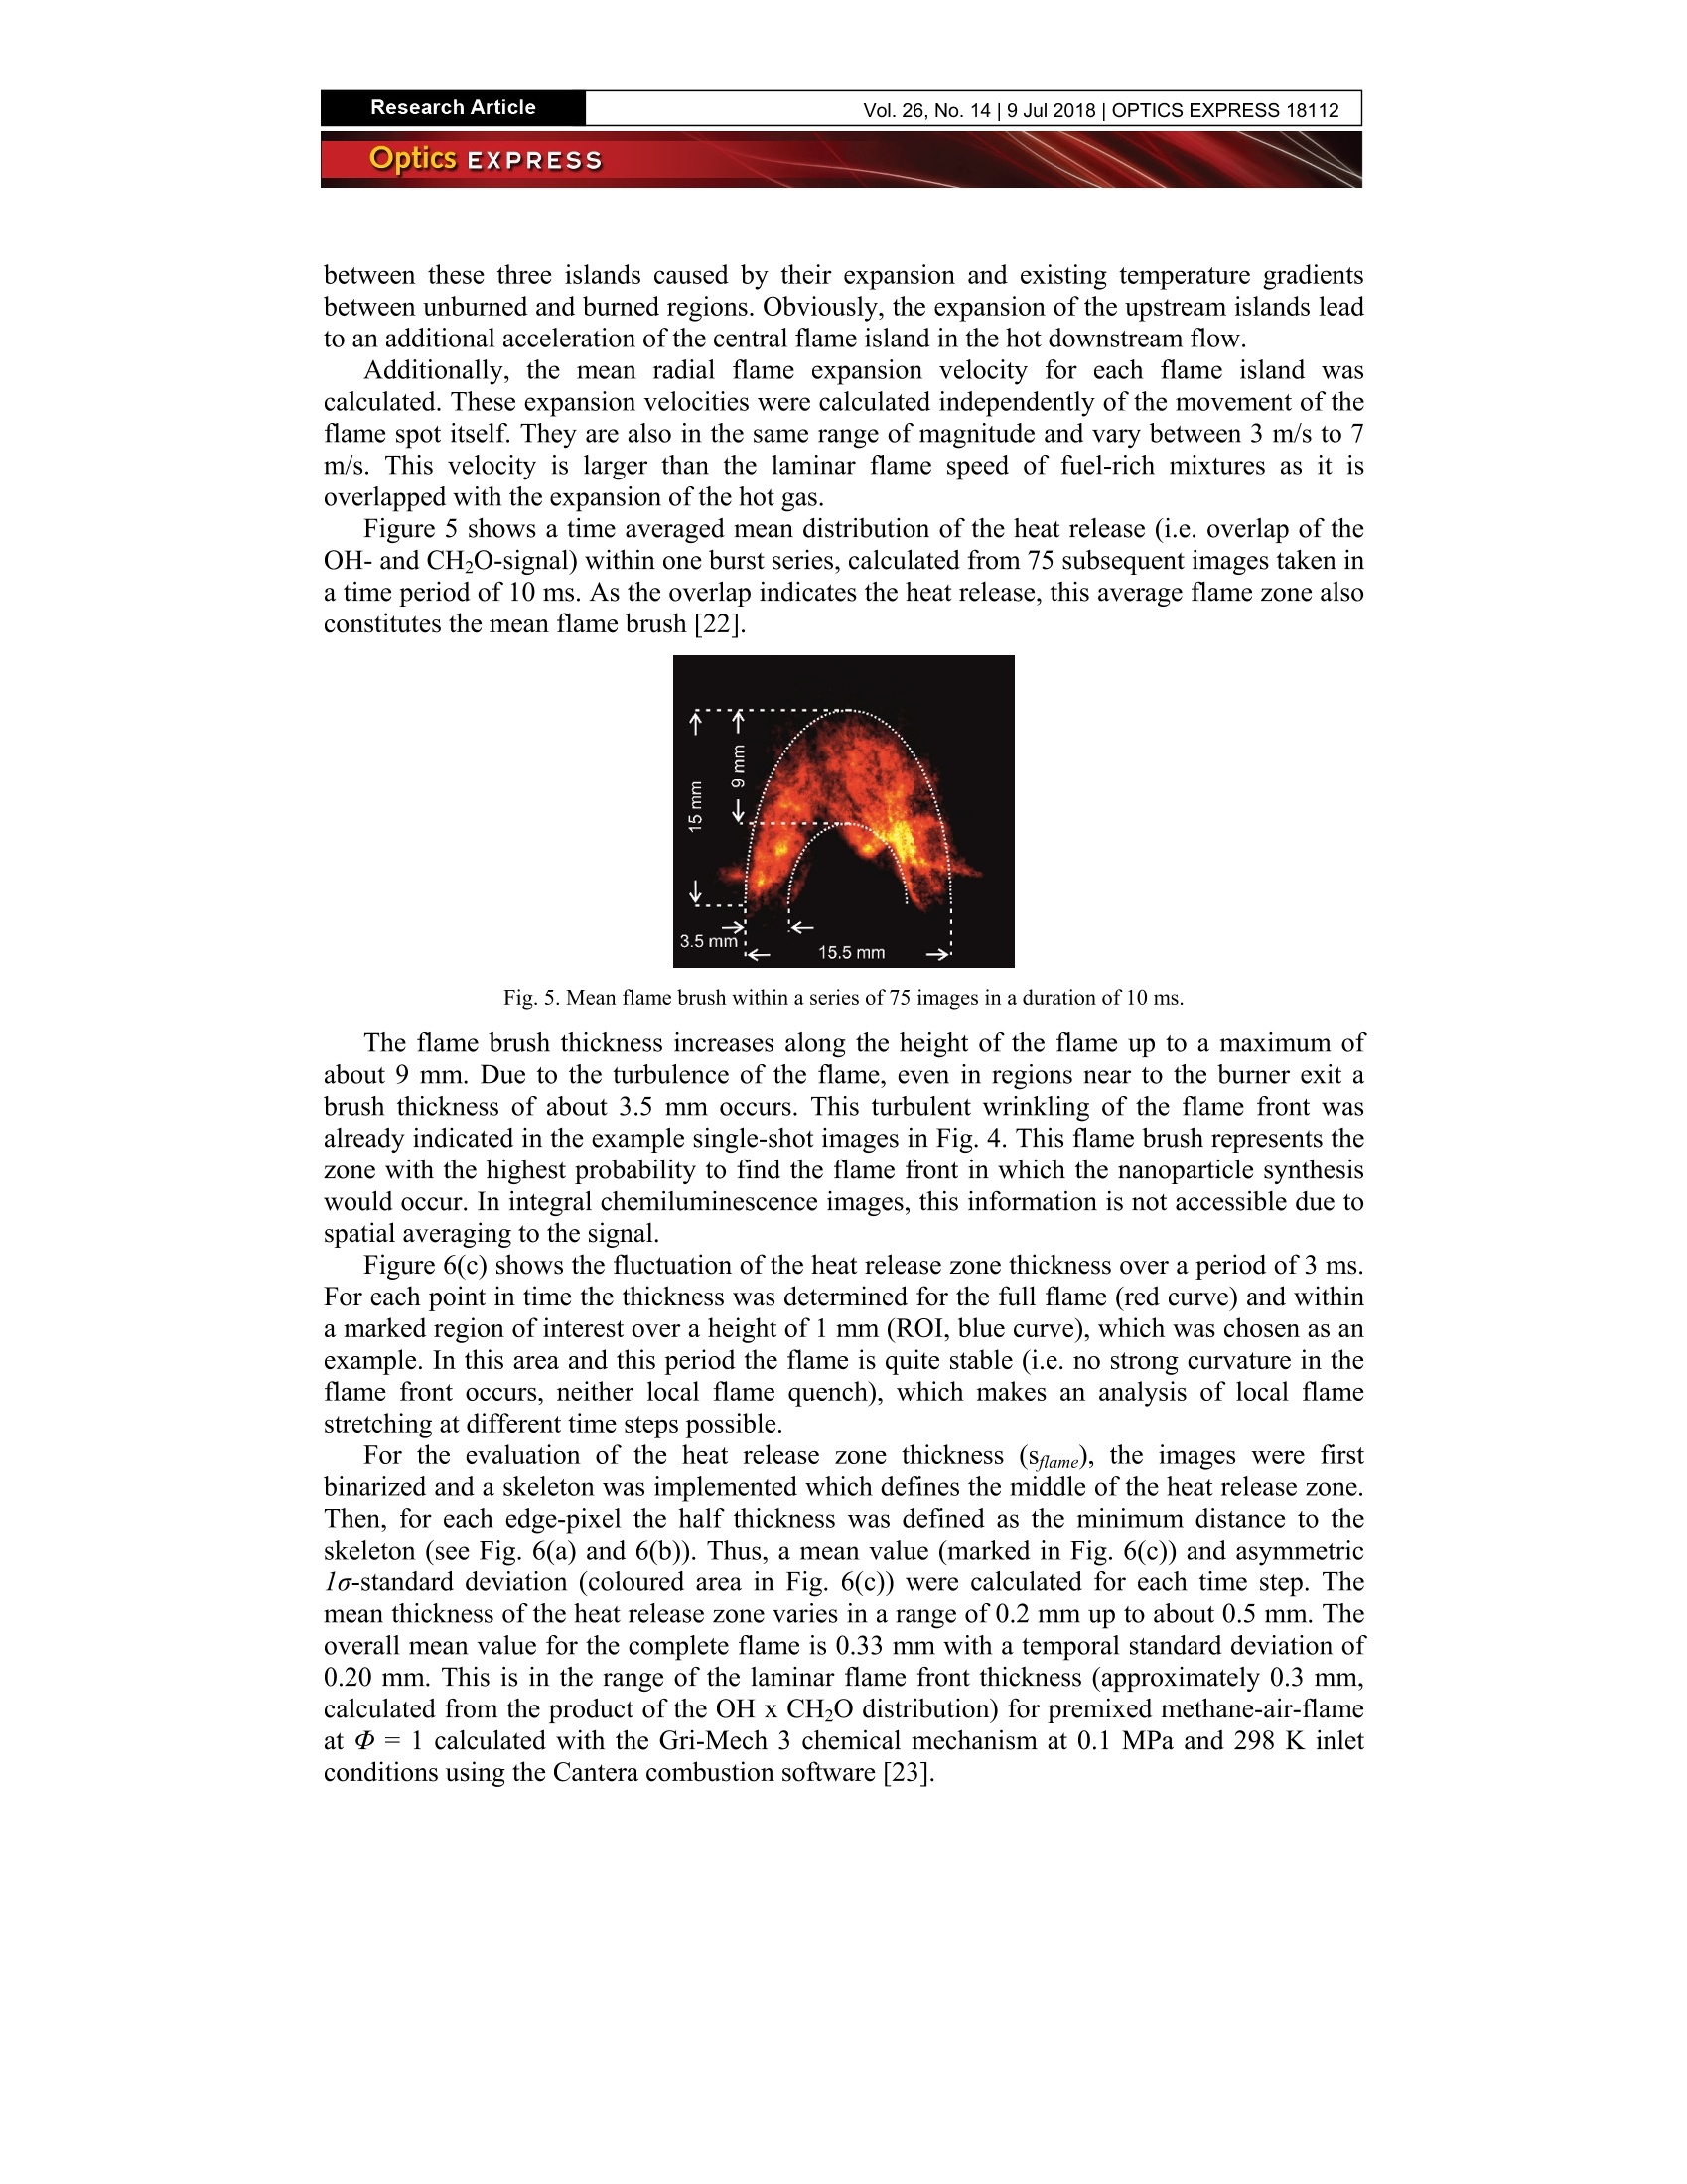
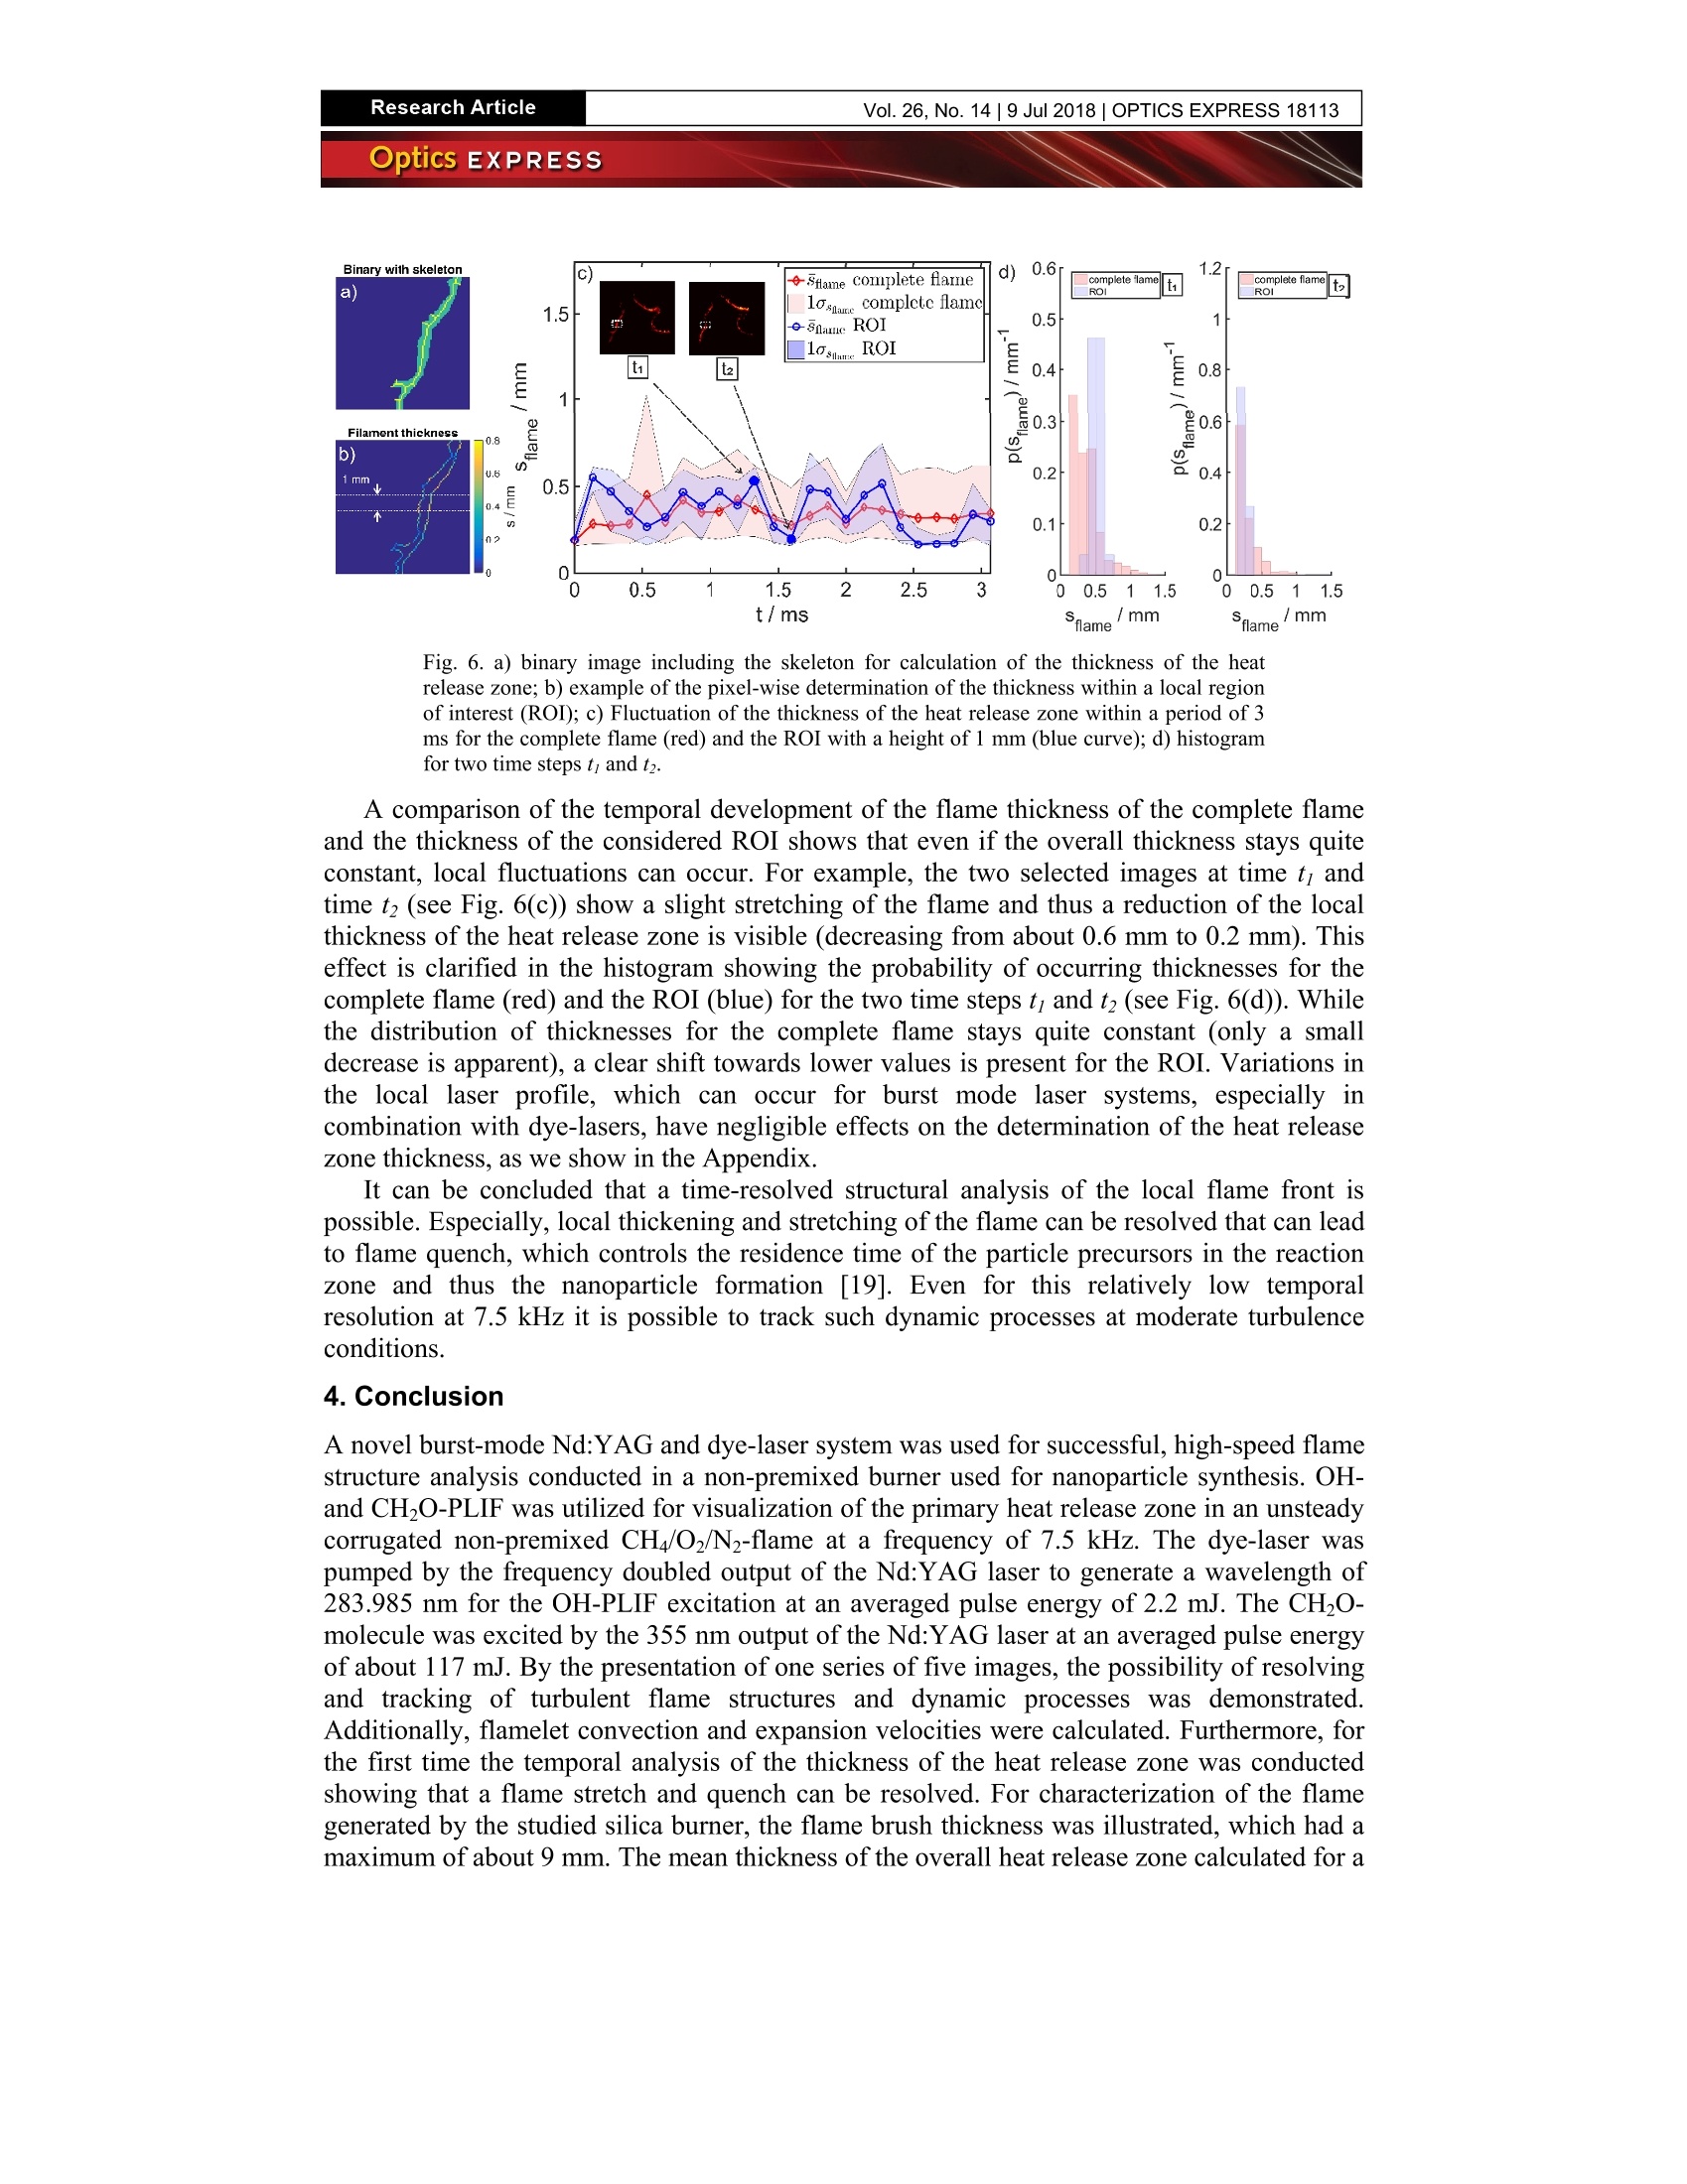
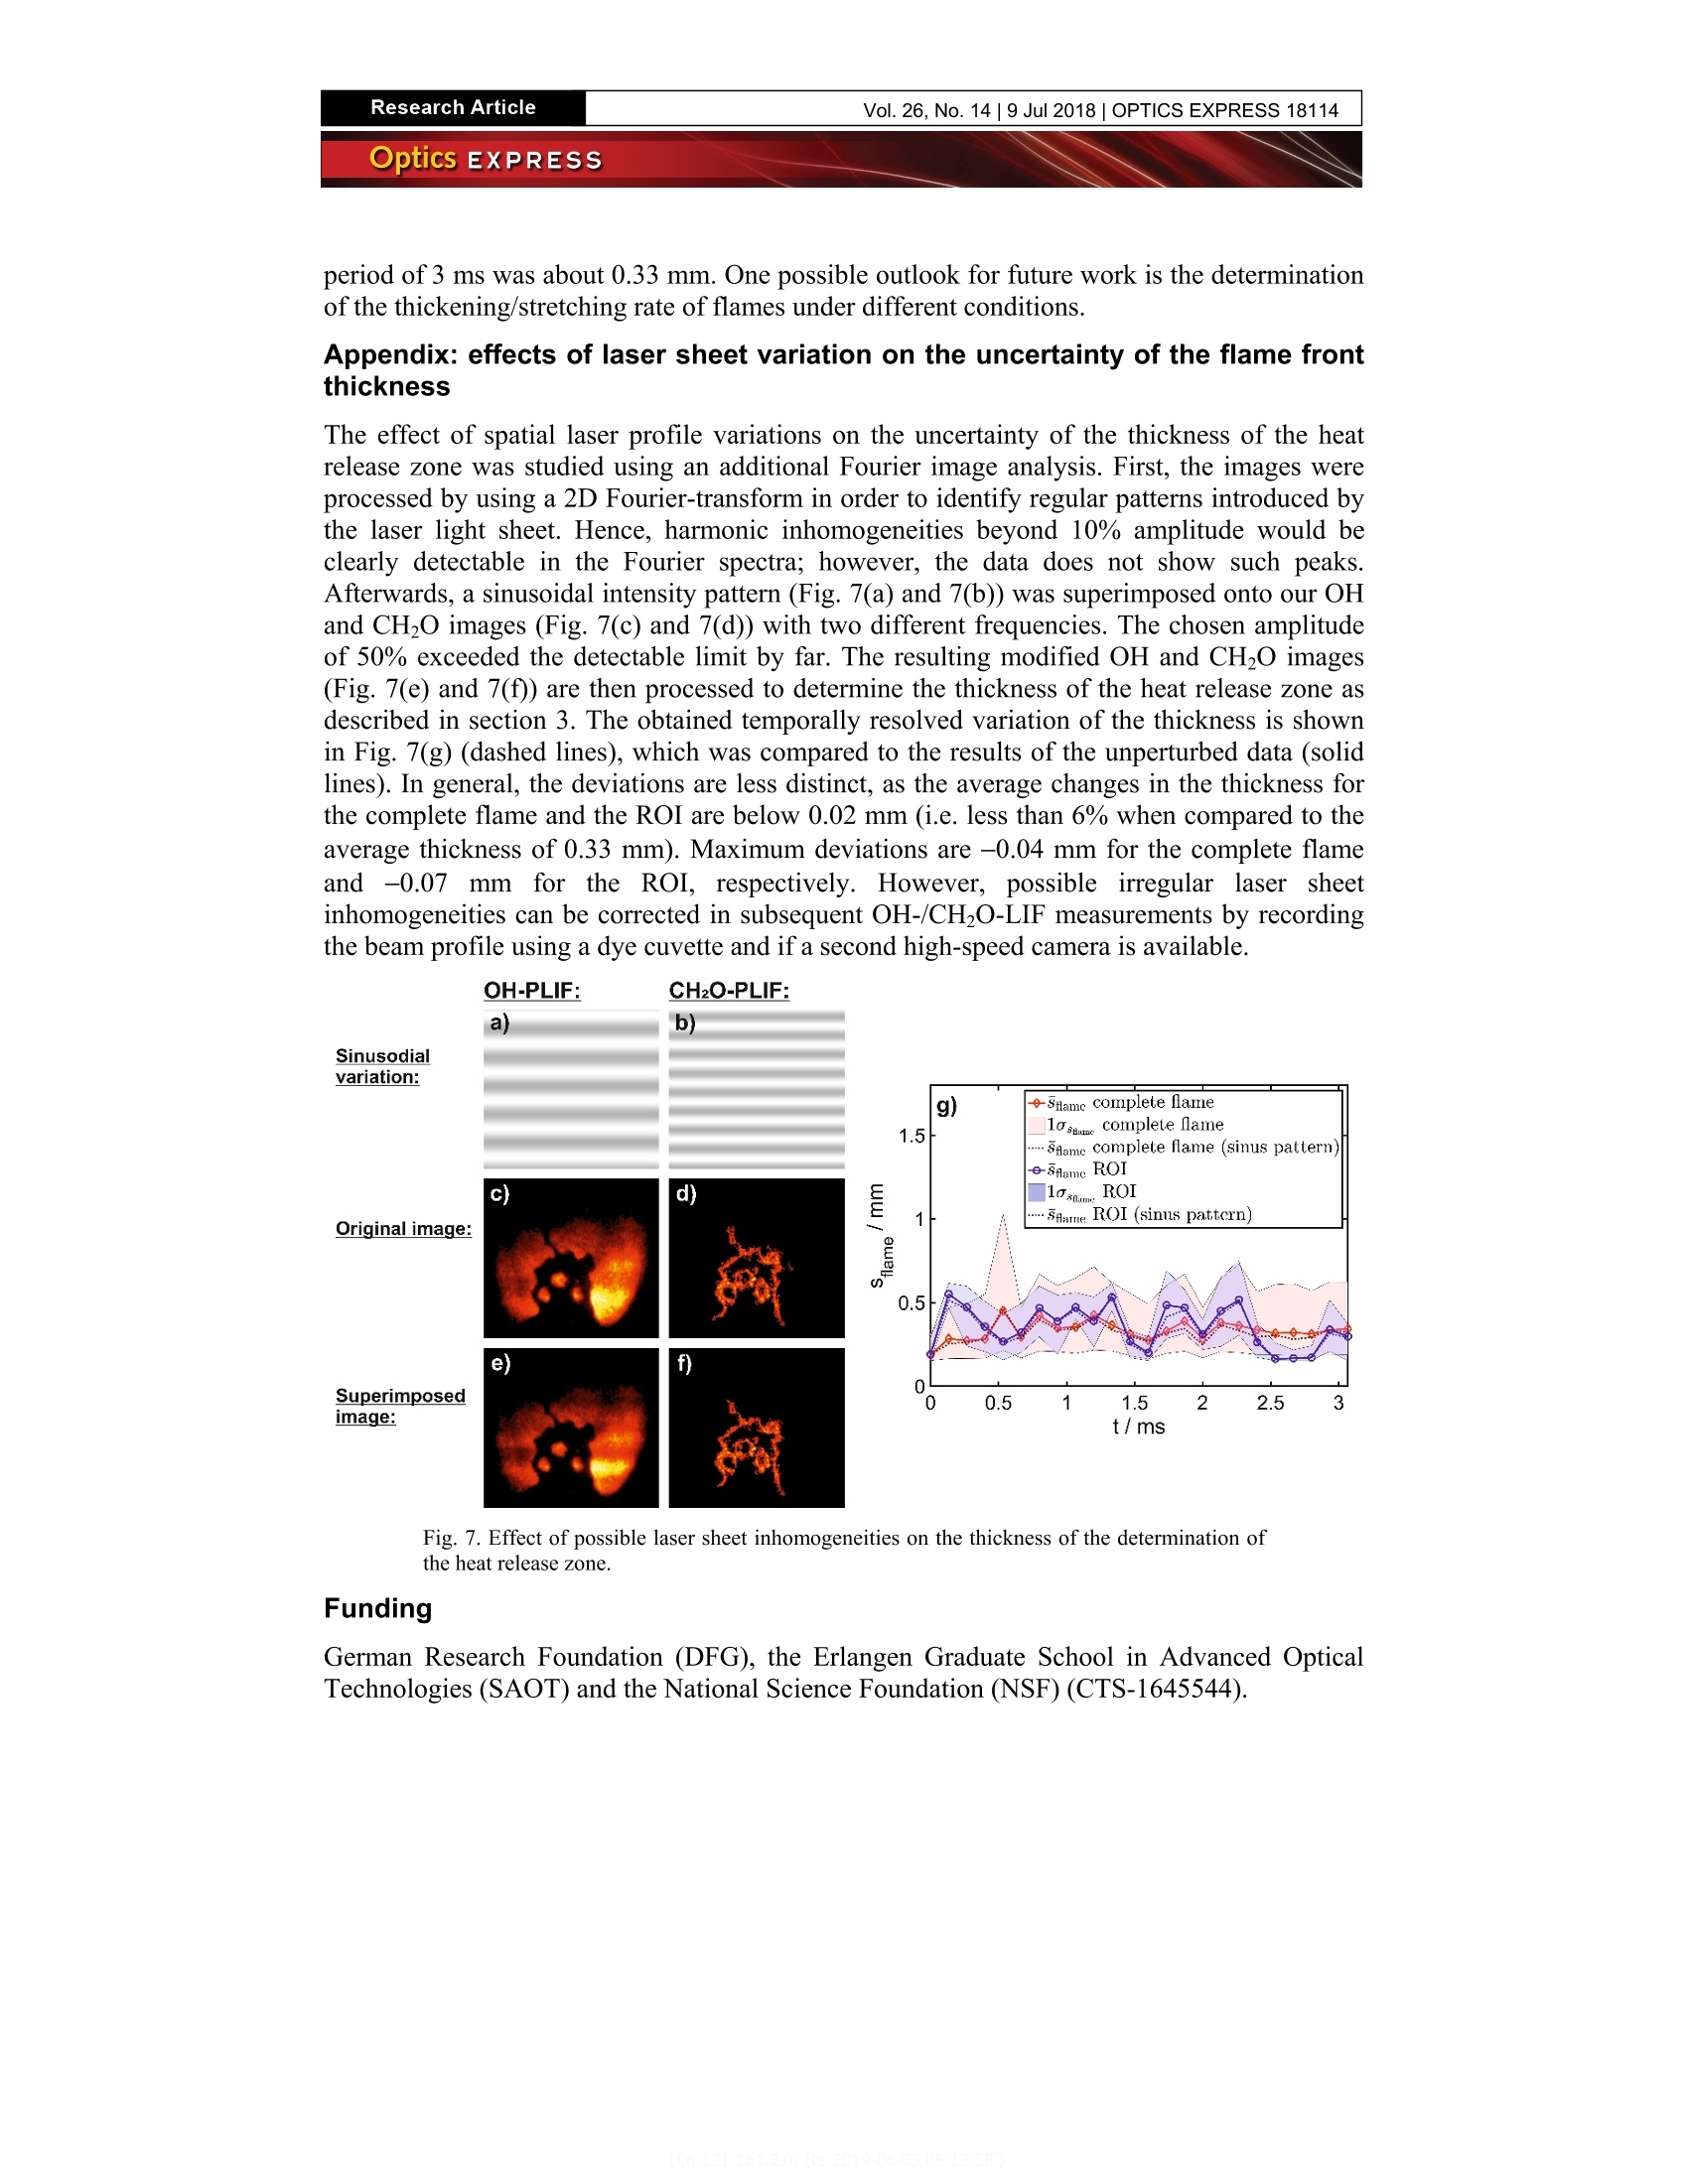
Research ArticleVol. 26,No. 14|9 Jul 2018|OPTICS EXPRESS 18105Optics EXPRESS #328048Journal C 2018https://doi.org/10.1364/OE.26.018105Received 11 Apr 2018; revised 29 May 2018; accepted 29 May 2018; published 28 Jun 2018 Burst-mode OH/CH20 planar laser-inducedfluorescence imaging of the heat release zonein an unsteady flame ULRICH RETZER, 12 RONGCHAO PAN, THOMAS WERBLINSKI,1,2 FRANZ J.T. HUBER,12 MIKHAIL N. SLIPCHENKO,’ TERRENCE R. MEYER,23LARSZiGAN, 12 AND STEFAN WILL1,2,* 'Lehrstuhl fir Technische Thermodynamik (LTT), Friedrich-Alexander-Universitait Erlangen-Niirnberg(FAU), Am Weichselgarten 8, 91058 Erlangen, GermanyErlangen Graduate School in Advanced Optical Technologies (SAOT), Friedrich-Alexander-Universitat Erlangen-Niirnberg (FAU), Paul-Gordan-StraBe 6, 91052 Erlangen, GermanySchool ofMechanical Engineering, Purdue University, 585 Purdue Mall, West Lafayette, IN 47907-2088, USAstefan.will@fau.de Abstract: The paper presents simultaneous high-speed (7.5 kHz) planar laser-inducedfluorescence (PLIF) of formaldehyde (CH2O) and the hydroxyl-radical(OH) for visualizationof the flame structure and heat release zone in a non-premixed unsteady CH4/O2/N2 flame.For this purpose, a dye laser designed for high-speed operation is pumped by the second-harmonic 532 nm output of a Nd:YAG burst-mode laser to produce a tunable, 566 nm beam.After frequency doubling a high-energy kHz-rate narrowband pulse train of approximately2.2 mJ/pulse at 283 nm is used for excitation of the OH radical. Simultaneously, CH2O isexcited by the frequency-tripled output of the same Nd:YAG laser, providing a high-frequency pulse train over 10 ms in duration at high pulse energies (>100 mJ/pulse). Theexcitation energies enable signal-to-noise ratios (SNRs) of ~10 and ~60 for CH2O and OHPLIF, respectively, using a single high-speed intensified CMOS camera equipped with animage doubler. This allows sufficient SNR for investigation of the temporal evolution of theprimary heat release zone and the local flame structure at kHz rates from the spatial overlapof the OH- and CH2O-PLIF signals. C 2018 Optical Society of America under the terms of the OSA Open Access Publishing Agreement OCIS codes: (120.1740) Combustion diagnostics; (300.2530) Fluorescence, laser-induced; (100.2960) Imageanalysis;(140.2050) Dye lasers. References and links 1.H.N. Najm,P. H. Paul, C. J. Mueller, and P. S. Wyckoff, “On the Adequacy of Certain Experimental Observables as Measurements of Flame Burning Rate,”Combust. Flame 113(3), 312-332(1998). 2. P. H. Paul and H. N. Najm, "Planar laser-induced fluorescence imaging of flame heat release rate,"Proc.Combust. Inst. 27(1), 43-50 (1998). 3. M. Roder, T. Dreier, and C. Schulz,“Simultaneous measurement of localized heat-release with OH/CH2O-LIFimaging and spatially integrated OH* chemiluminescence in turbulent swirl flames,”Proc. Combust. Inst. 34(2),3549-3556(2013). 4. S. Pfadler, F. Beyrau, and A. Leipertz, “Flame front detection and characterization using conditioned particleimage velocimetry (CPIV),”Opt. Express 15(23), 15444-15456(2007). 5. J.R. Osborne, S. A. Ramji, C. D. Carter, S. Peltier, S. Hammack, T. Lee, and A. M. Steinberg,“Simultaneous 10kHz TPIV, OH PLIF, and CH2O PLIF measurements of turbulent flame structure and dynamics,"Exp. Fluids57(5),65(2016). 6. Z. Li, J. Rosell,M. Alden, and M. Richter,“Simultaneous Burst Imaging of Dual Species Using Planar Laser-Induced Fluorescence at 50 kHz in Turbulent Premixed Flames,” Appl. Spectrosc.71(6), 1363-1367 (2017). 7. S. Bockle, J. Kazenwadel, T. kunzelmann, D.-I. Shin, C. Schulz, and J. Wolfrum, “Simultaneous single-shotlaser-based imaging of formaldehyde,OH, and temperature in turbulent flames,”Proc. Combust. Inst. 28(1),279-286(2000). 8. S. D. Hammack,C. D. Carter, A. W. Skiba, C. A. Fugger, J. J. Felver, J. D. Miller, J. R. Gord, and T. Lee,“20kHz CH2O and OH PLIF with stereo PIV,”Opt. Lett. 43(5), 1115-1118 (2018). 9. F. Altendorfner, J. Kuhl, L. Zigan, and A. Leipertz,“Study of the influence of electric fields on flames usingplanar LIF and PIV techniques,"Proc. Combust. Inst. 33(2),3195-3201(2011). 10. Z. Wang, P. Stamatoglou, Z. Li, M. Alden, and M. Richter,“Ultra-high-speed PLIF imaging for simultaneousvisualization of multiple species in turbulent flames,"Opt. Express 25(24), 30214-30228(2017). 11. J.D. Miller, M. Slipchenko, T. R. Meyer, N. Jiang, W. R. Lempert, and J. R. Gord,“Ultrahigh-frame-rate OHfluorescence imaging in turbulent flames using a burst-mode optical parametric oscillator,”Opt. Lett. 34(9),1309-1311 (2009).l(2 12. M. N. Slipchenko, J. D. Miller, S. Roy, J. R. Gord, and T.R. Meyer,“All-diode-pumped quasi-continuous burst-mode laser for extended high-speed planar imaging,”Opt. Express 21(1),681-689 (2013). 13. J. B. Michael, P. Venkateswaran, J.D. Miller, M. N. Slipchenko, J.R. Gord,S. Roy, and T. R. Meyer,“100 kHzthousand-frame burst-mode planar imaging in turbulent flames,”Opt. Lett. 39(4), 739-742 (2014). 14. K. N. Gabet, R. A. Patton, N. Jiang, W. R. Lempert, and J. A. Sutton,“High-speed CH2O PLIF imaging in turbulent flames using a pulse-burst laser system,” Appl. Phys. B 106(3), 569-575(2012).15. B. R. Halls, P. S. Hsu, N. Jiang, E. S. Legge, J. J.Felver, M. N. Slipchenko, S. Roy, T. R. Meyer, and J. R. Gord, “kHz-rate four-dimensional fluorescence tomography using an ultraviolet-tunable narrowband burst-modeoptical parametric oscillator,”Optica 4(8), 897-902 (2017). ( 16. N . Jiang, P. S. Hsu, J. G . Mance, Y. Wu, M. Gragston, Z. Zhang, J. D . M iller,J. R. Gord, and S. Roy,“High-speed 2D R a man imaging at elevated pressures,”Opt. Let t . 42(18),3678-3681 (2017). ) 17. R. Pan, U. Retzer, T. Werblinski,M. N. Slipchenko, T. R. Meyer, L. Zigan, and S. Will,“Generation of high-energy,kilohertz-rate narrowband tunable ultraviolet pulses using a burst-mode dye laser system,"Opt. Lett.43(5),1191-1194(2018). 18. N. Jiang, W. R. Lempert, G. L. Switzer, T. R. Meyer, and J. R. Gord, “Narrow-linewidth megahertz-repetition-rate optical parametric oscillator for high-speed flow and combustion diagnostics,”Appl. Opt. 47(1), 64-71(2008). 19. K. Wegner and S. E. Pratsinis,“Scale-up of nanoparticle synthesis in diffusion flame reactors,"Chem. Eng. Sci.58(20),4581-4589 (2003). 20. G. H. Dieke and H. M. Crosswhite,“The ultraviolet bands of OH Fundamental data,”J. Quant. Spectrosc.Radiat. Transf.2(2), 97-199 (1962). 21. H. Oltmann, Die Weitwinkel-Lichtstreuung zur Charakterisierung gasgetragener Nanopartikelaggregate(University of Bremen, Germany, 2013). 22. S. R. Turns, An introduction to combustion, (McGraw Hill Higher Education, 2011), Chap. 12. 23. G. P. Smith, D. M. G. M. Frenklach, N.W. Moriarty, B. Eiteneer, M. Goldenberg, C. T. Bowman, R. K. Hanson,S. Song, W. C. Gardiner, Jr., V.V. Lissianski, and Z. Qin,“GRI-MECH 3.0”http://combustion.berkeley.edu/gri-mech/. 1.Introduction Improvement of the combustion efficiency requires deep understanding of turbulentcombustion processes. For this purpose, non-intrusive, optical diagnostics are applied forstudying turbulence-flame interactions providing insights into local flame modification andquenching. This requires the spatial and temporal resolution of the flow field and flamestructures. Planar laser-induced fluorescence (PLIF) is a powerful imaging technique fordiagnostics of combustion processes providing high spatial resolution. Najm et al. [1]successfully developed the HCO-LIF technique for two-dimensional imaging of the primaryheat release zone yielding formyl radical (HCO) concentration in a premixed turbulent flame.Because of quite low signal-to-noise ratios (SNRs), however, often the indirect visualizationof the heat release zone by simultaneous CH,O-and OH-PLIF imaging is used [2-6]. Paul etal. [2] demonstrated that the product of both signals is proportional to a substantial amount ofthe actual heat release and reported the application of this diagnostic in a laminar premixedflame subject to an interaction with an isolated line-vortex pair. This technique was alsoapplied for the simultaneous measurement of spatially-resolved, single-shot heat release rate(HRR) in turbulent swirl flames [3], in v-shaped flames [4] and a non-premixed Bunsen flame[7]. Furthermore, Osborne et al. [5] demonstrated a simultaneous measurement of OH- andCH2O-PLIF at 10 kHz to study the structure and dynamics of a turbulent premixed flame byusing conventional high repetition rate Nd:YAG laser and dye laser systems. Comparativelylow pulse energies at 283 nm of ~200 uJ may result in a poor OH-PLIF SNR, which makes aprecise structural observation of the turbulent flame front challenging. Additionally, at highpressure an inherent fluorescence signal loss occurs due to molecular collisions. Thus, a highlaser pulse energy from a powerful pump laser is required for high-speed PLIF of OH.However, in [5] the pulse energy at 355 nm for excitation of CHO was just about 1.6 mJ after sheet formation and only very low SNR of 2.6 to 5.6 could be reached. In a recent studyby Hammack et al. [8] a burst laser system was used for CH2O-PLIF (90 mJ) while OH-PLIFwas conducted by using a DPSS laser (Edgewave) and a Sirah Credo Dye laser with relativelylow pulse energy (0.09 mJ) at 20 kHz. For comparison, high output pulse energies at 283 nm(>10 mJ) were achieved at relatively low repetition rates (~10 Hz) using conventional pumpand dye laser systems for OH-PLIF. For example, a study by Altendorfner et al. [9] ofOH-PLIF in a laminar Bunsen flame was conducted with a laser light sheet of 30 mm× 0.2 mm.The output of the dye laser at 283 nm was 12 mJ/pulse (operated at 10 Hz) corresponding to afluence of 200 mJ/cm. In the same study, for CH2O-PLIF, a laser power of 270 mJ/pulse wasapplied (the light sheet was 30 mm ×0.25 mm) resulting in a fluence of 3.6 J/cm. More recently, Li et al. [6] presented simultaneous multi-species PLIF visualization at 50kHz for the investigation of a turbulent premixed flame. In that work, a multi-YAG lasersystem is used for CH2O-PLIF at 355 nm, and another part of the 355 nm beam was forpumping an optical parametric oscillator (OPO) employed for OH-PLIF. The number of lasershots in a time sequence, however, is usually limited to four double-pulses for such a multi-YAG laser system. Because of this limitation, Wang et al. [10] utilized a burst-mode OPOlaser system with pulse energies of 0.35 mJ at 283.9 nm and 6 mJ at 355 nm to generatelonger OH/CH2O image sequences detected using two high-speed intensified CMOS cameras.To the best of our knowledge, only these three publications report simultaneous OH- andCH2O-PLIF at kHz-repetition rates [5, 6, 10], although SNRs did not appear to be sufficientfor reporting the product of OH- and CHzO-PLIF signals to track the primary heat releasezone. Modern Nd:YAG based burst-mode laser systems offer high repetition rates at high pulseenergies over a certain time interval. The combination of high energy and fast repetition ratesoffers unique possibilities for linear and nonlinear spectroscopic measurements in harshreacting-flow environments [11-16]. In combination with ultra-narrowband dye-lasers foraccessing new emission wavelengths, these systems can be used for flame front detection,especially if moderate pump energies are available and repetition rates up to 20 kHz aresufficient. Compared to laser-pumped OPOs, better conversion efficiencies are typicallyreported using dye lasers, which readily deliver narrowband, broadly tunable pulses forefficient excitation of a wide range of species. Using the frequency-doubled output of a dyelaser designed for high-speed operation, an energy of more than 2.2 mJ/pulse at 283 nm ispossible. This is a factor of 3 higher in overall efficiency than burst-mode OPOs reported atsimilar wavelengths [6, 11, 17, 18], which allows more of the energy from the source laser tobe utilized for simultaneous excitation of other species. This energy is also an order ofmagnitude higher as compared to continuously pulsed high-repetition rate dye laser systems[5]. In our previous work [17], the effects of repetition rate, pump energy, and dyeconcentration on the dye-laser’s output conversion efficiency and pulse-to-pulse stability at283 nm were discussed in detail. In this work, we use the frequency-doubled Nd:YAG burst-mode laser to pump thecustom dye laser system for generation of 283 nm employed for OH-PLIF. Simultaneously,the same Nd:YAG burst mode laser is applied for CHzO-PLIF using the tripled output at 355nm. The higher pulse energies and narrowband nature of the burst-mode dye laser can enablemuch higher SNR as compared with prior work [5, 6, 10], providing an order of magnitudeimprovement in the SNR and enabling visualization of the heat release zone andcharacterization of the local flame structure at high repetition rates. The setup is employed forhigh-speed visualization of the heat release in an unsteady corrugated CH4/O2/N2 co-flowflame by simultaneous detection of the OH- and CH2O-PLIF signal using a single high-speedintensified camera with an image-doubling system. Such burners are favourably used fornanoparticle synthesis (flame pyrolysis) [19]. The non-premixed flame is produced by twoco-flows that contains the fuel (CH4, central pipe) and oxidizer flow (O2/Nz-mixture)surrounding the inner flow that contains the precursor for nanoparticle formation. The Research Article Vol. 26, No. 14|9 Jul 2018|OPTICS EXPRESS 18108 Optics EXPRESs velocity difference of the fuel and oxygen jets is a key parameter determining reactant mixingand flame quenching and, thus, the average primary particle diameter in such particle-producing flames [19]. However, the local processes in the flame front and their impact onparticle generation are still unresolved and especially the interaction of the flow and the flameneed to be studied. The time-resolved measurement of the local flame front thickness andcurvature would provide new insight into local flame quenching and re-ignition processes.For this purpose, we evaluate the possibility of resolving and tracking turbulent flamestructures and dynamic processes such as flame stretch and quenching by capturing thethickness of the heat release zone using high-speed OH- and CH2O-PLIF. In addition it wasof interest to determine if flamelet convection and expansion velocities could be calculated bytracking the turbulent flame structure. 2.Experimental setup The burst-mode dye-laser system, as shown in Fig. 1(a), has been described in detail in ourprevious work [17], and thus, only a brief description is provided here. This laser systemconsists of a customized dye-laser (Radiant Dyes Laser, NarrowScan HighRep) operated withRhodamine 6G (Rh6G) that is pumped by the second harmonic of the burst-mode Nd:YAGlaser (Spectral Energies, QuasiModo) to emit at 355 nm and 283 nm. a) Fig. 1. a) Experimental setup for simultaneous OH- and CH2O-PLIF. OC: oscillator cell, AC:amplifier cell, F1: bandpass filter BP 435/40, F2: bandpass filter BP 320/40; Energydistribution in the burst for 75 pulses at 7.5 kHz for (b) 355 nm and (c) 283 nm, MV: meanvalue. The laser system is operated in burst mode at 7.5 kHz, although the maximum pulserepetition rate (PRR) is 20 kHz, limited by the flow rate of the dye through the dye cell [17].Each burst has a duration of 10 ms, leading to a total number of 75 pulses within one burst.The individual pulse duration of the Nd:YAG laser at 532 nm is 10 ns, with a maximum burstenergy output of ~10 J at 532 nm and ~8.8 J at 355 nm. A time separation of 8 s between twobursts is necessary to avoid damaging the three-staged amplification system of the Nd:YAGlaser due to overheating. The dye laser, specifically designed for the use with the presentburst-mode pump laser, is based on an oscillator design with a narrow linewidth (0.05 cm-at283 nm). To increase the laser power, the output beam from the oscillator is sent furtherthrough two amplifying dye cells. The basic optical setup of the dye laser contains features ofconventional 10 Hz high laser power systems and kHz low peak-power systems. For excitingthe Qi(6) line of the OH radical in the A’2-XII (1-0) band, a wavelength of 283 nm isnecessary [20]. For this purpose, a dye solution consisting of Rh6G dissolved in ethanol iscirculated through the oscillator cell (OC) and the first amplifier cell (1st AC). The Rh6G dyeis excited by the Nd:YAG laser at 532 nm and its emission can cover the broadband rangefrom 554 nm to 585 nm. Wavelength selective optics separate the desired wavelength of 566 Research Article Vol.26,No. 14|9 Jul 2018|OPTICS EXPRESS 18109 Optics EXPRESS nm from the rest of the emission spectrum and generate a spectrally narrow laser beam (0.05cm), which is amplified in two dye amplifiers. A frequency-doubling unit consisting of atemperature stabilized beta-barium borate (BBO) crystal converts the 566 nm signal to theneeded wavelength of 283 nm. A fine-tuning of the wavelength to 282.985 nm is carried outto receive the maximum OH-PLIF signal intensity. In Fig. 1 (right), the stability of the pulseenergy in the burst is shown for the two excitation frequencies applied. For this purpose, werecorded the individual pulse energy at 283 nm and 355 nm over 10 ms for PRR of 7.5 kHz(75 pulses/burst). The burst energies at 355 nm and 283 nm were measured using a powerdetector (Gentec, UP50N). The data were recorded with a digital oscilloscope with 10 GS/ssingle-shot sample rate (LeCroy, wavepro 7300A) and normalized to the mean pulse energyof each burst. Due to the narrow range of temperatures and species in the heat release zone,no corrections were made for quenching or Boltzmann fraction distributions [3]. The overall burst energy uniformity across the burst train at a repetition rate of 7.5 kHzwas analysed from the measured burst profile, as shown in Fig. 1(b) and 1(c). At 355 nm (Fig.1(b)), an overall uniformity of 4% is achieved, while at 283 nm (Fig.1(c)) the uniformity inthe range of 8% to 10% is achieved. For quantitative measurements, these profiles can beused for correction of pulse-to-pulse fluctuations. To form the light sheets for both laser wavelengths (h=25 mm, FWHM ~0.5 mm) twolenses with f=310 nm andf= 1000 nm are used. The crossing angle of the two laser sheetswas 0.6°. A high-speed CMOS camera (Vision Research, Phantom V711, UV-Nikkor 105mm lens) equipped with an intensifier (GIIB, HS CU) combined with an image doubler(LaVision) collects both PLIF signals through different spectral channels. One channelequipped with a bandpass filter BP 320/40 (“F2”) is utilized for collection of the OH-PLIFsignal. The second channel equipped with a bandpass filter BP 435/40(“F1”) is used fordetection of CHO-PLIF. For sufficient suppression of the elastically scattered light, anadditional longpass filter LP 355 is used in CH2O-PLIF channel. The maximum image formatof the camera is 1280 × 800 pixels at 7.5 kHz repetition rate.High-speed CHO- and OH-PLIF was applied to study the structure of flames produced by a“silica burner”, which is usedfor SiOz-nanoparticle synthesis (flame pyrolysis) [21]. Such co-flow burners usually consistof three concentrically arranged tubes [19]. The innermost cylinder is used to deliver thevaporized precursor (for SiOz-production: HMDSO -hexamethyldisiloxane) which is mixedwith nitrogen. This precursor-nitrogen mixture is transported downstream to the flame zone,in which the nanoparticles are formed during pyrolysis. The flame is a non-premixed flame,which is produced by two co-flows that contain the fuel (CH4, central pipe) and oxidizer flow(O2/N2-mixture), respectively. This co-flow burner was chosen to generate an unsteady corrugated non-premixedCH4/O2/N2-flame for this first proof of principle study. For flame structure characterization,the first experiments were conducted without precursor for nanoparticle generation. The setupof the silica burner is shown schematically in Fig. 2. Fig. 2. Sketch of the silica-burner. left: side view, right: enlarged top view. In the inner and the outer tube, an oxygen/nitrogen mixture with a total volume flow of 4l/min of oxygen and 8 lw/min of nitrogen is adjusted. All gas flows are controlled by massflow controllers (Bronkhorst, EL-Flow Select) and are at ambient temperature. The methane Research Article Vol. 26, No. 14|9 Jul 2018|OPTICS EXPRESS 18110 Optics EXPRESS jet is generated by the tube in between with a volume flow of 3 1 /min. These volume flowslead to a Reynolds number of about 1800 for the inner tube flow, 450 for the outer tube flow,275 for the methane flow and to an equivalence ratio (dD) of 1.5. For processing of the images acquired by the utilization of the image doubler, anautomated mapping function was created using a geometric warping algorithm. Thisalgorithm was applied to a target image with 10 ×10 defined circles on it, providing asuperposition of all circle centres. Afterwards, these positions were used for mapping bothPLIF channels. For a sufficiently large CH2O-PLIF signal, high intensifier amplifying voltagewas necessary even at relatively high pulse energies of about 100 mJ/pulse. This leads tonoisy artefacts in the background of the image (see Fig.3(a)). To separate the actual signalfrom the noise, first a threshold value was applied to obtain a binarized image (Fig.3(b)).Subsequently, an algorithm was applied to separate areas of the main CH2O-signal (apparentin the preheat zone and flame front) and small areas of connected pixels (that are related tonoise) (Fig. 3(c) and 3(d)). The corrected image in Fig.3(d) results from the multiplication ofthe original image (a) with the mask (image c). Fig. 3. Procedure of separation between noise and CHO-PLIF signal, including a) originalimage, b) binarized image, c) mask, and d) corrected image. 3. Results and discussion Figure 4 shows one series of simultaneously recorded, normalized, single-shot CH0- andOH-PLIF images of the CH4/O2/N -flame. Additionally, the pixel-wise product of both PLIFsignals, which correlates to the heat release rate [1], is illustrated in the bottom row.Sufficiently high pulse energy (117 mJ/pulse at 355 nm, 2.2 mJ/pulse at 283 nm) is providedfor simultaneous excitation of the OH-radical and CHO-molecule. The median SNRs insingle shot images were approx. 10 (CH2O-PLIF) and 60 (OH-PLIF), respectively, which ishigher than for conventional high-speed Nd:YAG pumped dye-lasers. For example, in [5] asignal-to-background of 2.6 to 5.6 for CHO-PLIF at 1.6 mJ/pulse was specified. This alsocompares favorably with SNRs of 3 and 10 for CHO and OH PLIF, respectively, reported inprior work at low repetition rates [3]. For the computation of the SNR the raw images werefirst smoothed by a Savitzky-Golay-filter with a width of 5, afterwards those smoothedimages were subtracted from the raw data to obtain the noise. Then an average standarddeviation within a 3x 3 region around each pixel-noise is calculated, serving as the level ofnoise for this pixel. Finally, the pixel-wise SNR is computed as the ratio of the smoothedimage and the noise-level image, allowing for the calculation of the median SNRs statedabove. The Savitzky-Golay-filter was only used for calculating the SNR and not for furtherimage processing. The original projected area onto a pixel was 77 um/pixel, which issufficient for resolving large-scale turbulent flame structures. As the measurements wereexecuted at 7.5 kHz, the time between two subsequent images is 133 us. It should be notedthat the images were not corrected regarding inhomogeneity of the beam profile, although itseffects are evaluated and do not significantly alter the reported measurements (see Appendix).Light-sheet optimization using beam homogenizers as used in [9] is not applicable due to theloss in laser energy that would result in a significantly reduced SNR. As the pulse-to-pulsevariation of the laser is known (see Fig. 1(b) and 1(c)) it can be used to correct the PLIFimages. Research Article Vol. 26,No.14|9 Jul 2018|OPTICS EXPRESS 18111 The OH-PLIF signal is formed in the flame front and increases towards the post-oxidationzone. In larger distances further downstream from the flame, the OH-PLIF signal is reducedagain because of consumption ofthe OH-radical due to reduced temperature and dilution withambient gas. The formaldehyde molecule is formed in the preheat zone upstream the reactionzone. When the main reaction takes place, CH2O is consumed. Therefore, the detected CH2O-PLIF signal appears in a thin region close to the reaction zone. By multiplication of bothsignals, the primary heat release is illustrated as the very sharp region where both the OH-radical and the CHO-molecule occur [2-4]. Fig. 4. Series of PLIF images at 7.5 kHz. top row: CHO-PLIF, center row: OH-PLIF, bottomrow: primary heat release. The images are normalized to their maximum value. Despite the relatively low Reynolds numbers, the flame appears strongly wrinkled andcorrugated. Furthermore, the development of three smaller turbulent flame structures(“islands”or“pockets”) in the unburned region is visible due to the strong wrinkling of theflame front. The formation of such pockets is a repetitive phenomenon. In position A) (seeImage 1) a small spot is visible mainly in the CHzO-PLIF image, but only low OH-PLIFsignal present. In position B) (Image 2) the OH-signal is increased which involves aconsumption of the formaldehyde in the middle of each of the three flame spots. Thesephenomena are somewhat more pronounced in the following images (3-4). Here, where bothsignals are present, the main reaction takes place and the heat release can be calculated. InImage 5, the CHO-PLIF signal is reduced as the three spots start to merge. A similarphenomenon is marked in positions C) and D) at the flame tip, where a flame expansion isvisible leading to local flame quench (Column 4). The structural changes of the heat releasezone will be described in more detail in Fig. 5 and Fig. 6. The convection velocity of the flame spots mentioned above (see Fig. 4, Columns 2-4) indownstream direction (y-axis) is calculated. For this purpose, the three spots were firstseparated from the remaining flame and were binarized using the OH-PLIF images. Then, thecentroid point of each spot (A, B, C) in each image can be determined. The convectionvelocity of the “left” flame island increases in these images from 3.5 m/s to 4.8 m/s, which issimilar to the “right”flame island (3.5 m/s 4.6 m/s). As expected, the convection velocity ofthese islands has the same range of magnitude as the theoretical average flow velocity at theexit of the burner (5.35 m/s). For the “central”flamelet, the velocity of around 9.7 m/s-10.3m/s is much higher than the flow velocity at the burner exit. This could be due to interactions Research Article Vol.26, No. 14|9 Jul 2018|OPTICS EXPRESS 18112 Optics EXPRESS between these three islands caused by their expansion and existing temperature gradientsbetween unburned and burned regions. Obviously, the expansion of the upstream islands leadto an additional acceleration of the central flame island in the hot downstream flow. Additionally, the mean radial flame expansion velocity for each flame island wascalculated. These expansion velocities were calculated independently of the movement of theflame spot itself. They are also in the same range of magnitude and vary between 3 m/s to 7m/s. This velocity is larger than the laminar flame speed of fuel-rich mixtures as it isoverlapped with the expansion of the hot gas. Figure 5 shows a time averaged mean distribution of the heat release (i.e. overlap of theOH- and CH2O-signal) within one burst series, calculated from 75 subsequent images taken ina time period of 10 ms. As the overlap indicates the heat release, this average flame zone alsoconstitutes the mean flame brush [22]. Fig. 5. Mean flame brush within a series of 75 images in a duration of 10 ms. The flame brush thickness increases along the height of the flame up to a maximum ofabout 9 mm. Due to the turbulence of the flame, even in regions near to the burner exit abrush thickness of about 3.5 mm occurs. This turbulent wrinkling of the flame front wasalready indicated in the example single-shot images in Fig. 4. This flame brush represents thezone with the highest probability to find the flame front in which the nanoparticle synthesiswould occur. In integral chemiluminescence images, this information is not accessible due tospatial averaging to the signal. Figure 6(c) shows the fluctuation of the heat release zone thickness over a period of 3 ms.For each point in time the thickness was determined for the full flame (red curve) and withina marked region of interest over a height of 1 mm (ROI, blue curve), which was chosen as anexample. In this area and this period the flame is quite stable (i.e. no strong curvature in theflame front occurs, neither local flame quench), which makes an analysis of local flamestretching at different time steps possible. For the evaluation of the heat release zone thickness (Sglame), the images were firstbinarized and a skeleton was implemented which defines the middle of the heat release zone.Then, for each edge-pixel the half thickness was defined as the minimum distance to theskeleton (see Fig. 6(a) and 6(b)). Thus, a mean value (marked in Fig. 6(c)) and asymmetriclo-standard deviation (coloured area in Fig. 6(c)) were calculated for each time step. Themean thickness of the heat release zone varies in a range of 0.2 mm up to about 0.5 mm. Theoverall mean value for the complete flame is 0.33 mm with a temporal standard deviation of0.20 mm. This is in the range of the laminar flame front thickness (approximately 0.3 mm,calculated from the product of the OH x CH2O distribution) for premixed methane-air-flameat d=1 calculated with the Gri-Mech 3 chemical mechanism at 0.1 MPa and 298 K inletconditions using the Cantera combustion software [23]. Fig. 6. a) binary image including the skeleton for calculation of the thickness of the heatrelease zone; b) example of the pixel-wise determination of the thickness within a local regionof interest (ROI); c) Fluctuation of the thickness of the heat release zone within a period of 3ms for the complete flame (red) and the ROI with a height of 1 mm (blue curve); d) histogramfor two time steps ty and t2. A comparison of the temporal development of the flame thickness of the complete flameand the thickness of the considered ROI shows that even if the overall thickness stays quiteconstant, local fluctuations can occur. For example, the two selected images at time t andtime t2 (see Fig. 6(c)) show a slight stretching of the flame and thus a reduction of the localthickness of the heat release zone is visible (decreasing from about 0.6 mm to 0.2 mm). Thiseffect is clarified in the histogram showing the probability of occurring thicknesses for thecomplete flame (red) and the ROI (blue) for the two time steps t and t2 (see Fig. 6(d)). Whilethe distribution of thicknesses for the complete flame stays quite constant (only a smalldecrease is apparent), a clear shift towards lower values is present for the ROI. Variations inthe local laser profile, which can occur for burst mode laser systems, especially incombination with dye-lasers, have negligible effects on the determination of the heat releasezone thickness, as we show in the Appendix. It can be concluded that a time-resolved structural analysis of the local flame front ispossible. Especially, local thickening and stretching of the flame can be resolved that can leadto flame quench, which controls the residence time of the particle precursors in the reactionzone and thus the nanoparticle formation [19]. Even for this relatively low temporalresolution at 7.5 kHz it is possible to track such dynamic processes at moderate turbulenceconditions. 4. Conclusion A novel burst-mode Nd:YAG and dye-laser system was used for successful, high-speed flamestructure analysis conducted in a non-premixed burner used for nanoparticle synthesis. OH-and CH2O-PLIF was utilized for visualization of the primary heat release zone in an unsteadycorrugated non-premixed CH4/O2/N2-flame at a frequency of 7.5 kHz. The dye-laser waspumped by the frequency doubled output of the Nd:YAG laser to generate a wavelength of283.985 nm for the OH-PLIF excitation at an averaged pulse energy of 2.2 mJ. The CHO-molecule was excited by the 355 nm output of the Nd:YAG laser at an averaged pulse energyof about 117 mJ. By the presentation of one series of five images, the possibility of resolvingand tracking of turbulent flame structures and dynamic processes was demonstrated.Additionally, flamelet convection and expansion velocities were calculated. Furthermore, forthe first time the temporal analysis of the thickness of the heat release zone was conductedshowing that a flame stretch and quench can be resolved. For characterization of the flamegenerated by the studied silica burner, the flame brush thickness was illustrated, which had amaximum of about 9 mm. The mean thickness of the overall heat release zone calculated for a Research Article Vol. 26,No. 14 |9 Jul 2018|OPTICS EXPRESS 18114 Optics EXPRESS period of 3 ms was about 0.33 mm. One possible outlook for future work is the determinationof the thickening/stretching rate of flames under different conditions. Appendix: effects of laser sheet variation on the uncertainty of the flame frontthickness The effect of spatial laser profile variations on the uncertainty of the thickness of the heatrelease zone was studied using an additional Fourier image analysis. First, the images wereprocessed by using a 2D Fourier-transform in order to identify regular patterns introduced bythe laser light sheet. Hence, harmonic inhomogeneities beyond 10% amplitude would beclearly detectable in the Fourier spectra; however, the data does not show such peaks.Afterwards, a sinusoidal intensity pattern (Fig. 7(a) and 7(b)) was superimposed onto our OHand CH2O images (Fig. 7(c) and 7(d)) with two different frequencies. The chosen amplitudeof 50% exceeded the detectable limit by far. The resulting modified OH and CH2O images(Fig.7(e) and 7(f)) are then processed to determine the thickness of the heat release zone asdescribed in section 3. The obtained temporally resolved variation of the thickness is shownin Fig. 7(g) (dashed lines), which was compared to the results of the unperturbed data (solidlines). In general, the deviations are less distinct, as the average changes in the thickness forthe complete flame and the ROI are below 0.02 mm (i.e. less than 6% when compared to theaverage thickness of 0.33 mm). Maximum deviations are -0.04 mm for the complete flameand -0.07mm for the ROI, respectively. However, possible irregular laser sheetinhomogeneities can be corrected in subsequent OH-/CH2O-LIF measurements by recordingthe beam profile using a dye cuvette and if a second high-speed camera is available. Fig. 7. Effect of possible laser sheet inhomogeneities on the thickness of the determination ofthe heat release zone. Funding German Research Foundation (DFG), the Erlangen Graduate School in Advanced OpticalTechnologies (SAOT) and the National Science Foundation (NSF) (CTS-1645544). The paper presents simultaneous high-speed (7.5 kHz) planar laser-inducedfluorescence (PLIF) of formaldehyde (CH2O) and the hydroxyl-radical (OH) for visualizationof the flame structure and heat release zone in a non-premixed unsteady CH4/O2/N2 flame.For this purpose, a dye laser designed for high-speed operation is pumped by the secondharmonic532 nm output of a Nd:YAG burst-mode laser to produce a tunable, 566 nm beam.After frequency doubling a high-energy kHz-rate narrowband pulse train of approximately2.2 mJ/pulse at 283 nm is used for excitation of the OH radical. Simultaneously, CH2O isexcited by the frequency-tripled output of the same Nd:YAG laser, providing a highfrequencypulse train over 10 ms in duration at high pulse energies (>100 mJ/pulse). Theexcitation energies enable signal-to-noise ratios (SNRs) of ~10 and ~60 for CH2O and OHPLIF, respectively, using a single high-speed intensified CMOS camera equipped with animage doubler. This allows sufficient SNR for investigation of the temporal evolution of theprimary heat release zone and the local flame structure at kHz rates from the spatial overlapof the OH- and CH2O-PLIF signals.
确定
还剩8页未读,是否继续阅读?

产品配置单


北京欧兰科技发展有限公司为您提供《非定常火焰中突发模式OH / CH2O平面激光诱导荧光检测方案(气体流量计)》,该方案主要用于其他中突发模式OH / CH2O平面激光诱导荧光检测,参考标准--,《非定常火焰中突发模式OH / CH2O平面激光诱导荧光检测方案(气体流量计)》用到的仪器有PLIF平面激光诱导荧光火焰燃烧检测系统、德国LaVision PIV/PLIF粒子成像测速场仪、LaVision DaVis 智能成像软件平台
推荐专场


相关方案
更多
该厂商其他方案
更多