


方案详情
文
采用LaVision的图像采集和处理软件平台DaVis以及高速相机记录了无约束旋流稳定火焰的HO*自发辐射荧光,并和激光干涉测振方法相结合,研究了燃烧过程的放热波动现象。
方案详情

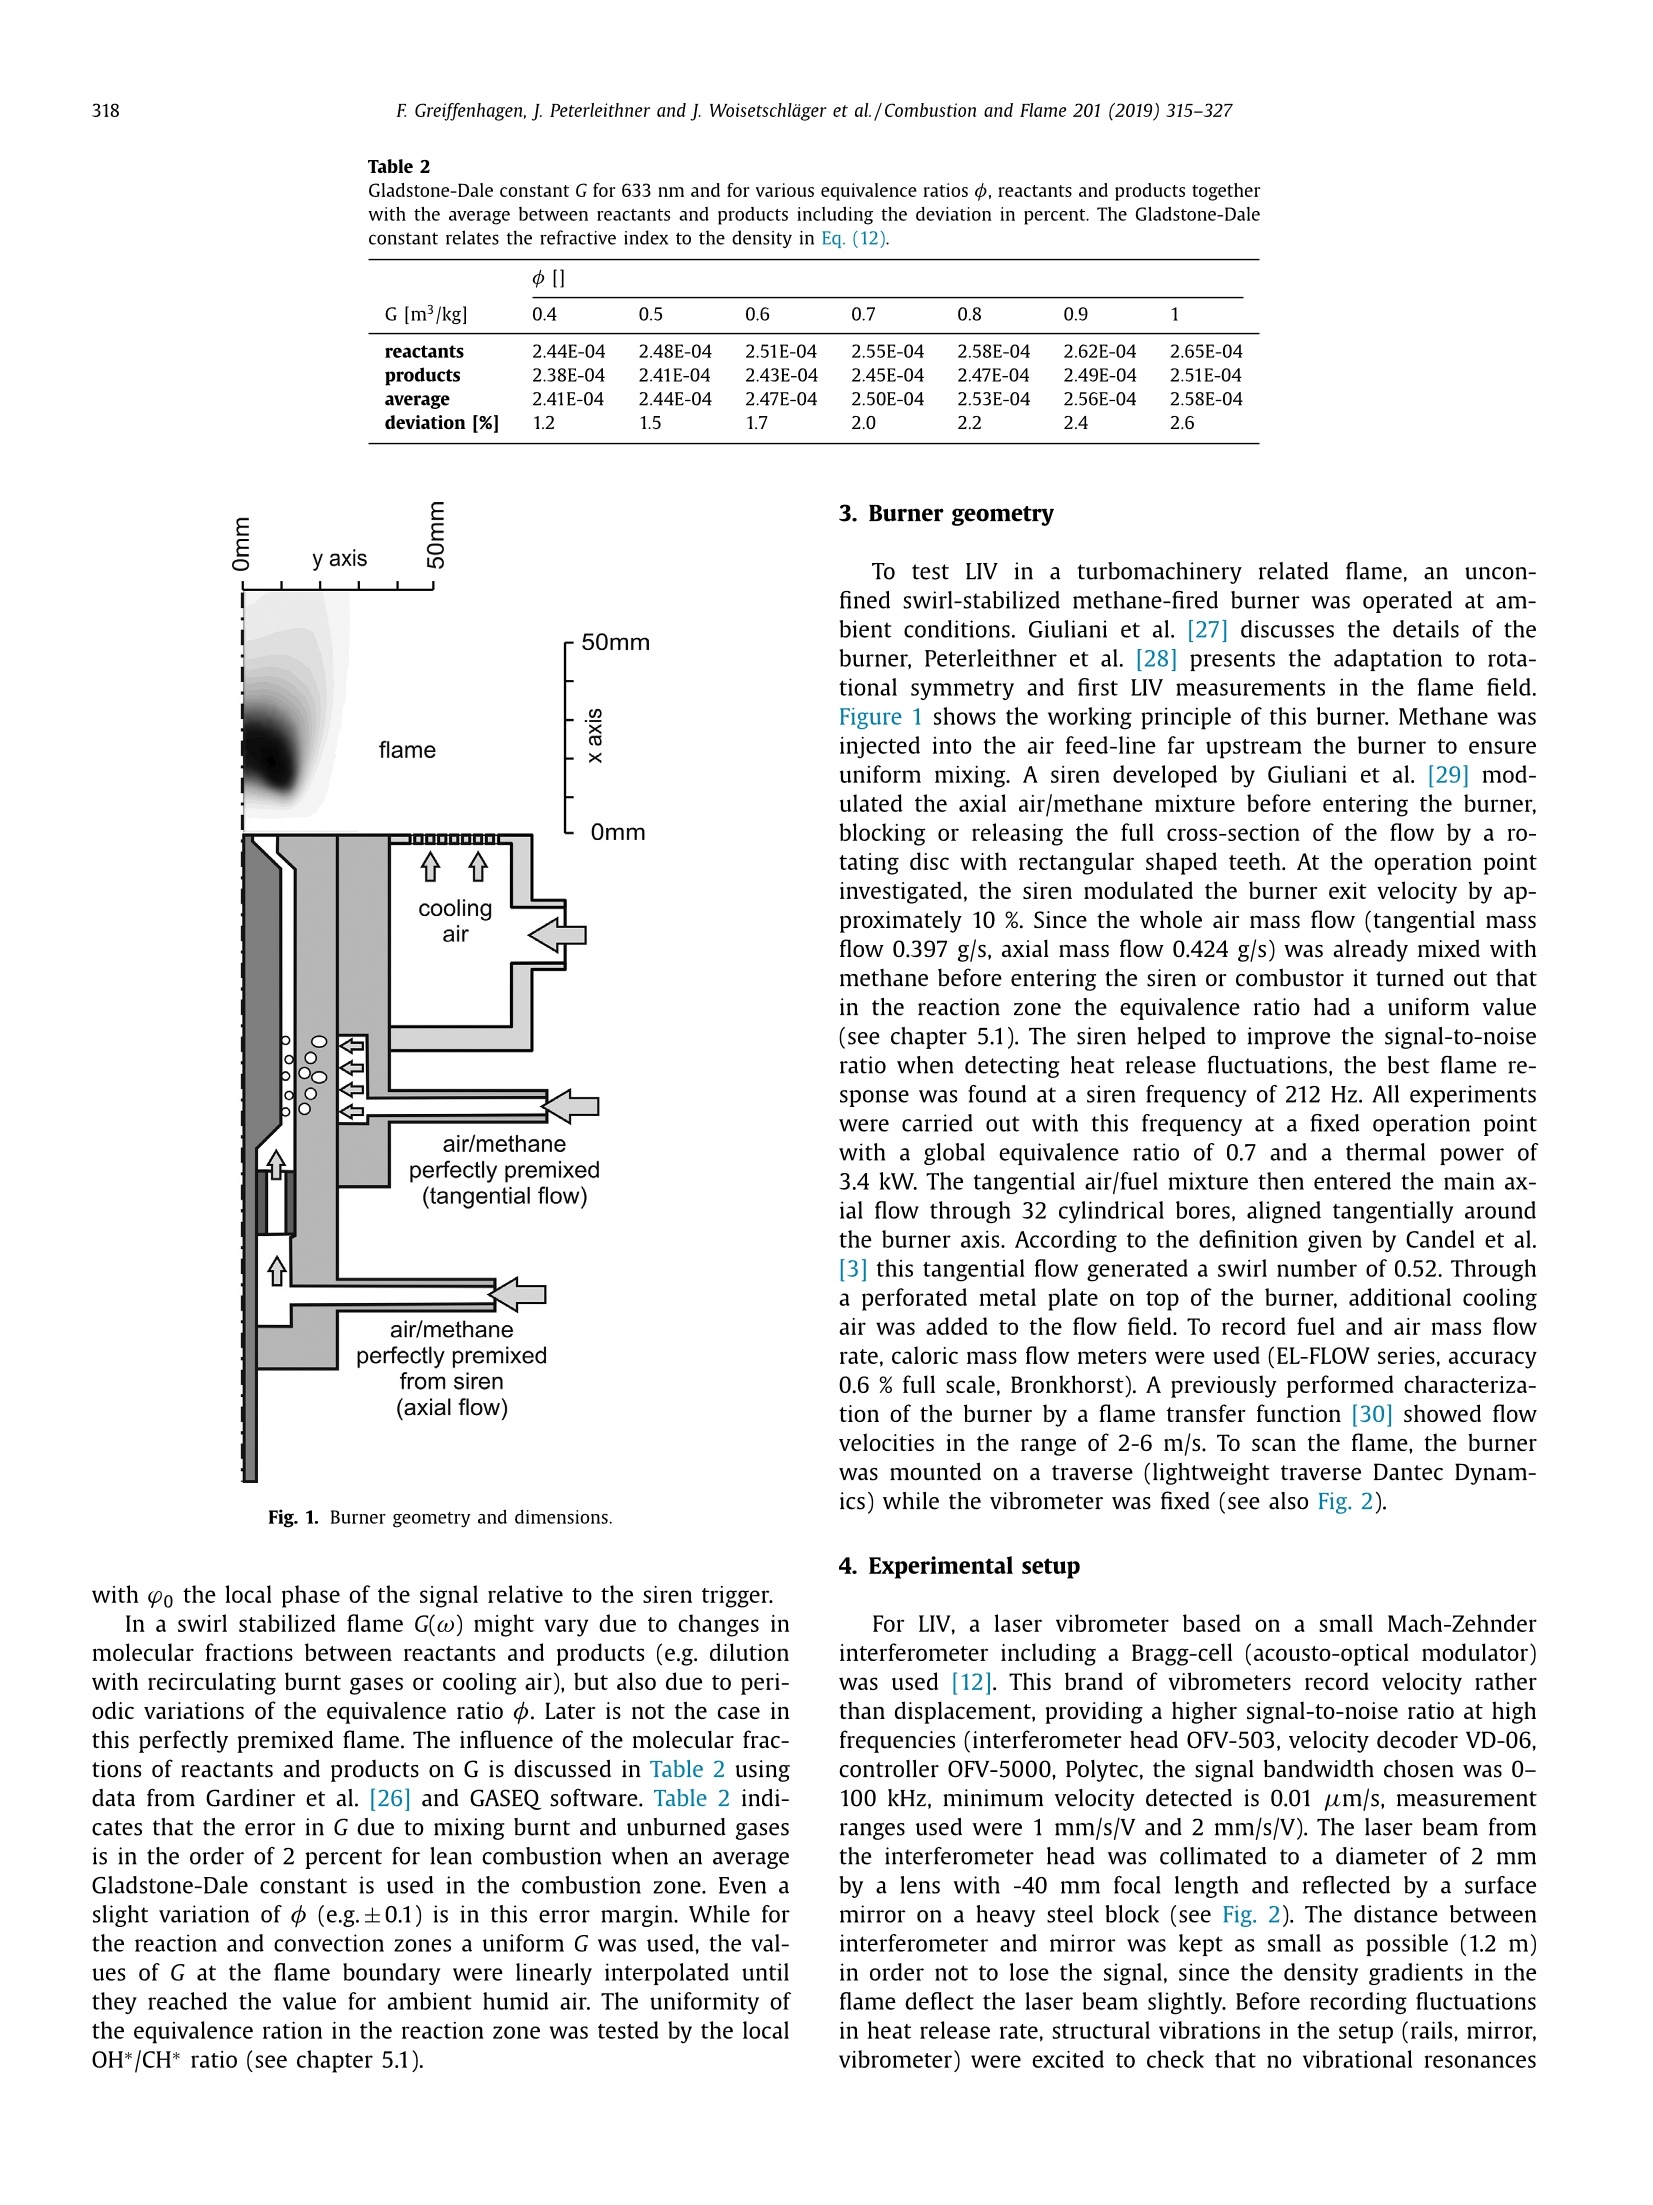
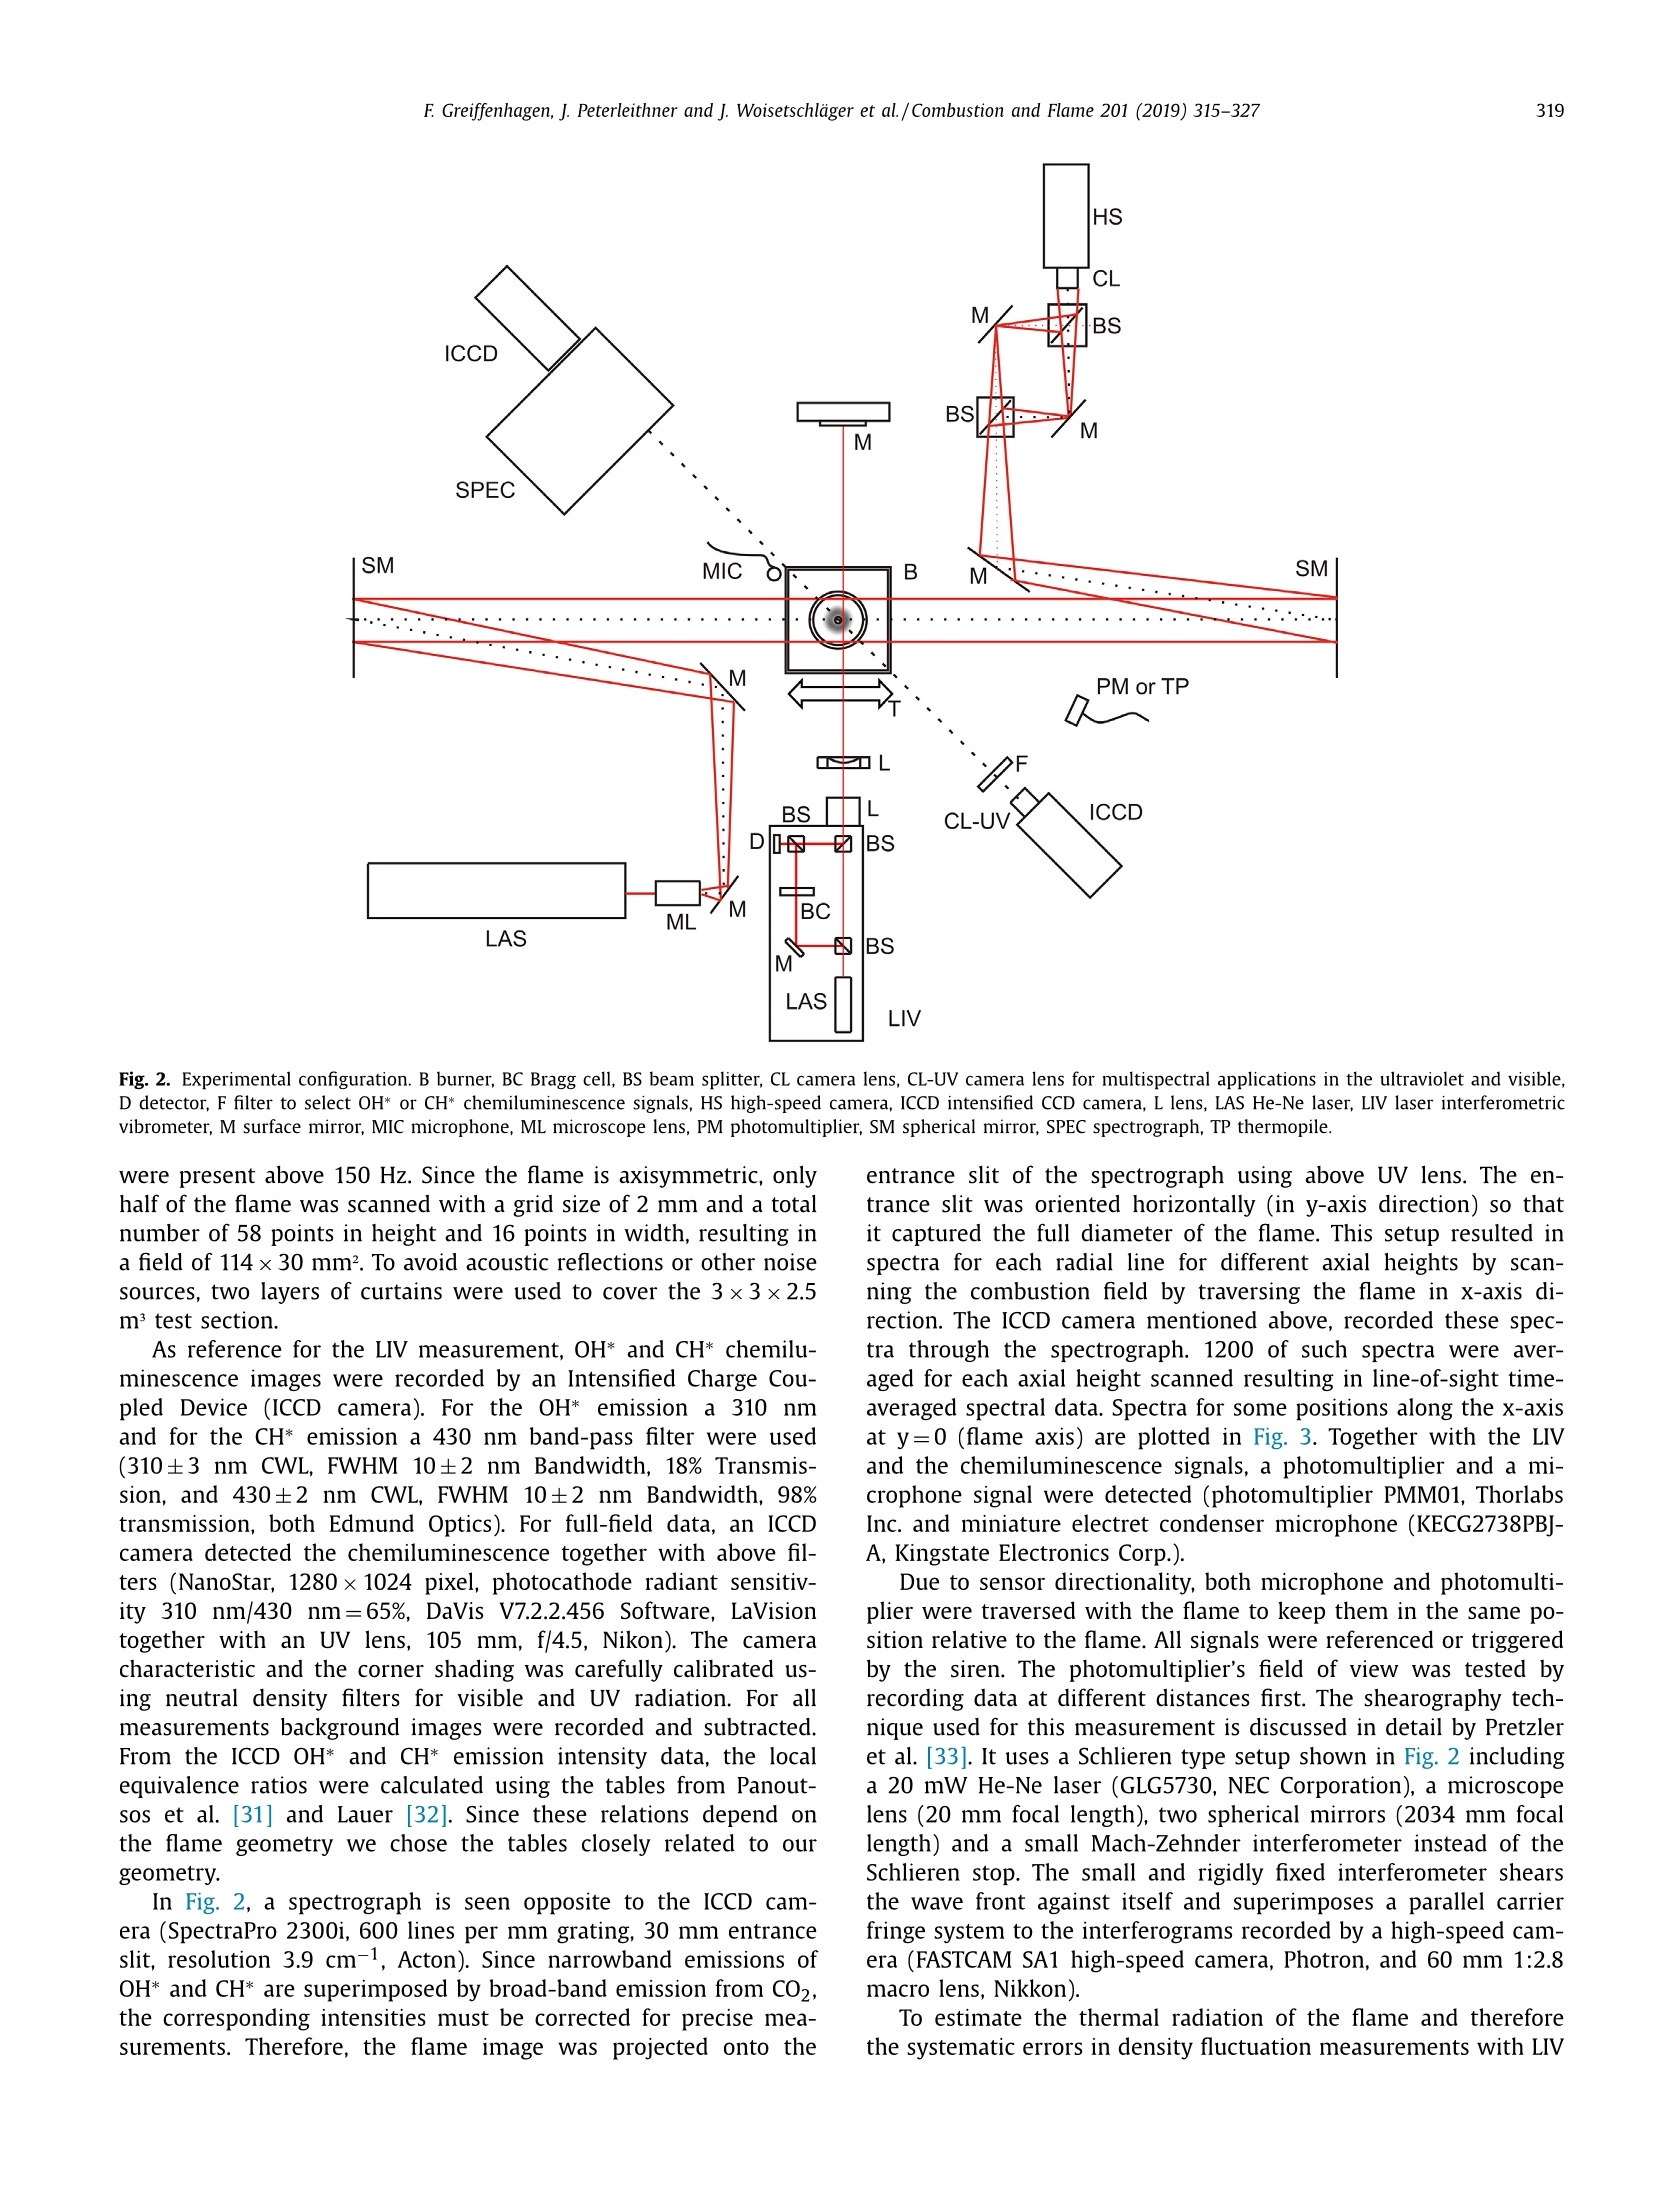
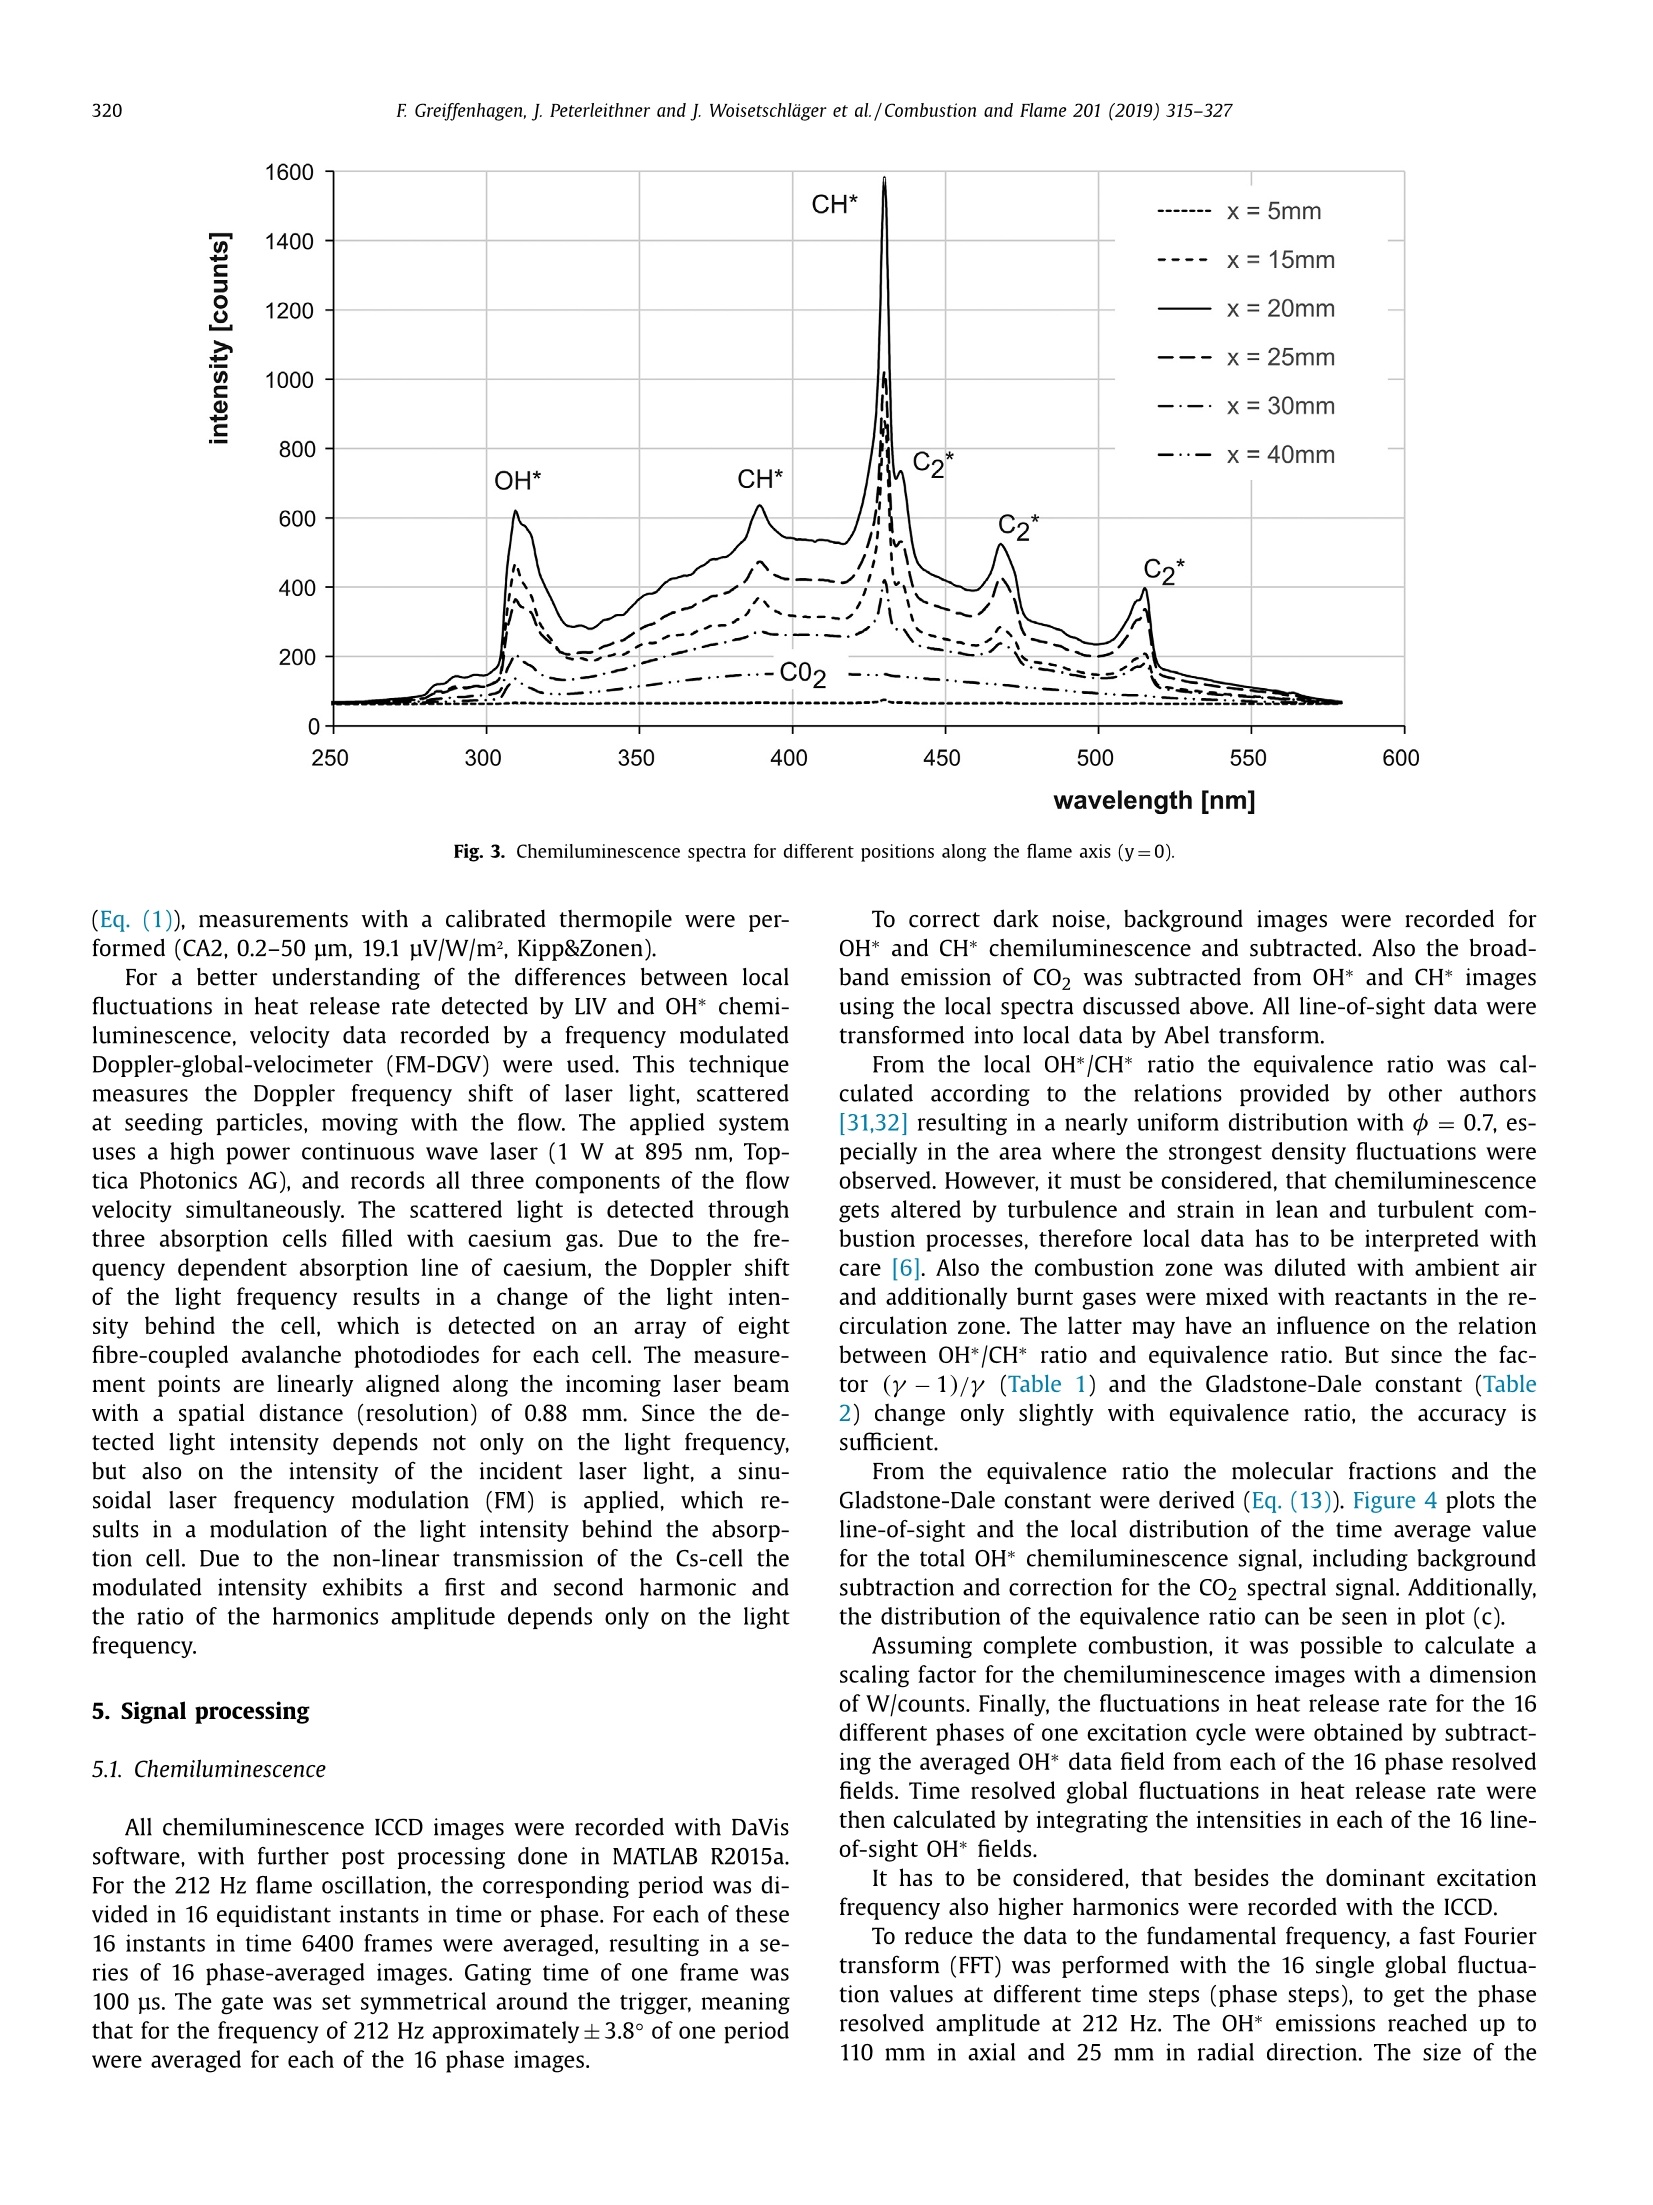
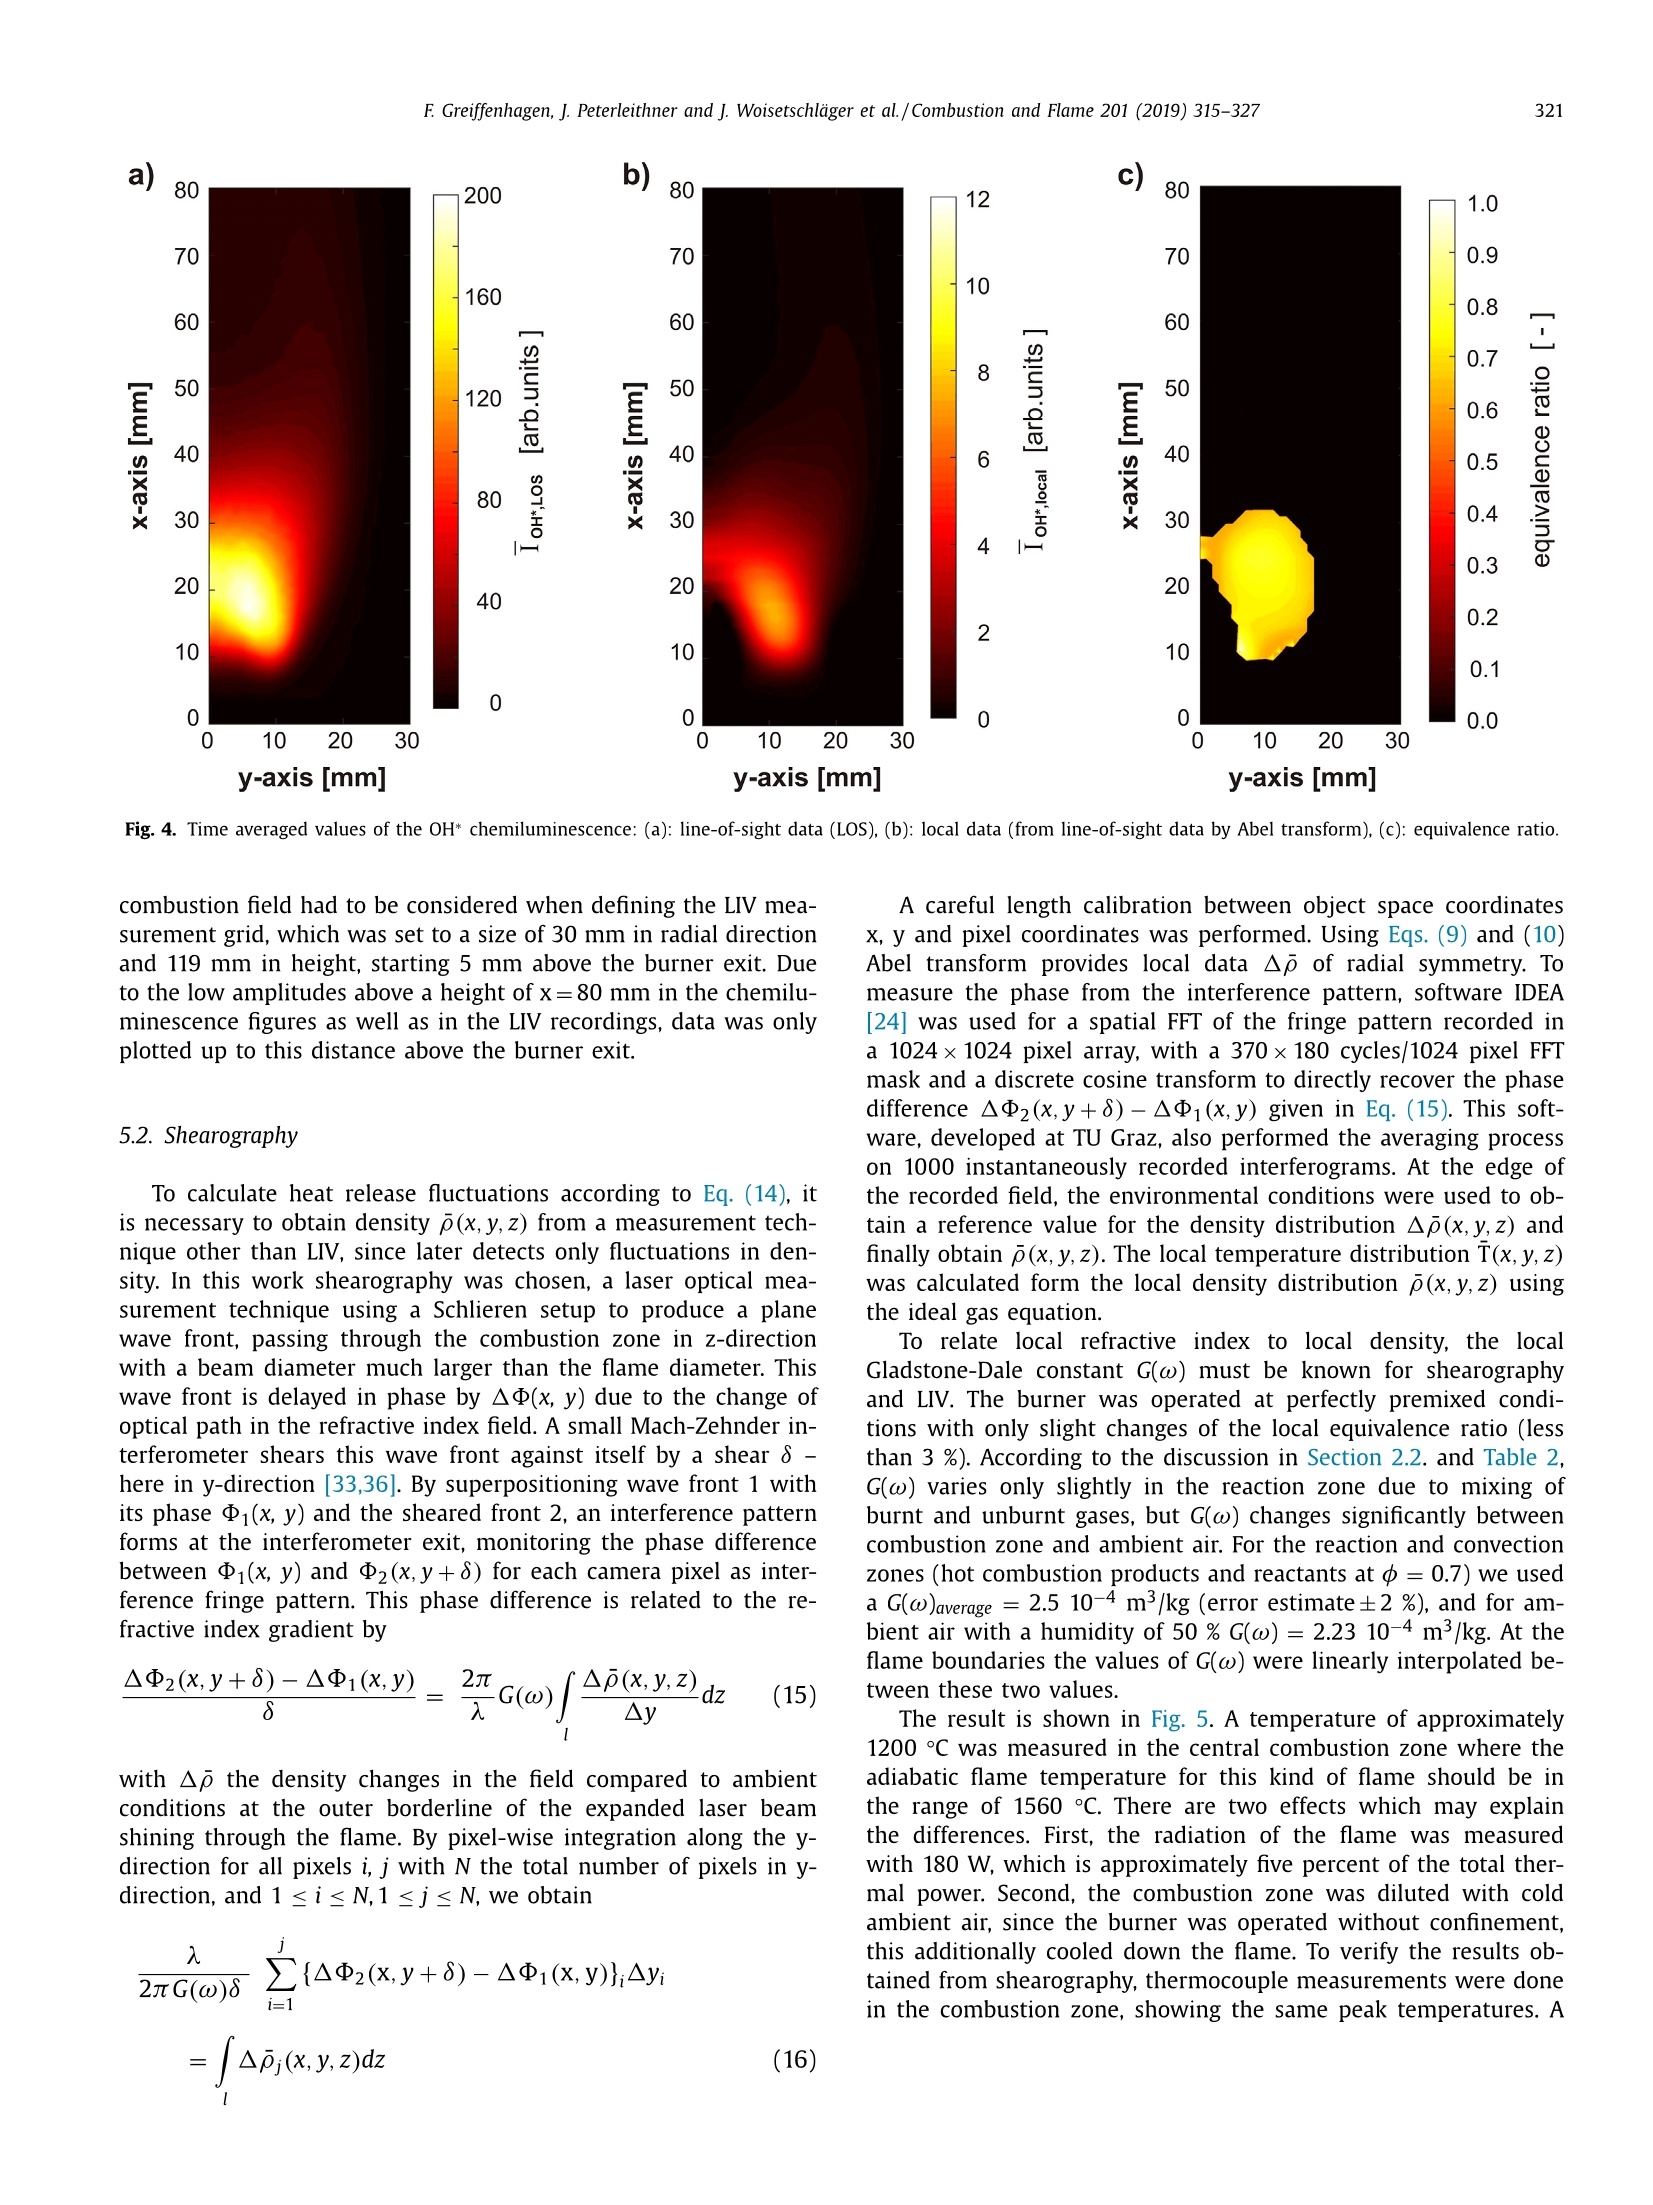
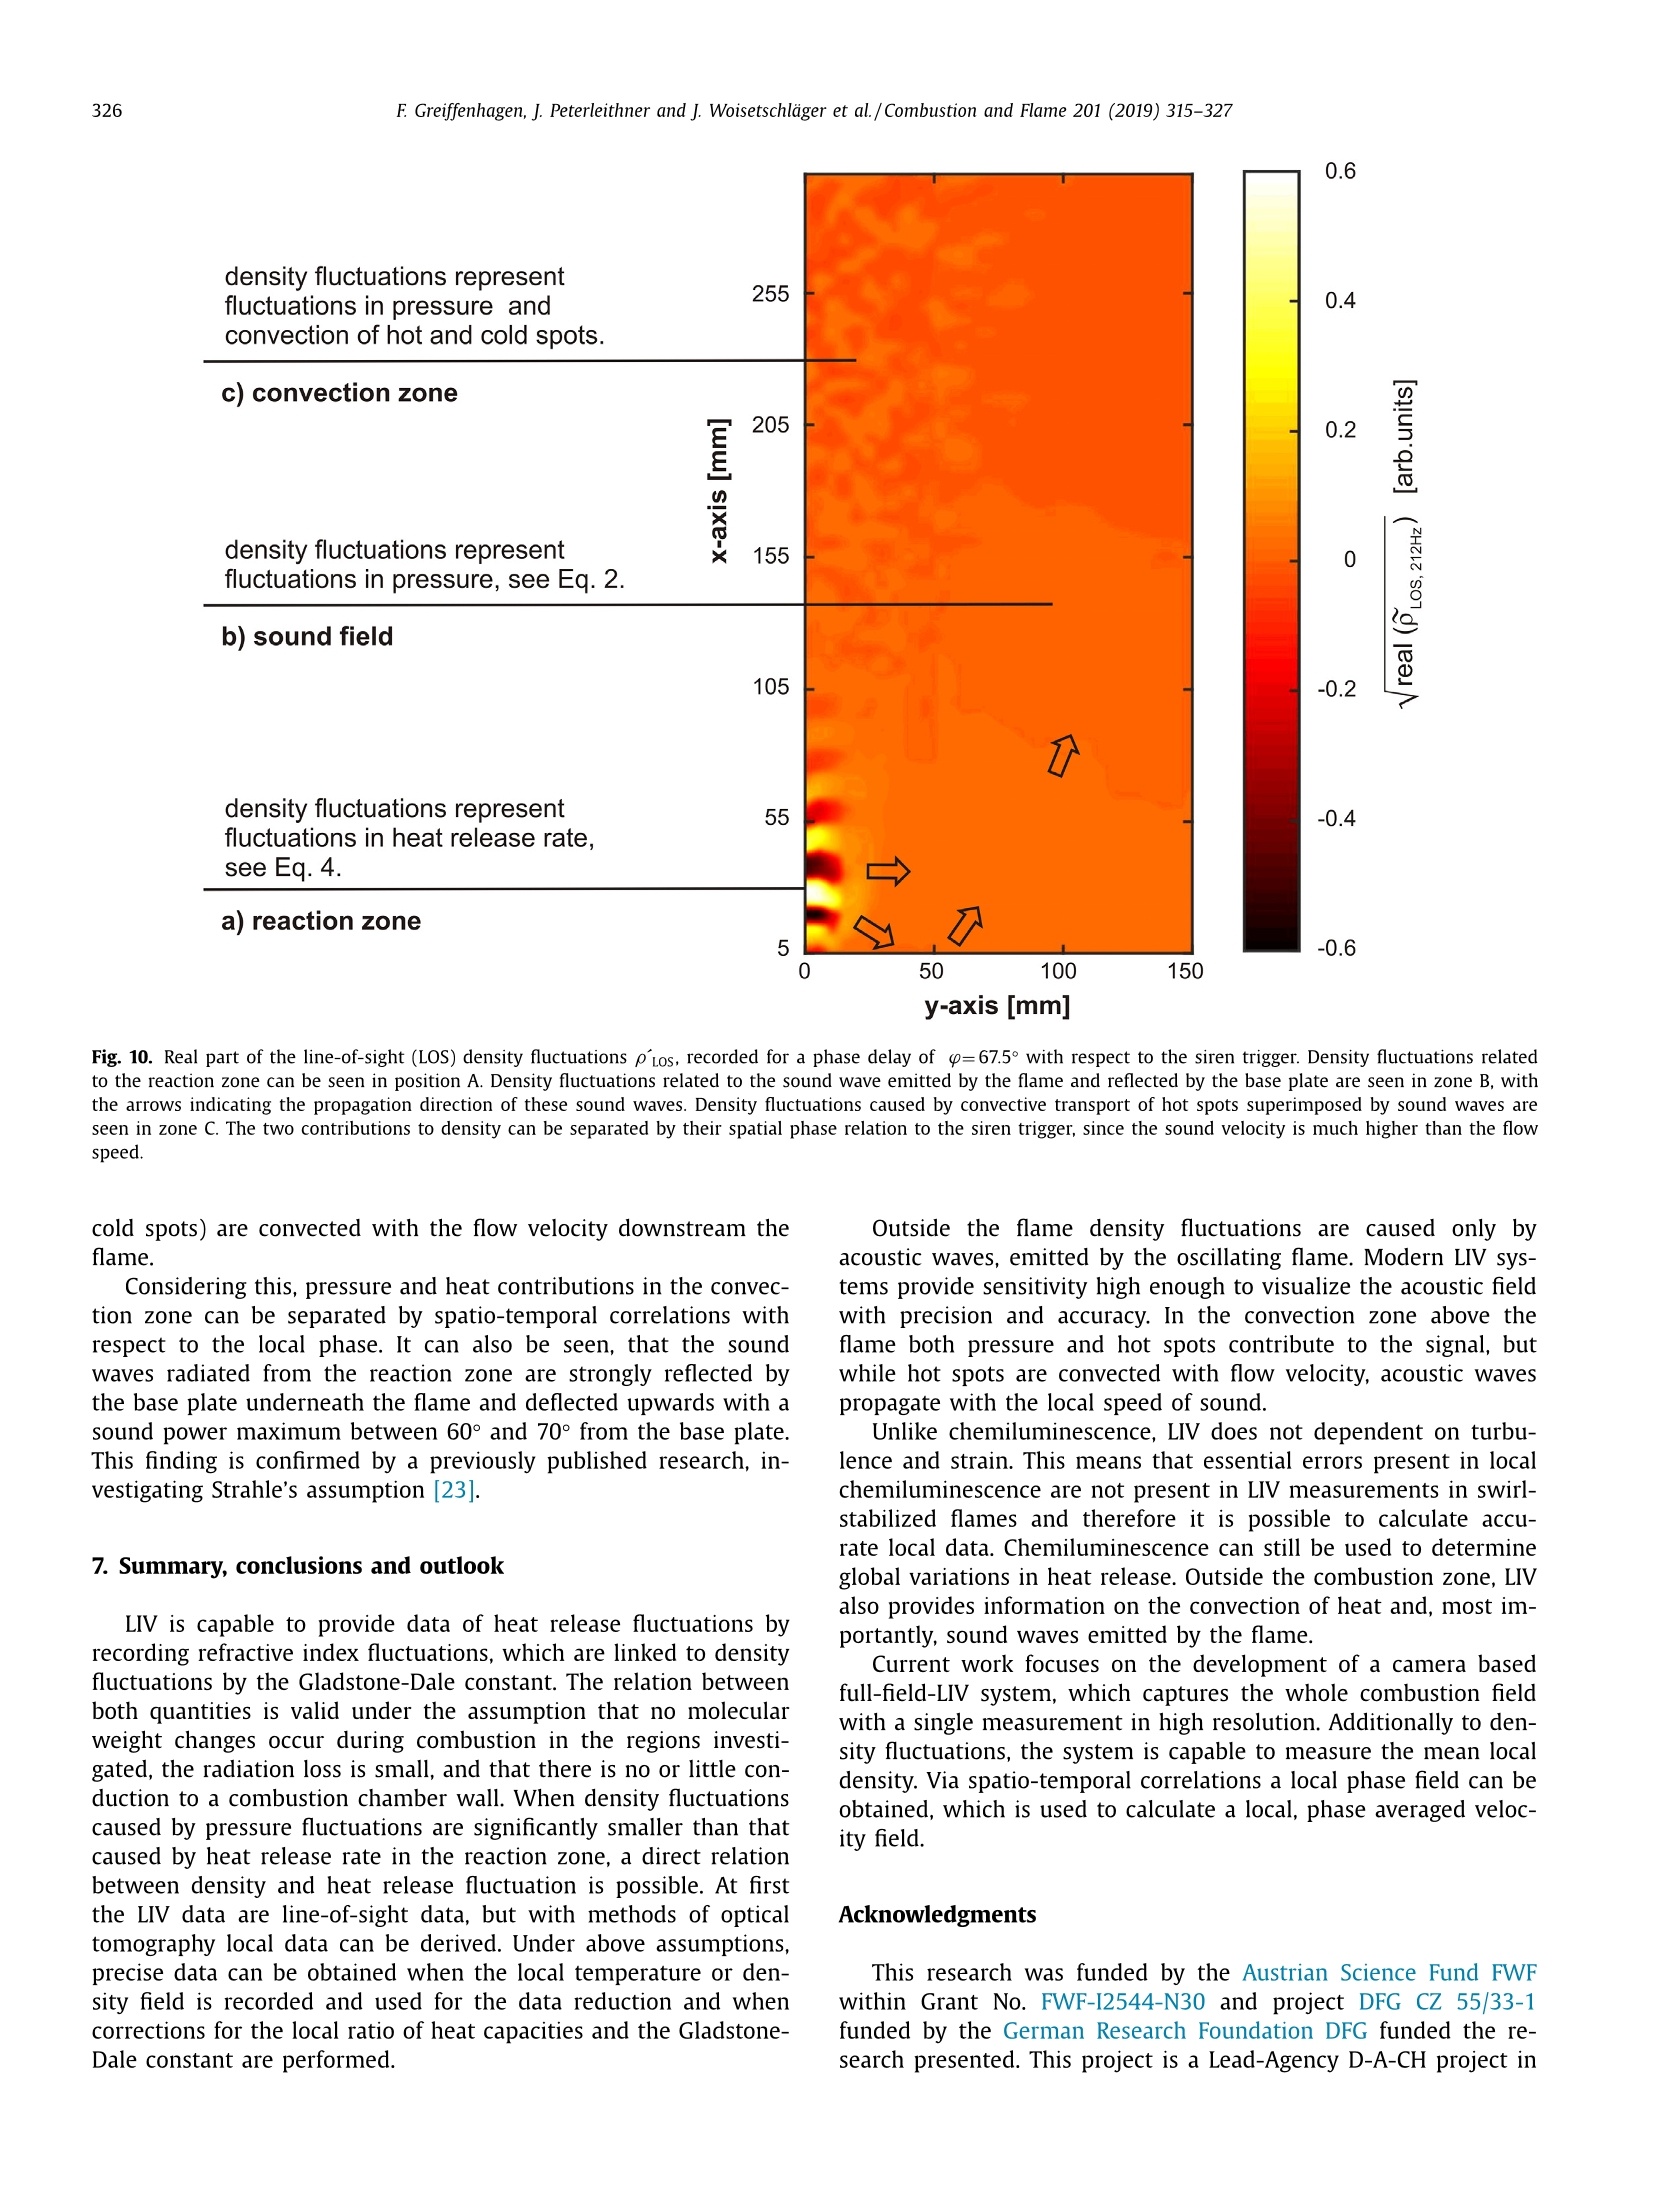
Combustion and Flame 201 (2019) 315-327Contents lists available at ScienceDirect 316E Greiffenhagen, J. Peterleithner and j. Woisetschlager et al./Combustion and Flame 201 (2019) 315-327 https://doi.org/10.1016/j.combustflame.2018.12.019 Combustion and Flame ELSEVIER journal homepage: www.elsevier.com/locate/com bustflame Discussion of laser interferometric vibrometry for the determinationof heat release fluctuations in an unconfined swirl-stabilized flame Felix Greiffenhagena*, Johannes Peterleithner , Jakob Woisetschlager, Andreas Fischer,Johannes Guirtler, Jiirgen Czarske aInstitute for Thermal Turbomachinery and Machine Dynamics, Graz University of Technology, Inffeldgasse 25/A, 8010 Graz, Austria Bremen Institute for Metrology, Automation and Quality Science (BIMAQ), University of Bremen, Linzer StraSe 13, 28359 Bremen, Germany‘Laboratory for Measurement and Testing Techniques, Faculty of Electrical Engineering and Information Technology, Technische Universitat Dresden,Helmholtzstr. 18, 01062 Dresden, Germany ARTICLE IN F O ABSTRACT Article history: Received 19 March 2018 Revised 5 June 2018 Accepted 19 December 2018 Available online 11 January 2019 Keywords:Swirl-stabilized flamesHeat release fluctuationsOptical diagnosticsChemiluminescenceLaser interferometric vibrometryUncertainty analysis Fluctuations in heat release, hot and cold spots convected by the flow and sound waves are all relatedto density fluctuations, a number easily detected by interferometry. Same as chemiluminescence, inter-ferometry is a line-of-sight method and therefore needs optical access and tomographic reconstruction ofdensity fields. In this work we discuss the use of Laser Interferometric Vibrometry (LIV) as an alternativeor extension to chemiluminescence when detecting heat release fluctuations in the flame, convection ofhot and cold spots in the non-reacting flow field and sound waves emitted from a 3.4 kW turbulent,unconfined swirl-stabilized methane/air flame under perfectly premixed conditions. For this discussionlocal temperatures, local ratios of heat release and local Gladstone-Dale constants are determined andtheir influence on the result discussed. Global and local fluctuations in heat release rate recorded by LlVand chemiluminescence are compared, resulting in the same global values if local temperature fields andlocal equivalence ratios are used for LIV data evaluation. In contrast, local fluctuations in OH* chemilu- minescence emission are influenced by turbulence and strain in this type of flame. O2018 The Author(s). Published by Elsevier Inc. on behalf of The Combustion Institute.This is an open access article under the CC BY license. (http://creativecommons.org/licenses/by/4.0/) 1. Introduction Reducing noise and thermo-acoustic instabilities has becomeincreasingly important in thermal turbomachinery used in aero-engines and ground based gas turbines for power plant operation.This is due to EC legislation [1] and needs to improve the relia-bility of gas turbines. In aero-engines, steady improvements of fan,compressor and turbine have reduced the noise level. On the otherside, next generation low-emission combustion modes burn moreunsteadily, resulting in increased noise from combustion [2]. Ad-ditionally, in thermal turbomachinery the flame is stabilized by aswirling flow, responding to incoming disturbances nonlinearly [3].Not only is the direct noise of turbulent flames of importance, butalso indirect combustion noise from hot spots convected by theflow and vorticity fluctuations caused by unsteady combustion [2]. Direct combustion noise is caused by volumetric expansion andcontraction due to fluctuations in heat release. In experimentalresearch, the heat release rate is commonly measured by OH* ( * Corresponding a uthor. ) chemiluminescence or by OH Planar Laser Induced Fluorescence(PLIF). Ayoola et al. [4] give a detailed discussion of thesetechniques for experimental investigations of turbulent premixedflames. He and his co-authors conclude, that for perfectly premixedflames global fluctuations in heat release rate can be recorded byOH* and CH* chemiluminescence in amplitude and phase. Otherauthors come to the same conclusion but question the adequacyof chemiluminescence as a measure for spatially resolved heat re-lease rates [5,6] and recommend interpreting chemiluminescencedata with care, based on the observation that mixture gradientsand strain rate can influence the local emissions. Heat release fluctuations, hot and cold spots convected by theflow, and sound waves are related to density fluctuations, a num-ber detected by interferometry. Chemiluminescence and interferometry are both line-of-sight methods and therefore need optical access and tomographic reconstruction, except symmetry canbe assumed [7]. Throughout the last decades, Laser InterferometricVibrometry (LIV) became a powerful tool in the visualization anddetection of sound fields [8,9], as well as in the detection of tur-bulent vortices and boundary layer transition [10,11]. This develop-ment had been made possible by the wide availability of laser vi-brometers, used to detect surface vibrations from machinery [12]. ( 0010-2180/O 20 1 8 The Aut h or(s). Published by E l sevier Inc. on beha l f of T h e Combustion Institute. This is an op e n access article under the CC BY lice n se. (h tt p ://creat i vecommons.org/licenses/by/4.0/) ) Modern systems record fluctuations in the optical path lengthalong the laser beam with picometre resolution. These changes inoptical path can then be related to changes in the refractive indexfield or density fluctuations. Giuliani et al.[13] first reported the visualization of densityfluctuations in a reacting flow. Koberl et al. [14]demonstrated thelocal detection of density fluctuations by two correlated vibrome-ter signals (dual LIV) in an unconfined methane-jet diffusion flameof 7.5 kW power. In a cooperation between TU Graz (F. Giuliani)and Ecole Centrale Paris (T. Schuller) the link between density andheat release fluctuations was employed for an unconfined, acous-tically excited and premixed laminar methane flame, including afirst comparison to data recorded by chemiluminescence [15] withadditional work on this burner published by Li et al. [16]. Finally,a feasibility study was performed at TU Munich (T. Sattelmayer),investigating a confined swirl-stabilized methane/air flame in per-fectly and technically premixed mode at 40-55 kW power [17]. In contrast to these previous investigations, the objective of thiswork is a detailed discussion of LIV as an alternative or exten-sion to chemiluminescence when detecting global and local heatrelease fluctuations. Therefore an estimation of uncertainties dueto methodology, instrumentation and confounding effects is carriedout, with a detailed discussion of the influence of local densities,Gladstone-Dale constant and ratios of heat capacities. Addition-ally convection of heat in the non-reacting flow field and soundwaves radiated by the flame, are investigated. For this purpose, LIVand chemiluminescence were used to record a 3.4 kW unconfinedmethane/air swirl-stabilized flame at ambient conditions and per-fect pre-mixing. A siren modulated the axial airflow before enter-ing the burner, improving the signal-to-noise ratio for all measure-ment techniques. 2. Theoretical background 2.1. Relating density, pressure and heat release rate Information about heat release is sought-after by the engineer,since it describes the flame dynamics and the stability behaviordirectly. Since LIV records density fluctuations p' as a measure forfluctuations in heat q and pressure p, a relation between thesenumbers is needed. Such a relation can be derived by using Gibbs'thermodynamics and the equations for an ideal gas. A more com-prehensive approach is to use the energy equation, resulting in amore detailed transport equation (Williams'equation, see supple-mental material)[16,18-20]. With the definition of the substantialderivative,and with fluctuations (p') and steady state variables (p)this relation is written for the fluctuating components, since the time derivative of thesteady state equals zero per definition and the gradients of thesteady fields are small compared to the gradients of the fluctua-tions. Here, c is the local speed of sound and y the ratio of heatcapacities. Using the energy equation for a reacting gas, Eq. (1) isonly valid if there is no change of molecular weight during com-bustion (this is not the case for oxycombustion [21]), the radiationloss is small (considering thermal radiation mainly from CO2 andH20), and if there is no conduction to the wall. When isentropic flows are investigated, all variations in heat arezero and the density fluctuations represent the pressure fluctua-tions in the system: Using Eq. (2), LIV is applied to the detection of acoustic fieldsaround machines [8] or music instruments [9]. In Section 6.3 it isshown that it is also possible to visualize the sound field which isradiated by the flame. Sound power in the far field of a turbulentswirl-stabilized flame can be calculated directly if density fluctu-ations in the flame are known as a function of time and space[22,231. When heat is added to the flow by combustion, the order ofmagnitude for the single contributions to Eq. (1) can be estimatedby integration with p=1-0.5 kg/m3,p'/p=0.2-0.5, c=600 m/s, and p'=1000Pa (154 dB). Density fluctuations caused by pressure fluctuationsat this high level are still two orders of magnitude smaller thanfluctuations in density caused by the heat release rate. ThereforeEq. (1) can be approximated within the reaction zone by This equation is valid only for the reaction zone, but withouta thermo-acoustic resonance in the combustion chamber. Startingwith Eq. (4), substituting the speed of sound c²=yRT where Rrepresents the gas constant, and using the relation for a perfectgas p= pRT, Eq. (4) changes to Replacing the instantaneous value of density with its meanvalue and the fluctuating component leads to For Eq. (6) the mean density distribution p in the flame isneeded. While LlV is capable to record density fluctuations withhigh accuracy and precision, it is necessary to use another opticaltechnique such as shearography, digital holography or Background-Oriented Schlieren (BOS) to detect absolute density quantitatively,whereby shearography was used in this work. In Eq. (6) p is used instead of p, since pressure fluctuations aresmall compared to the ambient pressure or the average pressurein a combustion chamber. On the other hand, (y-1)/y needssome closer discussion. Table 1 gives values of (y-1)/y for theworst case of a mixture of cold reactants and hot products usingGASEQ software. When a mean value for burnt and unburned gasesis used for this flame region, the deviation is well in the range of6 percent. Using the ideal gas equation, local temperature was cal-culated from local density to correct for a local (y-1)/y. For that purpose, the local equivalence ratio must be known. Inthis work we used a perfectly premixed flame and a spectroscopicmethod relating OH* and CH* chemiluminescence after CO2 back-ground subtraction, to get a rough estimation of the local equiva-lence ratio (see chapter 5.1). As shown in Table 1, changes in equiv-alence ratio only have a slight influence on the ratio (y-1)/y. 2.2. Interferometry When passing through the fluid flow, light interacts withthe single molecules enforcing dipole oscillations and subsequentemission of secondary electromagnetic waves. These secondarywave fronts interfere with the primary wave, resulting in a delayedwave front. The speed of the light’s wave front in vacuum is thenrelated to the speed of the delayed wave front, defining the non-dimensional refractive index n. Most important to interferometric Table 1 (y-1)/y for various equivalence ratios p, reactants and products together with theaverage between reactants and products including the deviation in percent. (y-1)/yis needed to relate density and heat release fluctuations in the reaction zone accordingto Eq. (6). 中 (Y-1)/y[] 0.4 0.5 0.6 0.7 0.8 0.9 1 reactants 300 K 0.282 0.282 0.281 0.281 0.281 0.280 0.280 products 1500 K 0.252 0.250 0.249 0.247 0.246 0.244 0.243 average 0.267 0.266 0.265 0.265 0.263 0.263 0.262 deviation[%] 5.3 5.5 5.6 5.8 6.1 6.2 6.4 with I the total geometrical path through the fluid flow and z thecoordinate along the beam axis. Interferometry records the opti-cal path difference between a reference wave and the object wave,with the object wave sampling through the fluid flow and the ref-erence wave kept within the interferometer. Thus, the optical pathdifference AL is related to a phase difference Ad between thetwo wave fronts by the wavelength入 and the corresponding phase2元, with U(t) the output voltage of the LIV and kvib its calibration fac-tor. Laser vibrometers are commonly used to detect surface vibra-tions. Because the type of vibrometer used in this work has anacousto-optical modulator to detect surface velocity rather thansurface displacement, Eq. (8) uses the time derivative of the opti-cal path, thus providing a better signal-to-noise ratio for high fre-quency oscillations. Since the laser beam has to pass the test sec-tion twice to re-enter the LIV, a factor of 2 for the optical pathis needed. An out of plane movement of the vibrating surface iscounted as positive signal, therefore the right term is negativesince such a movement towards the LIV decreases the optical pathdifference. Interferometry is a line-of-sight method. To record local valuesfrom integral measurements in three-dimensional refractive indexfields, multidirectional detection is necessary. The swirl-stabilizedflame investigated herein is axisymmetric when looking at timeaveraged data. In this case a single observation direction and tomo-graphic reconstruction using an Abel transform provides local data.For an unknown axisymmetric function f(r) with radius r and max-imum diameter 2R, the relation between the projected data h(y)with y the projection coordinate is given by The reconstruction of the unknown function f(r) from the mea-sured projections h(y)is done analytically by means of Abel trans-form For measurement data, the projection h(y) is not given as afunction but in the form of a digital array, which makes a numer-ical solution necessary. Additionally, the function f(r) must be zero The fluid flow can be detected by its refractive index fieldThe Clausius-Masotti equation links refractive index and density interms of molecular constants [7]. Since in a gas the refractive in-dex is close to one, the relation for a single molecular species isgiven by with me the electron mass, e the electron charge, eo the vacuumpermittivity, o;the non-dimensional oscillator strength of the jthtransition at frequency ωj, and ω the frequency of the laser light.The abbreviated form defines the Gladstone-Dale constant G(w) which is weakly disper-sive and does depend on molecular fractions only. With the massfractions pilp of the ith molecular species the total Gladstone-Daleconstant is It should be considered, that the Gladstone-Dale constant canchange in a reacting gas slightly due to changes of the local equivalence ratio d. Next, we define the phase-average (n)s of a peri-odic signal at frequency f, with (n)f= n+ficos(() and ~ de-noting the fluctuation amplitude (or AC component from the sig.nal Fourier transform) at this frequency fwith d/dt n = 0. FromEq. (5) we finally obtain the relation between density and fluctua-tions in heat release rate in the reaction zone, at a given frequencyf, considering all the assumptions discussed in chapter 2.1: Table 2 Gladstone-Dale constant G for 633 nm and for various equivalence ratios d, reactants and products togetherwith the average between reactants and products including the deviation in percent. The Gladstone-Daleconstant relates the refractive index to the density in Eq. (12). 中] G [m³/kg] 0.4 0.5 0.6 0.7 0.8 0.9 1 reactants 2.44E-04 2.48E-04 2.51E-04 2.55E-04 2.58E-04 2.62E-04 2.65E-04 products 2.38E-04 2.41E-04 2.43E-04 2.45E-04 2.47E-04 2.49E-04 2.51E-04 average 2.41E-04 2.44E-04 2.47E-04 2.50E-04 2.53E-04 2.56E-04 2.58E-04 deviation [%] 1.2 1.5 1.7 2.0 2.2 2.4 2.6 Fig. 1. Burner geometry and dimensions. with Po the local phase of the signal relative to the siren trigger. In a swirl stabilized flame G(w) might vary due to changes inmolecular fractions between reactants and products (e.g. dilutionwith recirculating burnt gases or cooling air), but also due to peri-odic variations of the equivalence ratio o. Later is not the case inthis perfectly premixed flame. The influence of the molecular frac-tions of reactants and products on G is discussed in Table 2 usingdata from Gardiner et al. [26] and GASEQ software. Table 2 indi-cates that the error in G due to mixing burnt and unburned gasesis in the order of 2 percent for lean combustion when an averageGladstone-Dale constant is used in the combustion zone. Even aslight variation of 中 (e.g.±0.1) is in this error margin. While forthe reaction and convection zones a uniform G was used, the val-ues of G at the flame boundary were linearly interpolated untilthey reached the value for ambient humid air. The uniformity ofthe equivalence ration in the reaction zone was tested by the localOH*/CH* ratio (see chapter 5.1). To test LlV in a turbomachinery related flame, an uncon-fined swirl-stabilized methane-fired burner was operated at am-bient conditions. Giuliani et al. [27] discusses the details of theburner, Peterleithner et al. [28] presents the adaptation to rota-tional symmetry and first LIV measurements in the flame field.Figure 1 shows the working principle of this burner. Methane wasinjected into the air feed-line far upstream the burner to ensureuniform mixing. A siren developed by Giuliani et al. [29] mod-ulated the axial air/methane mixture before entering the burner,blocking or releasing the full cross-section of the flow by a ro-tating disc with rectangular shaped teeth. At the operation pointinvestigated, the siren modulated the burner exit velocity by ap-proximately 10 %.Since the whole air mass flow (tangential massflow 0.397 g/s, axial mass flow 0.424 g/s) was already mixed withmethane before entering the siren or combustor it turned out thatin the reaction zone the equivalence ratio had a uniform value(see chapter 5.1). The siren helped to improve the signal-to-noiseratio when detecting heat release fluctuations, the best flame re-sponse was found at a siren frequency of 212 Hz. All experimentswere carried out with this frequency at a fixed operation pointwith a global equivalence ratio of 0.7 and a thermal power of3.4 kW. The tangential air/fuel mixture then entered the main ax-ial flow through 32 cylindrical bores, aligned tangentially aroundthe burner axis. According to the definition given by Candel et al.[3] this tangential flow generated a swirl number of 0.52. Througha perforated metal plate on top of the burner, additional coolingair was added to the flow field. To record fuel and air mass flowrate, caloric mass flow meters were used (EL-FLOW series,accuracy0.6 % full scale, Bronkhorst). A previously performed characteriza-tion of the burner by a flame transfer function [30] showed flowvelocities in the range of 2-6 m/s. To scan the flame, the burnerwas mounted on a traverse (lightweight traverse Dantec Dynam-ics) while the vibrometer was fixed (see also Fig. 2). 4. Experimental setup For LIV, a laser vibrometer based on a small Mach-Zehnderinterferometer including a Bragg-cell (acousto-optical modulator)was used [12]. This brand of vibrometers record velocity ratherthan displacement, providing a higher signal-to-noise ratio at highfrequencies (interferometer head OFV-503, velocity decoder VD-06,controller OFV-5000, Polytec, the signal bandwidth chosen was O-100 kHz, minimum velocity detected is 0.01 um/s, measurementranges used were 1 mm/s/V and 2 mm/s/V). The laser beam fromthe interferometer head was collimated to a diameter of 2 mmby a lens with -40 mm focal length and reflected by a surfacemirror on a heavy steel block (see Fig. 2). The distance betweeninterferometer and mirror was kept as small as possible (1.2 m)in order not to lose the signal, since the density gradients in theflame deflect the laser beam slightly. Before recording fluctuationsin heat release rate, structural vibrations in the setup (rails, mirror,vibrometer) were excited to check that no vibrational resonances Fig. 2. Experimental configuration. B burner, BC Bragg cell, BS beam splitter, CL camera lens, CL-UV camera lens for multispectral applications in the ultraviolet and visible,D detector, F filter to select OH* or CH* chemiluminescence signals, HS high-speed camera, ICCD intensified CCD camera, L lens, LAS He-Ne laser, LIV laser interferometricvibrometer, M surface mirror, MIC microphone, ML microscope lens, PM photomultiplier, SM spherical mirror, SPEC spectrograph, TP thermopile. were present above 150 Hz. Since the flame is axisymmetric, onlyhalf of the flame was scanned with a grid size of 2 mm and a totalnumber of 58 points in height and 16 points in width, resulting ina field of 114x30 mm². To avoid acoustic reflections or other noisesources, two layers of curtains were used to cover the 3×3×2.5m’ test section. As reference for the LIV measurement,OH* and CH* chemilu-minescence images were recorded by an Intensified Charge Cou-pled Device (ICCD camera). For the OH* emission a 310 nmand for the CH* emission a 430 nm band-pass filter were used(310±3 nm CWL, FWHM 10±2 nm Bandwidth, 18% Transmis-sion, and 430±2 nm CWL, FWHM 10±2 nm Bandwidth, 98%transmission, both Edmund Optics). For full-field data, an ICCDcamera detected the chemiluminescence together with above fil-ters (NanoStar, 1280×1024 pixel, photocathode radiant sensitiv-ity 310 nm/430 nm=65%, DaVis V7.2.2.456 Software, LaVisiontogether with an UV lens, 105 mm, f/4.5, Nikon). The cameracharacteristic and the corner shading was carefully calibrated us-ing neutral density filters for visible and UV radiation. For allmeasurements background images were recorded and subtracted.From the ICCD OH* and CH* emission intensity data, the localequivalence ratios were calculated using the tables from Panout-sos et al. [31] and Lauer [32]. Since these relations depend onthe flame geometry we chose the tables closely related to ourgeometry. In Fig. 2, a spectrograph is seen opposite to the ICCD cam-era (SpectraPro 2300i, 600 lines per mm grating, 30 mm entranceslit, resolution 3.9 cm-1, Acton). Since narrowband emissions ofOH* and CH* are superimposed by broad-band emission from CO2,the corresponding intensities must be corrected for precise mea-surements. Therefore, the flame image was projected onto the entrance slit of the spectrograph using above UV lens. The en-trance slit was oriented horizontally (in y-axis direction) so thatit captured the full diameter of the flame. This setup resulted inspectra for each radial line for different axial heights by scan-ning the combustion field by traversing the flame in x-axis di-rection. The ICCD camera mentioned above, recorded these spec-tra through the spectrograph. 1200 of such spectra were aver-aged for each axial height scanned resulting in line-of-sight time-averaged spectral data. Spectra for some positions along the x-axisat y=0 (flame axis) are plotted in Fig. 3. Together with the LIVand the chemiluminescence signals, a photomultiplier and a mi-crophone signal were detected (photomultiplier PMM01, ThorlabsInc. and miniature electret condenser microphone (KECG2738PBJ-A, Kingstate Electronics Corp.). Due to sensor directionality, both microphone and photomultiplier were traversed with the flame to keep them in the same position relative to the flame. All signals were referenced or triggeredby the siren. The photomultiplier’s field of view was tested byrecording data at different distances first. The shearography tech-nique used for this measurement is discussed in detail by Pretzleret al. [33]. It uses a Schlieren type setup shown in Fig. 2 includinga 20 mW He-Ne laser (GLG5730, NEC Corporation), a microscopelens (20 mm focal length), two spherical mirrors (2034 mm focallength) and a small Mach-Zehnder interferometer instead of theSchlieren stop. The small and rigidly fixed interferometer shearsthe wave front against itself and superimposes a parallel carrierfringe system to the interferograms recorded by a high-speed cam-era (FASTCAM SA1 high-speed camera, Photron, and 60 mm 1:2.8macro lens, Nikkon). To estimate the thermal radiation of the flame and thereforethe systematic errors in density fluctuation measurements with LIV >c Fig. 3. Chemiluminescence spectra for different positions along the flame axis (y=0). (Eq.(1)), measurements with a calibrated thermopile were per-formed (CA2, 0.2-50 um, 19.1 pV/W/m², Kipp&Zonen). For a better understanding of the differences between localfluctuations in heat release rate detected by LIV and OH* chemi-luminescence, velocity data recorded by a frequency modulatedDoppler-global-velocimeter (FM-DGV) were used. This techniquemeasures the Doppler frequency shift of laser light, scatteredat seeding particles, moving with the flow. The applied systemuses a high power continuous wave laser (1 W at 895 nm, Top-tica Photonics AG), and records all three components of the flowvelocity simultaneously. The scattered light is detected throughthree absorption cells filled with caesium gas. Due to the fre-quency dependent absorption line of caesium, the Doppler shiftof the light frequency results in a change of the light inten-sity behind the cell, which is detected on an array of eightfibre-coupled avalanche photodiodes for each cell. The measure-ment points are linearly aligned along the incoming laser beamwith a spatial distance (resolution) of 0.88 mm. Since the de-tected light intensity depends not only on the light frequency,but also on the intensity of the incident laser light, a sinu-soidal laser frequency modulation (FM) is applied, which re-sults in a modulation of the light intensity behind the absorp-tion cell. Due to the non-linear transmission of the Cs-cell themodulated intensity exhibits a first and second harmonic andthe ratio of the harmonics amplitude depends only on the lightfrequency. 5. Signal processing 5.1. Chemiluminescence All chemiluminescence ICCD images were recorded with DaVissoftware, with further post processing done in MATLAB R2015a.For the 212 Hz flame oscillation, the corresponding period was di-vided in 16 equidistant instants in time or phase. For each of these16 instants in time 6400 frames were averaged, resulting in a se-ries of 16 phase-averaged images. Gating time of one frame was100 us. The gate was set symmetrical around the trigger, meaningthat for the frequency of 212 Hz approximately±3.8°of one periodwere averaged for each of the 16 phase images. To correct dark noise, background images were recorded forOH* and CH* chemiluminescence and subtracted. Also the broad-band emission of CO2 was subtracted from OH* and CH* imagesusing the local spectra discussed above. All line-of-sight data weretransformed into local data by Abel transform. From the local OH*/CH* ratio the equivalence ratio was cal-culated according to the relations provided by other authors[31,32] resulting in a nearly uniform distribution with d=0.7, es-pecially in the area where the strongest density fluctuations wereobserved. However, it must be considered, that chemiluminescencegets altered by turbulence and strain in lean and turbulent com-bustion processes, therefore local data has to be interpreted withcare [6]. Also the combustion zone was diluted with ambient airand additionally burnt gases were mixed with reactants in the re-circulation zone. The latter may have an influence on the relationbetween OH*/CH* ratio and equivalence ratio. But since the fac-tor (y-1)/y (Table 1) and the Gladstone-Dale constant (Table2) change only slightly with equivalence ratio, the accuracy issufficient. From the equivalence ratio the molecular fractions and theGladstone-Dale constant were derived (Eq. (13)). Figure 4 plots theline-of-sight and the local distribution of the time average valuefor the total OH* chemiluminescence signal, including backgroundsubtraction and correction for the CO2 spectral signal. Additionally,the distribution of the equivalence ratio can be seen in plot (C). Assuming complete combustion, it was possible to calculate ascaling factor for the chemiluminescence images with a dimensionof W/counts. Finally, the fluctuations in heat release rate for the 16different phases of one excitation cycle were obtained by subtract-ing the averaged OH* data field from each of the 16 phase resolvedfields. Time resolved global fluctuations in heat release rate werethen calculated by integrating the intensities in each of the 16 line-of-sight OH* fields. It has to be considered, that besides the dominant excitationfrequency also higher harmonics were recorded with the ICCD. To reduce the data to the fundamental frequency, a fast Fouriertransform (FFT) was performed with the 16 single global fluctua-tion values at different time steps (phase steps),to get the phaseresolved amplitude at 212 Hz. The OH* emissions reached up to110 mm in axial and 25 mm in radial direction. The size of the combustion field had to be considered when defining the LIV mea-surement grid, which was set to a size of 30 mm in radial directionand 119 mm in height, starting 5 mm above the burner exit. Dueto the low amplitudes above a height of x=80 mm in the chemilu-minescence figures as well as in the LIV recordings, data was onlyplotted up to this distance above the burner exit. 5.2. Shearography To calculate heat release fluctuations according to Eq. (14), itis necessary to obtain density p(x,y,z) from a measurement tech-nique other than LlV, since later detects only fluctuations in den-sity. In this work shearography was chosen, a laser optical mea-surement technique using a Schlieren setup to produce a planewave front, passing through the combustion zone in z-directionwith a beam diameter much larger than the flame diameter. Thiswave front is delayed in phase by Ad(x, y) due to the change ofoptical path in the refractive index field. A small Mach-Zehnder in-terferometer shears this wave front against itself by a shear 8 -here in y-direction [33,36]. By superpositioning wave front 1 withits phase D(x, y) and the sheared front2, an interference patternforms at the interferometer exit, monitoring the phase differencebetween Di(x, y) and 2(x,y+8) for each camera pixel as inter-ference fringe pattern. This phase difference is related to the re-fractive index gradient by with △p the density changes in the field compared to ambientconditions at the outer borderline of the expanded laser beamshining through the flame. By pixel-wise integration along the y-direction for all pixels i, j with N the total number of pixels in y-direction, and 1≤i≤N,1
确定
还剩11页未读,是否继续阅读?

产品配置单


北京欧兰科技发展有限公司为您提供《无约束旋流稳定火焰中放热波动检测方案(CCD相机)》,该方案主要用于其他中放热波动检测,参考标准--,《无约束旋流稳定火焰中放热波动检测方案(CCD相机)》用到的仪器有LaVision HighSpeedStar 高帧频相机、德国LaVision PIV/PLIF粒子成像测速场仪、PLIF平面激光诱导荧光火焰燃烧检测系统、LaVision DaVis 智能成像软件平台
推荐专场
CCD相机/影像CCD
更多


相关方案
更多
该厂商其他方案
更多