
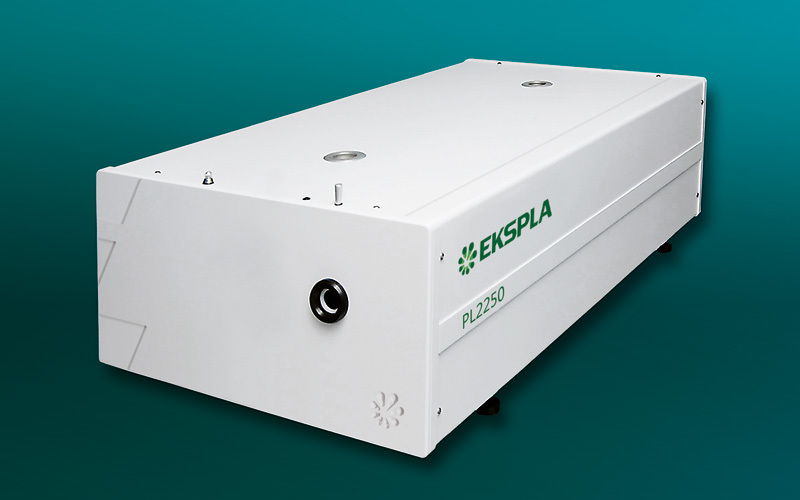


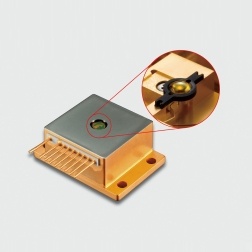
采用立陶宛Ekspla公司PL2250型皮秒脉冲Nd:YAG激光器输出的532nm和 1064nm波长,30ps脉宽,10Hz重复频率的激光脉冲,激发石墨混合物中的固体三硝基甲苯观测其拉曼和时间分辨脉冲光声光谱用于识别双共振光学声子信号。
方案详情

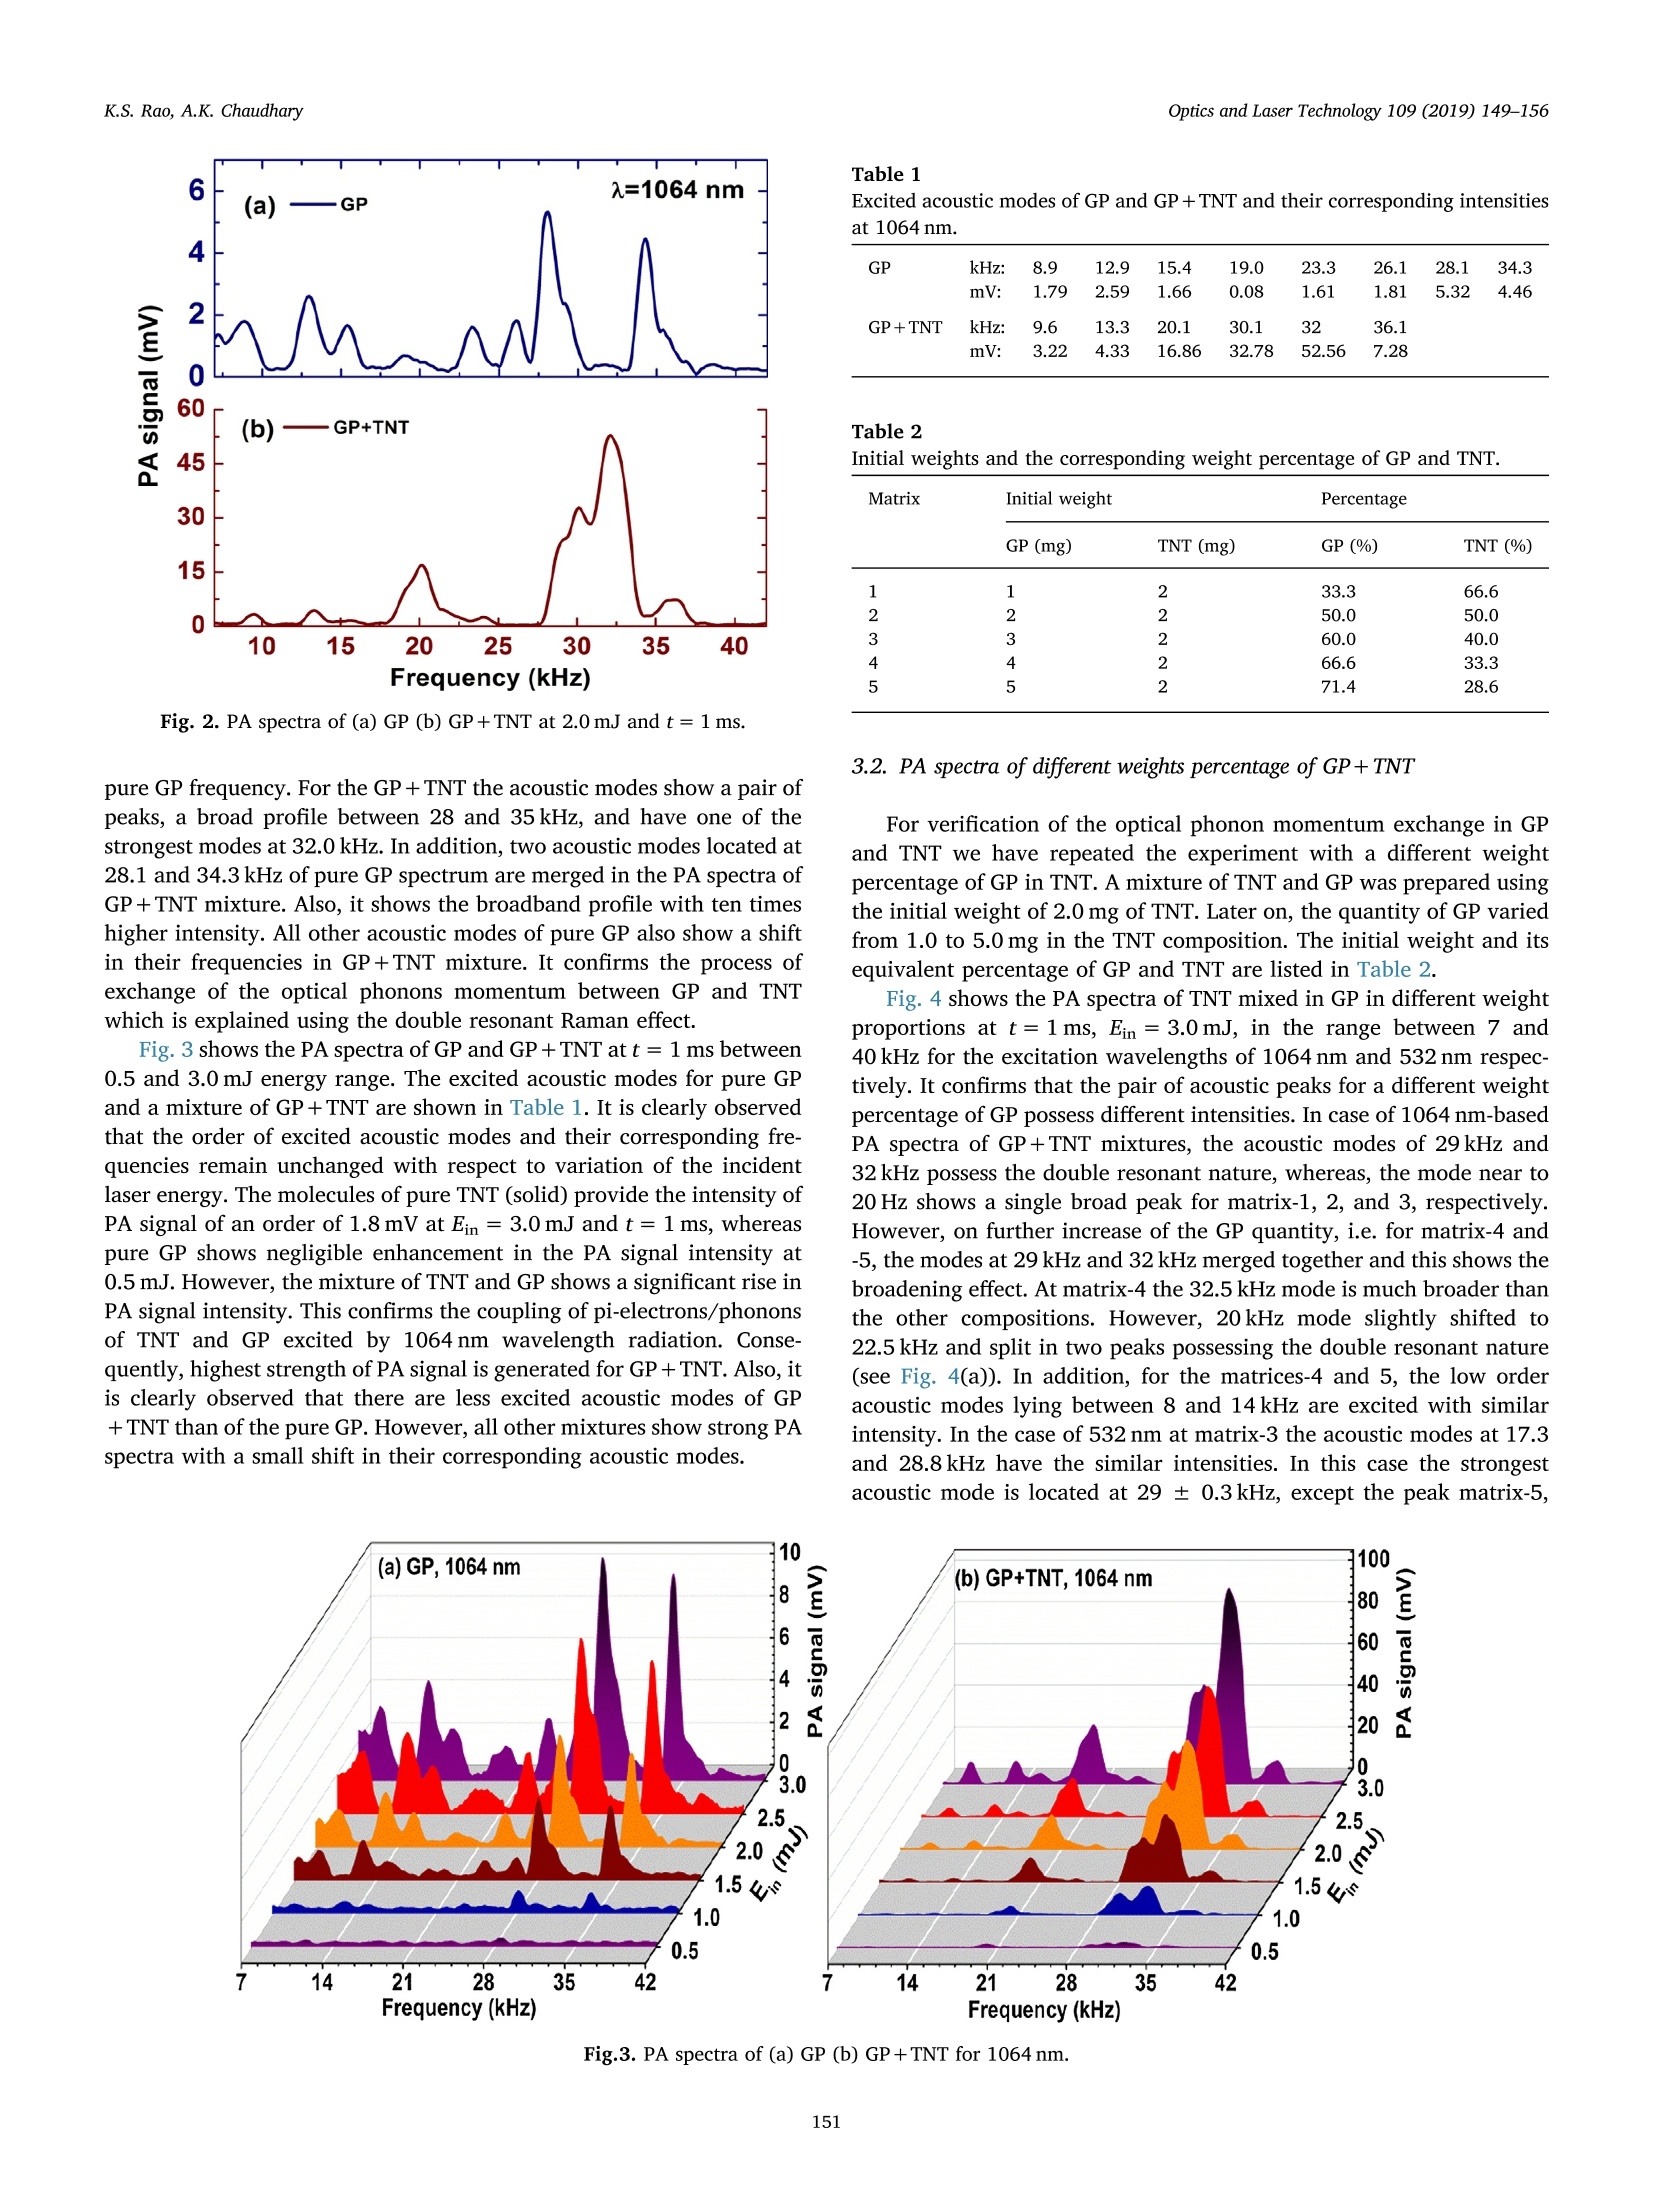
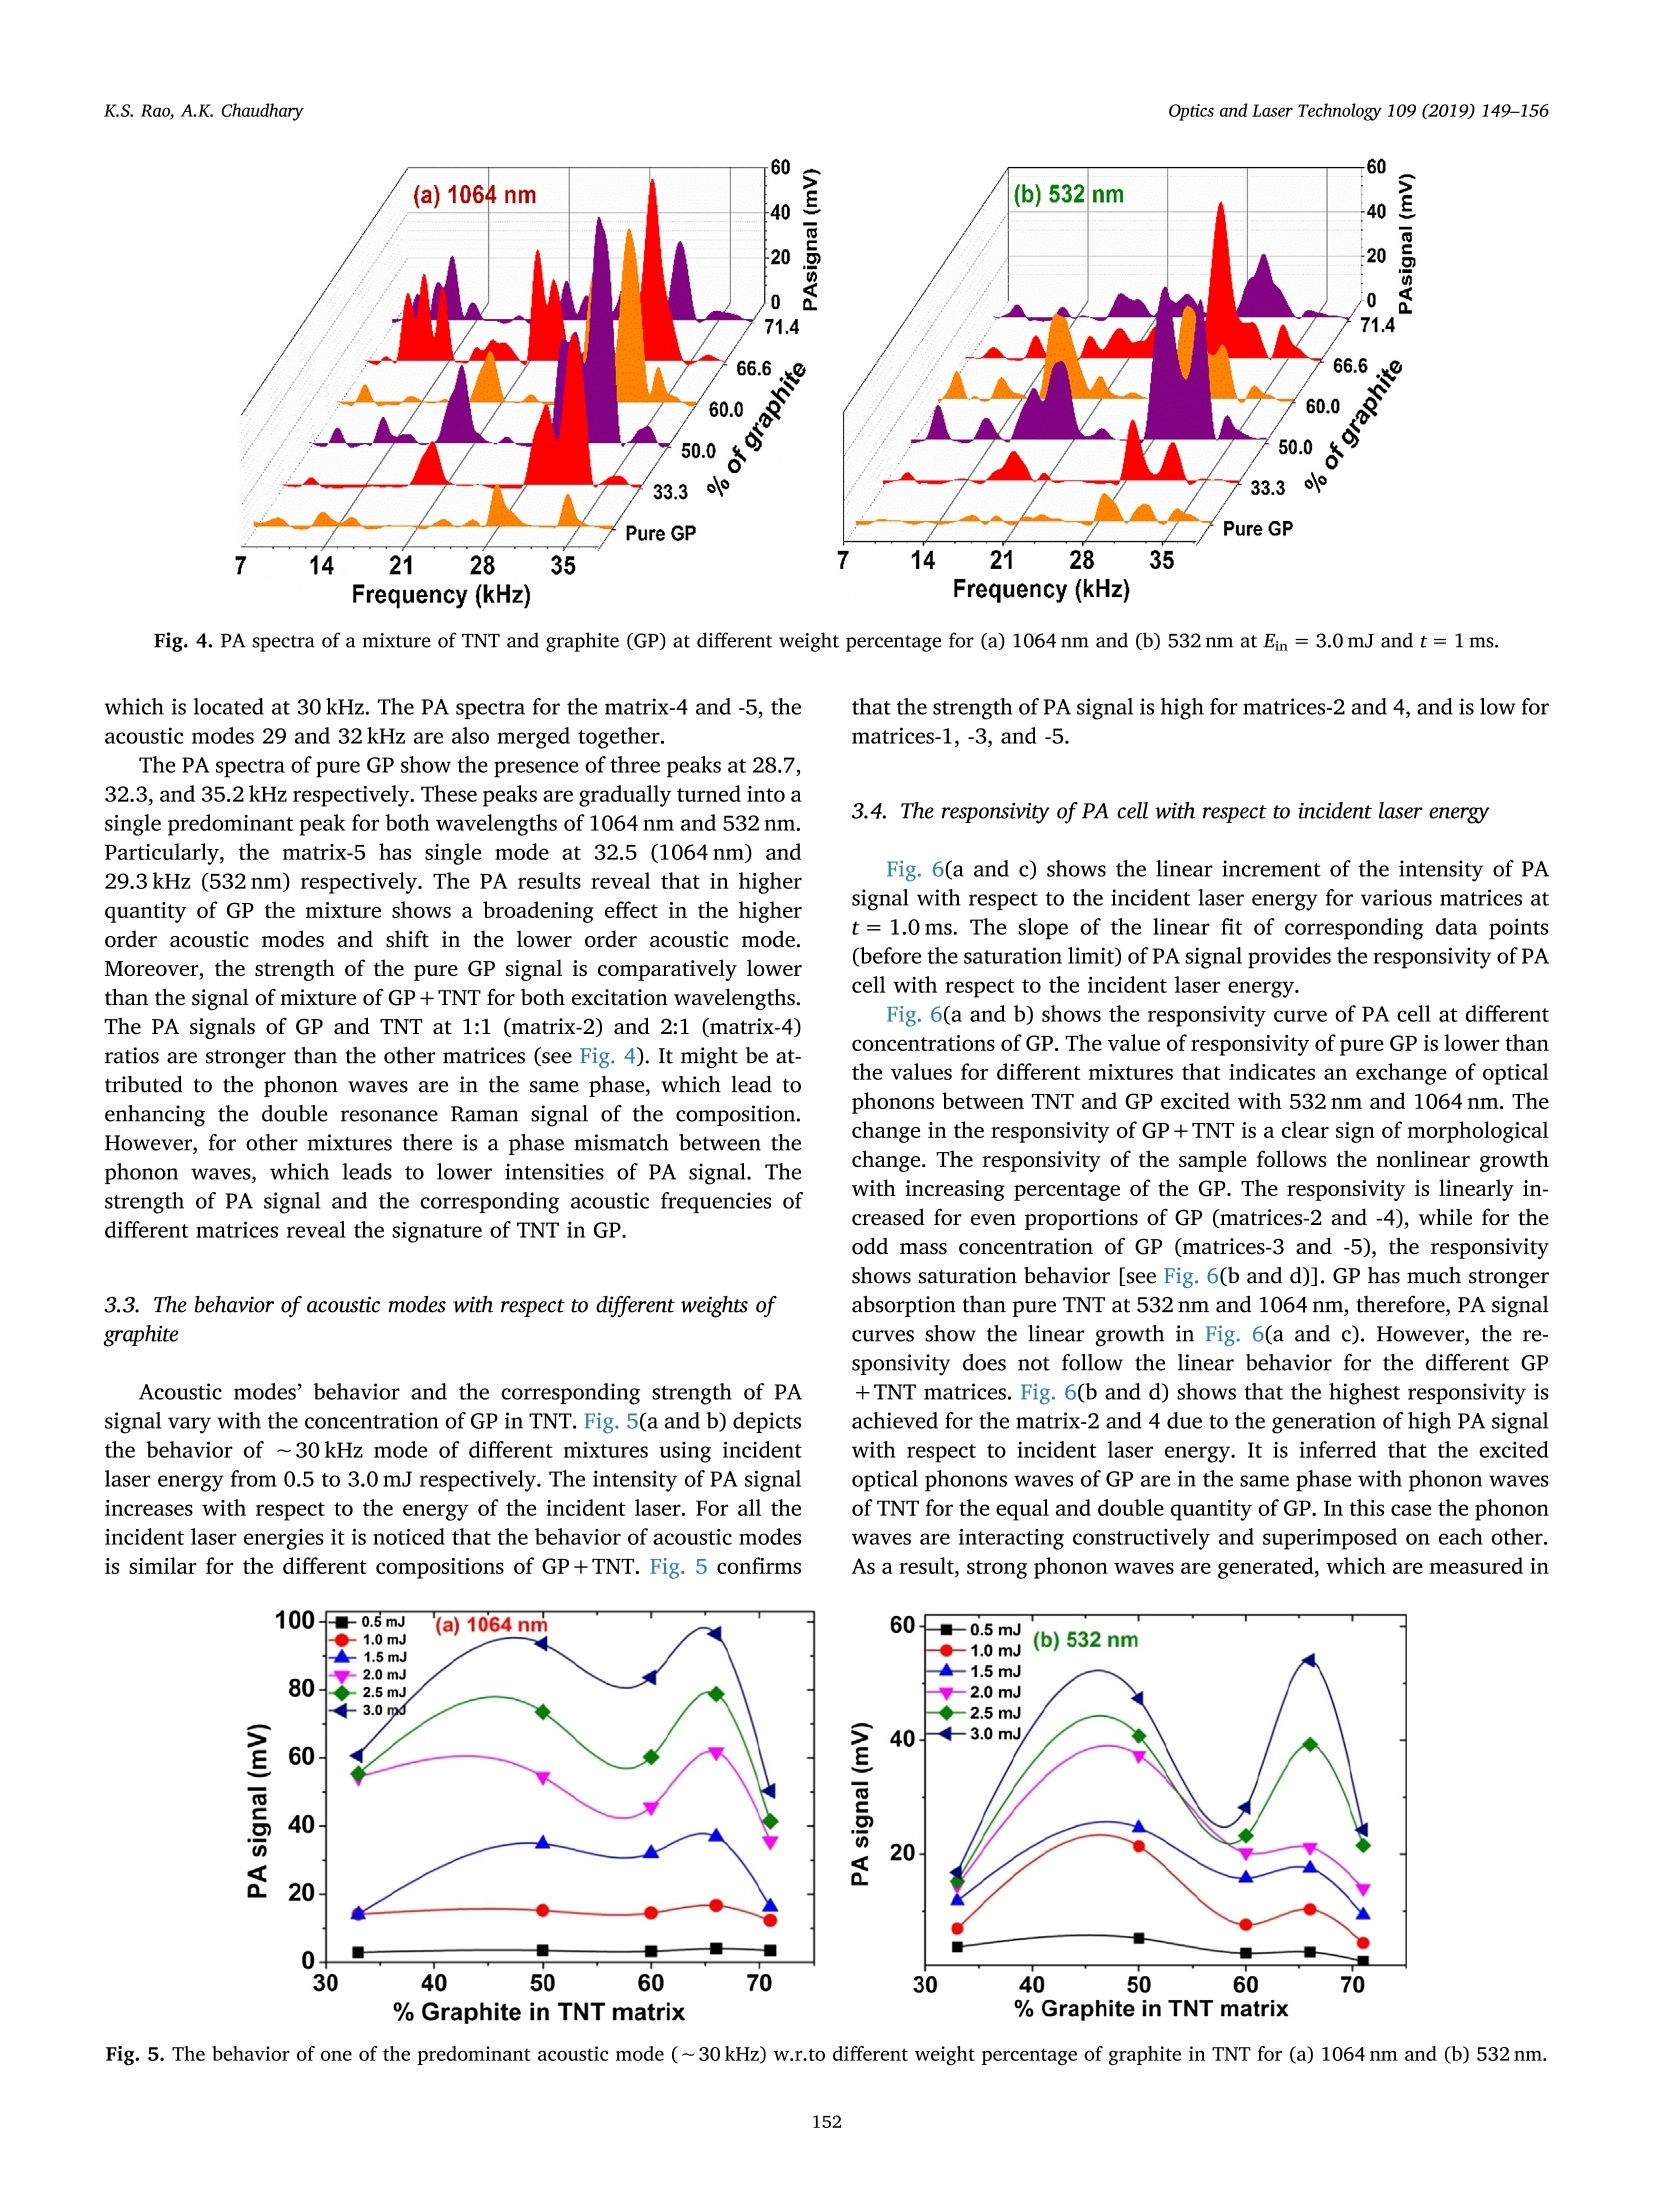
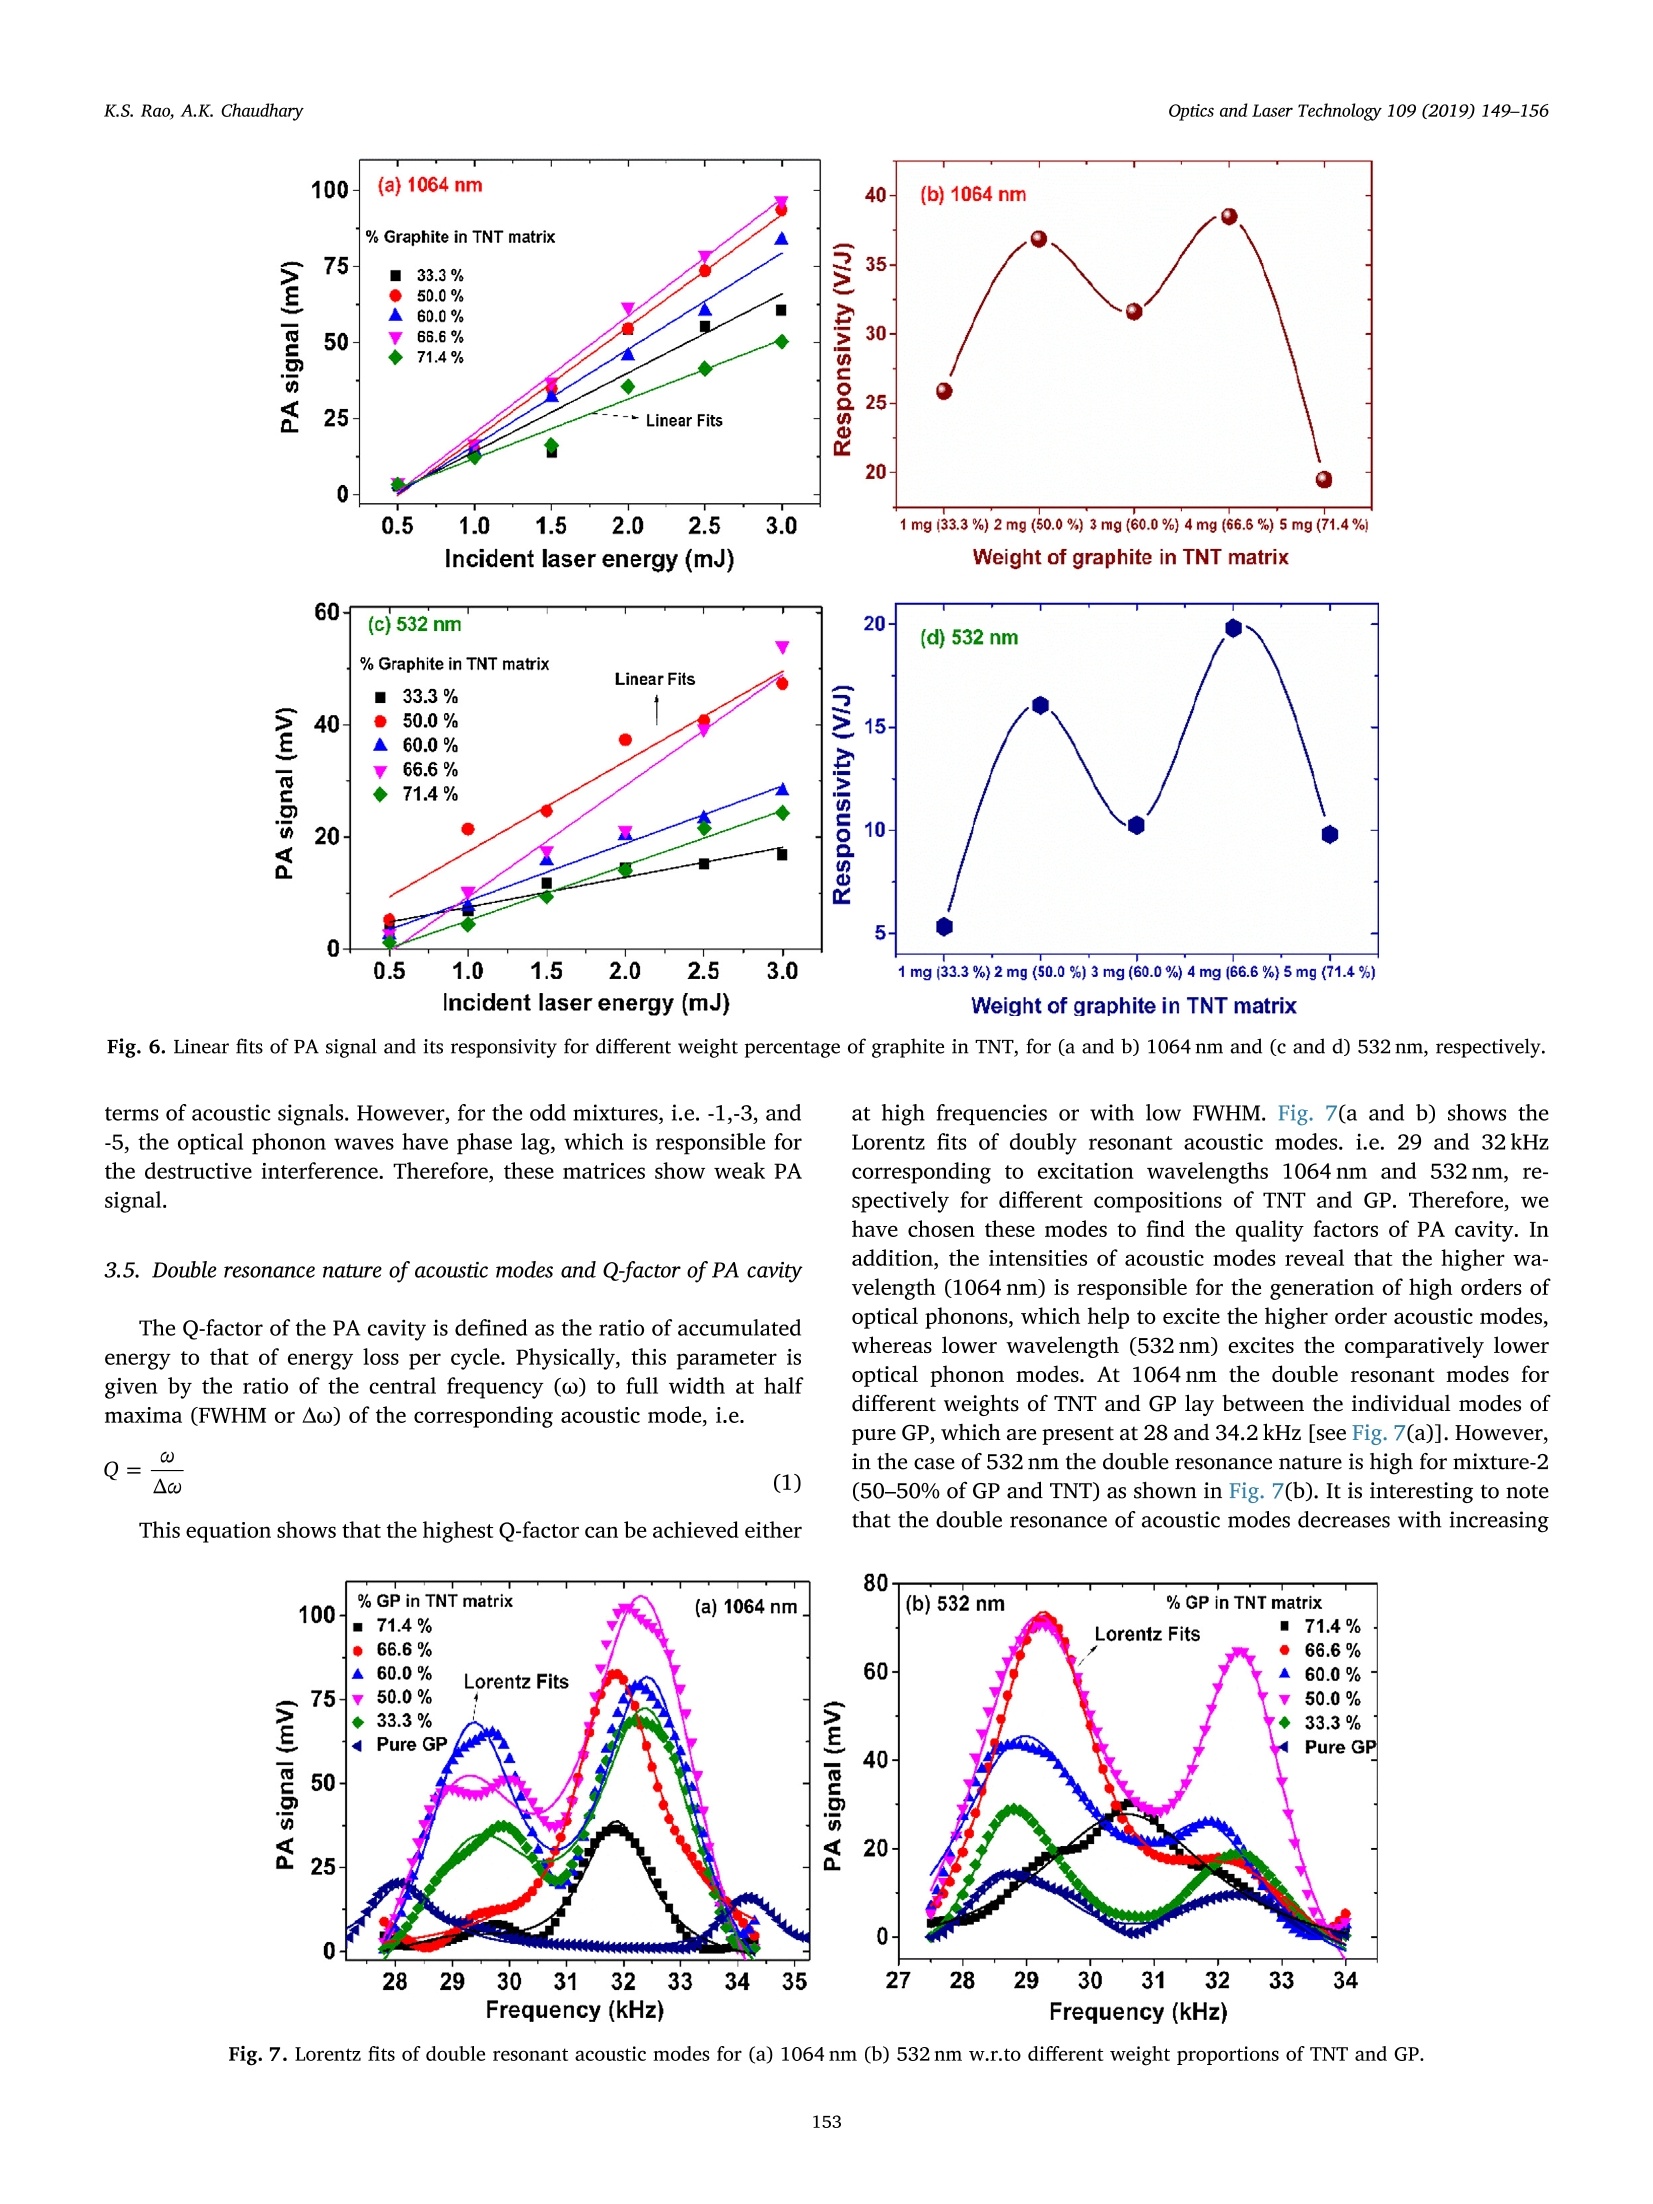
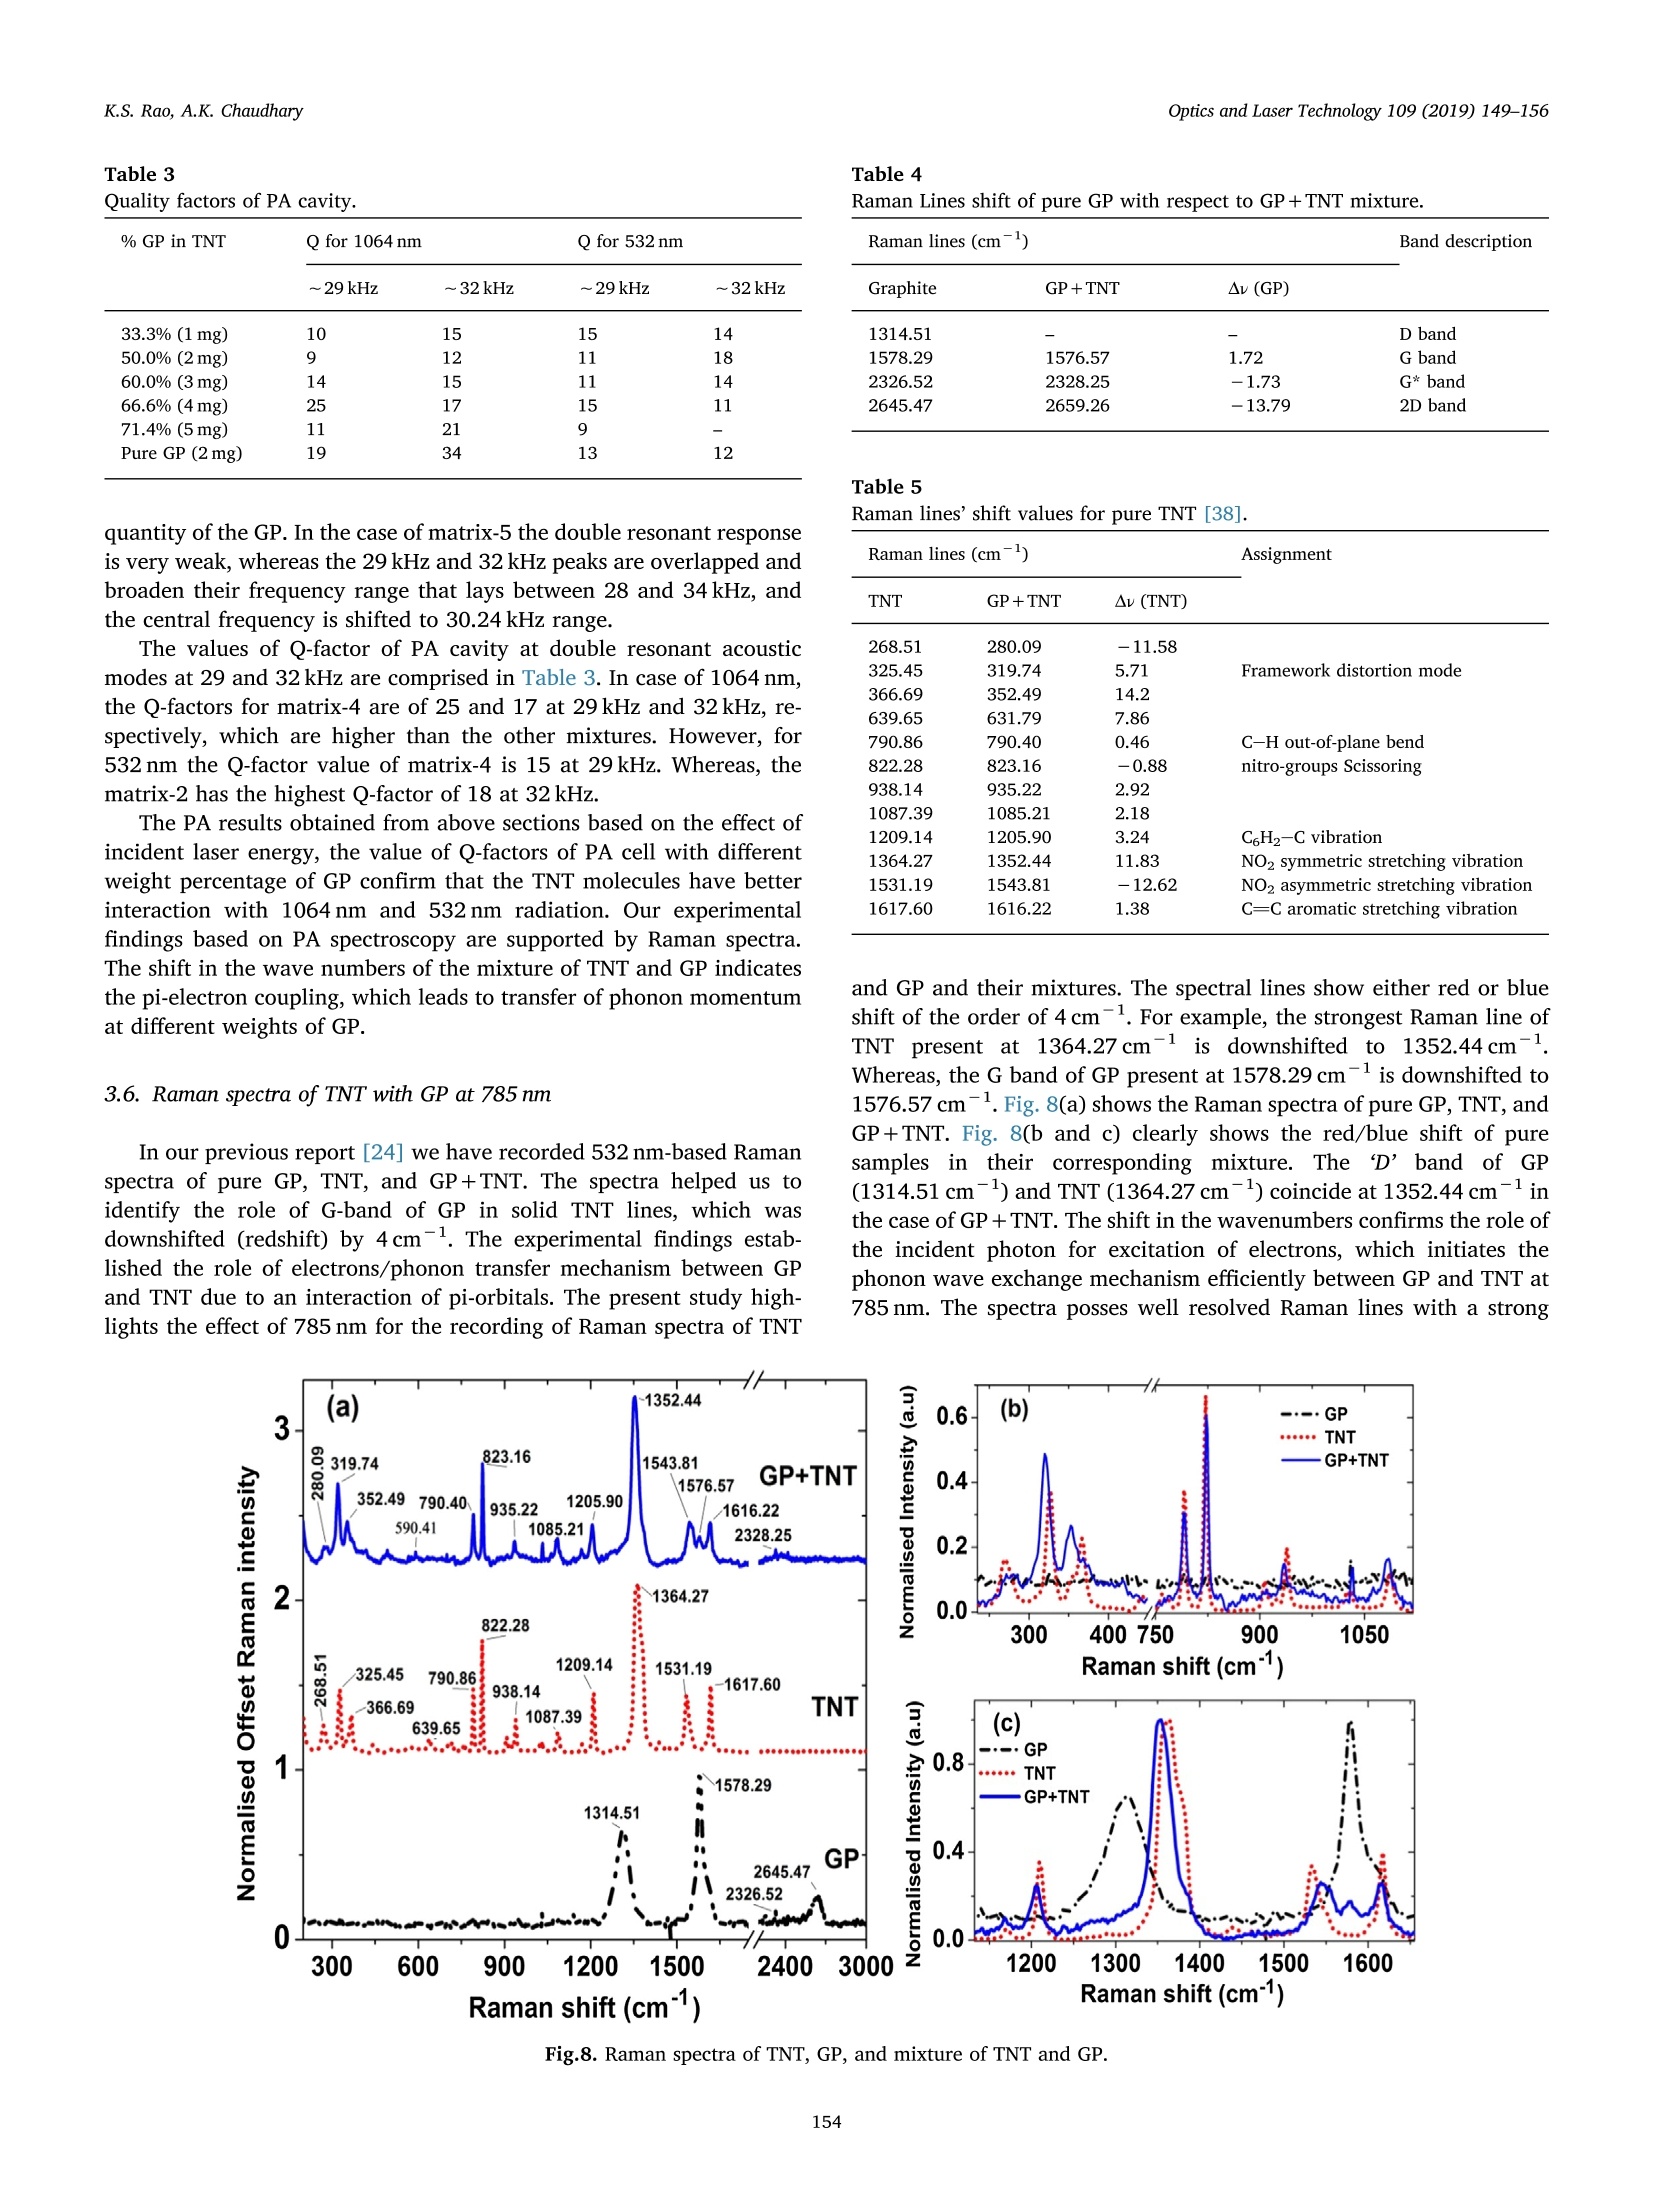
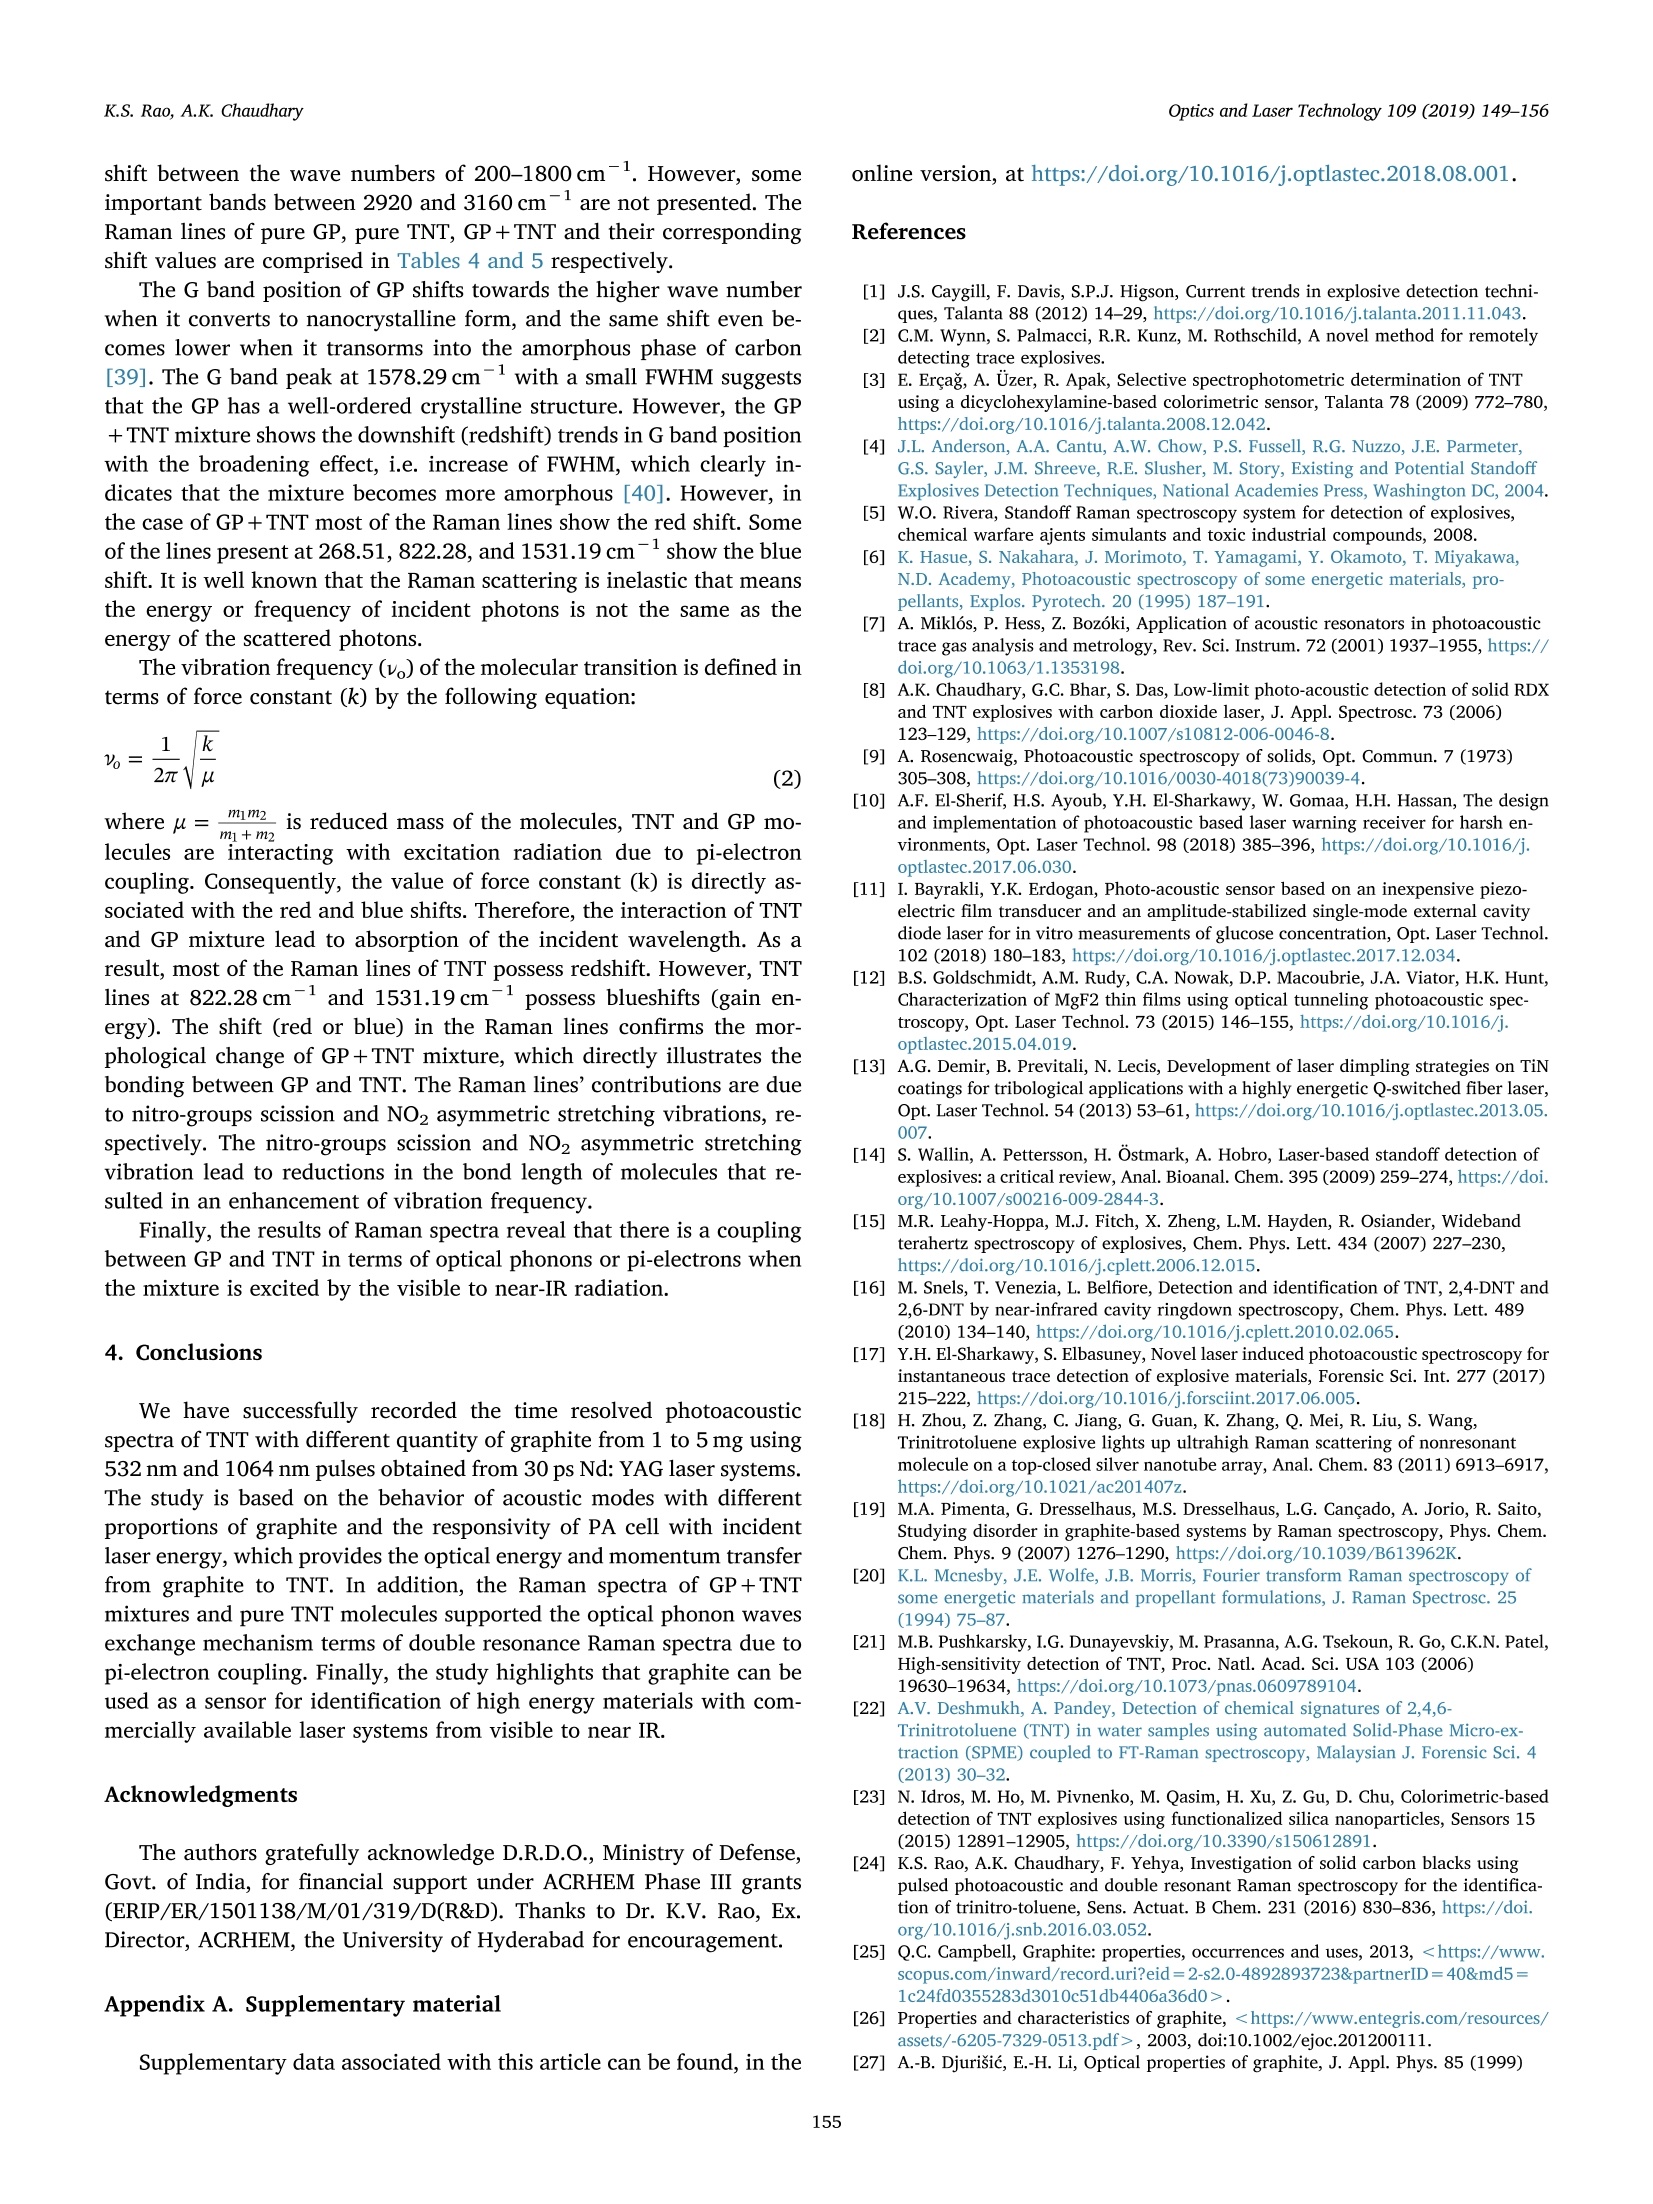
Optics and Laser Technology 109 (2019) 149-156 K.S. Rao, A.K. ChaudharyOptics and Laser Technology 109 (2019)149-156 Contents lists available at ScienceDirect Optics and Laser Technology journal homepage: www.elsevier.com/locate/optlastec Full length article Raman and time-resolved pulsed photoacoustic spectroscopy of solidtrinitrotoluene in graphite mixture: For identification of double resonantoptical phonon signatures K.S. Rao,, A.K. Chaudharya,* Advanced Center for Research in High Energy Materials (ACRHEM), University of Hyderabad, 500046, India " The Guo China-US Photonics Laboratory, Changchun Institute of Optics, Fine Mechanics and Physics, Chinese Academy of Sciences, Changchun, China HIGHLIGHTS ·Graphite as a sensor for identification of TNT using 1064 nm wavelength. · The PA study with respect to different weight percentage of graphite in TNT matrix. ·Identification of acoustic and optical phonons waves transfer mechanism between GP and TNT using 785 nm wavelength. · Development of a new tool for detection and identification of explosive molecules using commercially available laser systems. A RTICLEINFO ABSTRAC T Keywords: The optical phonon waves transfer mechanism between pure graphite (GP) and trinitrotoluene (TNT) using Raman spectra 1064 nm as an excitation wavelength based on the double resonant Raman effect and the pulsed photoacoustic Trinitrotoluene (PA) technique has been investigated. The study was carried out at a different weight percentage of GP within Graphite TNT with respect to the two excitation wavelengths of 532 nm and 1064 nm (30 ps, 10 Hz, Q-switched Nd: YAG Photoacoustic spectrum laser). The equal and double proportional matrix of the GP and TNT (solid samples) generate a strong PA signal with high quality factor (Q-factor) due to the interaction of optical phonons of GP and TNT in the same phase. The Raman spectra, recorded at 785 nm wavelength provides an insight on the pi-electron coupling between the GP and TNT. The obtained experimental results confirm that the pure GP and its derivatives, which have a SP"/ SP"hybridization, can be used to develop a new sensing optode for the detection and identification of explosive molecules in the visible and near-IR wavelengths range. 1. Introduction The detection of solid high energy materials (HEMs) or explosives invisible and NIR region using photoacoustic (PA) spectroscopy is still achallenging task due to the absence of absorption bands in this region.Many optical and chemical analytical techniques for the detection ofexplosives are reported by different groups [1-6]. These analyticaltechniques were demonstrated on the basis of the absorption or emis-sion of incident radiation from the analysts. Among all, PA spectroscopyis one of the most versatile and potent absorption-based techniquebecause it can identify molecules in the solid, liquid, and gaseous phasein trace level using deep UV, IR, and THz radiation [7-16]. High powerpulsed and CW lasers of 532 nm and 1064 nm wavelengths are easilyavailable, therefore, several researchers have demonstrated the wide range of applications in the field of laser spectroscopy for differentmaterials at these wavelengths [17-23]. In present report, we havedemonstrated the new mechanism of detection of the explosive usinggraphite (GP) as a sensing medium at 532 and 1064 nm wavelengthrange. Recently, Sharkaway et al. have reported the laser-induced PAspectroscopy for trace detection of explosives using 1064 nm obtainedfrom Nd: YAG laser, which is used in a combination of optical inter-ferometry technique [17]. However, the strength of the generatedacoustic signals was quite low. Similarly, TNT is detected by HaiboZhou et al. using ultra-high Raman scattering of off-resonated p-aminobenzenethiol (PABT) through the formation of TNT-PABT complex,where silver nanotubes arrays were used for enhancing the Ramansignal [18]. On the other hand, a double resonant Raman spectroscopy ( E-mail addresses : akcphys @ gmail.com, anilp h ys @y ahoo.com ( A.K. Chaudhary) ) ( h t t ps :// doi.o r g /1 0 .1016/j . op t l a s tec. 2 018 . 0 8 .001 ) ( Received 11 January 2 0 18; Received in revised f o rm 20 July 2018; Accepted 2 August 201 8 Available online 07 August 2018 ) ( 0030-3992/ C 2 018 Elsevier Ltd. All rights re s erved. ) is one of the attractive technique, which is widely used to investigatethe disorder and defects in the graphite-based system [19]. In addition,the detection and characterization of TNT using different optical tech-niques have been reported [16,20-23]. Mcnesby et al. have reportedthe Raman spectra of TNT and some other high-energetic materialsusing Fourier transform Raman (FTR) spectroscopy by employing near-IR laser radiation with a scattering source of 1060 nm [20]. M. Snelset al. have detected the solid explosive TNT in the near infrared spectralrange between 1560 nm and 1680 nm using CW cavity ring down (CRD)spectroscopy [16].Pushkarsky et al. demonstrated the detection of TNTusing laser-based photoacoustic technique [21]. They have exploredcontinuous-wave high-power quantum cascade laser in external gratingcavity geometry tunable up to 400 nm and extended up to 7300 nm.They have also used the flash heater to evaporate solid TNT in a CRDabsorption cell. Deshmukh et al. have investigated the TNT in watersamples collected from nearby military training center using solid phasemicroextraction technique coupled with Fourier transform Ramanspectroscopy [22]. Idros et al. demonstrated the colorimetric-baseddetection of TNT explosives using functionalized silica nanoparticles[23]. In our previous report the promising use of 532 nm wavelength toidentify the TNT in GP mixture using pulsed PA technique combinedwith double resonant Raman effect has been reported [24]. In thepresent study, we have introduced the use of fundamental wavelength(i.e. 1064 nm) of Nd: YAG laser system of pulse duration of 30 ps and10 Hz repetition rate for recording of characteristic PA spectra of TNTin different weight percentage of GP. In addition, the Raman spectra ofGP, TNT, and GP+TNT at 785 nm wavelength have been recorded. Thegeneration of PA signal from TNT in GP matrix is going to open a newchannel of research in explosive detection. Pure GP does not emit any light photons because there is no tran-sition between the conduction and valence energy bands. But it stronglyemits thermal radiation, which falls in the far infrared region.Therefore, source medium GP plays an important role in interactionwith the carbon in C-H-O group of TNT molecules. In the case of TNT,two energy bands (Raman bands) are generated due to NO2 and cyclicaromatic ring, while for GP it is attributed to D-band. The carbon atomsof GP are arranged in a hexagonal structure, where one carbon atomforms a covalent bond with three surrounding atoms [25]. It is well-known that carbon has valence of 4 and it can make four bonds. In thecase of GP three electrons of carbon form three bonds among them-selves, and the other free electron floats freely between two layers ofcarbon plates as shown in Fig.1(a). This free electron is delocalized andmobile by nature. Thus, it can conduct the electricity and give the GPthe property of an electric conductor despite being a non-metal. A forcecreated between these two layers of carbon with the aid of the electronsis known as Van Der Waal force [26,27]. Graphene is a two-dimensional(2D) building block for carbon allotropes of every other dimensionality. Fig. 1. The structure of (a) graphite and (b) trinitrotoluene (TNT). It can be stacked into 3D graphite, rolled into 1D nanotube, or wrappedinto 0D fullerenes. The G and 2D Raman peaks change their shape,position, and relative intensity with respect to the number of graphenelayers. Also, it reflects the evolution of the electronic structure andelectron-phonon interactions. The origin of the D and G bands alongwith second-order D peak of graphene has been studied in [28]. The broad range of excitation energy of GP lies between 1.91 eV(649nm) and 2.52 eV (488nm) that shows the first and second-orderRaman spectra of the GP respectively [28-33].Raman spectroscopy is awell-established tool for vibration spectroscopic analysis and is em-ployed for the identification and detection of explosives [20,34-37].Wang et al. [29] have analyzed the Raman spectra of industrial TNTdissolved in acetone and reported seven major bands. They have used1064 nm wavelength obtained from the diode-pumped Nd:YVO4 solidlaser as an excitation source. The 2D GP structure consists of twocarbon atoms per unit cell, which are associated with six numbers ofphonon modes. Among them, three belong to acoustic (A), and theother three to optic (O) phonon modes. The optic phonon modes arefurther divided into out of plane (OT) phonon mode, one longitudinal(L), and the other one transverse (iTO) [19]. The optical/acoustic phonons are responsible for transferring thevibrational energy and momentum from GP to TNT. This phenomenonwas also perceived in the Raman spectra of samples. In this case, theshift in D and G bands of GP, as well as TNT bands in the GP+TNTmixture was observed. This is the indication of coupling of pi-electronsbetween GP and TNT (due to electron-phonon or phonon-phonon in-teractions) that leads to transfer the phonon waves momentum from GPto TNT.As a result, TNT can absorb the incident radiation that leads togeneration of strong PA signal. The present study revealed that near-IRwavelengths could also be useful to identify solid TNT and other HEMsin the presence of GP using pulsed PA spectroscopy. 2. Experimental arrangements The experiment was performed in three steps. In the first step, themixture of TNT and GP were prepared in different weight proportions.The powder samples were converted into a circular disk of variablethickness in the form of pellets using two tons of pressure. In the secondstep, the mixture was placed in an aluminum cubic shaped PA cell oflength 5 cm, width 5 cm, and height 6 cm. The fundamental and thesecond harmonic wavelengths, i.e. 1064 nm and 532 nm, obtained fromQ-switched Nd: YAG laser of 30 ps duration at 10 Hz (PL-2250 Ekspla,Lithuania) were employed to excite the mixture of TNT and GP. Thegenerated PA signal was recorded using a pre-polarized microphone(BSW, China), which was housed in a teflon (PTFE) jacket and placed ata distance of 1.0 cm from the sample cavity. The distance between thecenter of the sample and the microphone head was 2.2 cm. An alu-minum plate had a window of one-inch diameter glass/quartz coveredwith a neoprene washer, which was used to cover the cavity. Thegenerated PA signal was amplified using a preamplifier and fed to thedigital storage oscilloscope (Tektronix, 200 MHz) for the recording ofthe time domain signal. The oscilloscope was connected to the personalcomputer, which has a data acquisition program developed usingLabView software. In the third step pure TNT & GP and their mixtureswere subjected to portable Raman spectrometer, 7=785nm (B &WTek, USA) for the recording of Raman spectra. 3. Results and discussion 3.1. 1064nm based photoacoustic spectra of TNT with GP Fig. 2(a and b) shows the PA spectra of a pure GP (2mg) andcomposite (GP+TNT, 1:1 ratio by weight) respectively. The PA spectraare recorded at data acquisition time t=1ms and at incident laserenergy Ein =2.0 mJ. The excited acoustic modes for the matrix of GPand TNT (GP +TNT) show the shift in the frequency with respect to the Fig. 2. PA spectra of (a) GP (b) GP+TNT at 2.0 mJ and t=1 ms. pure GP frequency. For the GP+TNT the acoustic modes show a pair ofpeaks, a broad profile between 28 and 35 kHz, and have one of thestrongest modes at 32.0 kHz. In addition, two acoustic modes located at28.1 and 34.3 kHz of pure GP spectrum are merged in the PA spectra ofGP+TNT mixture. Also, it shows the broadband profile with ten timeshigher intensity. All other acoustic modes of pure GP also show a shiftin their frequencies in GP+TNT mixture. It confirms the process ofexchange of the optical phonons momentum between GP and TNTwhich is explained using the double resonant Raman effect. Fig. 3 shows the PA spectra of GP and GP+TNT at t=1 ms between0.5 and 3.0 mJ energy range.The excited acoustic modes for pure GPand a mixture of GP+TNT are shown in Table 1. It is clearly observedthat the order of excited acoustic modes and their corresponding fre-quencies remain unchanged with respect to variation of the incidentlaser energy. The molecules of pure TNT (solid) provide the intensity ofPA signal of an order of 1.8 mV at Ein =3.0 mJ and t=1 ms, whereaspure GP shows negligible enhancement in the PA signal intensity at0.5 mJ. However, the mixture of TNT and GP shows a significant rise inPA signal intensity. This confirms the coupling of pi-electrons/phononsof TNT and GP excited by 1064 nm wavelength radiation. Conse-quently, highest strength of PA signal is generated for GP+TNT. Also, itis clearly observed that there are less excited acoustic modes of GP+TNT than of the pure GP. However, all other mixtures show strong PAspectra with a small shift in their corresponding acoustic modes. Table 1 Excited acoustic modes of GP and GP+TNT and their corresponding intensitiesat 1064nm. GP kHz: 8.9 12.9 15.4 19.0 23.3 26.1 28.1 34.3 GP+TNT mV: 1.79 2.59 1.66 0.08 1.61 1.81 5.32 4.46 kHz: 9.6 13.3 20.1 30.1 32 36.1 mV: 3.22 4.33 16.86 32.78 52.56 7.28 Table 2 Initial weights and the corresponding weight percentage of GP and TNT. Matrix Initial weight Percentage GP (mg) TNT (mg) GP (%) TNT (%) 1 1 2 33.3 66.6 2 2 2 50.0 50.0 3 3 2 60.0 40.0 4 4 2 66.6 33.3 5 5 2 71.4 28.6 3.2. PA spectra of different weights percentage of GP+TNT For verification of the optical phonon momentum exchange in GPand TNT we have repeated the experiment with a different weightpercentage of GP in TNT. A mixture of TNT and GP was prepared usingthe initial weight of 2.0 mg of TNT. Later on, the quantity of GP variedfrom 1.0 to 5.0 mg in the TNT composition. The initial weight and itsequivalent percentage of GP and TNT are listed in Table 2. Fig. 4 shows the PA spectra of TNT mixed in GP in different weightproportions at t=1 ms, Ein =3.0 mJ, in the range between 7 and40kHz for the excitation wavelengths of 1064 nm and 532 nm respec-tively. It confirms that the pair of acoustic peaks for a different weightpercentage of GP possess different intensities. In case of 1064 nm-basedPA spectra of GP+TNT mixtures, the acoustic modes of 29 kHz and32 kHz possess the double resonant nature, whereas, the mode near to20 Hz shows a single broad peak for matrix-1, 2, and 3, respectively.However, on further increase of the GP quantity, i.e. for matrix-4 and-5,the modes at 29 kHz and 32 kHz merged together and this shows thebroadening effect. At matrix-4 the 32.5 kHz mode is much broader thanthe other compositions. However, 20 kHz mode slightly shifted to22.5 kHz and split in two peaks possessing the double resonant nature(see Fig. 4(a)). In addition, for the matrices-4 and 5, the low orderacoustic modes lying between 8 and 14kHz are excited with similarintensity. In the case of 532 nm at matrix-3 the acoustic modes at 17.3and 28.8kHz have the similar intensities. In this case the strongestacoustic mode is located at 29 ±0.3kHz, except the peak matrix-5, Frequency (kHz) Fig.3. PA spectra of (a) GP (b) GP+TNT for 1064 nm. Fig. 4. PA spectra of a mixture of TNT and graphite (GP) at different weight percentage for (a) 1064 nm and (b) 532 nm at Ein = 3.0 mJ and t= 1 ms. which is located at 30 kHz. The PA spectra for the matrix-4 and-5, theacoustic modes 29 and 32 kHz are also merged together. The PA spectra of pure GP show the presence of three peaks at 28.7,32.3, and 35.2 kHz respectively. These peaks are gradually turned into asingle predominant peak for both wavelengths of 1064 nm and 532 nm.Particularly, the matrix-5 has single mode at 32.5 (1064 nm) and29.3 kHz (532 nm) respectively. The PA results reveal that in higherquantity of GP the mixture shows a broadening effect in the higherorder acoustic modes and shift in the lower order acoustic mode.Moreover, the strength of the pure GP signal is comparatively lowerthan the signal of mixture of GP+TNT for both excitation wavelengths.The PA signals of GP and TNT at 1:1 (matrix-2) and 2:1 (matrix-4)ratios are stronger than the other matrices (see Fig. 4). It might be at-tributed to the phonon waves are in the same phase, which lead toenhancing the double resonance Raman signal of the composition.However, for other mixtures there is a phase mismatch between thephonon waves, which leads to lower intensities of PA signal. Thestrength of PA signal and the corresponding acoustic frequencies ofdifferent matrices reveal the signature of TNT in GP. 3.3. The behavior of acoustic modes with respect to different weights ofgraphite Acoustic mode’behavior and the corresponding strength of PAsignal vary with the concentration of GP in TNT. Fig. 5(a and b) depictsthe behavior of ~30 kHz mode of different mixtures using incidentlaser energy from 0.5 to 3.0 mJ respectively. The intensity of PA signalincreases with respect to the energy of the incident laser. For all theincident laser energies it is noticed that the behavior of acoustic modesis similar for the different compositions of GP+TNT. Fig.5 confirms that the strength of PA signal is high for matrices-2 and 4, and is low formatrices-1,-3, and -5. 3.4. The responsivity of PA cell with respect to incident laser energy Fig. 6(a and c) shows the linear increment of the intensity of PAsignal with respect to the incident laser energy for various matrices att=1.0 ms. The slope of the linear fit of corresponding data points(before the saturation limit) of PA signal provides the responsivity of PAcell with respect to the incident laser energy. Fig.6(a and b) shows the responsivity curve of PA cell at differentconcentrations of GP. The value of responsivity of pure GP is lower thanthe values for different mixtures that indicates an exchange of opticalphonons between TNT and GP excited with 532 nm and 1064 nm. Thechange in the responsivity of GP+TNT is a clear sign of morphologicalchange. The responsivity of the sample follows the nonlinear growthwith increasing percentage of the GP. The responsivity is linearly in-creased for even proportions of GP (matrices-2 and -4), while for theodd mass concentration of GP (matrices-3 and -5), the responsivityshows saturation behavior [see Fig.6(b and d)]. GP has much strongerabsorption than pure TNT at 532 nm and 1064 nm therefore, PA signalcurves show the linear growth in Fig. 6(a and c). However, the re-sponsivity does not follow the linear behavior for the different GP+TNT matrices. Fig. 6(b and d) shows that the highest responsivity isachieved for the matrix-2 and 4 due to the generation of high PA signalwith respect to incident laser energy. It is inferred that the excitedoptical phonons waves of GP are in the same phase with phonon wavesof TNT for the equal and double quantity of GP. In this case the phononwaves are interacting constructively and superimposed on each other.As a result, strong phonon waves are generated, which are measured in Fig. 5. The behavior of one of the predominant acoustic mode (~30 kHz) w.r.to different weight percentage of graphite in TNT for (a) 1064 nm and (b) 532 nm. (a) 1064 nm Incident laser energy (mJ) Weight of graphite in TNT matrix Fig. 6. Linear fits of PA signal and its responsivity for different weight percentage of graphite in TNT, for (a and b) 1064 nm and (c and d) 532 nm, respectively. terms of acoustic signals. However, for the odd mixtures,i.e. -1,-3, andS.-5, the optical phonon waves have phase lag, which is responsible forthe destructive interference. Therefore, these matrices show weak PAsignal. 3.5. Double resonance nature of acoustic modes and Q-factor of PA cavity The Q-factor of the PA cavity is defined as the ratio of accumulatedenergy to that of energy loss per cycle. Physically, this parameter isgiven by the ratio of the central frequency (ω) to full width at halfmaxima (FWHM or Ao) of the corresponding acoustic mode, i.e. This equation shows that the highest Q-factor can be achieved either at high frequencies or with low FWHM. Fig. 7(a and b) shows theLorentz fits of doubly resonant acoustic modes. i.e. 29 and 32 kHzcorresponding to excitation wavelengths 1064 nm and 532nm, re-spectively for different compositions of TNT and GP. Therefore, wehave chosen these modes to find the quality factors of PA cavity. Inaddition, the intensities of acoustic modes reveal that the higher wa-velength (1064 nm) is responsible for the generation of high orders ofoptical phonons, which help to excite the higher order acoustic modes,whereas lower wavelength (532 nm) excites the comparatively loweroptical phonon modes. At 1064 nm the double resonant modes fordifferent weights of TNT and GP lay between the individual modes ofpure GP, which are present at 28 and 34.2 kHz [see Fig.7(a)]. However,in the case of 532 nm the double resonance nature is high for mixture-2(50-50% of GP and TNT) as shown in Fig. 7(b). It is interesting to notethat the double resonance of acoustic modes decreases with increasing Fig.7. Lorentz fits of double resonant acoustic modes for (a) 1064 nm (b) 532 nm w.r.to different weight proportions of TNT and GP. Table 3Quality factors of PA cavity. % GP in TNT Q for 1064 nm Q for 532 nm ~29 kHz ~32 kHz ~29 kHz ~32kHz 33.3%(1 mg) 10 14 50.0%(2 mg) 9 18 60.0%(3mg) 14 66.6% (4mg) 11 71.4% (5mg) 9 一 Pure GP (2mg) 13 12 quantity of the GP. In the case of matrix-5 the double resonant responseis very weak, whereas the 29 kHz and 32 kHz peaks are overlapped andbroaden their frequency range that lays between 28 and 34 kHz, andthe central frequency is shifted to 30.24 kHz range. The values of Q-factor of PA cavity at double resonant acousticmodes at 29 and 32 kHz are comprised in Table 3. In case of 1064 nm,the Q-factors for matrix-4 are of 25 and 17 at 29kHz and 32 kHz, re-spectively, which are higher than the other mixtures. However, for532 nm the Q-factor value of matrix-4 is 15 at 29 kHz. Whereas, thematrix-2 has the highest Q-factor of 18 at 32kHz. The PA results obtained from above sections based on the effect ofincident laser energy, the value of Q-factors of PA cell with differentweight percentage of GP confirm that the TNT molecules have betterinteraction with 1064nm and 532nm radiation. Our experimentalfindings based on PA spectroscopy are supported by Raman spectra.The shift in the wave numbers of the mixture of TNT and GP indicatesthe pi-electron coupling, which leads to transfer of phonon momentumat different weights of GP. 3.6. Raman spectra of TNT with GP at 785 nm In our previous report [24] we have recorded 532 nm-based Ramanspectra of pure GP, TNT, and GP+TNT. The spectra helped us toidentify the role of G-band of GP in solid TNT lines, which wasdownshifted (redshift) by 4 cm. The experimental findings estab-lished the role of electrons/phonon transfer mechanism between GPand TNT due to an interaction of pi-orbitals. The present study high-lights the effect of 785 nm for the recording of Raman spectra of TNT Table 4Raman Lines shift of pure GP with respect to GP+TNT mixture. Raman lines (cm) Band description Graphite GP+TNT Av (GP) 1314.51 一 D band 1578.29 1576.57 1.72 G band 2326.52 2328.25 -1.73 G* band 2645.47 2659.26 -13.79 2D band Table 5Raman lines’shift values for pure TNT [38]. Raman lines (cm) Assignment TNT GP+TNT Av (TNT) 268.51 280.09 -11.58 325.45 319.74 5.71 Framework distortion mode 366.69 352.49 14.2 639.65 631.79 7.86 790.86 790.40 0.46 C-H out-of-plane bend 822.28 823.16 -0.88 nitro-groups Scissoring 938.14 935.22 2.92 1087.39 1085.21 2.18 1209.14 1205.90 3.24 C6H2-C vibration 1364.27 1352.44 11.83 NO2 symmetric stretching vibration 1531.19 1543.81 -12.62 NO2 asymmetric stretching vibration 1617.60 1616.22 1.38 C=C aromatic stretching vibration and GP and their mixtures. The spectral lines show either red or blueshift of the order of 4 cm. For example, the strongest Raman line ofTNT present at 1364.27 cm is downshifted to 1352.44 cm.Whereas, the G band of GP present at 1578.29 cmis downshifted to1576.57 cm. Fig.8(a) shows the Raman spectra of pure GP, TNT, andGP+TNT. Fig. 8(b andc) clearly shows the red/blue shift of puresamples in itheir corresponding mixture. The‘D’band1 of GP(1314.51 cm-1) and TNT (1364.27 cm-1) coincide at1352.44 cm-1inthe case of GP+TNT. The shift in the wavenumbers confirms the role ofthe incident photon for excitation of electrons, which initiates thephonon wave exchange mechanism efficiently between GP and TNT at785 nm. The spectra posses well resolved Raman lines with a strong Fig.8. Raman spectra of TNT, GP, and mixture of TNT and GP. shift between the wave numbers of 200-1800 cm. However, someimportant bands between 2920 and 3160 cm-1 are not presented. TheRaman lines of pure GP, pure TNT, GP+TNT and their correspondingshift values are comprised in Tables 4 and 5 respectively. The G band position of GP shifts towards the higher wave numberwhen it converts to nanocrystalline form, and the same shift even be-comes lower when it transorms into the amorphous phase of carbon[39]. The G band peak at 1578.29 cm-1 with a small FWHM suggeststhat the GP has a well-ordered crystalline structure. However, the GP+TNT mixture shows the downshift (redshift) trends in G band positionwith the broadening effect, i.e. increase of FWHM, which clearly in-dicates that the mixture becomes more amorphous [40]. However, inthe case of GP+TNT most of the Raman lines show the red shift. Someof the lines present at 268.51,822.28, and 1531.19 cm- show the blueshift. It is well known that the Raman scattering is inelastic that meansthe energy or frequency of incident photons is not the same as theenergy of the scattered photons. The vibration frequency(v。) of the molecular transition is defined interms of force constant (k) by the following equation: where u=mim2-is reduced mass of the molecules, TNT and GP mo-:m+m2lecules are interacting with excitation radiation due to pi-electroncoupling. Consequently, the value of force constant (k) is directly as-sociated with the red and blue shifts. Therefore, the interaction of TNTand GP mixture lead to absorption of the incident wavelength. As aresult, most of the Raman lines of TNT possess redshift. However, TNTlines at 822.28 cm-and 1531.19 cm- possess blueshifts (gain en-ergy). The shift (red or blue) in the Raman lines confirms the mor-phological change of GP+TNT mixture, which directly illustrates thebonding between GP and TNT. The Raman lines’contributions are dueto nitro-groups scission and NO2 asymmetric stretching vibrations, re-spectively. The nitro-groups scission and NO2 asymmetric stretchingvibration lead to reductions in the bond length of molecules that re-sulted in an enhancement of vibration frequency. Finally, the results of Raman spectra reveal that there is a couplingbetween GP and TNT in terms of optical phonons or pi-electrons whenthe mixture is excited by the visible to near-IR radiation. .4. Conclusions We have successfully recorded the time resolved photoacousticspectra of TNT with different quantity of graphite from 1 to 5 mg using532 nm and 1064 nm pulses obtained from 30 ps Nd: YAG laser systems.The study is based on the behavior of acoustic modes with differentproportions of graphite and the responsivity of PA cell with incidentlaser energy, which provides the optical energy and momentum transferfrom graphite to TNT. In addition, the Raman spectra of GP+TNTmixtures and pure TNT molecules supported the optical phonon wavesexchange mechanism terms of double resonance Raman spectra due topi-electron coupling. Finally, the study highlights that graphite can beused as a sensor for identification of high energy materials with com-mercially available laser systems from visible to near IR. Acknowledgments The authors gratefully acknowledge D.R.D.O., Ministry of Defense,Govt. of India, for financial support under ACRHEM Phase III grants(ERIP/ER/1501138/M/01/319/D(R&D). Thanks to Dr. K.V. Rao, Ex.Director, ACRHEM, the University of Hyderabad for encouragement. Appendix A. Supplementary material Supplementary data associated with this article can be found, in the ( References ) ( [1] J .S. Caygill, F. Davis, S.P.J. Higson, Current trends i n explosive d e tection techni- ) ques, Talanta 88 (2012) 14-29, https://doi.org/10.1016/j.talanta.2011.11.043. [2]C(.M. Wynn, S. Palmacci, R.R. Kunz, M. Rothschild, A novel method for remotelydetecting trace explosives. ( [3] E . E rcag, A. U zer, R. A pak, Selective spectrophotometric de t ermination of T NT u sing a dicyclohexylamine-based colorimetric sensor, Talanta 7 8 (2009) 772-780, h ttps ://d oi.org / 1 0. 1 016/j . t a l ant a . 2 008. 1 2 . 0 42. ) [4] J.L. Anderson, A.A. Cantu, A.W. Chow, P.S. Fussell, R.G. Nuzzo, J.E. Parmeter,G.S. Sayler, J.M. Shreeve, R.E. Slusher, M. Story, Existing and Potential StandoffExplosives Detection Techniques, National Academies Press, Washington DC, 2004. [5] W.O. Rivera, Standoff Raman spectroscopy system for detection of explosives,chemical warfare ajents simulants and toxic industrial compounds, 2008. ( [6] K . H asue, S . N a k a h ar a, J . Morimoto, T . Y a magami, Y . Okamoto, T . Miy ak awa, N . D. A cad e m y, Ph o to a c o u st i c sp e ct ro sc o py o f some ene r getic m a t er i a ls, p r o- p ellants , E x plos . Py r otech. 20 (1995) 1 87 - 191. ) ( [7] A. M iklos, P. Hess, Z. Bozoki, Application o f acoustic resonators in photoacoustic t race gas analysis and metrology, Rev.Sci. Instrum. 72 ( 2001) 1937-1955, ht tp s:/ / doi. o rg / 1 0 . 1 0 6 3/ 1 . 1 353198. ) ( [8] A .K. Chaudhary, G. C . Bh a r, S. Das, Low-limit photo-acoustic detection of solid RDX a nd TNT ex p losives wi t h carbon dioxide laser, J. Appl. Spectrosc. 73 (2006) 123-129, https :// do i. or g /1 0 .100 7/ s 1 0 812-0 0 6-0 0 46 -8 . ) ( [ 9] A . Rosencwaig, Photoacoustic sp e ctroscopy of solids, O p t. C o mmun. 7 (1973) 3 05-308, h t t ps : //d o i . o rg / 10 . 1016 / 00 3 0 -4 018(73 ) 9 0 0 39- 4. ) ( [ 1 0] A .F. E l-Sherif, H.S. Ayoub, Y.H. El-Sharkawy, W. Gomaa, H.H. Hassan, The designand implementation of p h otoacoustic based laser w a rning receiver for h a rsh e n - v ironments, O pt. Laser T echnol. 9 8 (2018 ) 385-396, ht tps:/ /do i . o r g/1 0 . 1016/j. o p t las t e c. 20 1 7.06 . 030 ) ( [ 11 ] I . Bayrakli, Y.K. Erdogan, Photo-acoustic s ensor b ased o n an i n expensive piezo-electric film transducer and an amplitude-stabilized s i ngle-mode external ca v itydiode laser for in vitro measurements of glucose concentration, Opt. Laser Technol. 1 02 (2018) 180-183, ht tp s:/ /do i . o r g / 1 0 .10 1 6/j. op t l astec.2 0 1 7 . 1 2 . 0 34. ) ( [ 12] B .S. G oldschmidt, A.M. Rudy, C . A. Nowak, D.P. Macoubrie, J.A. Viator, H.K. H u nt,Characterization of M gF2 th i n films using optical tunneling ph o toacoustic spe c - t roscopy, Opt. L aser Technol. 7 3 (2015) 146-155, ht t p s : // doi .org/10 .1016 /j. o p tlastec . 20 1 5. 04.019. ) ( [ 13] A .G. D e mir, B . P r evitali, N. Lecis, Development of laser dimpling strategies on T iN c oatings f o r tribological a p plications with a highly energetic Q-switched fiber laser, Opt.L a ser Technol.54 (2013)53-61, http s://d oi. org/10. 1 01 6 / j .opt la ste c .201 3 .05. 007. ) ( [14] S . Wallin,A. Pettersson, H. Ostmark, A. Hobro, Las e r-based standoff detection of e xplosives: a critical review, Anal . Bioanal . Chem. 395 (2009) 2 59-274,htt p s:// doi . o rg/ 10 . 1 0 07 /s0 0216-009 - 28 4 4 - 3 . ) ( [ 15] M .R. Leahy-Hoppa, M.J. Fitch, X. Z heng, L .M. H ayden, R. Osiander, Wideband terahertz spectroscopy of explosives, Chem. P hys. Lett. 434 ( 2007) 227-230, h t tp s://d o i.or g /1 0. 1 0 16/j .c p le t t . 2 006. 1 2 . 0 15 . ) ( [ 16] M . Snels, T. Venezia, L . Belfiore, D etection and i d entification o f TNT, 2,4-DNT an d 2,6-DNT by near-infrared cavity ringdown spectroscopy, Chem. Phys. L ett. 489 (2010) 1 34-140, h tt p s : //d oi. o rg /1 0.1 0 16 / j . c p lett.201 0 .02. 0 65 . ) ( [ 1 7] Y .H. El-Sharkawy,S. Elbasuney, Novel laser i n duced photoacoustic spectroscopy for 0V i nstantaneous trace detection of explosive ma t erials, Forensic Sci. I n t. 2 7 7 (2 0 17) 2 15-222, h t t p s: //d oi . or g/1 0 . 10 16/j .fo rsciint .2 0 1 7 .0 6. 0 05 . ) ( [ 1 8] H . Zhou, Z. Z h ang, C. Jiang, G. Gu a n, K. Zhang, Q. Mei, R. Liu, S. W ang, T rinitrotoluene explosive l ights up ultrahigh Raman s c attering of nonresonant m olecule on a top-closed silver nanotube array, Anal. Chem. 83 (2011) 6913-6917, ht tps:// do i . org / 1 0. 1 021 / a c 2 014 0 7 z . ) ( [ 1 9] M .A. P i menta, G . D r esselhaus, M.S. D r esselhaus, L.G. C ancado, A. Jorio, R . Saito, S tudying disorder in graphite-based s ystems by Raman sp e ctroscopy, Phys. Ch e m. Chem. P h ys. 9 (2007) 1 2 76-1290, ht t p s ://do i . o r g /10 . 1 0 39 / B6139 6 2 K. ) ( [ 20] K .L . M cnesb y , J . E . W o l f e , J.B . M or r is, F ourier t ran s fo r m Ra m an sp e c t r o scopy of s o me en e rg et i c m ate r i a l s a n d p r op e llant f o rm u l atio n s , J . R ama n Sp e ct r o sc. 2 5 ( 1 9 9 4 ) 7 5-87. ) [21] M.B. Pushkarsky, I.G. Dunayevskiy, M. Prasanna, A.G. Tsekoun, R. Go, C.K.N. Patel,High-sensitivity detection of TNT, Proc. Natl. Acad. Sci. USA 103 (2006)19630-19634, https://doi.org/10.1073/pnas.0609789104. [22]A.V. Deshmukh, A. Pandey, Detection of chemical signatures of 2,4,6-Trinitrotoluene (TNT) in water samples using automated Solid-Phase Micro-ex-traction (SPME) coupled to FT-Raman spectroscopy, Malaysian J. Forensic Sci. 4(2013) 30-32. ( [ 23] N . Idros, M. Ho, M . Pivnenko, M. Q asim, H. Xu, Z. Gu, D . Chu, Colorimetric-based d etection o f TNT explosives using functionalized silica nanoparticles, Sensors 15 (2015)1 2 891-12905, ht tp s: //do i . o r g/1 0.33 9 0/s 1 5 0 6 12 8 9 1. ) ( [24] K I .S. R ao, A .K. C haudhary, F. Y e hya, Investigation of solid carbon b l acks using p ulsed p hotoacoustic and d o uble resonant Ra m an spectroscopy for t he identifica- t ion of trinitro-toluene, Sens. Actuat. B Chem. 231 (2016) 830-836, h t t p s : //d oi . o r g/ 1 0. 1 016/ j . s nb .20 16 . 0 3 .05 2. ) ( [ 2 5] Q .C. Campbell, G r aphite: properties,occurrences a n d uses, 2013, < h tt p s:// ww w. s co p u s. co m / i n w ar d/r e co rd. u ri ? e i d =2-s 2.0-48928 9372 3 & p a rtnerI D= 40&m d 5= 1 c 2 4fd0 3 5528 3 d3010c 5 1db440 6 a 3 6d0 > ) ( [26] P roperties a nd characteristics of graphite , < https :// www.e n teg r i s . co m/r e s o urc e s/ a sse t s/ -6 2 0 5 - 7 3 2 9 - 05 1 3 . pd f > , 2 0 03, doi:10.1002/ejoc.201200111. ) ( [ 2 7] A .-B. Djurisic, E .-H. L i, Optical p roperties o f graphite, J . Appl. P hys. 8 5 (19 9 9) ) ( 7404-7410, h ttps: // doi.o rg/1 0 . 1063 / 1 . 369370. ) ( [28] A .C. Ferrari, Raman s p ectroscopy of graphene and gra p hite: disorder, el e ctron- p honon coupling, doping and nonadiabatic effects, Solid State Commun. 143 ( 200 7 ) 4 7-57, h tt ps: //d o i . o r g/1 0. 1 01 6 /j . ssc .2 007.03.052. ) ( [29] X. Wang, S. C h ang, J. Yang, J. Tan, H. Jia, H. Yin, X. L i, G. Peng, Detection of TNT in a cetone using Raman spectroscopic signature, i n : Proc. SPIE 6 622, Int. Symp.Photoelectron. Detect. Imaging 2007 Laser, Ul t raviolet, T e rahertz Technol. 66 2 219 (February 22, 2008), 2007, pp.662218-662219.doi:10.1117/12.790827. ) ( [30] R . E s c riba n o, J . J . Sl o a n , N. S i d di qu e , N . Sz e, T . Dude v, R aman s p ec tr os c op y o f c arbon-conta i ning parti cl e s, Vib . Spectrosc . 2 6 ( 200 1) 1 7 9- 1 86. ) ( [31] J . H odkiewicz, C h aracterizing c a rbon materials with Ra m an spectroscopy, Sci. T hermo F i sh. Appl. N ote 51901. ) ( [32] M . Pimenta, Studying disorder in graphite-based systems by Raman spectroscopy, P hys. Chem. C hem. Phys.9 (2 tn e· / 007)1276-1291, htt ps: //doi .or g /1 0 .1 0 39/b6 1 3 9 6 2 k. ) ( [33] C . P a n tea , T . W . Z e rda , M icrostruct u re o f c a rbon b lac k s d ete r mined b y X - r a y d if- f r a c t io n p rofi l e a na l y s is , Car b o n N . Y . 4 0 (2 0 02) 9 2 9-93 7 . ) [34]N.F. Fell, J.A. Vanderho, R.A. Pesce-rodriguez, K.L. Mcnesby, Characterization ofRaman spectral changes in energetic materials and propellants during heating, J. ( R a ma n S p ec t ro s c. 29 (1998) 165- 1 72. ) ( [35] 1 K 1 . L . F e ll , N . F . Widd e r , J . M . M edlin, S . V. M or r i s , J . B . Pesc e-R o dr i g ue z , R . A . M c N e s by, F o u r i e r t r an sf orm ram a n s pe c trosco p y of s o m e ene r ge t i c m at erials an d propellant f ormu l at i ons. II , J . Raman Sp ec tr osc. 27 (1996) 97 -1 04. ) ( [36] L I . Nagli, M. G aft, Y . Fleger, M. Rosenbluh, Absolute Raman cross-sections o f some e xplosives: trend to UV, Opt. Mater. (Amst) 30 (2008) 1747-1754, h t t p s : //d o i . o r g/ 1 0. 1 016/ j . op t mat. 2 007 . 1 1.0 1 9. ) ( [ 37] S . Almaviva, A. Palucci, S . Botti, A. Puiu, A. Rufoloni, V alidation of a m iniaturized spectrometer for trace d etection o f explosives by surface-enhanced Raman spec- t roscopy, Challenges 7 (2016) 1 4 , h t t p s : //d oi. o rg/ 10 .3 39 0 / ch alle 70 20 0 14 . ) [38] Y. Liu, R. Perkins, Y. Liu, N. Tzeng, Normal mode and experimental analysis of TNTRaman spectrum, J. Mol. Struct. 1133 (2017) 217-225, https://doi.org/10.1016/j.molstruc.-2016.12.015. [39] A.C. Ferrari, J. Robertson, Resonant Raman spectroscopy of disordered, amorphous,and diamondlike carbon, Phys.Rev. B. 64 (2001) 75414, https://doi.org/10.1103/PhysRevB.-64.075414. ( [ 40] K . Nagashima, M. Nara, J.I. Matsuda, Raman spectroscopic st u dy of diamond andgraphite i n ureilites a nd t h e o r igin o f diamonds, Met e orit. Planet. Sci. 47 ( 2012) 1728-1737, h t t ps: // d o i.or g/ 10.1 1 1 1/ m aps.1 20 0 7 . ) The optical phonon waves transfer mechanism between pure graphite (GP) and trinitrotoluene (TNT) using 1064 nm as an excitation wavelength based on the double resonant Raman effect and the pulsed photoacoustic (PA) technique has been investigated. The study was carried out at a different weight percentage of GP within TNT with respect to the two excitation wavelengths of 532 nm and 1064 nm (30 ps, 10 Hz, Q-switched Nd: YAGlaser). The equal and double proportional matrix of the GP and TNT (solid samples) generate a strong PA signal with high quality factor (Q-factor) due to the interaction of optical phonons of GP and TNT in the same phase. The Raman spectra, recorded at 785 nm wavelength provides an insight on the pi-electron coupling between the GP and TNT. The obtained experimental results confirm that the pure GP and its derivatives, which have a SP2/SP3 hybridization, can be used to develop a new sensing optode for the detection and identification of explosive molecules in the visible and near-IR wavelengths range.
确定

还剩6页未读,是否继续阅读?

产品配置单

北京欧兰科技发展有限公司为您提供《石墨混合物中的固体三硝基甲苯中拉曼和时间分辨脉冲光声光谱检测方案(激光产品)》,该方案主要用于苯及其衍生物中可靠性能检测,参考标准--,《石墨混合物中的固体三硝基甲苯中拉曼和时间分辨脉冲光声光谱检测方案(激光产品)》用到的仪器有PL2250 闪光灯泵浦皮秒Nd:YAG激光器
推荐专场


该厂商其他方案
更多