


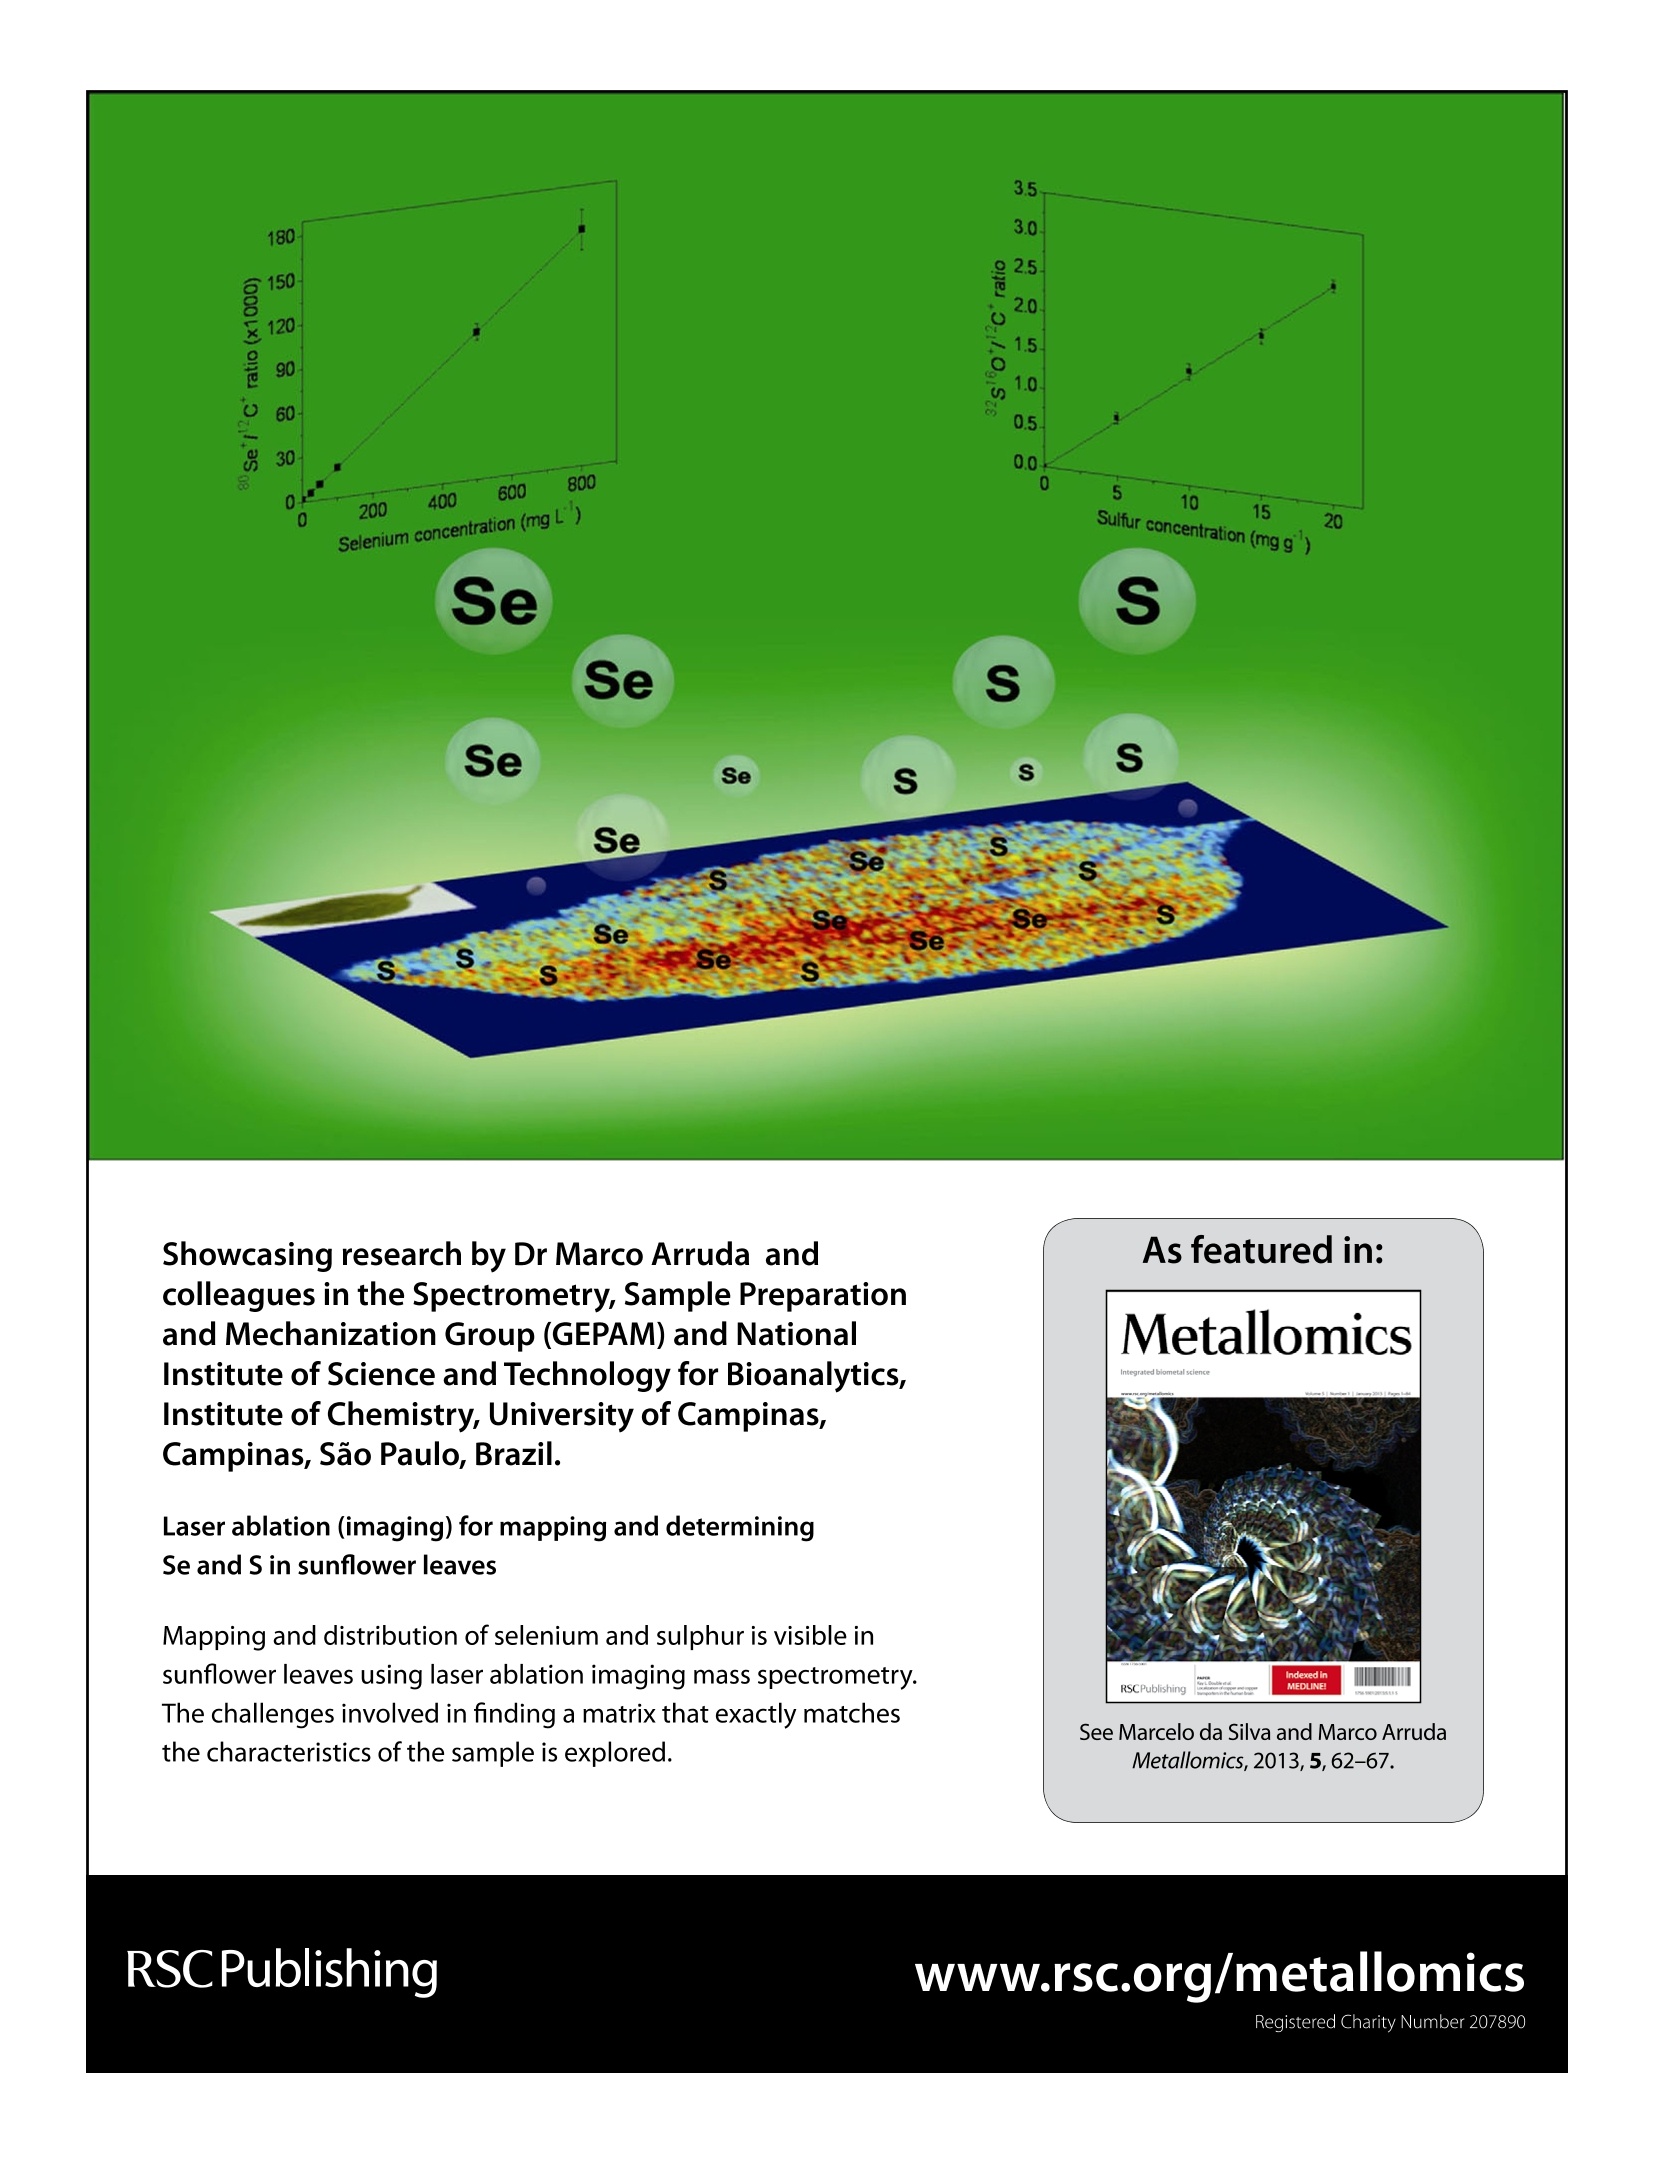
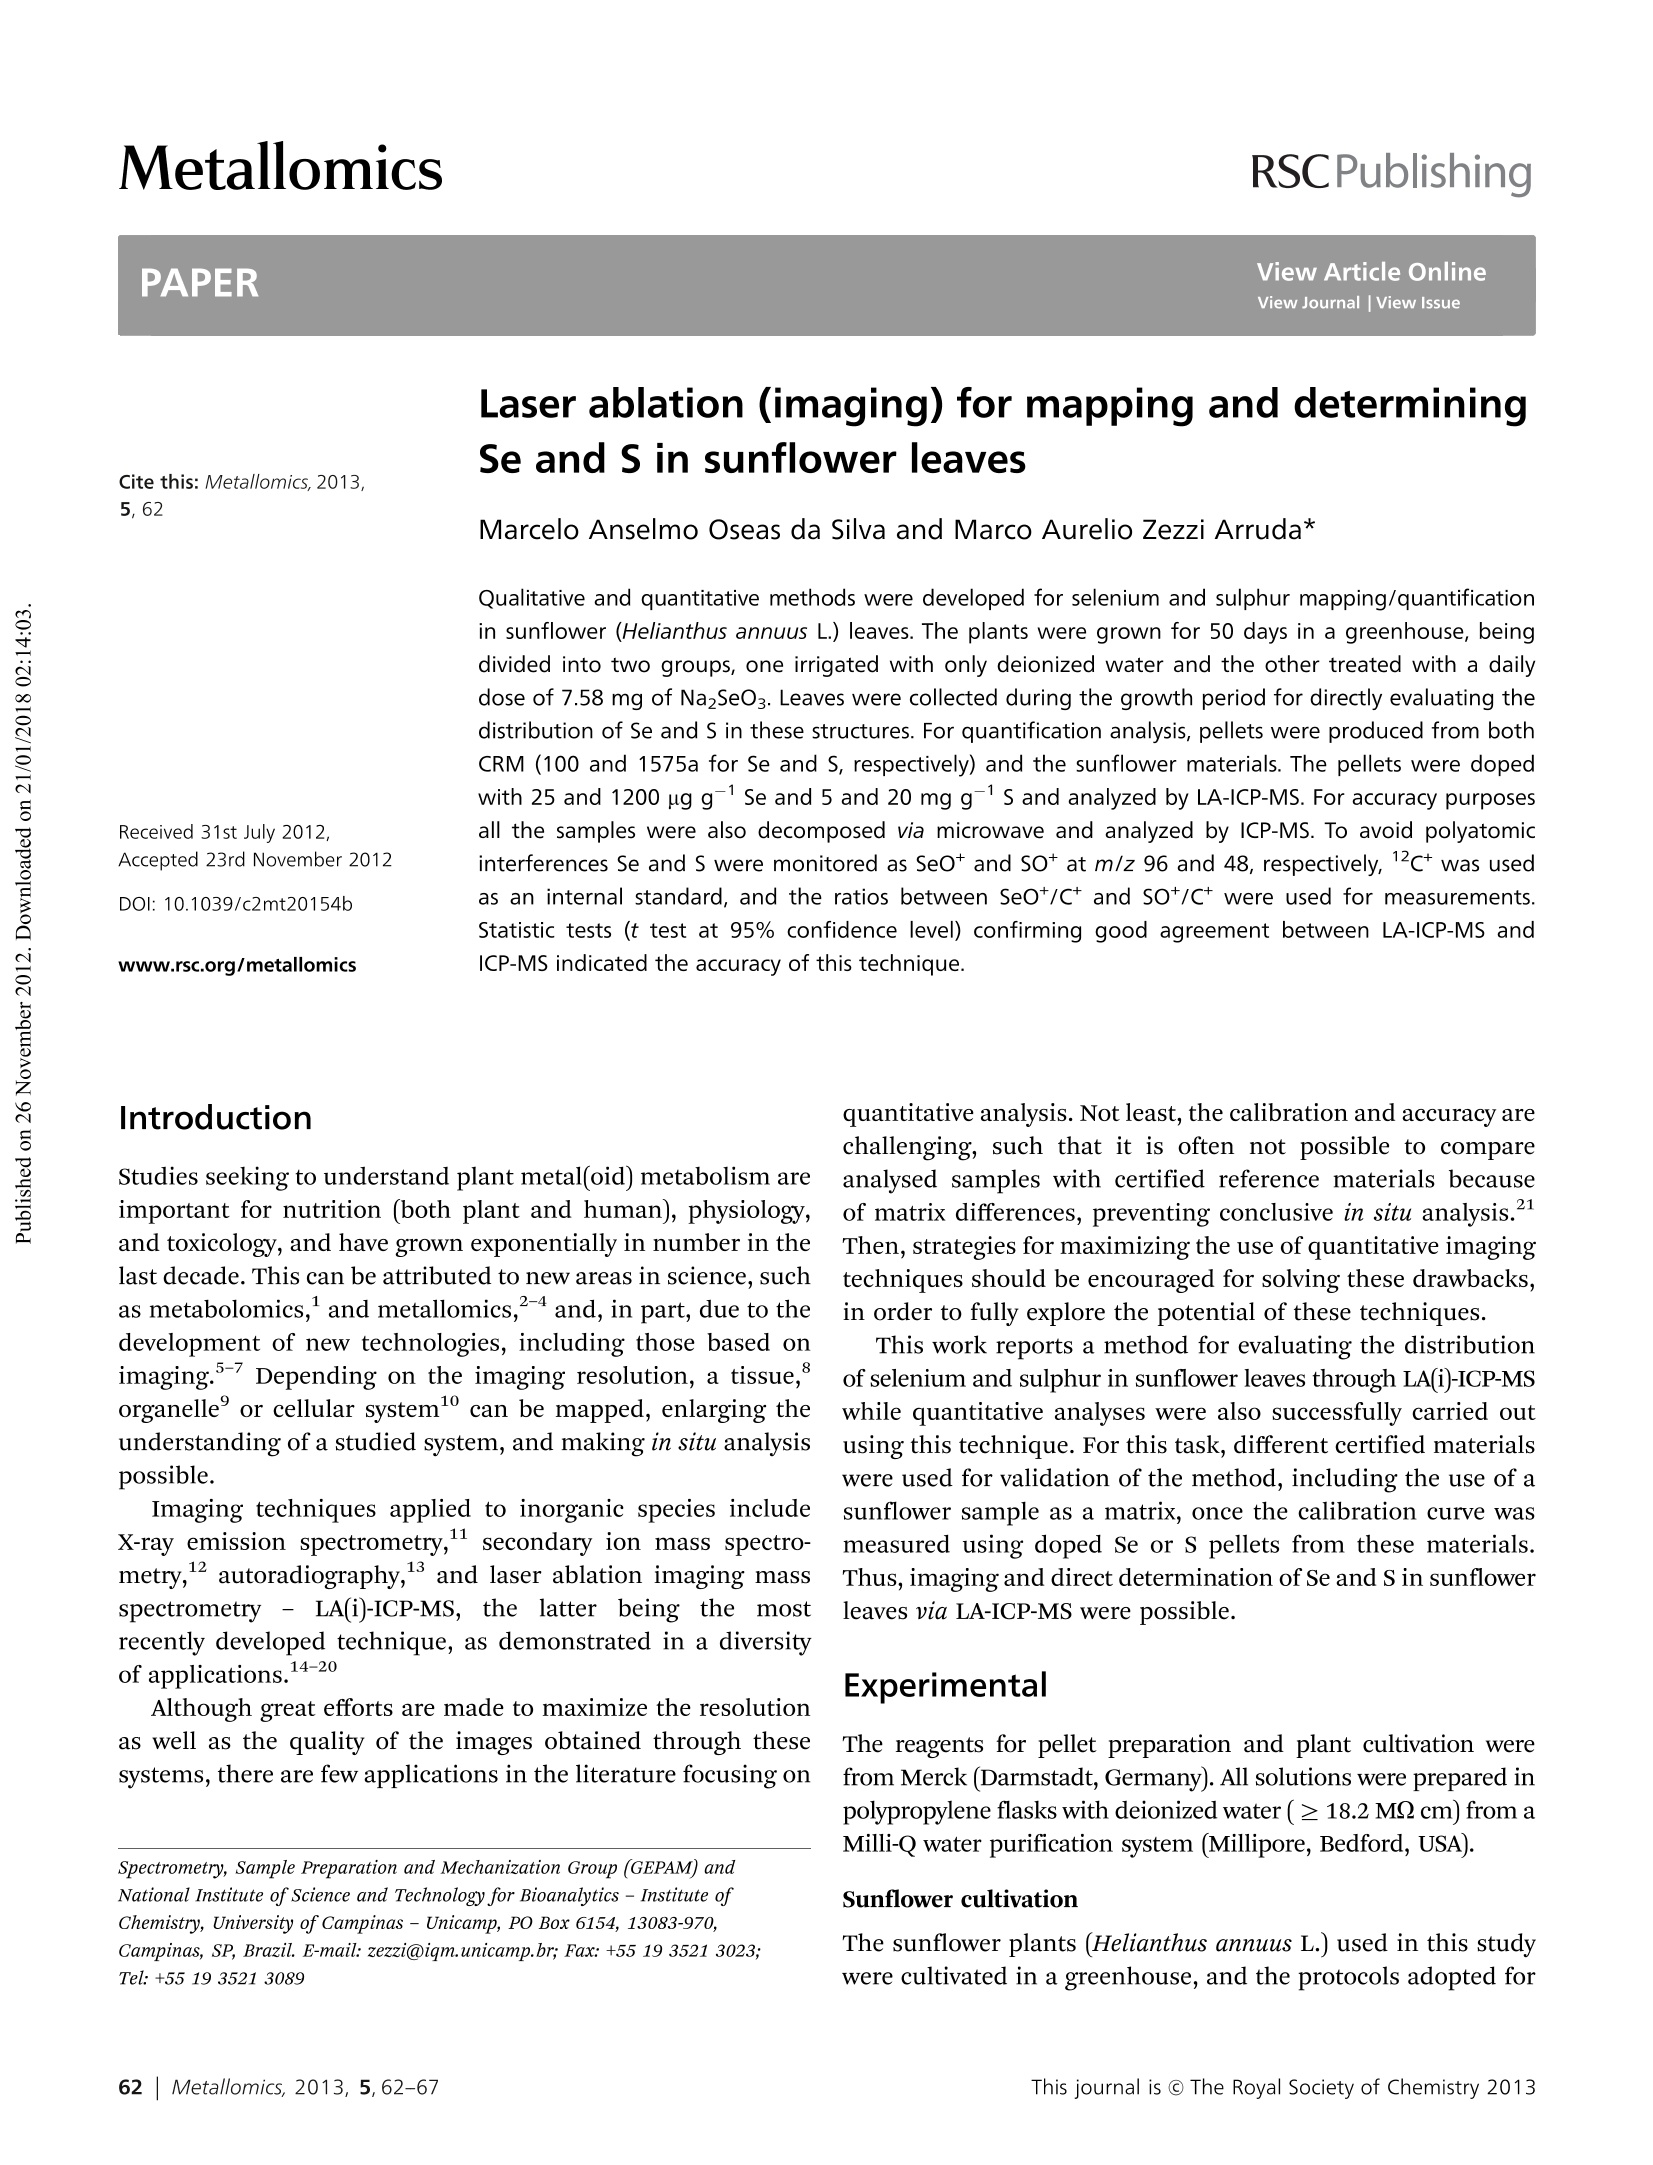
采用定性和定量相结合的方法,对向日葵叶片中硒和硫的含量进行了测定。这些植物在温室里生长了50天,被分为两组,一组只用去离子水灌溉,另一组用每日7.58毫克的Na2SeO3处理。在生长期间采集叶片,直接分析硒和S在这些结构中的分布。定量分析采用CRM(Se和S分别为100和1575a)和葵花原料制成的靶丸。分别加入25和1200mg/g的Se、5和20mg/g的S,用LA-ICP-MS对其进行分析。为准确起见,所有样品还通过微波分解和ICP-MS分析。为了避免多原子干扰,Se和S分别在96和48m/z时用SeO+和SO+监测,内部标准为12C+,测量时采用SeO+/C+和SO+/C+的比值。统计检验(95%置信水平下的t检验)证实LA-ICP-MS与ICP-MS具有良好的一致性,验证了该技术的准确性。
方案详情

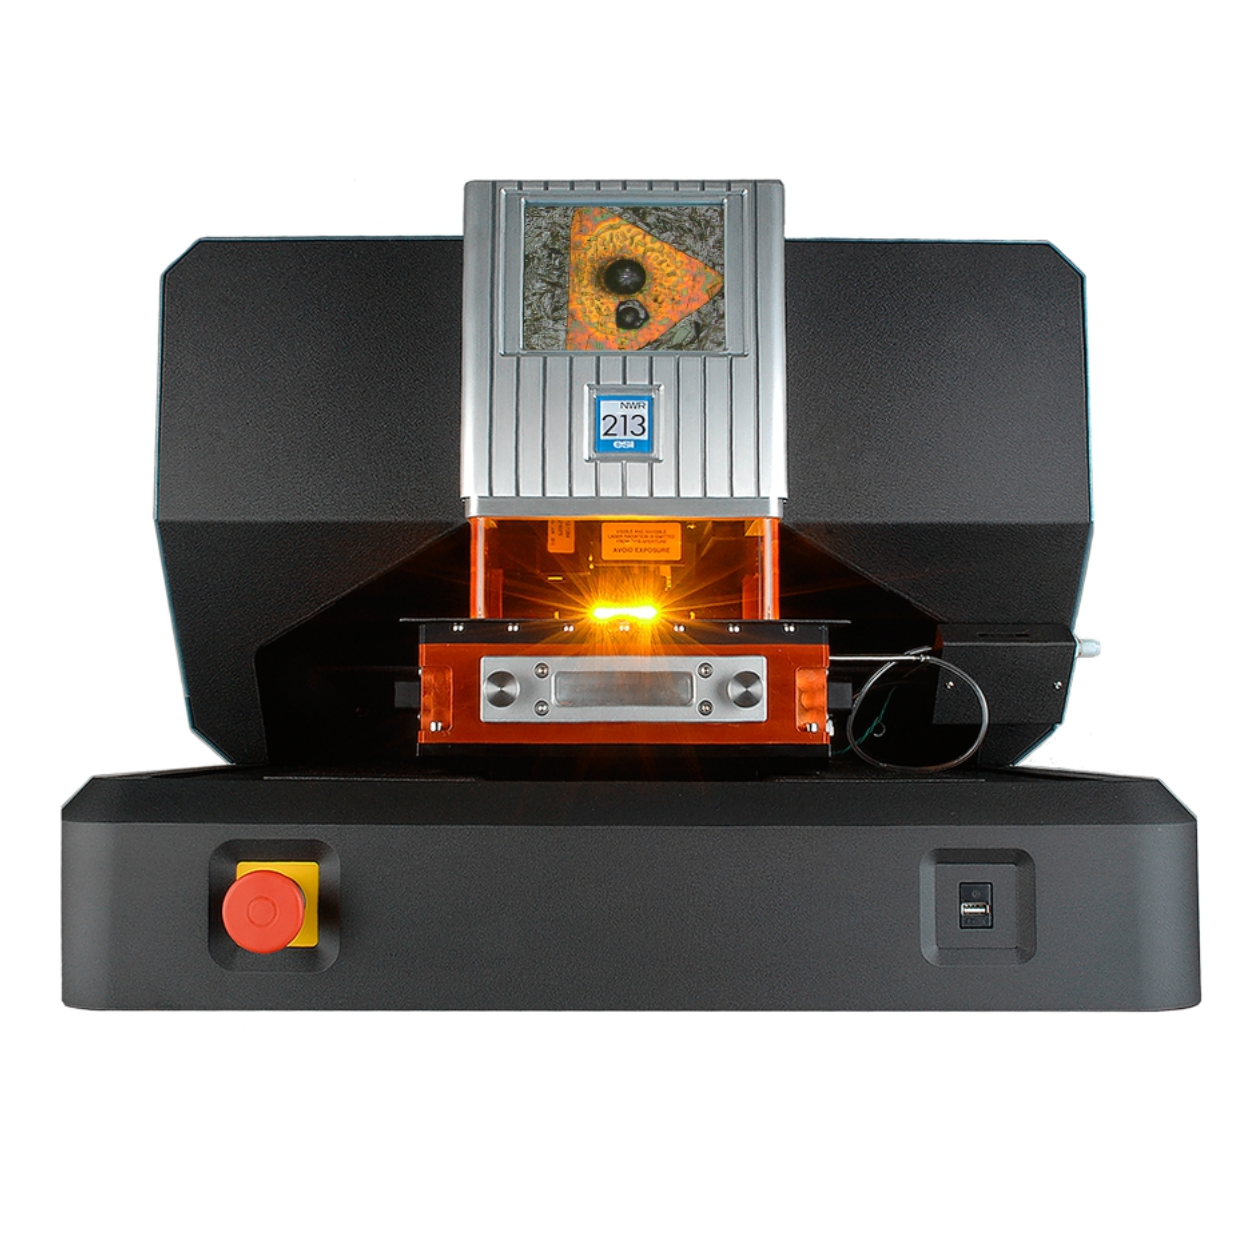
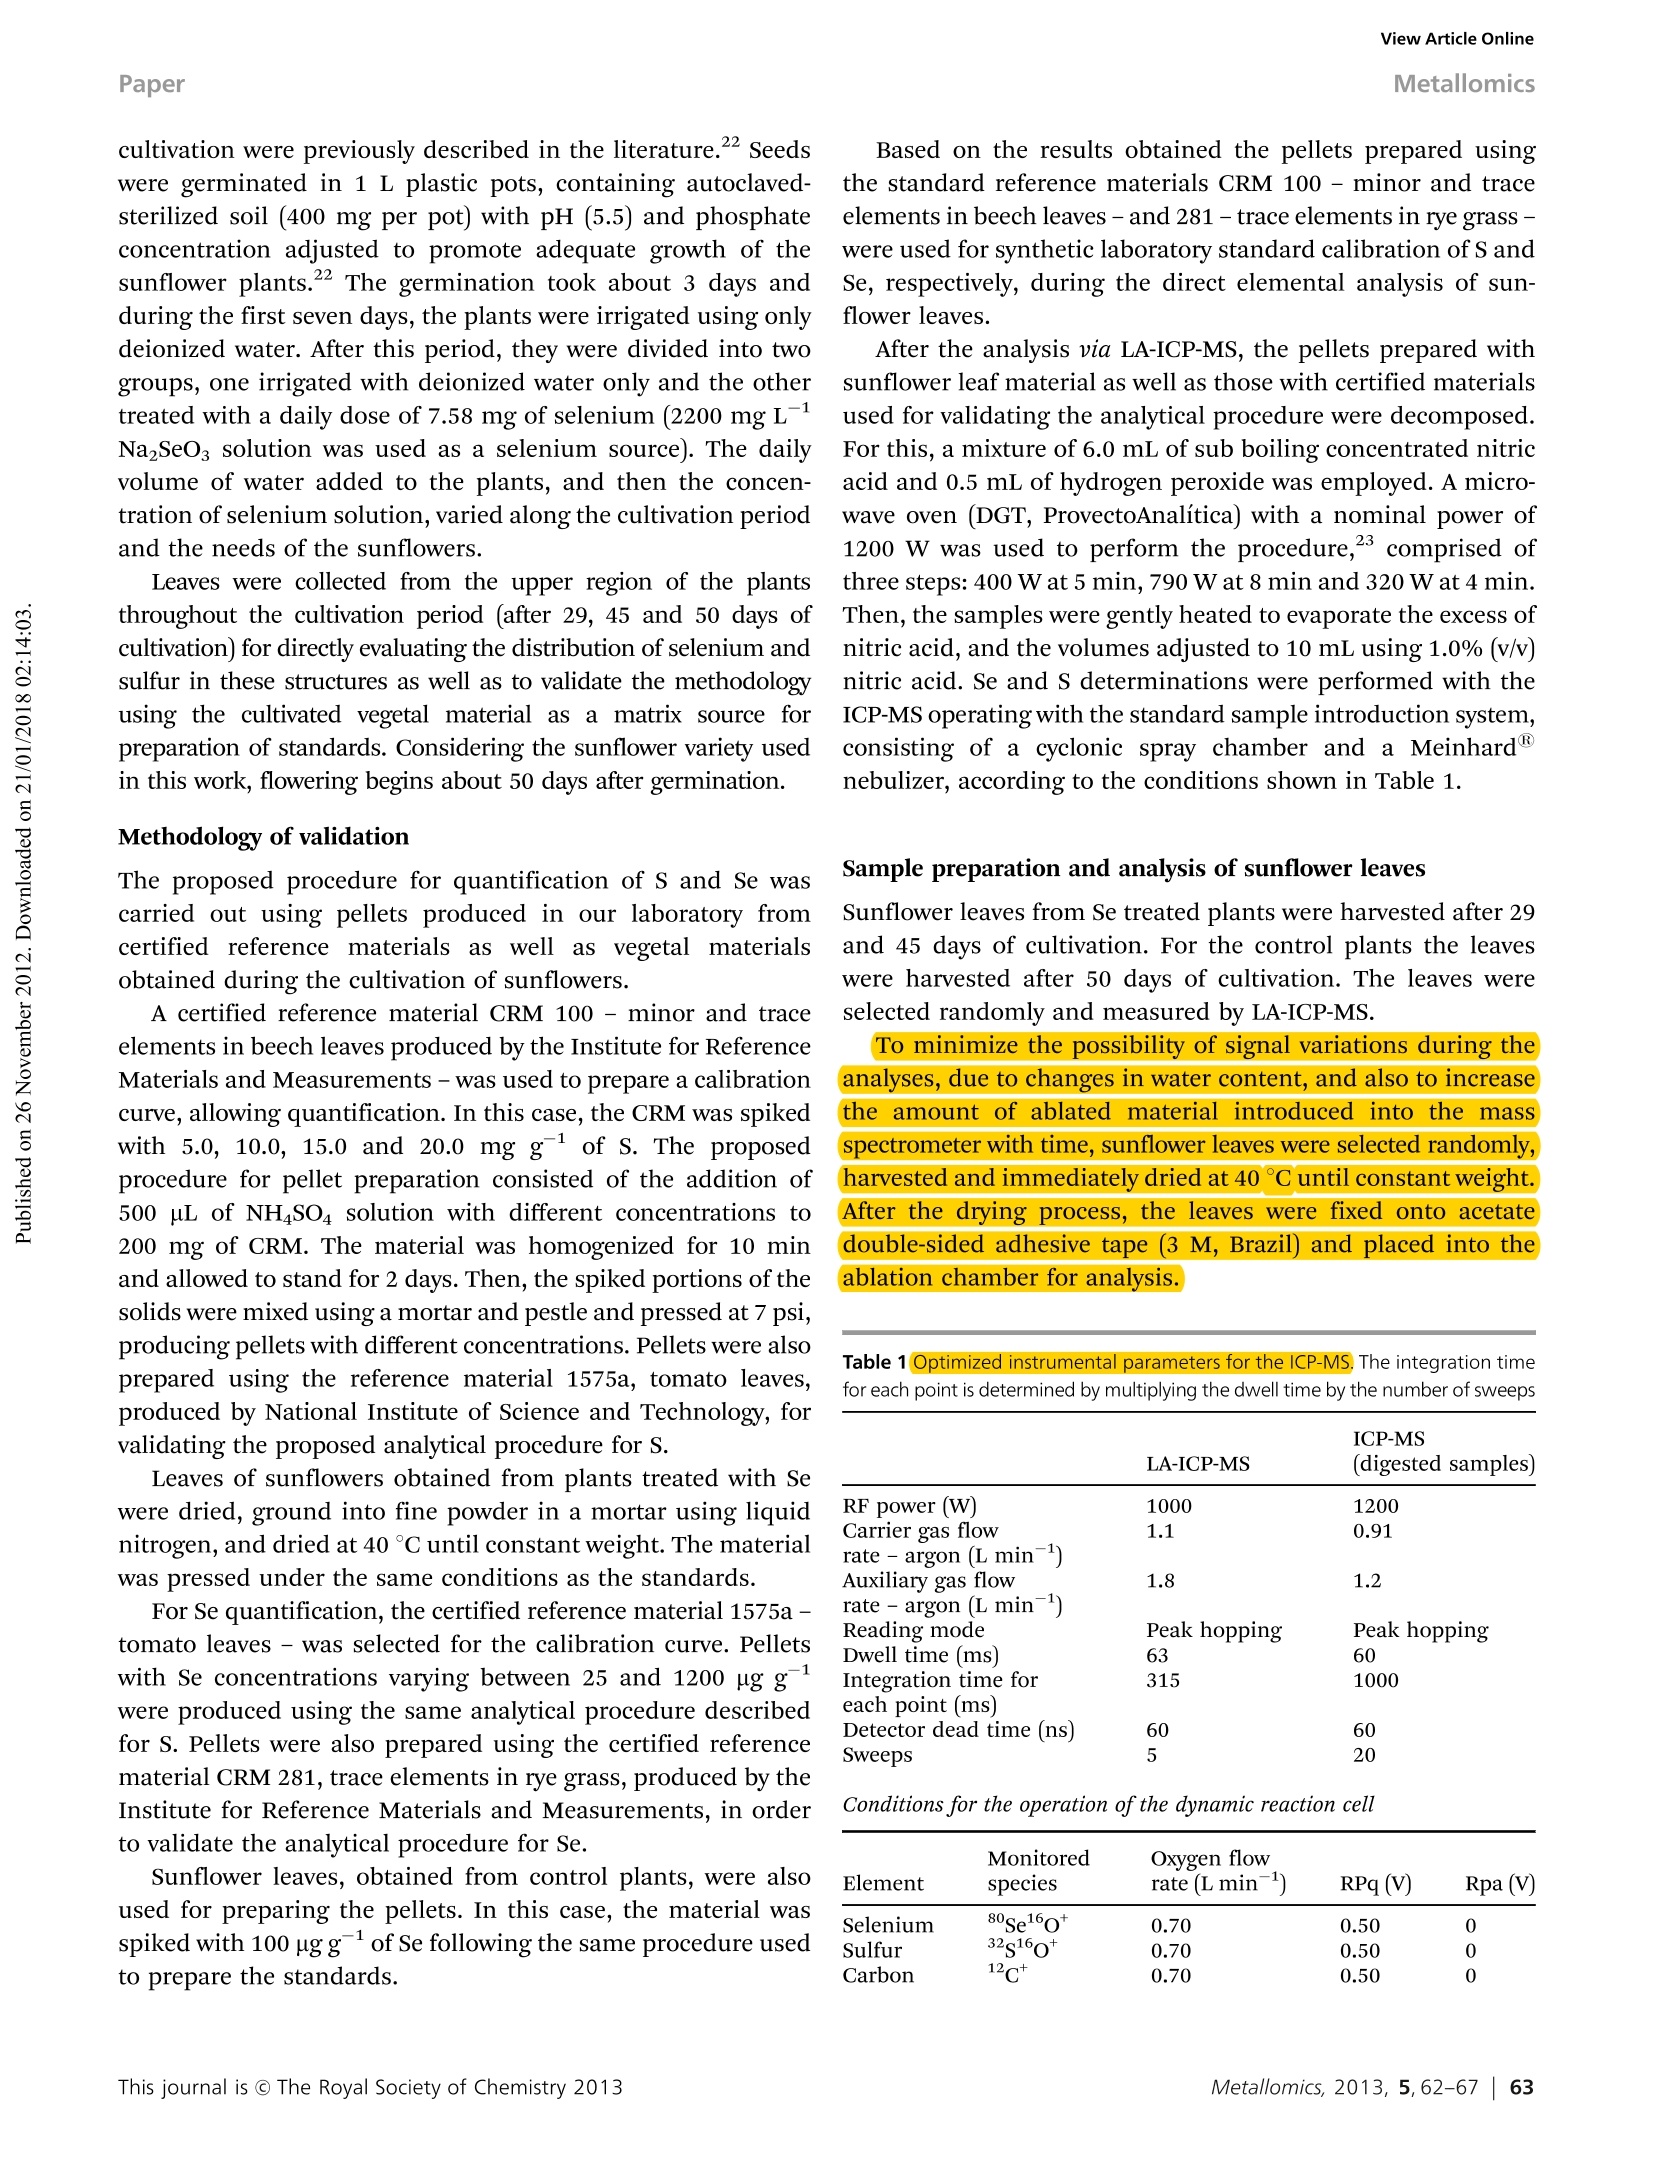
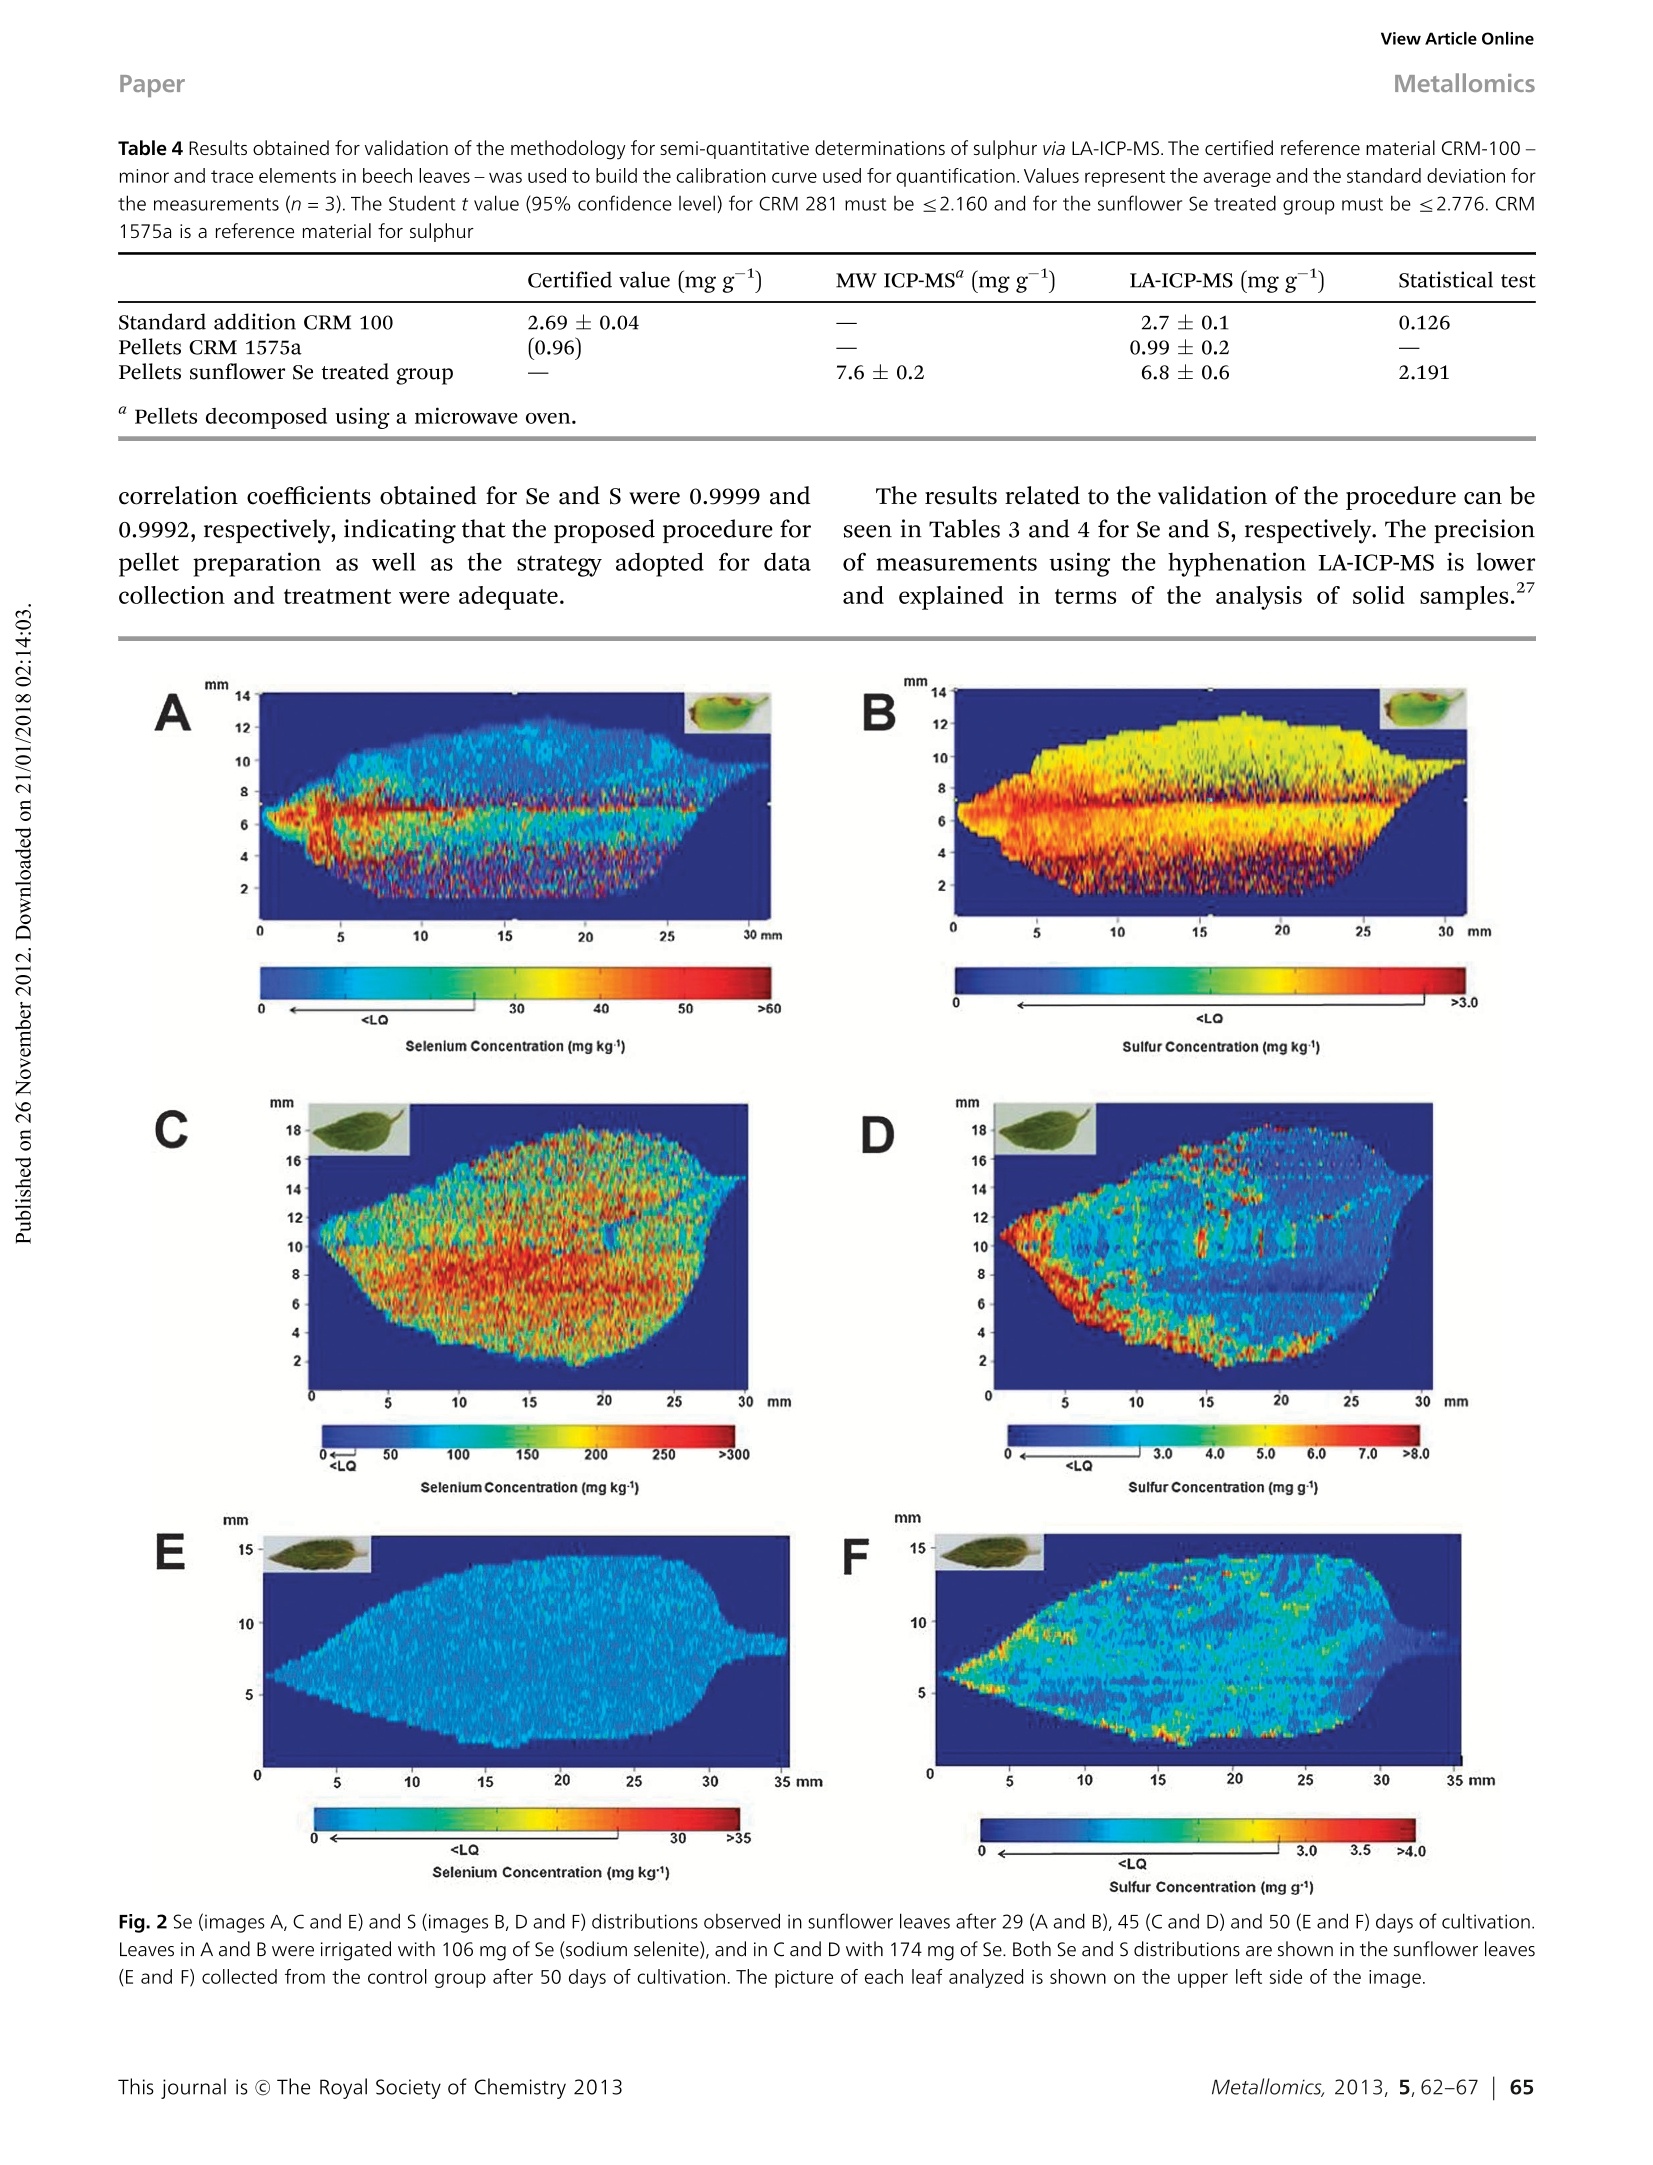
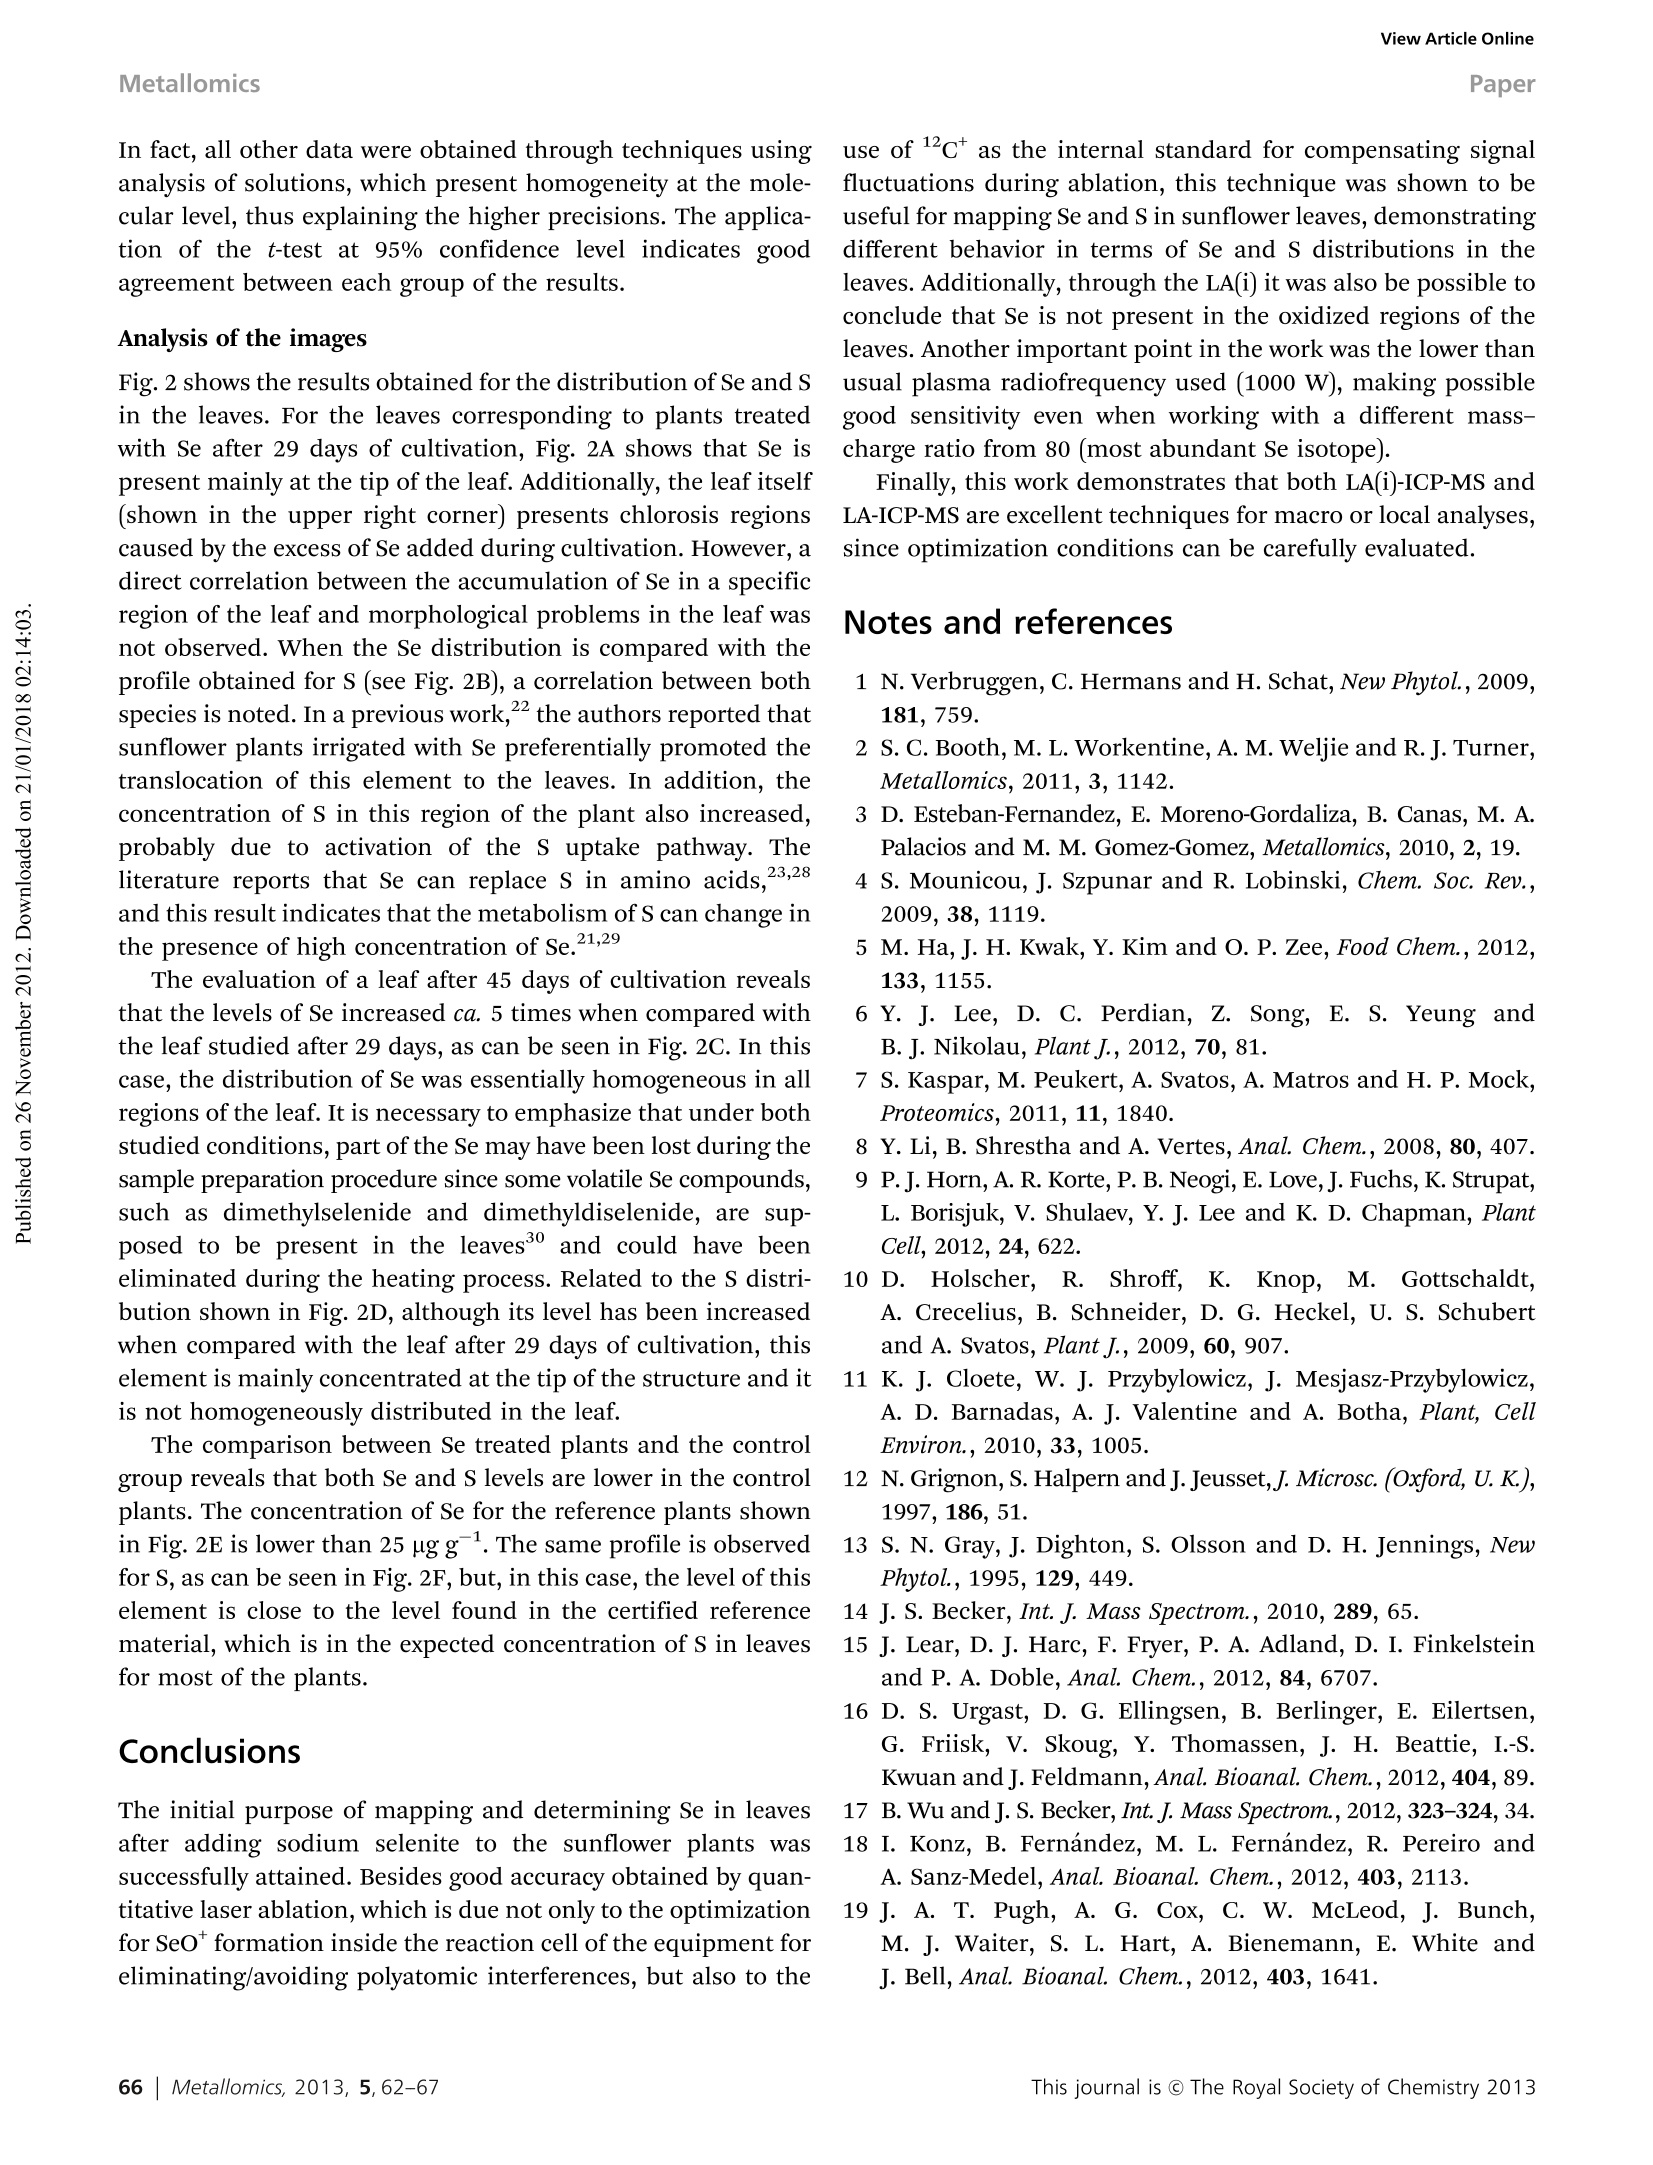
MetallomicsRSCPublishingView Article OnlineView Journal|View Issue View Article OnlineMetallomicsPaper Showcasing research by Dr Marco Arruda andcolleagues in the Spectrometry, Sample Preparationand Mechanization Group (GEPAM) and NationalInstitute of Science and Technology for Bioanalytics,Institute of Chemistry, University of Campinas, Campinas, Sao Paulo, Brazil. Laser ablation (imaging) for mapping and determiningSe and S in sunflower leaves Mapping and distribution of selenium and sulphur is visible insunflower leaves using laser ablation imaging mass spectrometry.The challenges involved in finding a matrix that exactly matchesthe characteristics of the sample is explored. See Marcelo da Silva and Marco ArrudaMetallomics, 2013,5,62-67. Introduction Studies seeking to understand plant metal(oid) metabolism areimportant for nutrition (both plant and human), physiology,and toxicology, and have grown exponentially in number in thelast decade. This can be attributed to new areas in science,suchas metabolomics, and metallomics,-4 and, in part, due to thedevelopment of new technologies, including those based onimaging.- Depending on the imaging resolution, a tissue,organelle’or cellular system1 can be mapped, enlarging theunderstanding of a studied system, and making in situ analysispossible. Imaging techniques applied to inorganic species includex-ray emission spectrometry, secondary ion mass spectro-metry,1? autoradiography,13 and laser ablation imaging massspectrometry - LA(i)-ICP-MS, the latter being the mostrecently developed technique, as demonstrated in a diversityof applications.14-20 Although great efforts are made to maximize the resolutionas well as the quality of the images obtained through thesesystems, there are few applications in the literature focusing on ( Spectrometry, Sample P reparation a nd Mechanization Group (GEPAM) and N ational Institute o f Science and Technology for B i oanalytics -In s titute ofChemistry, University of Campinas - Unicamp, PO Box 6154, 1 3083-970,Campinas, S P , B r azil. E -mail: zezzi@iqm.unicamp.br; Fax: +55 19 3521 302 3 ; Tel: +55 19 3521 3089 ) quantitative analysis. Not least, the calibration and accuracy arechallenging, such that it is often not possible to compareanalysed samples with certified reference materials becauseof matrix differences, preventing conclusive in situ analysis.21Then, strategies for maximizing the use of quantitative imagingtechniques should be encouraged for solving these drawbacks,in order to fully explore the potential of these techniques. This work reports a method for evaluating the distributionof selenium and sulphur in sunflower leaves through LA(i)-ICP-MSwhile quantitative analyses were also successfully carried outusing this technique. For this task, different certified materialswere used for validation of the method, including the use of asunflower sample as a matrix, once the calibration curve wasmeasured using doped Se or S pellets from these materialsThus, imaging and direct determination of Se and S in sunflowerleaves via LA-ICP-MS were possible. Experimental The reagents for pellet preparation and plant cultivation werefrom Merck (Darmstadt, Germany). All solutions were prepared inpolypropylene flasks with deionized water (≥18.2 MQ cm) from aMilli-Q water purification system (Millipore, Bedford, USA). Sunflower cultivation The sunflower plants (Helianthus annuus L.) used in this studywere cultivated in a greenhouse, and the protocols adopted for cultivation were previously described in the literature. Seedswere germinated in 1 L plastic pots, containing autoclaved-sterilized soil (400 mg per pot) with pH (5.5) and phosphateconcentration adjusted to promote adequate growth of thesunflower plants.22 The germination took about 3 days andduring the first seven days, the plants were irrigated using onlydeionized water. After this period, they were divided into twogroups, one irrigated with deionized water only and the othertreated with a daily dose of 7.58 mg of selenium (2200 mgLNazSeOs solution was used as a selenium source). The dailyvolume of water added to the plants, and then the concen-tration of selenium solution, varied alongthe cultivation periodand the needs of the sunflowers. Leaves were collected from the upper region of the plantsthroughout the cultivation period (after 29, 45 and 50 days ofcultivation) for directly evaluating the distribution of selenium andsulfur in these structures as well as to validate the methodologyusing the cultivated vegetal material as a matrix source forpreparation of standards. Considering the sunflower variety usedin this work, flowering begins about 50 days after germination. Methodology of validation The proposed procedure for quantification of S and Se wascarried out using pellets produced in our laboratory fromcertified reference materials as well as vegetal materialsobtained during the cultivation of sunflowers. A certified reference material CRM 100 - minor and traceelements in beech leaves produced by the Institute for ReferenceMaterials and Measurements - was used to prepare a calibrationcurve, allowing quantification. In this case, the CRM was spikedwith 5.0, 10.0, 15.0 and 20.0 mg gof S. The proposedprocedure for pellet preparation consisted of the addition of500 uL of NHSO4 solution with different concentrations to200 mg of CRM. The material was homogenized for 10 minand allowed to stand for 2 days. Then, the spiked portions of thesolids were mixed using a mortar and pestle and pressed at 7 psi,producing pellets with different concentrations. Pellets were alsoprepared using the reference material 1575a, tomato leaves,produced by National Institute of Science and Technology, forvalidating the proposed analytical procedure for S. Leaves of sunflowers obtained from plants treated with Sewere dried, ground into fine powder in a mortar using liquidnitrogen, and dried at 40 °℃ until constant weight. The materialwas pressed under the same conditions as the standards. For Se quantification, the certified reference material 1575a-tomato leaves - was selected for the calibration curve. Pelletswith Se concentrations varying between 25 and 1200 ug gwere produced using the same analytical procedure describedfor S. Pellets were also prepared using the certified referencematerial CRM 281, trace elements in rye grass, produced by theInstitute for Reference Materials and Measurements, in orderto validate the analytical procedure for Se. Sunflower leaves, obtained from control plants, were alsoused for preparing the pellets. In this case, the material wasspiked with 100 uggof Se following the same procedure usedto prepare the standards. Based on the results obtained the pellets prepared usingthe standard reference materials CRM 100 - minor and traceelements in beech leaves -and 281-trace elements in rye grass-were used for synthetic laboratory standard calibration of S andSe, respectively, during the direct elemental analysis of sun-flower leaves. After the analysis via LA-ICP-MS, the pellets prepared withsunflower leaf material as well as those with certified materialsused for validating the analytical procedure were decomposed.For this, a mixture of 6.0 mL of sub boiling concentrated nitricacid and 0.5 mL of hydrogen peroxide was employed. A micro-wave oven (DGT, ProvectoAnalitica) with a nominal power of1200 W was used to perform the procedure,23 comprised ofthree steps: 400 W at 5 min, 790 W at 8 min and 320 W at 4 min.Then, the samples were gently heated to evaporate the excess ofnitric acid, and the volumes adjusted to 10 mL using 1.0% (v/v)nitric acid. Se and S determinations were performed with theICP-MS operating with the standard sample introduction system,consisting of a cyclonic spray chamber and a Meinhardnebulizer, according to the conditions shown in Table 1. Sample preparation and analysis of sunflower leaves Sunflower leaves from Se treated plants were harvested after 29and 45 days of cultivation. For the control plants the leaveswere harvested after 50 days of cultivation. The leaves wereselected randomly and measured by LA-ICP-MS. To minimize the possibility of signal variations during theanalyses, due to changes in water content, and also to increasethe amount ofablatedmaterialintroducedintothemassspectrometer with time, sunflower ]leaves were selected randomly,harvested and immediately dried at 40 °i℃ until constant weight.After the drying process, theleaveswerefixedonto acetatedouble-sided adhesive tape(3 M, Brazil)andplacedinto theablation chamber for analysis. Table 1 Optimized instrumental parameters for the lCP-MS.The integration timefor each point is determined by multiplying the dwell time by the number of sweeps ICP-MS LA-ICP-MS (digested samples) RF power (W) 1000 1200 Carrier gas flow 1.1 0.91 rate - argon (L min) Auxiliary gas flow 1.8 1.2 rate- argon (L min-) Reading mode Peak hopping Peak hopping Dwell time (ms) 63 60 Integration time for 315 1000 each point (ms) Detector dead time (ns 60 Sweeps 5 Conditions for the operation of the dynamic reaction cell Monitored Oxygen flow Element species rate (L min RPq (V) Rpa (V) Selenium 80se1ot 0.70 0.50 Sulfur 32s16o* 0.70 0.50 Carbon 12c* 0.70 0.50 Table 2 Instrumental parameters for the laser ablation system, The resolution onthe Y axis is given by the distance between two successive lines, while on theX axis it is determined by multiplying the scan speed by the integration time foreach point Wavelength of Nd:YAG laser (nm) 213 Frequency (Hz) Laser intensity (%) Average energy output (mJ) Average fluence (J cm) Scan speed (um s-) Laser beam diameter (um) 110 Resolution -X axis (um) 22.05 Resolution - Y axis (um) 300 A quadrupole-based ICP-MS (PerkinElmer ELAN DRC-e)coupled with a laser ablation system (New Wave UP 213) wasused for imaging Se and S distribution in sunflower leaves. Theanalytical strategy adopted for carrying out the determinationof Se and S free of interferences was based on the reaction ofSe and S species formed in the plasma with oxygen in thereaction cell of the instrument. In this case, the monitoredspecies consisted of the product ions SeOand SO* at m/z 96 and48, respectively. The parameters for the operation of the ICP-MSare also shown in Table 1. These conditions were previouslyoptimized for monitoring S and Se using this hyphenation.22,24 To compensate for possible variations in the ablation pro-cess,25 which can be related to changes in the ablation processitself or to the heterogeneity of the prepared standards, c*was chosen as the internal standard to normalize the analyticalsignals. Then, 12C is an interesting alternative for signalnormalization since the reaction cell of the instrument ispressurized and optimized for the determination of Se and S.In this situation, the obtained signal for carbon was attenuatedand ratios between SeO*/C and SO*/C were typically 0.001 and1.0, respectively. The conditions adopted for the analysis are described inTable 2, and adjusted for achieving the maximum materialremoval while avoiding cutting of the leaves by the laser duringthe analysis. Regarding resolution, the distance betweensuccessive lines was set to 300 um. The pellets prepared for the calibration of the instrumentand for validating the method were scanned in five randomlyselected regions, and for each one, 100 points were collected foreach monitored ion. The average value was calculated and theratios between SeO*/C* and so/C were determined. The software MatLab version 6.5 was used to construct theimages of the scanned leaves and correlate the obtained signalswith the concentrations of the elements in the leaves. Results and discussion Validation of the analytical procedure The development of quantitative procedures for the evaluationof the elemental distribution in different materials, in specialbiological tissues, still presents a challenge because of thedifficulty in finding a matrix that exactly matches the character-istics of the sample. In the present case, two other points hampereven more the determinations. The first consists of the fact that Seis considered a micronutrient and it is present at low concentra-tions in biological tissues,26 making difficult its determination.The second refers to the content of S in the certified referencematerial used for preparing the calibration curve. In this situation,the lowest limit for the calibration curve depends on the concen-tration of S present in the certified material. Taking into account these two points, the calibration curvesobtained with the prepared pellets are shown in Fig. 1. The ( Table 3 Results obtained for validation of the m ethodology for semi-quantitative determinations of selenium via LA-ICP-MS. The certified reference material 1575a -tomato leaves - was used to b uild the calibration curve used for quantification. Values r epresent t he a verage and t h e s t andard deviation for the measurements(n=3). The Student t value (95% confidence level) must be≤ 2 .776 ) Spiked conc. MW ICP-MS" LA-ICP-MS Statistic (mg kg ) (mg kg) (mg kg) test Pellet CRM 281 800 865±16 886±26 1.191 Pellet sunflower 0 703±12 707±36 0.182 Se treated group Pellet sunflower 100 97±9 121±15 2.376 control group Table 4 Results obtained for validation of the methodology for semi-quantitative determinations of sulphur via LA-ICP-MS. The certified reference material CRM-100-minor and trace elements in beech leaves -was used to build the calibration curve used for quantification. Values represent the average and the standard deviation forthe measurements (n=3). The Student t value (95%confidence level) for CRM 281 must be ≤2.160 and for the sunflower Se treated group must be ≤2.776. CRM1575a is a reference material for sulphur Certified value (mg g~) MW ICP-MS" (mg g) LA-ICP-MS(mg g ) Statistical test Standard addition CRM 100 2.69 ±0.04 — 2.7±0.1 0.126 Pellets CRM 1575a (0.96) 0.99±0.2 Pellets sunflower Se treated group 7.6±0.2 6.8±0.6 2.191 correlation coefficients obtained for Se and S were 0.9999 and0.9992, respectively, indicating that the proposed procedure forpellet preparation as well as the strategy adopted for datacollection and treatment were adequate. The results related to the validation of the procedure can beseen in Tables 3 and 4 for Se and S, respectively. The precisionof measurements using the hyphenation LA-ICP-MS is lowerand explained in terms of the analysis of solid samples. Sulfur Concentration (mg g) Fig. 2 Se (images A, C and E) and S (images B, D and F) distributions observed in sunflower leaves after 29 (A and B), 45 (Cand D) and 50 (E and F) days of cultivation.Leaves in A and B were irrigated with 106 mg of Se (sodium selenite), and in C and D with 174 mg of Se. Both Se and S distributions are shown in the sunflower leaves(E and F) collected from the control group after 50 days of cultivation. The picture of each leaf analyzed is shown on the upper left side of the image. In fact, all other data were obtained through techniques usinganalysis of solutions, which present homogeneity at the mole-cular level, thus explaining the higher precisions. The applica-tion of the t-test at 95% confidence level indicates goodagreement between each group of the results. Analysis of the images Fig.2 shows the results obtained for the distribution of Se and Sin the leaves. For the leaves corresponding to plants treatedwith Se after 29 days of cultivation, Fig. 2A shows that Se ispresent mainly at the tip of the leaf. Additionally, the leaf itself(shown in the upper right corner) presents chlorosis regionscaused by the excess of Se added during cultivation. However, adirect correlation between the accumulation of Se in a specificregion of the leaf and morphological problems in the leaf wasnot observed. When the Se distribution is compared with theprofile obtained for S (see Fig. 2B), a correlation between bothspecies is noted. In a previous work,2 the authors reported thatsunflower plants irrigated with Se preferentially promoted thetranslocation of this element to the leaves. In addition, theconcentration of S in this region of the plant also increased,probably due to activation of the S uptake pathway. Theliterature reports that Se can replace S in amino acids,23,28and this result indicates that the metabolism of S can change inthe presence of high concentration of Se.21,29 The evaluation of a leaf after 45 days of cultivation revealsthat the levels of Se increased ca. 5 times when compared withthe leaf studied after 29 days, as can be seen in Fig. 2C. In thiscase, the distribution of Se was essentially homogeneous in allregions of the leaf. It is necessary to emphasize that under bothstudied conditions, part of the Se may have been lost during thesample preparation procedure since some volatile Se compounds,such as dimethvlselenide and dimethyldiselenide, are sup-posed to be present in the leaves3 and could have beeneliminated during the heating process. Related to the S distri-bution shown in Fig. 2D, although its level has been increasedwhen compared with the leaf after 29 days of cultivation, thiselement is mainly concentrated at the tip of the structure and itis not homogeneously distributed in the leaf. The comparison between Se treated plants and the controlgroup reveals that both Se and S levels are lower in the controlplants. The concentration of Se for the reference plants shownin Fig. 2E is lower than 25ug g. The same profile is observedfor S, as can be seen in Fig. 2F, but, in this case, the level of thiselement is close to the level found in the certified referencematerial, which is in the expected concentration of S in leavesfor most of the plants. Conclusions The initial purpose of mapping and determining Se in leavesafter adding sodium selenite to the sunflower plants wassuccessfully attained. Besides good accuracy obtained by quan-titative laser ablation, which is due not only to the optimizationfor SeO* formation inside the reaction cell of the equipment foreliminating/avoiding polyatomic interferences, but also to the use of 12ct as the internal standard for compensating signalfluctuations during ablation, this technique was shown to beuseful for mapping Se and S in sunflower leaves, demonstratingdifferent behavior in terms of Se and S distributions in theleaves. Additionally, through the LA(i) it was also be possible toconclude that Se is not present in the oxidized regions of theleaves. Another important point in the work was the lower thanusual plasma radiofrequency used (1000 W), making possiblegood sensitivity even when working with a different mass-charge ratio from 80 (most abundant Se isotope). Finally, this work demonstrates that both LA(i)-ICP-MS andLA-ICP-MS are excellent techniques for macro or local analyses,since optimization conditions can be carefully evaluated. Notes and references 1 N. Verbruggen, C. Hermans and H. Schat, New Phytol., 2009,181,759. 2 S. C. Booth, M. L. Workentine, A. M. Weljie and R.J. Turner,Metallomics, 2011, 3, 1142. 3 D. Esteban-Fernandez, E. Moreno-Gordaliza, B. Canas, M. A.Palacios and M. M. Gomez-Gomez, Metallomics, 2010, 2, 19. 4 S. Mounicou, J. Szpunar and R. Lobinski, Chem. Soc. Rev.,2009, 38, 1119. 5 M. Ha,J. H. Kwak, Y. Kim and O. P. Zee, Food Chem., 2012,133,1155. 6 Y. J. Lee, D. C. Perdian, Z. Song, E. S. Yeungg andB. J. Nikolau, Plant J., 2012, 70, 81. 7 S. Kaspar, M. Peukert, A. Svatos, A. Matros and H. P. Mock,Proteomics, 2011, 11,1840. 8 Y. Li, B. Shrestha and A. Vertes, Anal. Chem.,2008,80,407. ( 9 P . J. Horn, A. R. Korte, P. B. Neogi, E. Love,J. Fuchs, K. Strupat,L. Borisjuk, V. Shulaev, Y. J . Le e and K. D. Chapman, PlantCell, 2012,24,622. ) 10 D. Holscher. R..Shroff.,K..Knop, M..Gottschaldt.A. Crecelius, B. Schneider, D. G. Heckel, U. S. SchubertandA. Svatos, Plant J., 2009, 60, 907. ( 11 K . J . C loete, W. J . P rzybylowicz, J . Mesjasz-Przybylowicz,A. D. Barnadas, A. J.V a lentine a n d A. Bo t ha, Pl a nt, Ce l lEnviron., 2010, 33,1005. ) ( 12 N . Grignon, S. Halpern and J. Jeusset, J. Microsc.(Oxford, U. K.), 1997, 186, 51. ) ( 13 S . N. Gray,J. Dighton, S . Olsson a nd D. H. Jennings, NewPhytol., 1995, 129, 449. ) ( 14 J. S. Becker, Int. J. Mass Spectrom., 2010, 289,65. ) ( 15 J. Lear, D. J. Harc, F. Fryer, P. A. Adland, D. I. Finkelsteinand P. A. Doble, Anal. Chem.,2012,84,6707. ) ( 16 D . S . U rgast, D . G . El l ingsen, B. Berlinger, E. Ei l ertsen,G. Friisk, V. S koug, Y . T h omassen, J. H . B eattie, I.-S . Kwuan and J. Feldmann, Anal. Bioanal. C h em., 2012,404,89. ) ( 17 B . Wu and J. S. Becker, Int. J. Mass Spectrom.,2012,323-324,34. ) ( 18 I. Konz, B. Fernandez, M. L . F ernandez, R. P ereiro a ndA. Sanz-Medel, Anal. Bioanal. Chem., 2012, 403, 2 113. ) ( 19 J. A. T. Pugh, A. G. Cox, C. W. M cLeod, J. Bunch, M. J. Waiter, S. L. Hart, A . Bienemann, E. White and J. Bell, Anal. Bioanal. Chem., 2012, 403,1641. ) ( 20 M . W. B o urassa and L. M . Miller, Metallomics, 2 012,4,721. ) ( 21 J. S . Becker, Inorganic M a ss Spectrometry. Pr i nciples an d Applications, Wiley, 2007. ) 22 M. A. O. da Silva, S. A. L. Andrade, P. Mazzafera and M. A. Z.Arruda, Int. J. Mass Spectrom., 2011, 307, 55. ( 23 J. S. Garcia, P. L. Gratao, R. A. Azevedo and M. A. Z. Arruda,J. Agric . Food Chem.,2006,54, 8623. ) ( 24 M . A. O. da Silva and M. A. Z. Arruda, Microchim. Acta, 2012, 176,131. ) ( 25 B . Wu, Y. Chen a n d J. S . B e cker, Anal. C him. A cta, 2009, 633, 165. ) 26 J. Lu and A. Holmgren,J. Biol. Chem., 2009, 284, 723. 27 B. Wu, M. Zoriy, Y. Chen and J. S. Becker, Talanta,2009,78,132. 28 M. J. Hawkesford and L. J. De Kok, Sulfur in Plants:An Ecological Perspective, Springer, 2007. 29 M. J. Hawkesford and L. J. Kok, Plant, Cell Environ., 2006,29,382. ( 30 P. J. White, H. C . Bowen, P. P a rmaguru, M. Fr i tz,W. P. S pracklen, R. E. Spiby, M. C. Meacham, A. M ead, M. Harriman, L. J. Trueman, B . M. S mith, B . Thomas and M. R . Broadley, J. Exp. Bot., 2004 , 55,1927. ) Registered Charity Number This journal is The Royal Society of Chemistry etallomics, , 采用定性和定量相结合的方法,对向日葵叶片中硒和硫的含量进行了测定。这些植物在温室里生长了50天,被分为两组,一组只用去离子水灌溉,另一组用每日7.58毫克的Na2SeO3处理。在生长期间采集叶片,直接分析硒和S在这些结构中的分布。定量分析采用CRM(Se和S分别为100和1575a)和葵花原料制成的靶丸。分别加入25和1200mg/g的Se、5和20mg/g的S,用LA-ICP-MS对其进行分析。为准确起见,所有样品还通过微波分解和ICP-MS分析。为了避免多原子干扰,Se和S分别在96和48m/z时用SeO+和SO+监测,内部标准为12C+,测量时采用SeO+/C+和SO+/C+的比值。统计检验(95%置信水平下的t检验)证实LA-ICP-MS与ICP-MS具有良好的一致性,验证了该技术的准确性。
确定
还剩5页未读,是否继续阅读?

产品配置单
上海凯来仪器有限公司为您提供《向日葵叶中硒和硫含量检测方案(激光剥蚀进样)》,该方案主要用于其他中硒和硫含量检测,参考标准--,《向日葵叶中硒和硫含量检测方案(激光剥蚀进样)》用到的仪器有ESL213 灵活的激光剥蚀系统
推荐专场
相关方案
更多
该厂商其他方案
更多