


方案详情
文
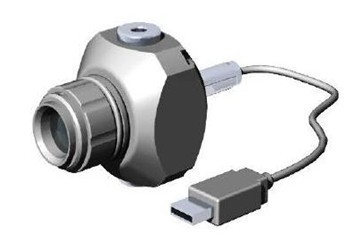
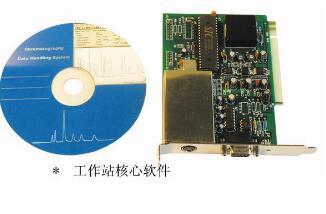
用400毫焦的PIV激光器作光源,用LaVision的ImagerHS型高速相机做成像器件,用LaVision的DaVis软件平台分析处理图像采集数据。对生物瓣膜假体的流体动力学性能进行了测试,分析。
方案详情

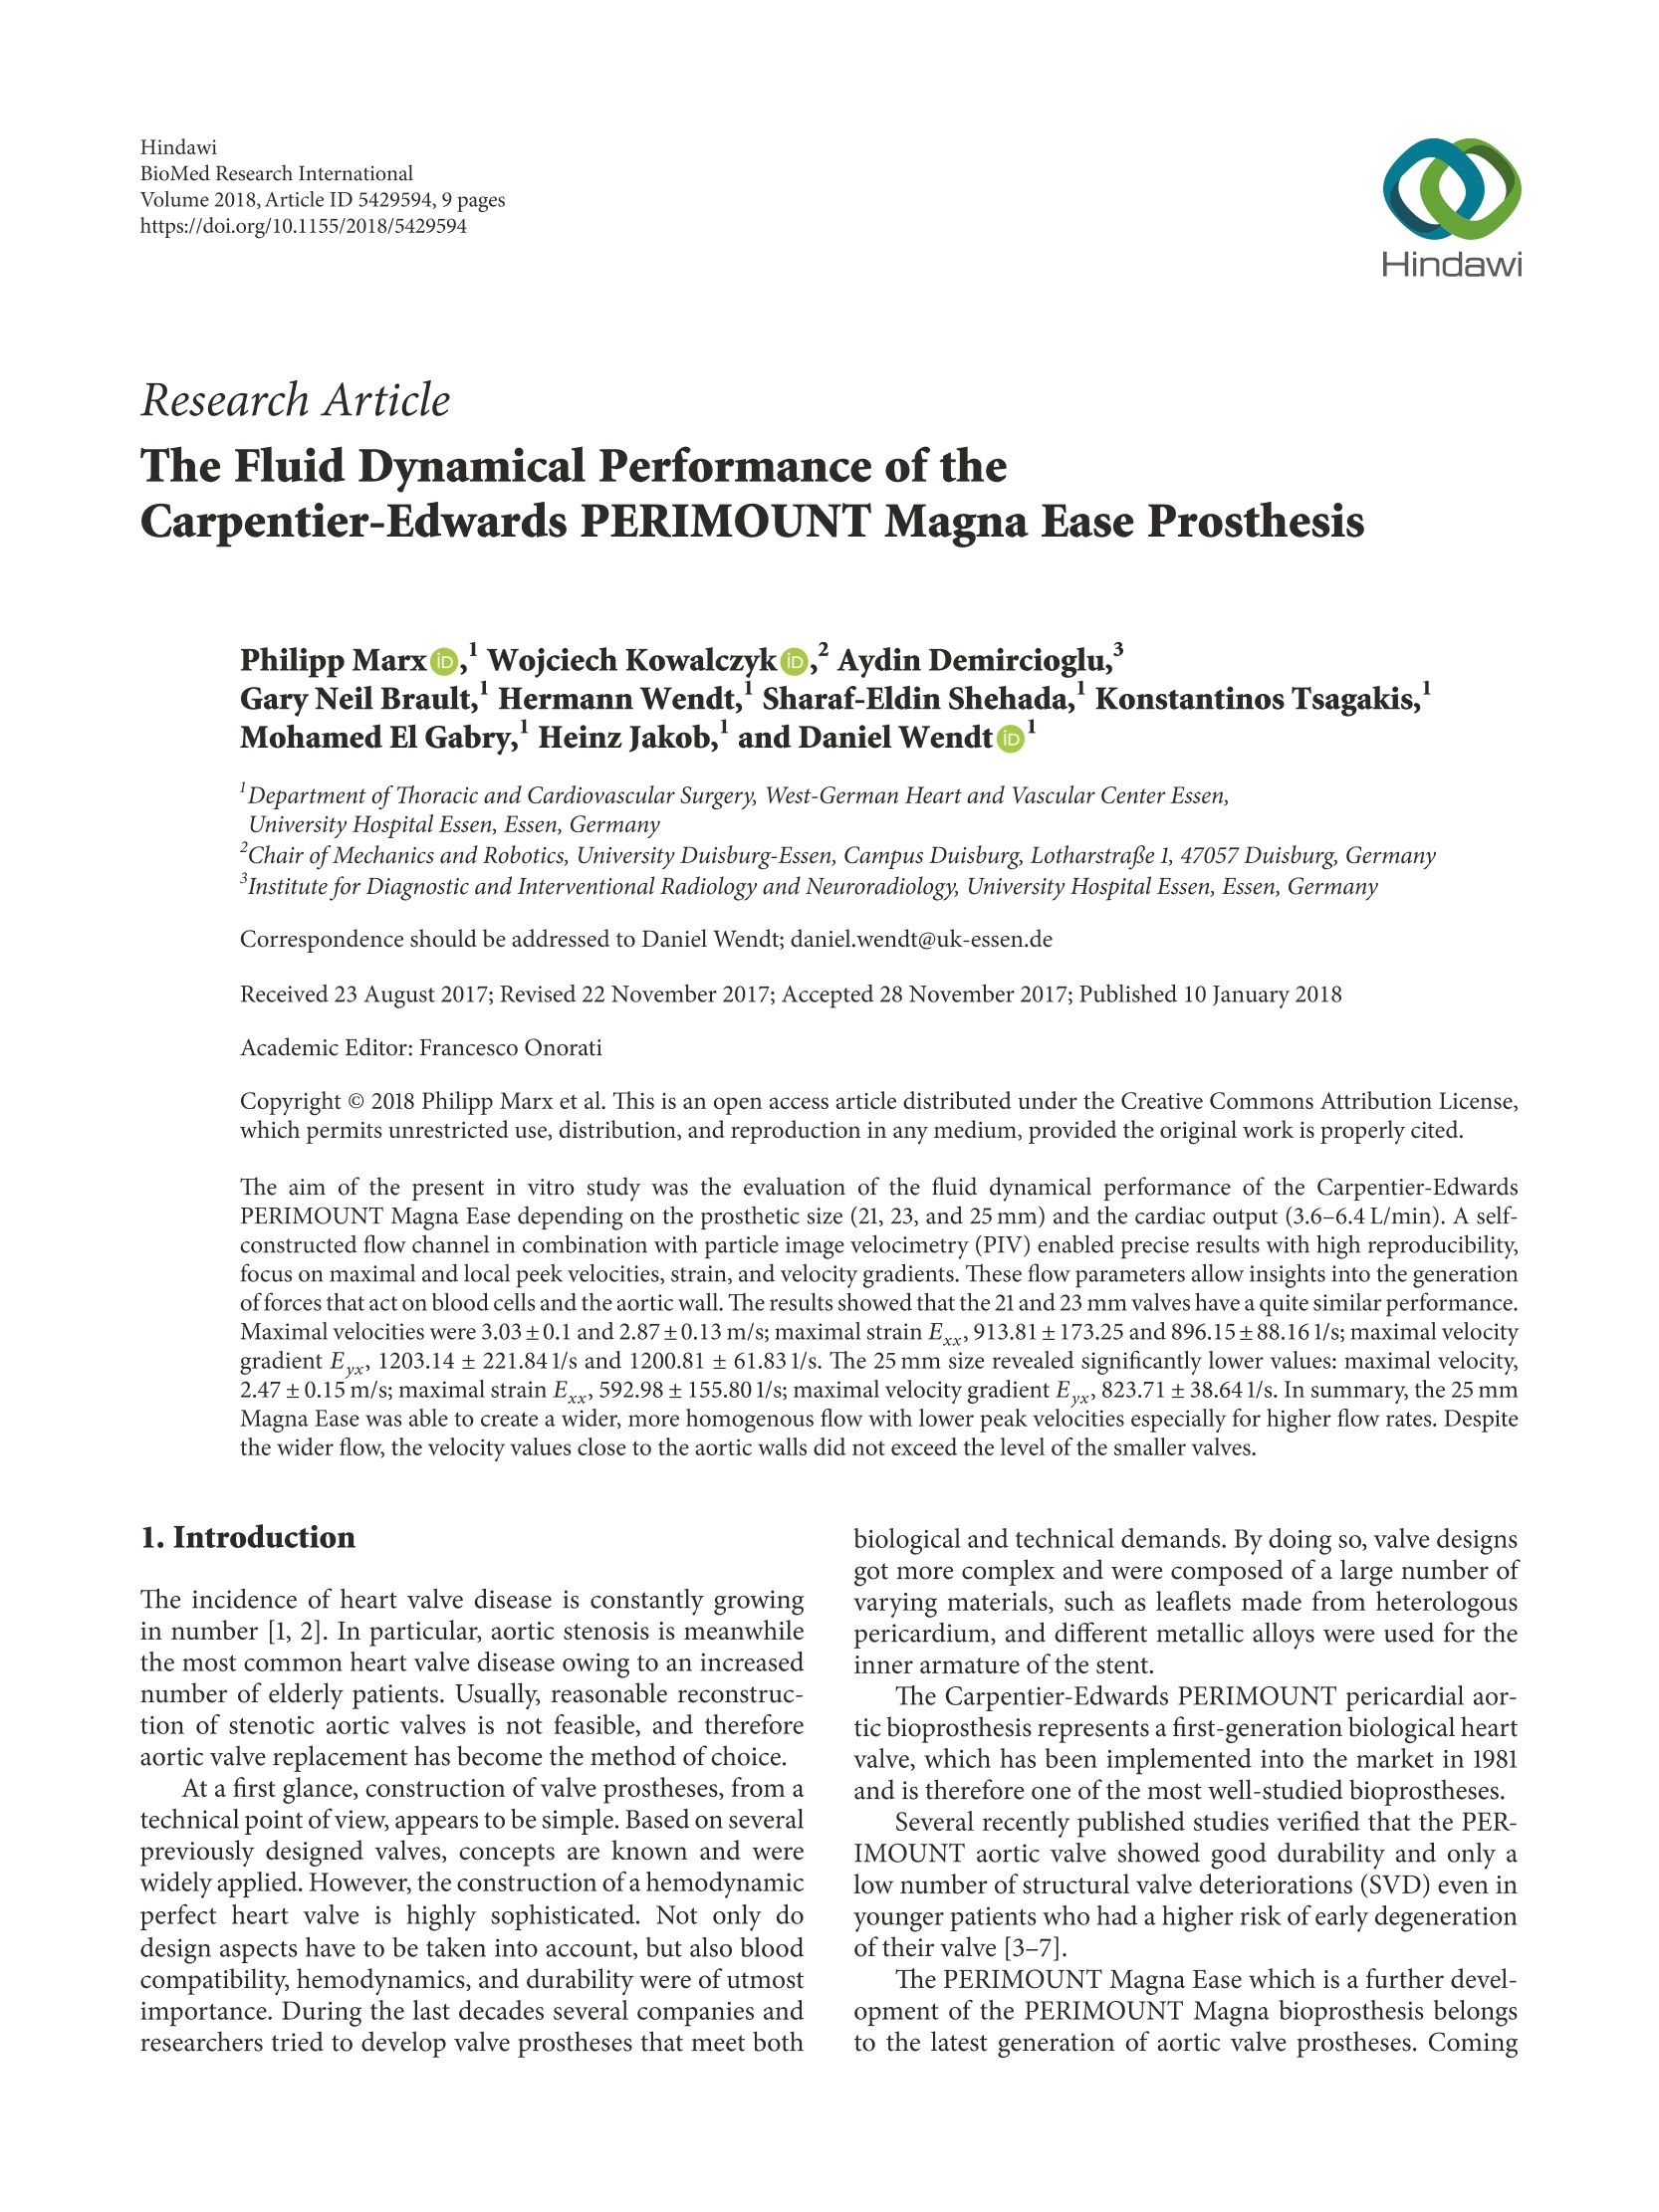
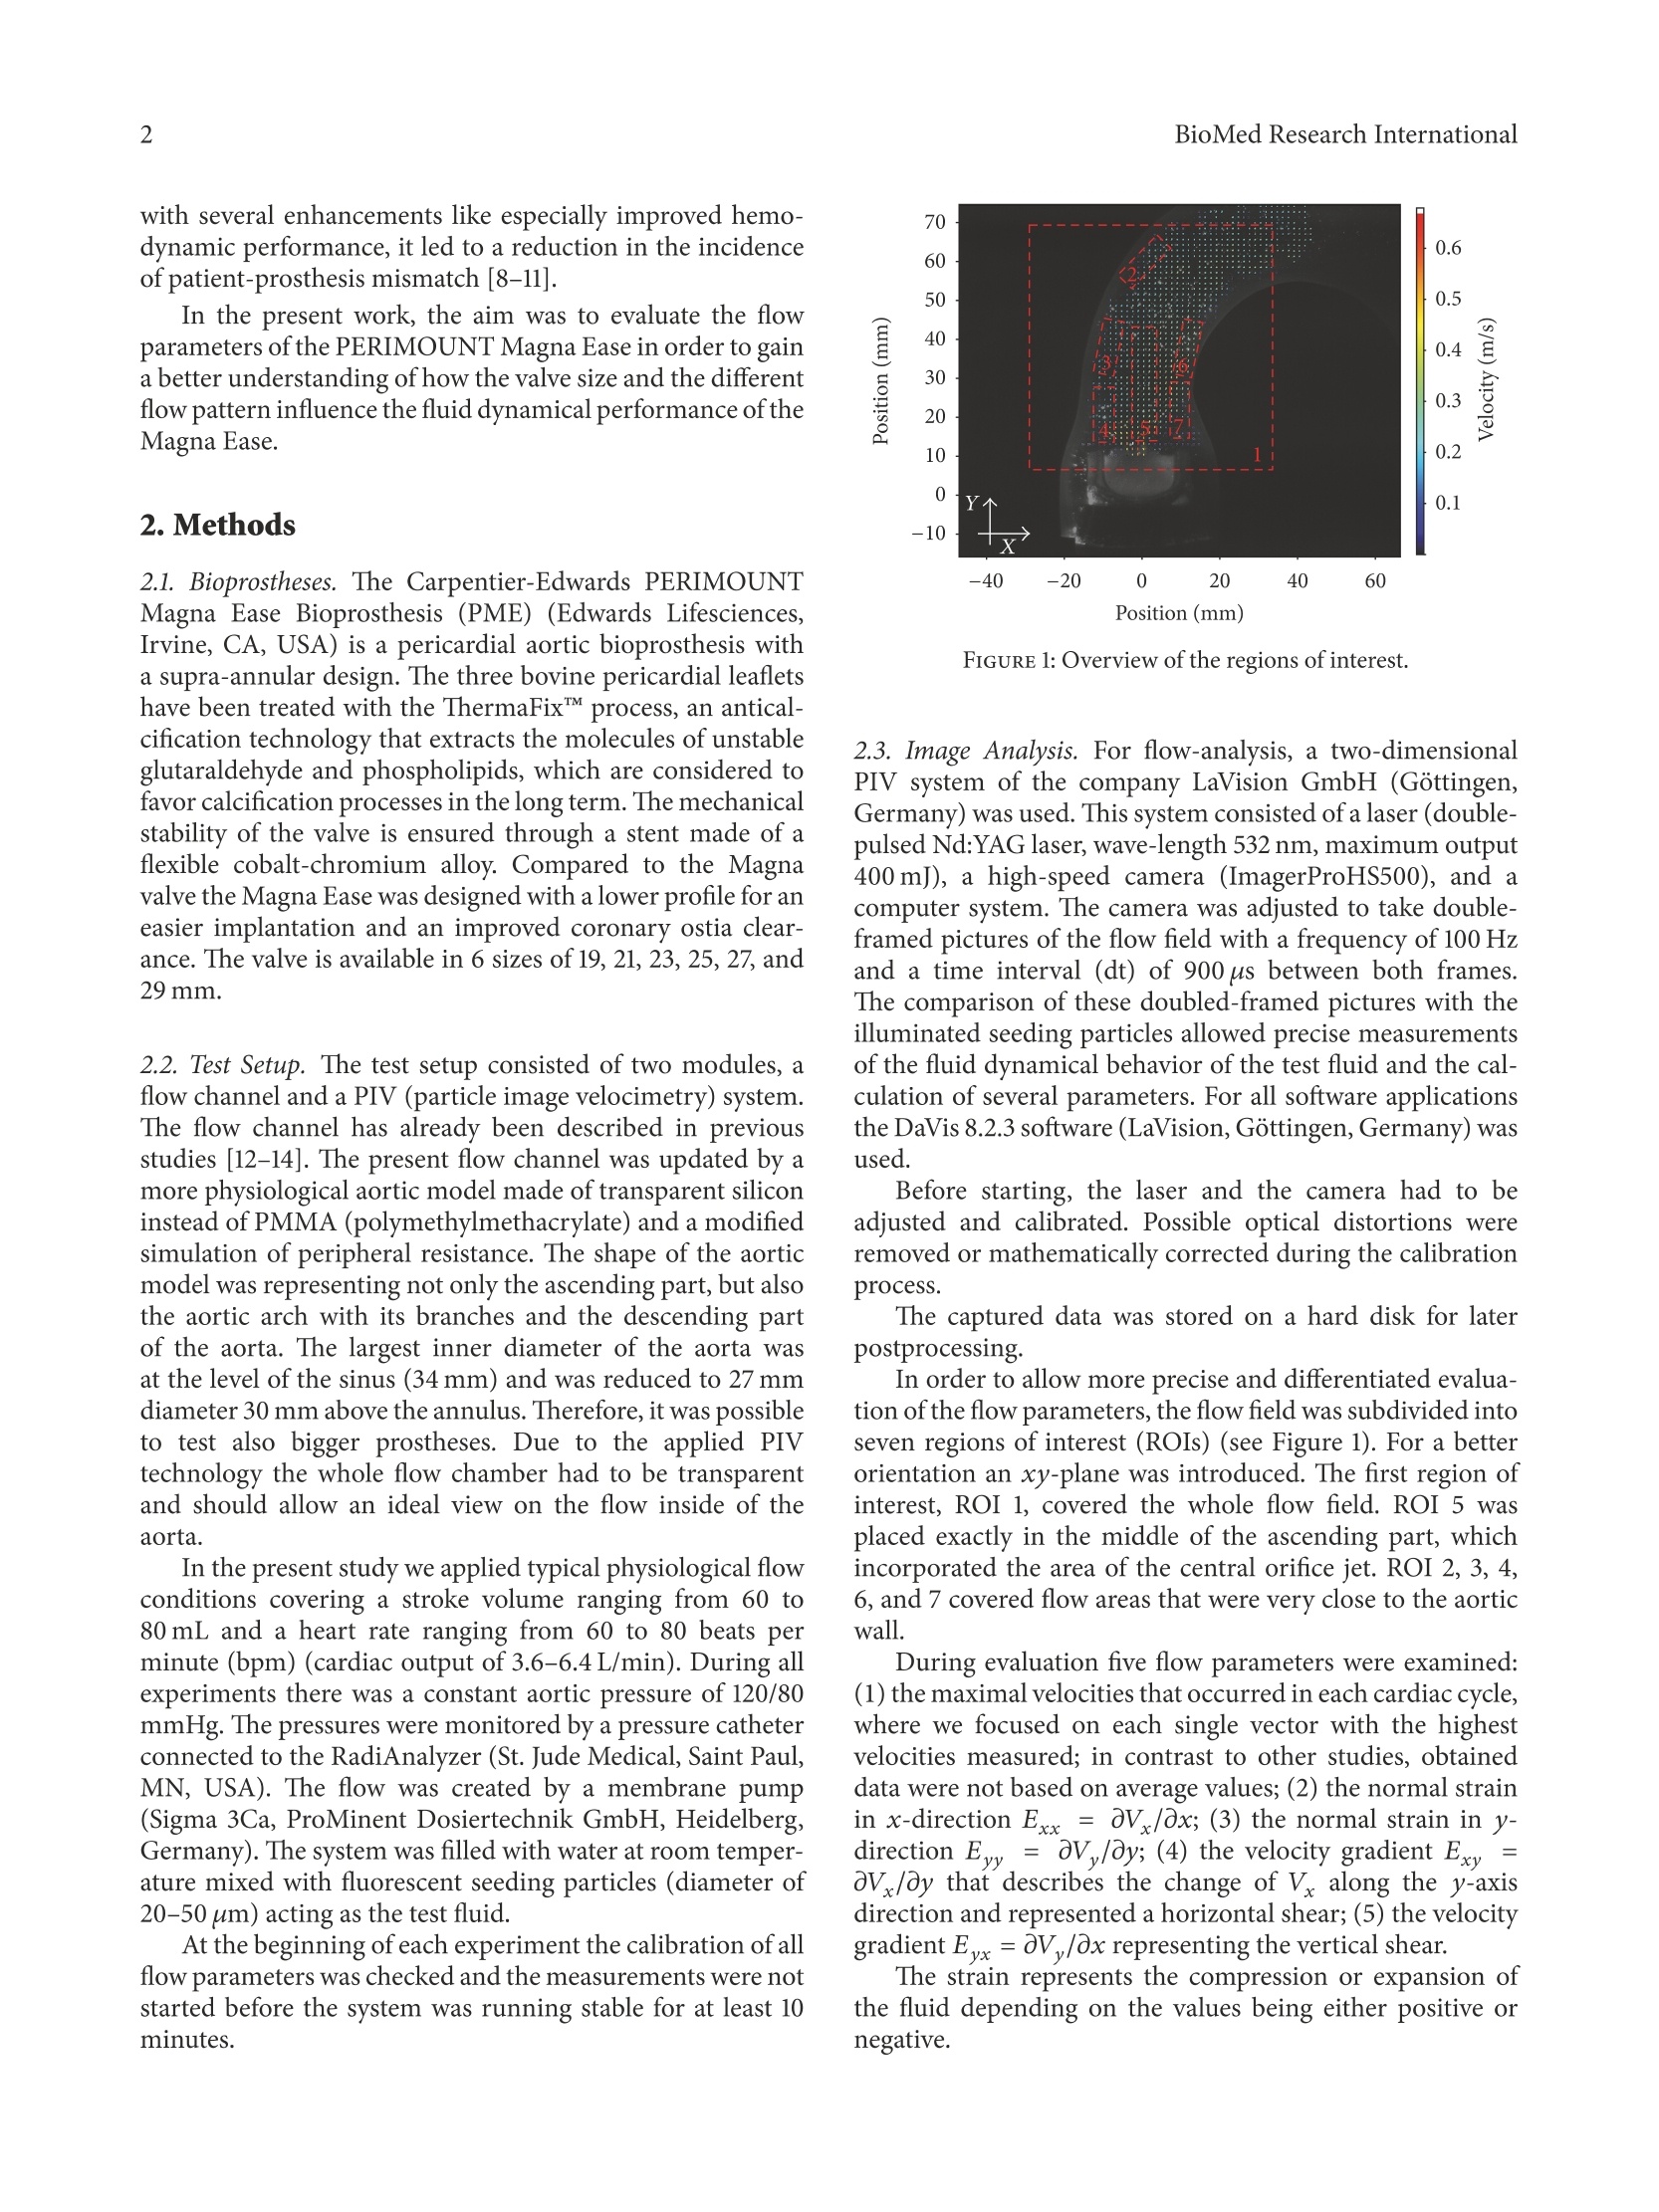
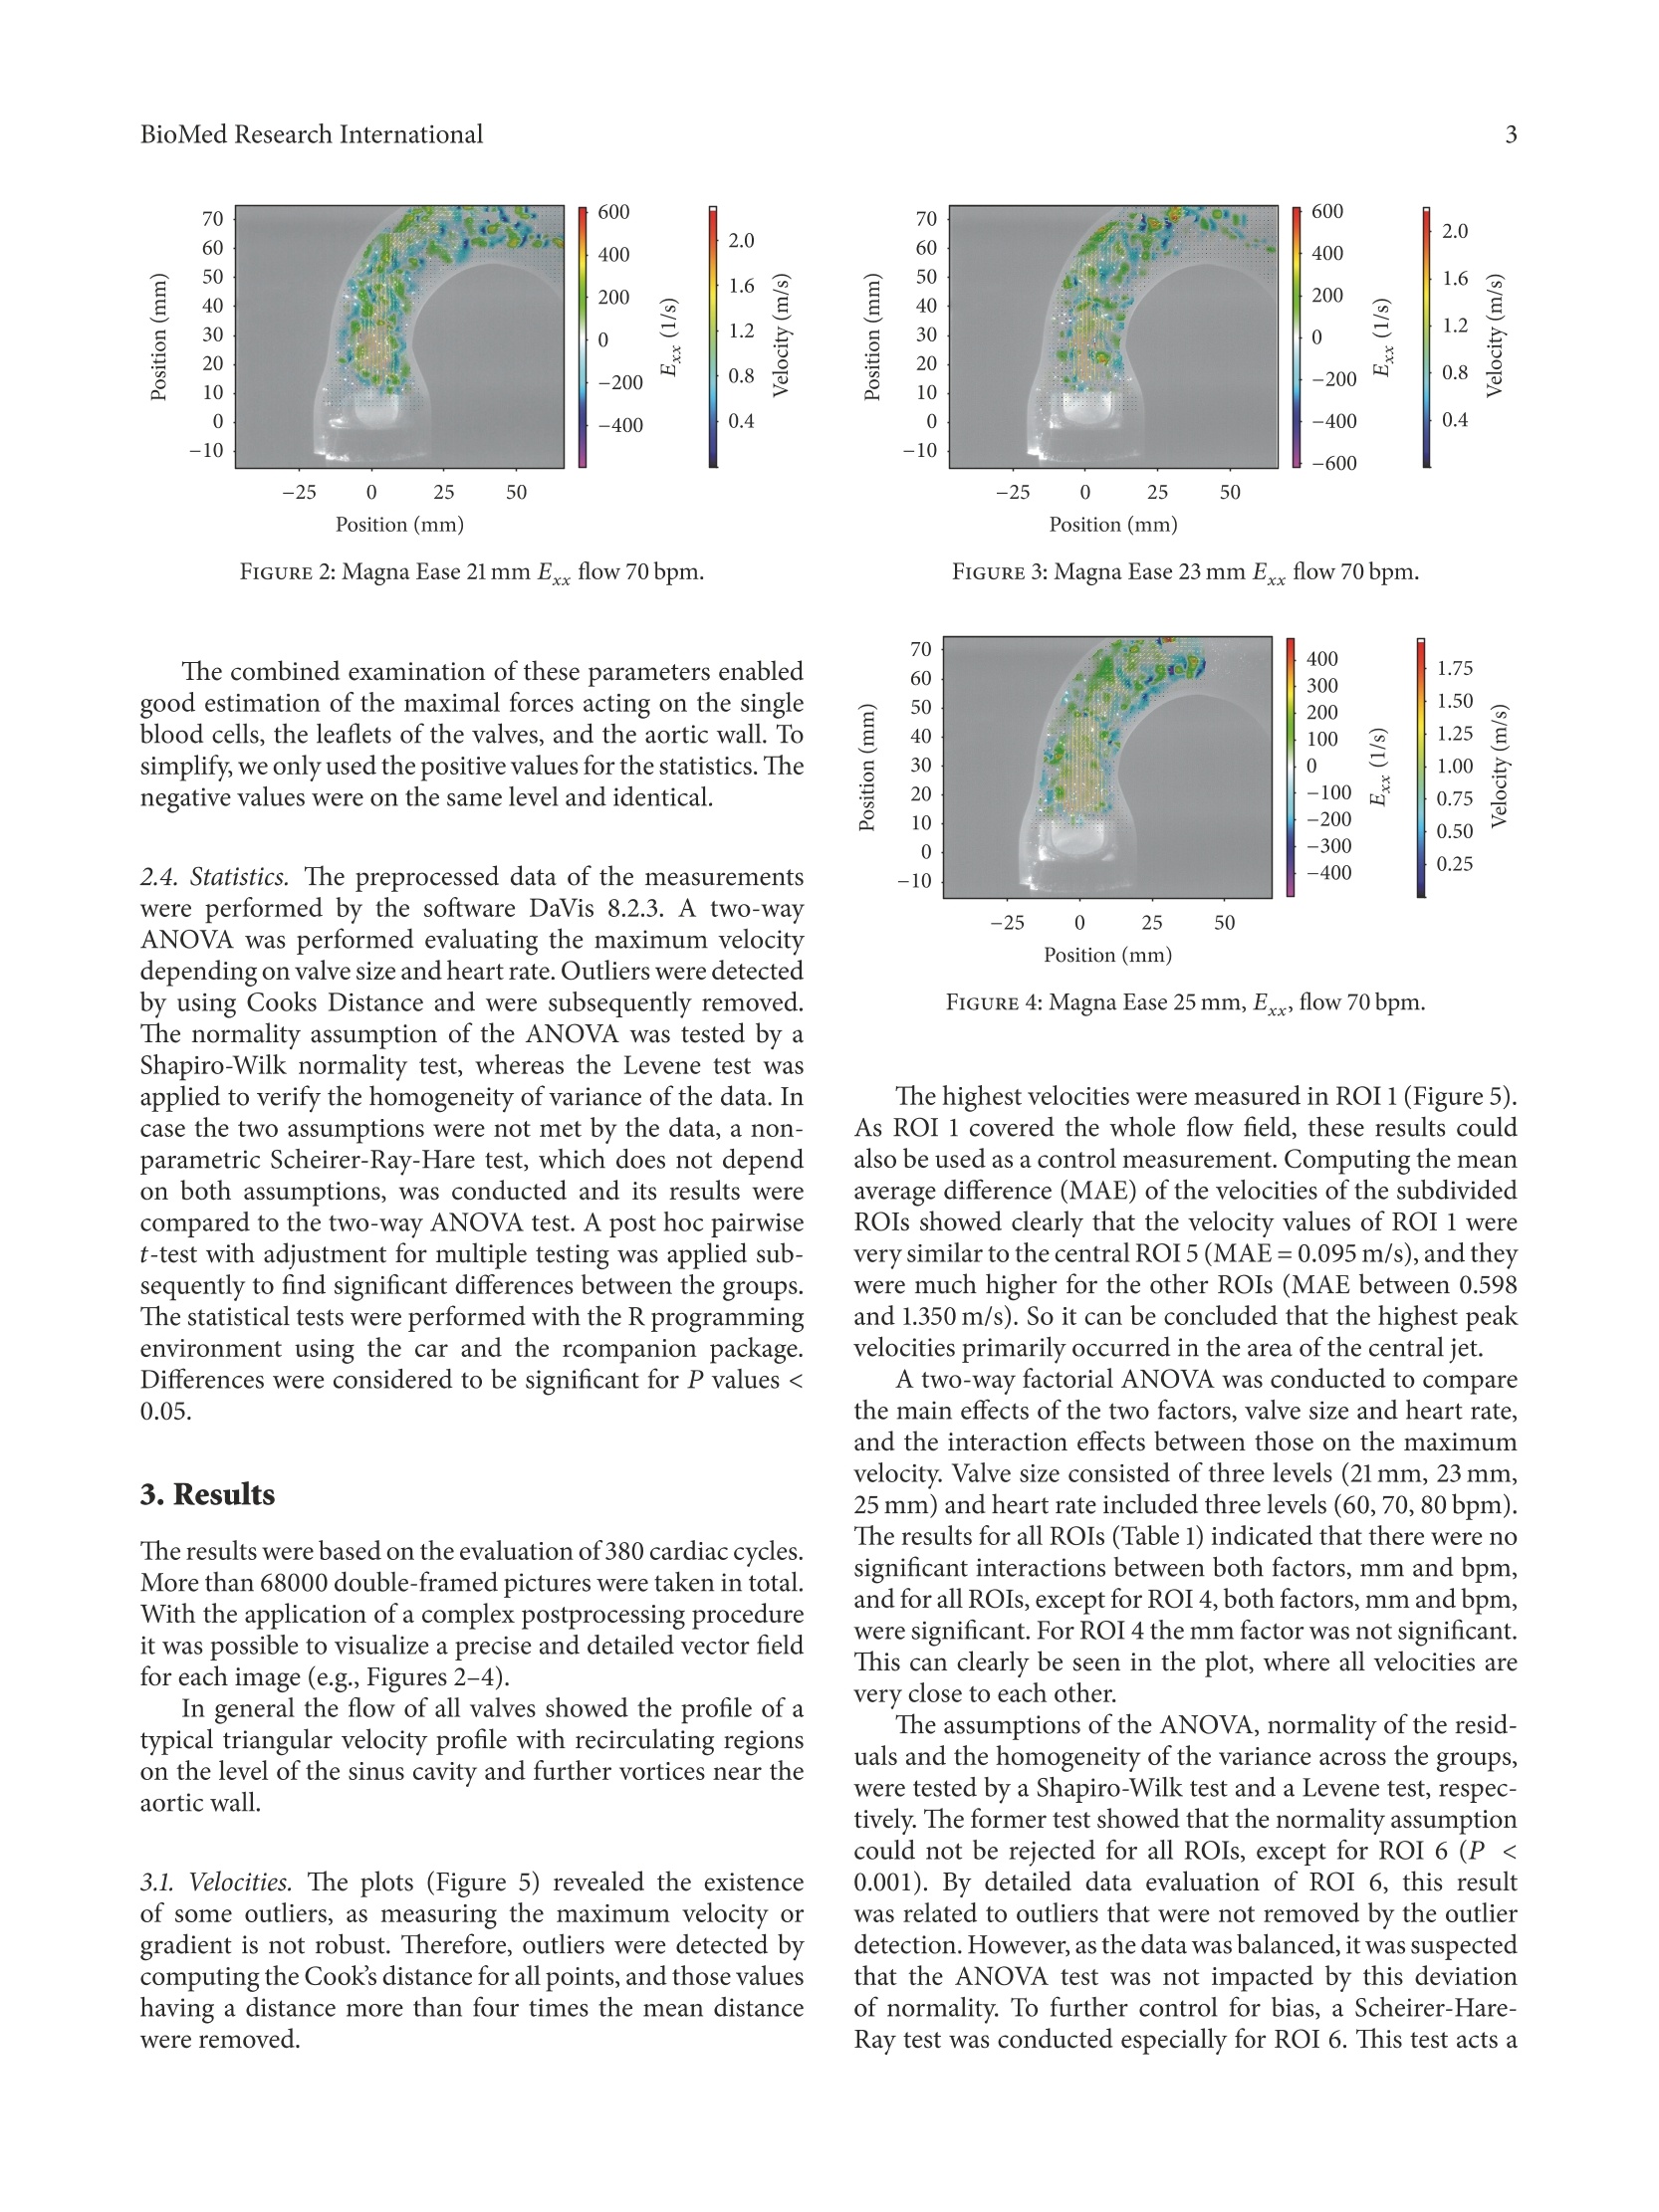
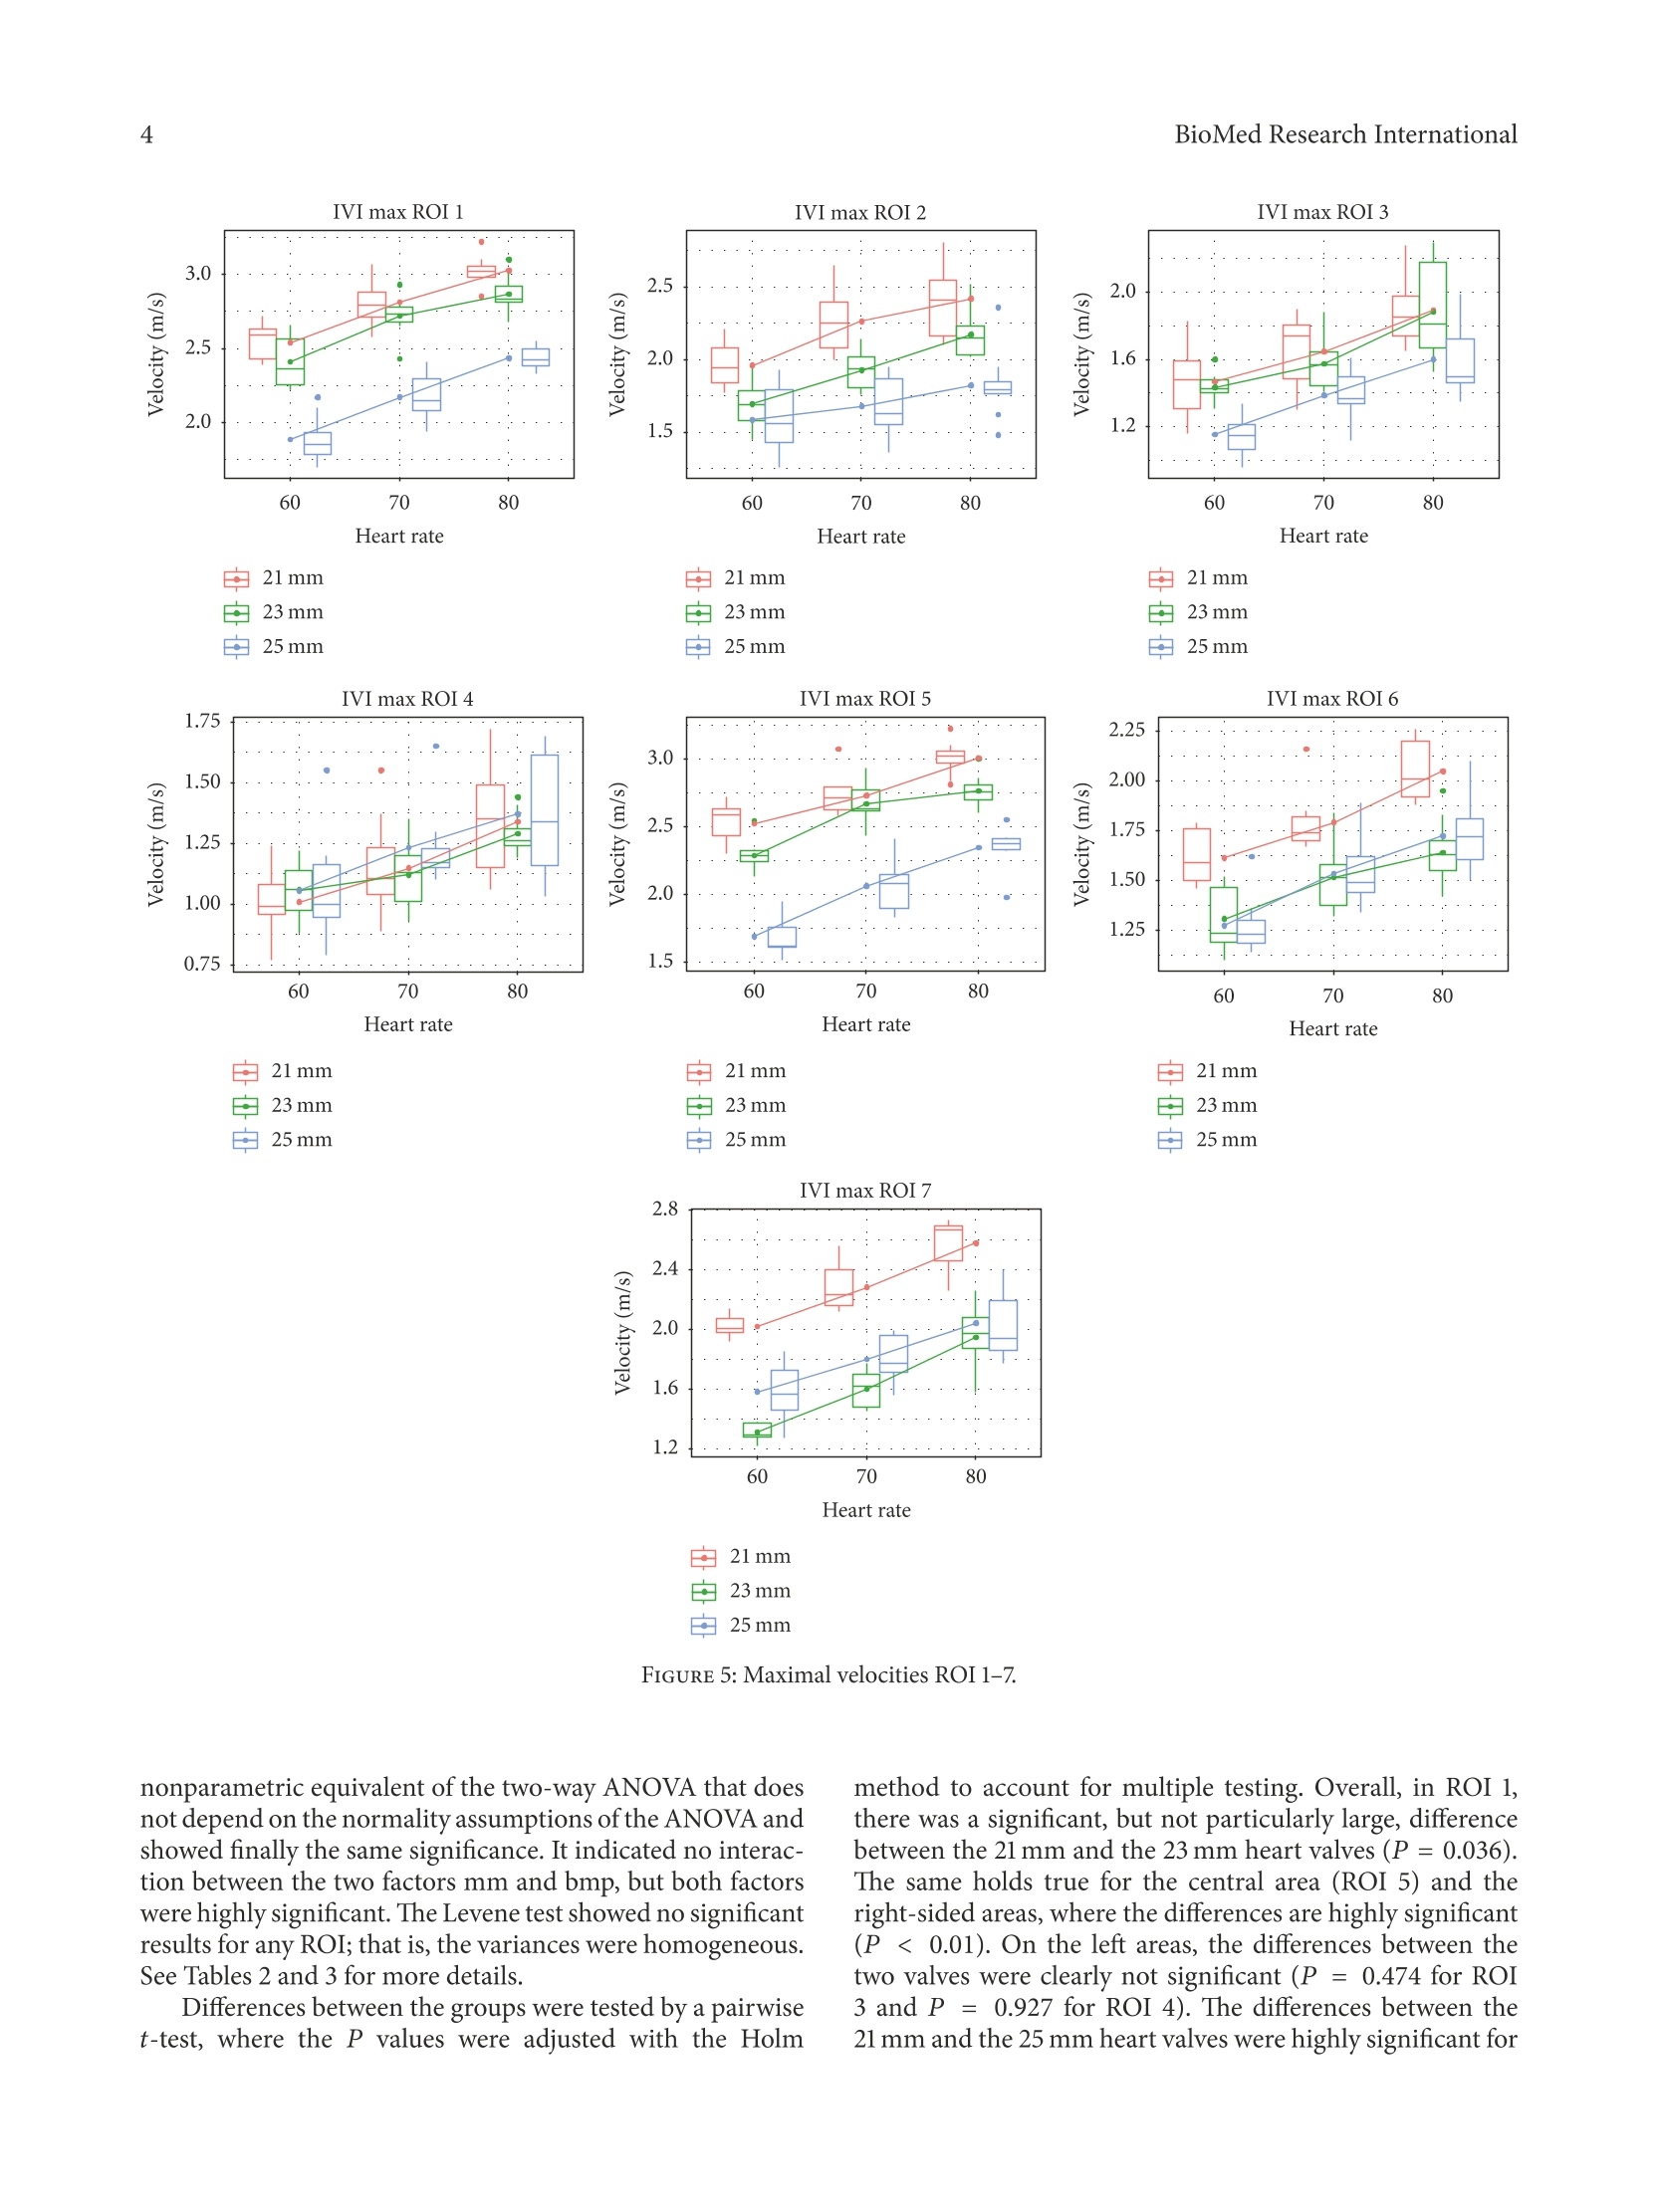
HindawiBioMed Research InternationalVolume 2018, Article ID 5429594, 9 pageshttps://doi.org/10.1155/2018/5429594Hindawi BioMed Research International2 Research Article The Fluid Dynamical Performance of theCarpentier-Edwards PERIMOUNT Magna Ease Prosthesis Philipp Marx@, Wojciech KowalczykD,Aydin Demircioglu, Gary Neil Brault, Hermann Wendt, Sharaf-Eldin Shehada, Konstantinos Tsagakis,Mohamed El Gabry, Heinz Jakob, and Daniel Wendt 'Department of Thoracic and Cardiovascular Surgery, West-German Heart and Vascular Center Essen, University Hospital Essen, Essen, Germany .Chair of Mechanics and Robotics, University Duisburg-Essen, Campus Duisburg, LotharstraSe 1, 47057 Duisburg, Germany Institute for Diagnostic and Interventional Radiology and Neuroradiology, University Hospital Essen, Essen, Germany Correspondence should be addressed to Daniel Wendt; daniel.wendt@uk-essen.de Received 23 August 2017;Revised 22 November 2017; Accepted 28 November 2017; Published 10 January 2018 Academic Editor: Francesco Onorati Copyright O 2018 Philipp Marx et al. This is an open access article distributed under the Creative Commons Attribution License,which permits unrestricted use, distribution, and reproduction in any medium, provided the original work is properly cited The aim of the present in vitro study was the evaluation of the fluid dynamical performance of the Carpentier-EdwardsPERIMOUNT Magna Ease depending on the prosthetic size (21, 23, and 25 mm) and the cardiac output (3.6-6.4L/min). A self-constructed flow channel in combination with particle image velocimetry (PIV) enabled precise results with high reproducibility,focus on maximal and local peek velocities, strain, and velocity gradients. These flow parameters allow insights into the generationof forces that act on blood cells and theaortic wall. The results showed that the 21 and 23 mm valves have a quite similar performance.Maximal velocities were 3.03±0.1 and 2.87±0.13 m/s; maximal strain Exx,913.81±173.25 and 896.15±88.161/s; maximal velocitygradient E,1203.14±221.841/s and 1200.81±61.83 1/s. The 25 mm size revealed significantly lower values: maximal velocity,2.47±0.15 m/s; maximal strain Exx,592.98±155.801/s; maximal velocity gradient E,823.71±38.641/s. In summary, the 25mmMagna Ease was able to create a wider, more homogenous flow with lower peak velocities especially for higher flow rates. Despitethe wider flow, the velocity values close to the aortic walls did not exceed the level of the smaller valves. 1.Introduction The incidence of heart valve disease is constantly growingin number [1, 2]. In particular, aortic stenosis is meanwhilethe most common heart valve disease owing to an increasednumber of elderly patients. Usually, reasonable reconstruc-tion of stenotic aortic valves is not feasible, and thereforeaortic valve replacement has become the method of choice. At a first glance, construction of valve prostheses, from atechnical point of view, appears to be simple. Based on severalpreviously designed valves, concepts are known and werewidely applied. However, the construction of a hemodynamicperfect heart valve is highly sophisticated. Not only dodesign aspects have to be taken into account, but also bloodcompatibility, hemodynamics, and durability were of utmostimportance. During the last decades several companies andresearchers tried to develop valve prostheses that meet both biological and technical demands. By doing so, valve designsgot more complex and were composed of a large number ofvarying materials, such as leaflets made from heterologouspericardium, and different metallic alloys were used for theinner armature of the stent. The Carpentier-Edwards PERIMOUNT pericardial aor-tic bioprosthesis represents a first-generation biological heartvalve, which has been implemented into the market in 198]and is therefore one of the most well-studied bioprostheses. Several recently published studies verified that the PER-IMOUNT aortic valve showed good durability and only alow number of structural valve deteriorations (SVD) even inyounger patients who had a higher risk of early degenerationof their valve [3-7]. The PERIMOUNT Magna Ease which is a further devel-opment of the PERIMOUNT Magna bioprosthesis belongsto the latest generation of aortic valve prostheses. Coming with several enhancements like especially improved hemo-dynamic performance, it led to a reduction in the incidenceof patient-prosthesis mismatch [8-11]. In the present work, the aim was to evaluate the flowparameters of the PERIMOUNT Magna Ease in order to gaina better understanding of how the valve size and the differentflow pattern influence the fluid dynamical performance oftheMagna Ease. 2. Methods 2.1. Bioprostheses. The Carpentier-Edwards PERIMOUNTMagna Ease Bioprosthesis (PME) (Edwards Lifesciences,Irvine, CA, USA) is a pericardial aortic bioprosthesis witha supra-annular design. The three bovine pericardial leafletshave been treated with the ThermaFixTM process, an antical-cification technology that extracts the molecules of unstableglutaraldehyde and phospholipids, which are considered tofavor calcification processes in the long term. The mechanicalstability of the valve is ensured through a stent made of aflexible cobalt-chromium alloy. Compared to the Magnavalve the Magna Ease was designed with a lower profile for aneasier implantation and an improved coronary ostia clear-ance. The valve is available in 6 sizes of 19, 21, 23, 25,27, and29 mm. 2.2. Test Setup. The test setup consisted of two modules, aflow channel and a PIV (particle image velocimetry) system.The flow channel has already been described in previousstudies [12-14]. The present flow channel was updated by amore physiological aortic model made of transparent siliconinstead of PMMA (polymethylmethacrylate) and a modifiedsimulation of peripheral resistance. The shape of the aorticmodel was representing not only the ascending part, but alsothe aortic arch with its branches and the descending partof the aorta. The largest inner diameter of the aorta wasat the level of the sinus (34 mm) and was reduced to 27 mmdiameter 30 mm above the annulus. Therefore, it was possibleto test also bigger prostheses. Due to the applied PIVtechnology the whole flow chamber had to be transparentand should allow an ideal view on the flow inside of theaorta. In the present study we applied typical physiological flowconditions covering a stroke volume ranging from 60 to80 mL and a heart rate ranging from 60 to 80 beats perminute (bpm) (cardiac output of 3.6-6.4 L/min). During allexperiments there was a constant aortic pressure of 120/80mmHg. The pressures were monitored by a pressure catheterconnected to the RadiAnalyzer (St. Jude Medical, Saint Paul,MN, USA). The flow was created by a membrane pump(Sigma 3Ca, ProMinent Dosiertechnik GmbH, Heidelberg,Germany). The system was filled with water at room temper-ature mixed with fluorescent seeding particles (diameter of20-50 um) acting as the test fluid. At the beginning of each experiment the calibration of allflow parameters was checked and the measurements were notstarted before the system was running stable for at least 10minutes. FIGURE 1: Overview of the regions of interest. 2.3. Image Analysis. For flow-analysis, a two-dimensionalPIV system of the company LaVision GmbH (Gottingen,Germany) was used. This system consisted of a laser (double-pulsed Nd:YAG laser, wave-length 532 nm, maximum output400 mJ), a high-speed camera (ImagerProHS500), and acomputer system. The camera was adjusted to take double-framed pictures of the flow field with a frequency of 100 Hzand a time interval (dt) of 900 us between both frames.The comparison of these doubled-framed pictures with theilluminated seeding particles allowed precise measurementsof the fluid dynamical behavior of the test fluid and the cal-culation of several parameters. For all software applicationsthe DaVis 8.2.3 software (LaVision, Gottingen, Germany) wasused. Before starting, the laser and the camera had to beadjusted and calibrated. Possible optical distortions wereremoved or mathematically corrected during the calibrationprocess. The captured data was stored on a hard disk for laterpostprocessing. In order to allow more precise and differentiated evalua-tion of the flow parameters, the flow field was subdivided intoseven regions of interest (ROIs) (see Figure 1). For a betterorientation an xy-plane was introduced. The first region ofinterest, ROI 1, covered the whole flow field. ROI 5 wasplaced exactly in the middle of the ascending part, whichincorporated the area of the central orifice jet. ROI 2, 3, 4,6, and 7 covered flow areas that were very close to the aorticwall. During evaluation five flow parameters were examined:(1) the maximal velocities that occurred in each cardiac cycle,where we focused on each single vector with the highestvelocities measured; in contrast to other studies, obtaineddata were not based on average values; (2) the normal strainin x-direction Exx = 0V/0x; (3) the normal strain in y.direction Eyy =0v,/Oy; (4) the velocity gr-adient Exyov./oy that describes the change of V. along the y-axisdirection and represented a horizontal shear; (5) the velocitygradient Eyx=0V,,/0x representing the vertical shear. The strain represents the compression or expansion ofthe fluid depending on the values being either positive ornegative. FIGURE 2: Magna Ease 21 mm Exx flow 70bpm. The combined examination of these parameters enabledgood estimation of the maximal forces acting on the singleblood cells, the leaflets of the valves, and the aortic wall. Tosimplify, we only used the positive values for the statistics. Thenegative values were on the same level and identical. 2.4. Statistics. The preprocessed data of the measurementswere performed by the software DaVis 8.2.3. A two-wayANOVA was performed evaluating the maximum velocitydepending on valve size and heart rate. Outliers were detectedby using Cooks Distance and were subsequently removed.The normality assumption of the ANOVA was tested by aShapiro-Wilk normality test, whereas the Levene test wasapplied to verify the homogeneity of variance of the data. Incase the two assumptions were not met by the data, a non-parametric Scheirer-Ray-Hare test, which does not dependon both assumptions, was conducted and its results werecompared to the two-way ANOVA test. A post hoc pairwiset-test with adjustment for multiple testing was applied sub-sequently to find significant differences between the groups.The statistical tests were performed with the R programmingenvironment using the car and the rcompanion package.Differences were considered to be significant for P values <0.05. 3. Results The results were based on the evaluation of 380 cardiac cycles.More than 68000 double-framed pictures were taken in total.With the application of a complex postprocessing procedureit was possible to visualize a precise and detailed vector fieldfor each image (e.g., Figures 2-4). In general the flow of all valves showed the profile of atypical triangular velocity profile with recirculating regionson the level of the sinus cavity and further vortices near theaortic wall. 3.1. Velocities. The plots (Figure 5) revealed the existenceof some outliers, as measuring the maximum velocity orgradient is not robust.Therefore, outliers were detected bycomputing the Cook’s distance for all points, and those valueshaving a distance more than four times the mean distancewere removed. 600 400 200o o -200 0.8 -400 2.0 1.6 1.2 0.4 -600 Position (mm) FIGURE 3: Magna Ease 23 mm Exx flow 70 bpm. FIGURE 4: Magna Ease 25 mm, Exx, flow 70 bpm. The highest velocities were measured in ROI 1 (Figure 5).As ROI 1 covered the whole flow field, these results couldalso be used as a control measurement. Computing the meanaverage difference (MAE) of the velocities of the subdividedROIs showed clearly that the velocity values of ROI1 werevery similar to the central ROI 5 (MAE=0.095 m/s), and theywere much higher for the other ROIs (MAE between 0.598and 1.350 m/s). So it can be concluded that the highest peakvelocities primarily occurred in the area of the central jet. A two-way factorial ANOVA was conducted to comparethe main effects of the two factors, valve size and heart rate,and the interaction effects between those on the maximumvelocity.Valve size consisted of three levels (21 mm, 23 mm,25 mm) and heart rate included three levels (60,70,80 bpm).The results for all ROIs (Table 1) indicated that there were nosignificant interactions between both factors, mm and bpm,and for all ROIs, except for ROI 4, both factors, mm and bpm,were significant. For ROI 4 the mm factor was not significant.This can clearly be seen in the plot, where all velocities arevery close to each other. The assumptions of the ANOVA, normality of the resid-uals and the homogeneity of the variance across the groups,were tested by a Shapiro-Wilk test and a Levene test, respec-tively. The former test showed that the normality assumptiorcould not be rejected for all ROIs, except for ROI 6 (P<0.001). By detailed data evaluation of ROI 6, this resultwas related to outliers that were not removed by the outlieldetection.However, as the data was balanced, it was suspectedthat the ANOVA test was not impacted by this deviatiorof normality. To further control for bias, a Scheirer-Hare-Ray test was conducted especially for ROI 6. This test acts a IVI max ROI 1 IVI max ROI 2 IVI max ROI 3 21mm 白23mm 25mm FIGURE 5: Maximal velocities ROI 1-7. nonparametric equivalent of the two-way ANOVA that doesnot depend on the normality assumptions of the ANOVA andshowed finally the same significance. It indicated no interac-tion between the two factors mm and bmp, but both factorswere highly significant. The Levene test showed no significantresults for any ROI; that is, the variances were homogeneous.See Tables 2 and 3 for more details. Differences between the groups were tested by a pairwiset-test, where the P values were adjusted with the Holm method to account for multiple testing. Overall, in ROI 1there was a significant, but not particularly large, differencebetween the 21 mm and the 23 mm heart valves (P =0.036).The same holds true for the central area (ROI 5) and theright-sided areas, where the differences are highly significant(P <0.01). On the left areas, the differences between thetwo valves were clearly not significant (P =0.474 for ROI3 and P =0.927 for ROI 4). The differences between the21 mm and the 25 mm heart valves were highly significant for Interaction between Valve size (mm) Heart rate (bpm) valve size and heart rate (mm:bpm) P<0.001 P <0.001 P=0.032 Grad Exx F(2,79)=41.2 F(2,79)=17.72 F(4,79)=2.79 P<0.001 P<0.001 P=0.479 Grad Exy F(2,77)=27.24 F(2,77)=13 F(4,77)=0.88 P<0.001 P <0.001 P=0.317 Grad Eyx F(2,75)=145.47 F(2,75)=39.55 F(4,75)=1.2 P<0.001 P <0.001 P=0.046 Grad E,, F(2,79)=77.88 F(2,79)=11.6 F(4,79)=2.55 P<0.001 P<0.001 P=0.733 ROI 1 F(2,78)=182.26 F(2,78)=97.19 F(4,78)=0.5 P<0.001 P <0.001 P=0.273 ROI 2 F(2,78)=47.23 F(2,78)=28.41 F(4,78)=1.31 P <0.001 P<0.001 P=0.929 ROI3 F(2,78)=20.23 F(2,78)=38.92 F(4,78)=0.21 P=0.397 P <0.001 P=0.867 ROI4 F(2,76)=0.93 F(2,76)=19.27 F(4,76)=0.32 P <0.001 P <0.001 P=0.063 ROI 5 F(2,76)=199.52 F(2,76)=98.94 F(4,76)=2.34 P<0.001 P <0.001 P =0.631 ROI6 F(2,77)=38.3 F(2,77)=48.15 F(4,77)=0.65 P<0.001 P<0.001 P=0.606 ROI7 F(2,76)=129.8 F(2,76)=80.26 F(4,76)=0.68 TABLE 2: Normality test and homogeneity of variance test. Grad Exx Grad Exy Grad Eyx GradE, ROI1 ROI2 ROI3 ROI4 ROI5 ROI 6 ROI7 Normality test (Shapiro-Wilk) 0.156 0.155 0.587 0.064 0.176 0.248 0.363 0.072 0.361 0.001 0.888 Homogenity of variance test (Levene) 0.062 0.084 <0.001 0.067 0.544 0.723 0.142 0.050 0.871 0.991 0.101 TABLE 3: Significance of pairwise t-tests. Grad Exx GradExy Grad E Grad Eyy ROI1 ROI2 ROI3 ROI4 ROI 5 ROI 6 ROI7 Valve size 21 mm versus 23 mm 0.109 0.263 0.043 0.005 0.036 <0.001 0.474 0.927 0.007 <0.001 <0.001 Valve size 21 mm versus 25 mm <0.001 <0.001 <0.001 <0.001 <0.001 <0.001 <0.001 0.927 <0.001 <0.001 <0.001 Valve size 23 mm versus 25mm <0.001 <0.001 <0.001 <0.001 <0.001 <0.001 <0.001 0.927 <0.001 0.718 0.014 all ROIs (P <0.01) except for ROI 4 (P= 0.927). Finally, thedifferences between the 23 mm and 25 mm heart valves againwere highly significant for all ROIs (P <0.01) except for ROI4 (P=0.927) and ROI 6 (P=0.718). In summary, the central areas and the right areas showeda significant difference between all valves sizes, while on theleft side, the differences between the valves were not thatdifferent. The 25 mm valve was superior to the 21 and 23 mmones, which showed similar velocities. 3.2. Normal Strain and Velocity Gradients. The normal strainand the velocity gradients were calculated only for thecomplete flow field (ROI1). The plots for the normal strain and velocity gradi-ents (Figure 6) again revealed several outliers, which wereremoved by applying the Cooks method. A two-way factorial ANOVA was conducted to compare the main effects of the two factors, valve size andheart rate, and the interaction effects between them on themaximum of the gradients. The results for the gradientsindicated a significant interaction between both factors, mmand bpm, for the velocity gradients Exx (P = 0.032) andE(P= 0.046). No such interaction was visible for thenormal strain gradients, Exy (P= 0.479) and Epx (P =0.317). Both factors, mm and bpm, were highly significant(P<0.01). Again, the assumptions of the ANOVA, normality andvariance homogeneity, were tested. For all gradients, thenormality assumption could not be rejected. The Levene testshowed a significant violation only for E, but not for theother gradients. Because of this, a Scheirer-Ray-Hare test,which is not sensitive to the heterogeneity of the variance, wasapplied to Grad E to verify the results of the ANOVA. Theresults ofthe Scheirer-Ray-Hare test showed the same signifi-cance as the ANOVA test; that is, the interaction between thetwo factors was not significant (P=0.952), but both factorswere highly significant (P<0.01). All groups were tested for differences by a pairwise t-test with Holms method. The differences between the 21 mm and the 23 mm heart valves were not significant for the twogradients Exx (P=0.109) and Exy (P=0.263), but they weresignificant for the gradients Eyx and E, (both P<0.01).On the other hand the differences between the 21 mm andthe 25 mm were highly significant (P <0.01) for all fourgradients. This was also true for the differences between the21 mm and the 25 mm heart valves (again P <0.01). In summary the results of these parameters were in linewith the velocity measurements. The 21 mm and 23 mm werenot clearly different for all gradients, but the 21 mm and 25mm as well as the 23 mm and 25 mm heart valves clearlydiffered. Again the 25 mm valve was superior to the 21 and23 mm valves. Besides the statistical analyses of the measured parame-ters, the evaluation of the visualized vector fields was impor-tant as it provided further and more detailed information.Figures 2-4 depict the normal strain in x-direction Exxwhich was especially high in the lateral peripheral areas ofthe central jet. The high mechanical load in this area becamemore obvious by evaluating the isolated velocity gradient Eyx- Due to the wider and more homogeneous central jet ofthe 25 mm valve, the velocity gradients and the strain werereduced. For this valve the velocities in general were lowerand additionally the transition between the central jet and theareas with lower velocities was smoother than that for the 21and 23 mm valves (Figures 2-4). The comparison of the velocity gradients of the 21 mmvalve with the velocity gradients of the 23 and 25 mm onesshowed that the areas with high gradients (in this casenegative values) of the 21 mm valve were getting very close tothe aortic wall. This is strong evidence that the central orificejet was not completely centered and it explained the highvelocities ofthe 21 mm valve in the right-sided ROIs 6-7, whilethe values in ROI 3-4 were lower. 4. Discussion The present study intended to continue our research workthat was already dealing with the comparison of the Car-pentier-Edwards PERIMOUNT Magna and the Carpentier-Edwards PERIMOUNT Magna Ease bioprostheses [12, 13]. In this study we decided to use a different strategy for theevaluation of the flow parameters. As only the highest singlevelocity vectors of the whole cardiac cycles were taken intoaccount, this study was designed to evaluate more preciselythe maximal velocities and maximal mechanical loads thatwere acting on local areas in the flow field. However, thisdifferent approach has to be considered when the results arecompared with the velocity values of other investigations.Most of the present studies focused, for example, on thehighest average velocities that occurred during the peak flowphase [15-17], so the values of this study were consequentlyslightly higher. As one might expect the velocity values of ROI 1 showedthat the valves with bigger sizes tended to have a lowervelocity profile than the smaller ones. These findings reflectthe continuity law which says that where Q is the flow rate, A cross-sectional area 1, A2 cross-sectional area 2,v flow velocity 1, and v flow velocity 2. If we assume an almost round shape of the effective orificearea, the cross-sectional area can be estimated by A=nr(r= radius of the effective orifice area). On the basis of this physical principle it can be expectedthat the size (diameter) of the same type of valve has amajor influence on the velocities. Prior investigations alreadyshowed that the effective orifice area of the Magna Easeindeed increased depending on its size [15, 18]. Therefore it is remarkable that the peak velocity valueswere very similar in some regions (e.g.,ROI 4, flow: 80 bpm)irrespective of valve size. In most ROIs and during most flow conditions especially the 21 and 23 mm valves showed onlyminor differences. However, the equation of the fluid dynamical perfor-mance of both valves might be a premature conclusion. Inthe small right-sided ROIs 6 and 7 significant and obviousvelocity differences could be observed. The increased valuesin these areas were important as they were very close to theaortic wall. Higher velocities or vortices in combination withhigher values for strain and increased velocity gradientsrepresent a higher biomechanical load on the aortic tissueand are assumed to have a strong impact on pathologicalprocesses [19]. Therefore, a relation between hemodynamicsand atherosclerotic lesions was observed [20]. Without the extreme precise and detailed PIV measure-ment of this study the small differences between the 21 mmand 23 mm valve would be difficult to detect. On the other hand, even the single peak values of the21 mm valve were still much lower than average flows that areconsidered to be critical in patients suffering from aortic valvestenosis [21]. Even the highest velocities that were measuredover the course of all experiments did not exceed 3 m/sand were measured only in the central jet area. Against thebackground of all the results, the flow profile of the 21 mmand the 23 mm valve can still be considered similar. Nevertheless, the findings showed how precise and valu-able PIV measurements can be for the testing of heart valveprostheses in general. The evaluation of the strain parameters and the velocitygradients indicated that the superiority of the 25 mm valvewas caused by a more constant, wider, and homogenous flowprofile. This was particularly obvious looking at the vectorfields during the peak flow phase (Figures 2-4). As the central jets of the 21 and 23 mm valves seemed to benarrower than the one of the 25 mm valve, it might appear tobe strange that in an aorta with a relatively large diameter thesmall 21 mm valve produced the highest velocity levels closeto the aortic wall (few millimeters above the valve). For the understanding of this phenomenon it has tobe taken into account that each valve, independent of itssize, was placed in the same standardized aortic model andconsequently the relative geometric proportions were dif-ferent. So there was a different lateral distance between thenarrow central orifice jets of the small valves compared to thewider jet of the larger valves. As a consequence the height andthe formation of the first vortices varied. Even though we tried to place the valves exactly in themiddle of the aortic model, it might have been possible thatthe vertical axis of the valves showed an angle of less thar2 degree. It is possible that the high velocities of the 21 mmvalve on the right side of the aortic valve were, to someextent, causedby such a displacement. As the heart is a highlydynamic and flexible organ, it can be assumed that in vivo thevelocities close to the aortic wall are varying more stronglydependently on the placement of the prostheses and theindividual anatomical circumstances in each patient. As we used water instead of a water-saline or glycerinsolution as blood similar test fluid [22] the validity of the absolute values of the collected data might be limited.Although previous studies showed that for the qualitative andrelative comparison the use of water is acceptable [12,13]. 5.Conclusion The present study proved that valves of the same type, butdifferent in size, showed a similar and characteristic fluiddynamical performance in general. However, under specificcircumstances the chosen valve sizes can not only lead tovariations of the flow velocities (in case of a bigger valve)but also create different and individual local flow patterns.In this context the investigation of a variety of appliedcardiac outputs is important for a complete evaluation of thevalves as it creates a broader picture of possible flow fields.Additionally, it has to be taken into account that the flowinteracts also with other anatomical conditions, such as thesize of the aorta. In this study we observed only minor differ-ences between the 21 mm and the 23 mm valves while therewere significantly reduced velocities and mechanical loadsfor the 25 valve. For future investigations in vitro and in vivotests should always try to include valves not only of differenttypes but also of different sizes. Disclosure The authors alone are responsible for the content and writingof the paper. The authors had full access to the data and takefull responsibility for its integrity. All authors have read andagreed to the manuscript as written. Conflicts of Interest The authors report no conflicts of interest. References ( [1] B. Iung, G. Baron, E. G. Butchart e t al., “A prospective survey of p atients with v alvular heart disease in Europe: T he Euro Heart S WSurvey on valvular heart disease,European Heart Jo u rnal, vol. 24, no.13, pp. 1231 - 1243,2003. ) ( [2] A. V ahanian, O . A l fieri, and F . A n dreotti, “G u idelines on the management o f v a lvular heart d isease of the European Society of Cardiology (ESC) and the E u ropean Association for Cardio-Thoracic Surgery (EACTS”)” E uropean Jo urnal ofC a rdio-Thoracic Surgery, vol. 42 , pp . S1-S44, 201 2 . ) ( [3] J. Forcillo and et al. , "Morphological and Cl i nical Findings of Explanted Carpentier-Edwards Perimount Pericardial Valve in the Aort i c Position,J He a rt Val v e Dis, vol. 25, no. 6 , p p. 657- 662,2016. ) ( [4 ] H. Guo, C. Lu, H. Huang et al . ,“Long-Term Clinical Outcomesof the Carpentier-Edwards P e rimount Pericardial Bioprosthesis in Chinese Patients with Single or Multiple Valve Replacement in Aortic, Mitral, or Tricuspid P o sitions,Cardiology, vol. 138 , no. 2,pp. 97-106, 2017. ) ( [5] T.Bourguignon, P.Lhommet, R. El K ho u ry et al.,“Ve r y long- term o utcomes of the Carpentier-Edwards Perimount a ortic valve in patients aged 50-65 years,European Journal of Cardio- T horacic Surgery, vol. 49, no. 5, Article ID ezv384,pp.14 6 2-1468, 2016. ) ( [6] D . R. Johnston, E. G . So l tesz, N. Vakil et a l. , "L o n g -term dura- bility of bioprosthetic a ortic v alves: i mplications f r om 12 , 569 implants, The Annals of Thoracic S u rgery, v o l. 9 9, n o. 4 , pp. 1239-1247, 2 015. ) ( [7] T. Bourguignon, A .-L. B ouquiaux-Stablo, P. C andolfi e t a l.“Very l ong-term outcomes of the c arpentier-edwards perimount valve in a o rtic position,The Annals of Thoracic Sur g ery, v ol. 9 9, n o. 3 , pp. 831 - 837,2 0 15. ) ( [8] PF. Totaro, N . Degno, A. Zaidi, A. Youhana, and V. Argano,“Carpentier-Edwards PERIMOUNT Magna bioprosthesis: Astented valve with stentless performance?” The Journal o fThoracic and C ardiovascular S urgery,vol. 130, no. 6, pp. 1668- 1674,2005. ) ( [9] M. J. Dalmau, J. M . Gonzalez-Santos, J. L o pez-Rodriguez, M. Bueno, and A. Arribas,“The Carpentier-Edwards Perimount M agna aortic xenograft: A new design with an improved hemo- dynamicperformance,Interactive CardioVascular and ThoracicSurgery, vol. 5, no. 3, pp. 263-267,2006. ) ( [10] G. Minardi, G. Pulignano, D. D el Sindaco et al.,“Early Doppler- echocardiography evaluation of Carpentier-Edwards Standardand Carpentier-Edwards Magna aor t ic prosthetic valve: C o m-parison of hemodynamic performance, C a rdiovascular U ltra- sound, vol. 9 , no.1, article no. 37 , 2011. ) ( [ 1 1] H. Mizoguchi, M . Sakaki, K. Inoue et al., “Primary echocardio-graphic results of the Carpentier-Edwards Perimount M a gna, J ournal of Medical Ultrasonics, vol. 39, no. 3, p p. 155-160, 2012. ) ( [12] D. Wendt, S. Sthle, J. A. Piotrowski et al., “Comparison of f l ow dynamics of Perimount Magna and Ma g na Eas e aortic valveprostheses, Biomedizinische Technik. Biomedical Engineering, v ol. 57, no. 2, pp. 97-106, 2012. ) ( [13] D. Wendt, “ T he in v estigation of sy s tolic and di a stolic leaflet kinematics of bioprostheses w i t h a n e w in - vitro test method, M inim In v asive Ther All i ed Technol, vol. 24, n o. 5 , p p . 274-81,2015. ) ( [14 ] D. Wendt, S. S tuhle, G. Hou et al.,“Development and In Vitro Characterization of a New Artificial Flow Channel”A r tificial Organs, vol. 35, no. 3,pp.E59-E64, 2011. ) ( [15] V. Raghav, I. Okafor, M. Q uach, L. D a ng, S. Marquez, and A.P. Yoganathan,“Long-Term Durability of Carpentier-EdwardsMagna E a se V a lve: A O n e Bi l lion Cycle in V i tro Study, T h eAnnals of Thoracic Surgery, vol. 1 01, no. 5, pp.1759-1767,2016. ) ( [16] D. S. Bach, H . J. Patel, T . J. Kolias, and M. De e b,“Randomized comparison of exercise h aemodynamics of Fr e estyle , Magna E ase and Trifecta bioprostheses after aortic valve replacement f or severe aortic stenosis, European Journal of Cardio-Thoracic S urgery, vol. 50, no. 2, Article ID ezv493, pp. 361-367, 2 016. ) ( [17] W. L . L im, Y . T . Chew, T. C . Chew, and H. T. Lo w ,“Pul s atileflow studies of a porcine bioprosthetic aortic valve in vitro: PIV measurements and shear-induced blood d amage, Journal o f Biomechanics, vol. 34, no. 11, pp. 1417-1427, 200 1 . ) ( [18] M.Ugur, R . M . Suri, R. C . D a ly et a l ., “Comparison of e a rlyhemodynamic perfor m ance of3 aortic valve bioprostheses, Th e J ournal of Thoracic and C ardiovascular Surgery, vol. 1 48, no.5, pp. 1940-1946,2014. ) ( [19] M. B ack, T. C . Gasser, J.-B. Michel, and G. C aligiuri, “Biomechanical f actors in the biology of a ortic wall and a ortic v alvediseases, C ardiovascular R e search, v o l. 99, no. 2 , p p. 232-241,2013. ) ( [20] J . Wasilewski, J . Glowacki, a nd L . P o lonski, “Not at r a ndom location o f a therosclerotic l esions in t horacic aorta and their prognostic significance in relation to the risk of cardiovascular ) events, Polish Journal of Radiology, vol.78, no.2, pp. 38-42,2013. [21] R. A. Nishimura, C. M. Otto, and R. O. Bonow,“2014 AHA/ACC guideline for the management of patients with valvularheart disease: a report of the American College of Cardiology/American Heart Association Task Force on Practice Guide-lines, Circulation, vol. 129, no. 23, pp. e521-e643, 2014. [22] R. F. Carey and B. A. Herman, “The effects of a glycerin-based blood analog on the testing of bioprosthetic heart valves,Journal of Biomechanics, vol. 22, no. 11-12, pp. 1185-1192, 1989. MEDIATORSINFLAMMATION The ScientificWorld Journal GastroenterologyResearch and Practice Diabetes Research Disease Markers 200 Hindawi Submit your manuscripts at www.hindawi.com PPAR Research Journal of Ophthalmology Parkinson's Disease Computational andMathematical Methodsin MedicineMilre201 AIDS Oxidative Medicine and Research and Treatment Cellular Longevity The aim of the present in vitro study was the evaluation of the fluid dynamical performance of the Carpentier-Edwards PERIMOUNT Magna Ease depending on the prosthetic size (21, 23, and 25 mm) and the cardiac output (3.6–6.4 L/min). A selfconstructed flow channel in combination with particle image velocimetry (PIV) enabled precise results with high reproducibility, focus on maximal and local peek velocities, strain, and velocity gradients. These flow parameters allow insights into the generation of forces that act on blood cells and the aorticwall.Theresults showed that the 21 and 23mmvalves have a quite similar performance. Maximal velocities were 3.03±0.1 and 2.87±0.13 m/s; maximal strain 𝐸𝑥𝑥, 913.81±173.25 and 896.15±88.16 1/s; maximal velocity gradient 𝐸𝑦𝑥, 1203.14 ± 221.84 1/s and 1200.81 ± 61.83 1/s. The 25mm size revealed significantly lower values: maximal velocity, 2.47 ± 0.15 m/s; maximal strain 𝐸𝑥𝑥, 592.98 ± 155.80 1/s; maximal velocity gradient 𝐸𝑦𝑥, 823.71 ± 38.64 1/s. In summary, the 25mm Magna Ease was able to create a wider, more homogenous flow with lower peak velocities especially for higher flow rates. Despitethe wider flow, the velocity values close to the aortic walls did not exceed the level of the smaller valves.
确定


还剩8页未读,是否继续阅读?

产品配置单


北京欧兰科技发展有限公司为您提供《生物瓣膜假体中流体动力学性能检测方案(粒子图像测速)》,该方案主要用于其他中流体动力学性能检测,参考标准--,《生物瓣膜假体中流体动力学性能检测方案(粒子图像测速)》用到的仪器有德国LaVision PIV/PLIF粒子成像测速场仪、LaVision HighSpeedStar 高帧频相机、LaVision DaVis 智能成像软件平台
推荐专场


相关方案
更多
该厂商其他方案
更多