


An imaging fibre bundle is demonstrated for spatially-multiplexed probe beam delivery in OCT, with the aim of
eliminating the mechanical scanning currently required at the probe tip in endoscopic systems. Each fibre in the bundle
addresses a Fizeau interferometer formed between the bundle end and the sample, allowing acquisition of information
across a plane with a single measurement. Depth scanning components are now contained within a processing
interferometer external to the completely passive endoscope probe.
The technique has been evaluated in our laboratory for non-biological samples. Images acquired using the bundle-based
system are presented. The potential of the system is assessed, with reference to SNR performance and acquisition speed.
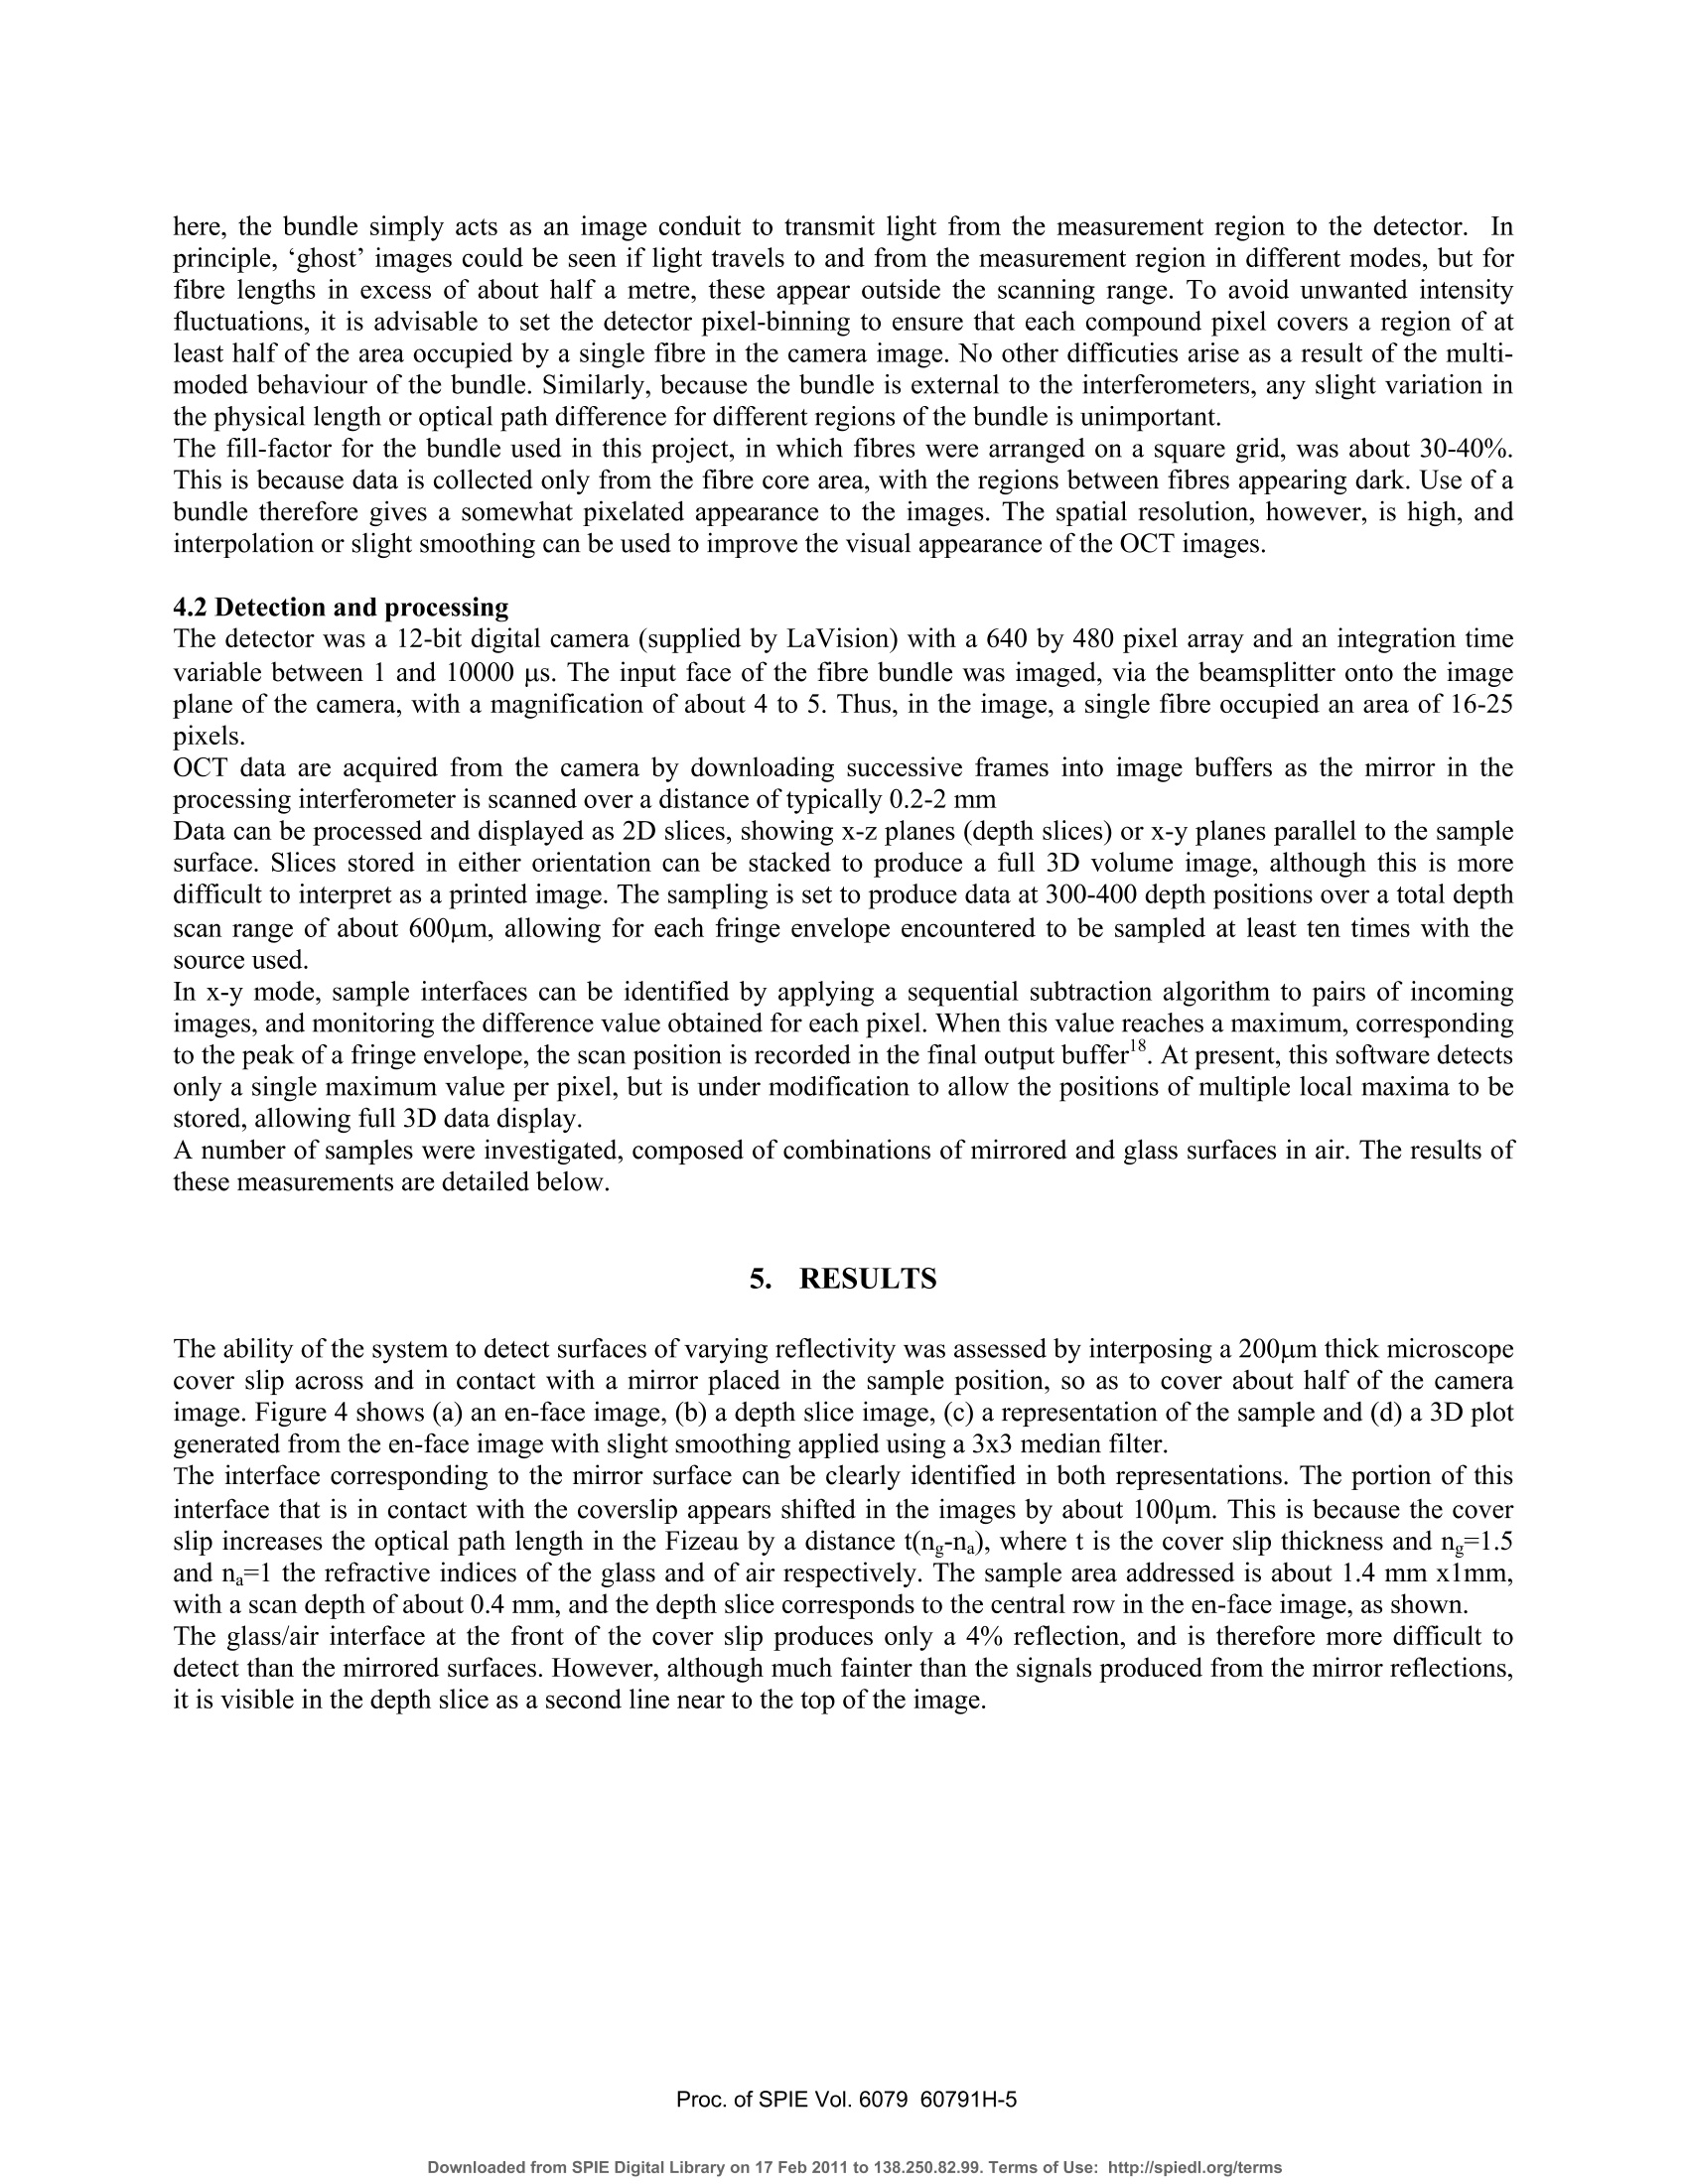
方案详情

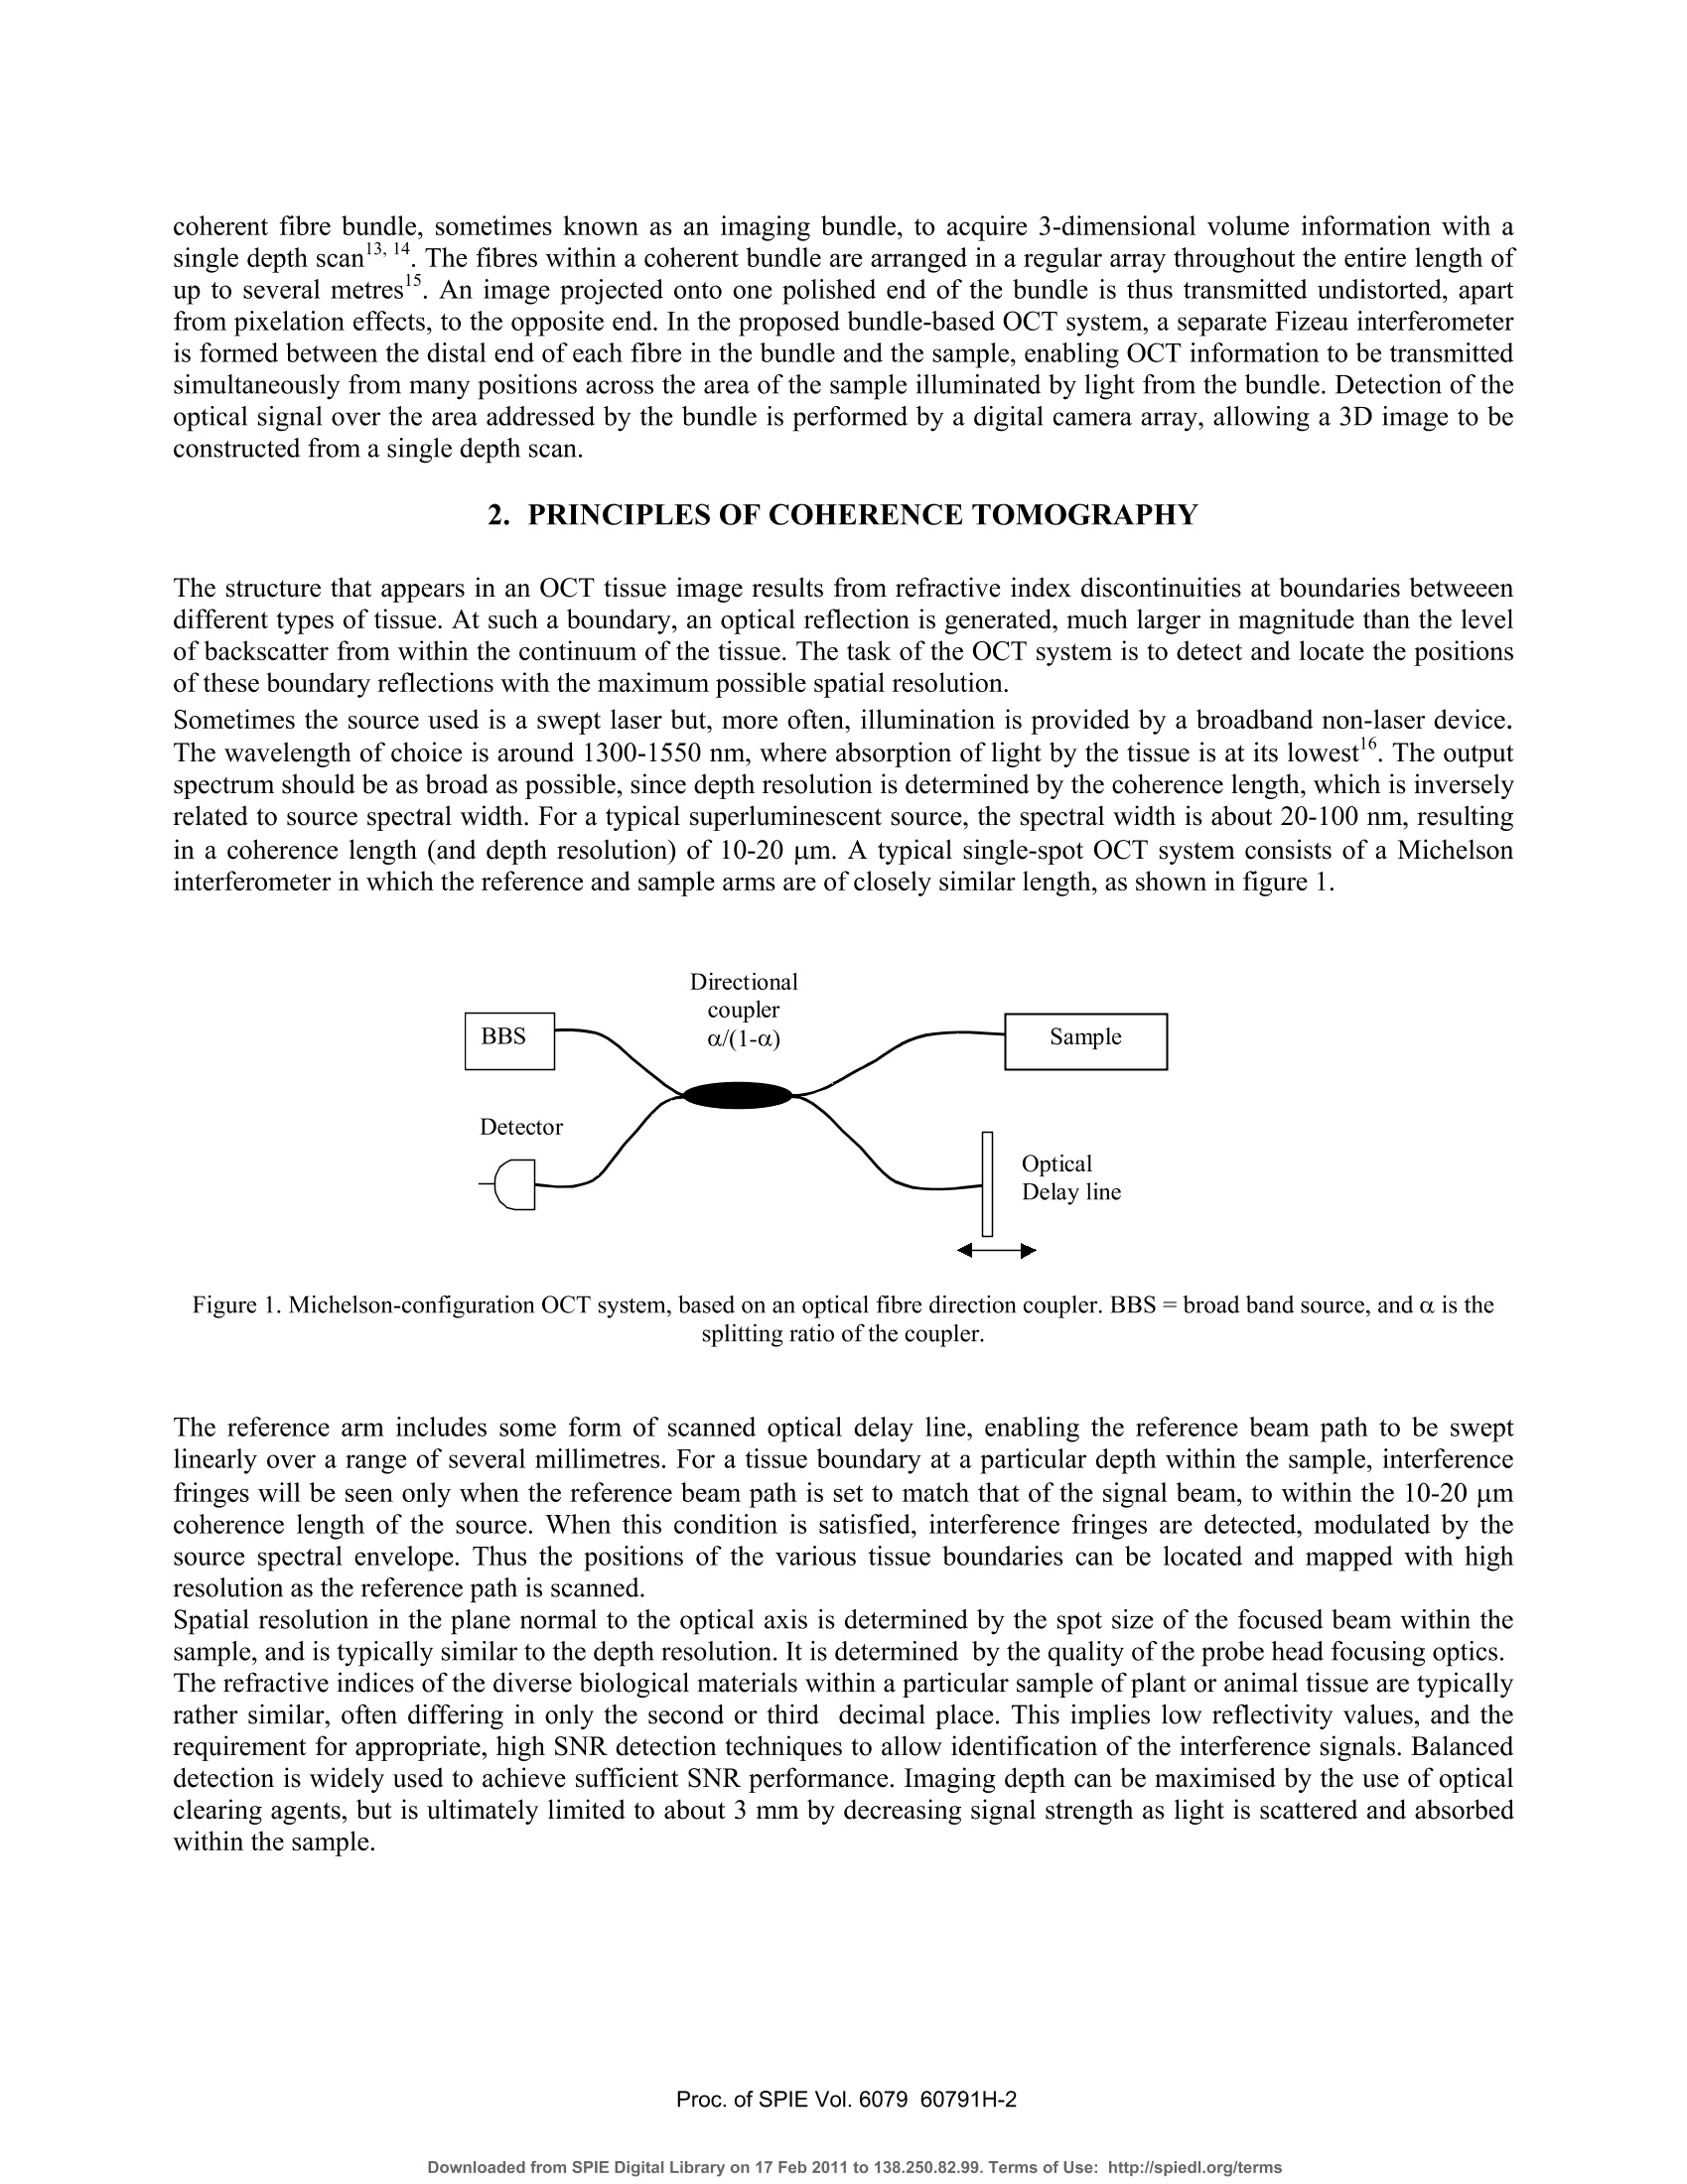
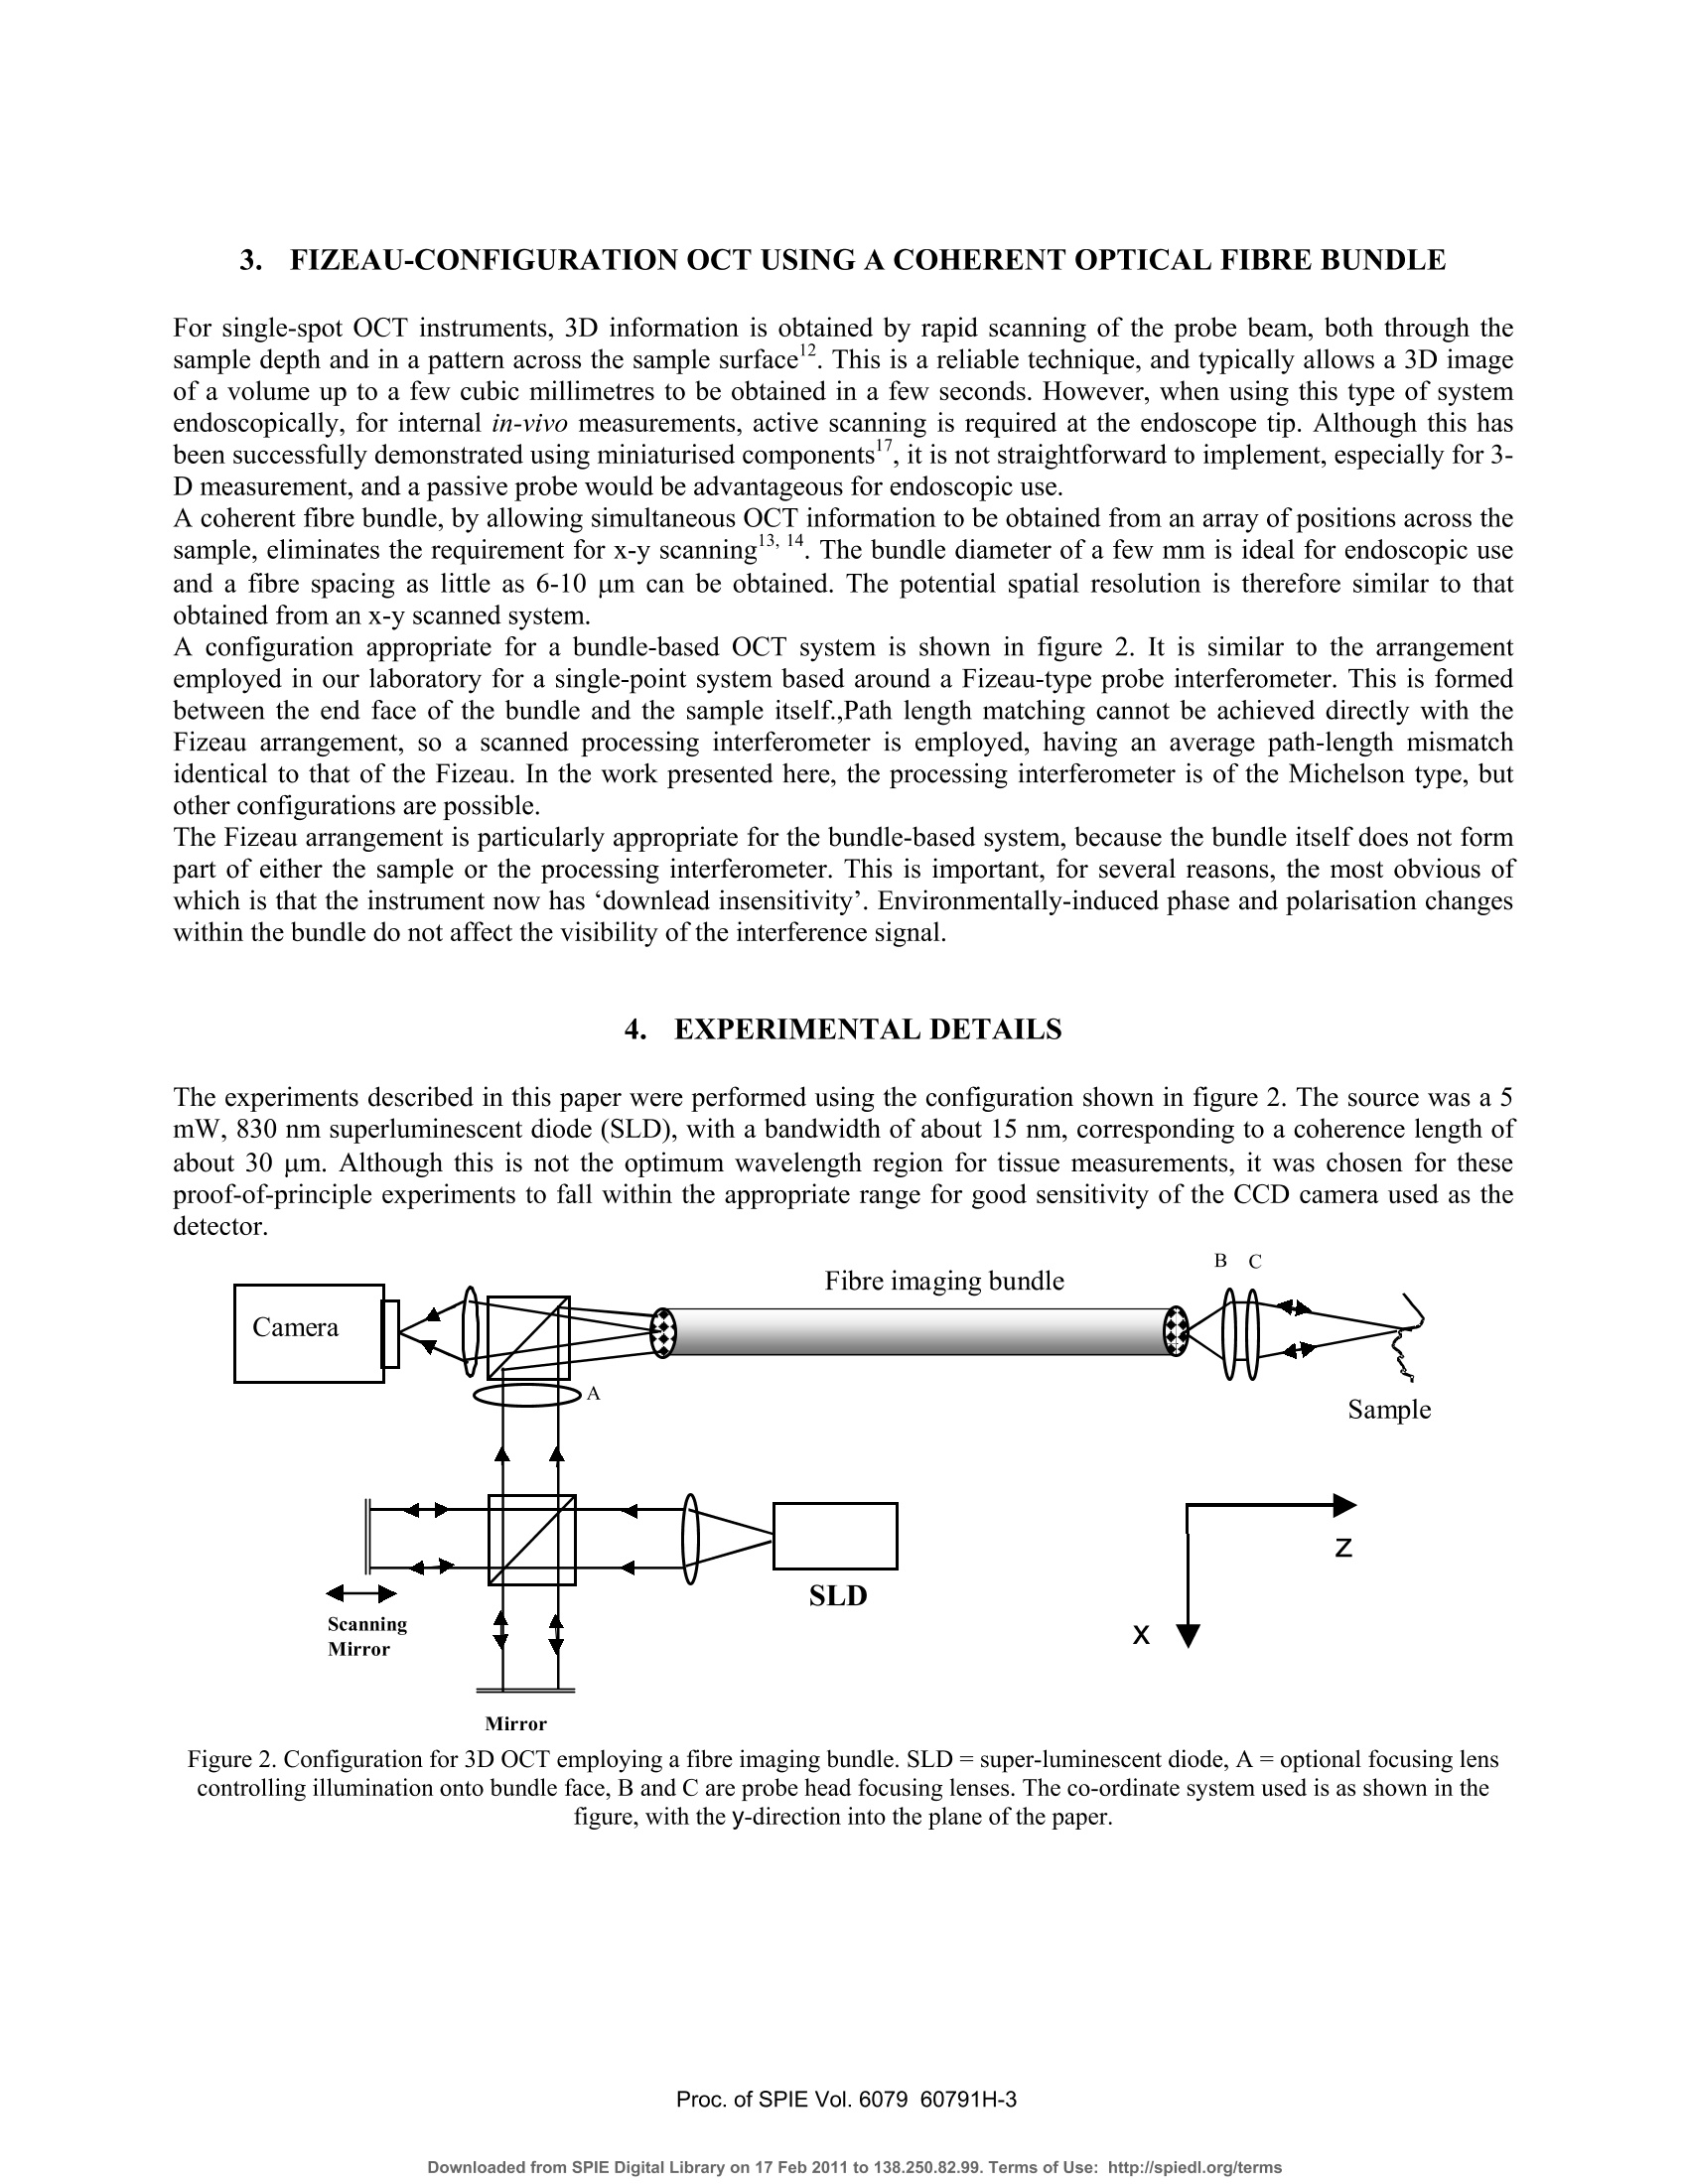
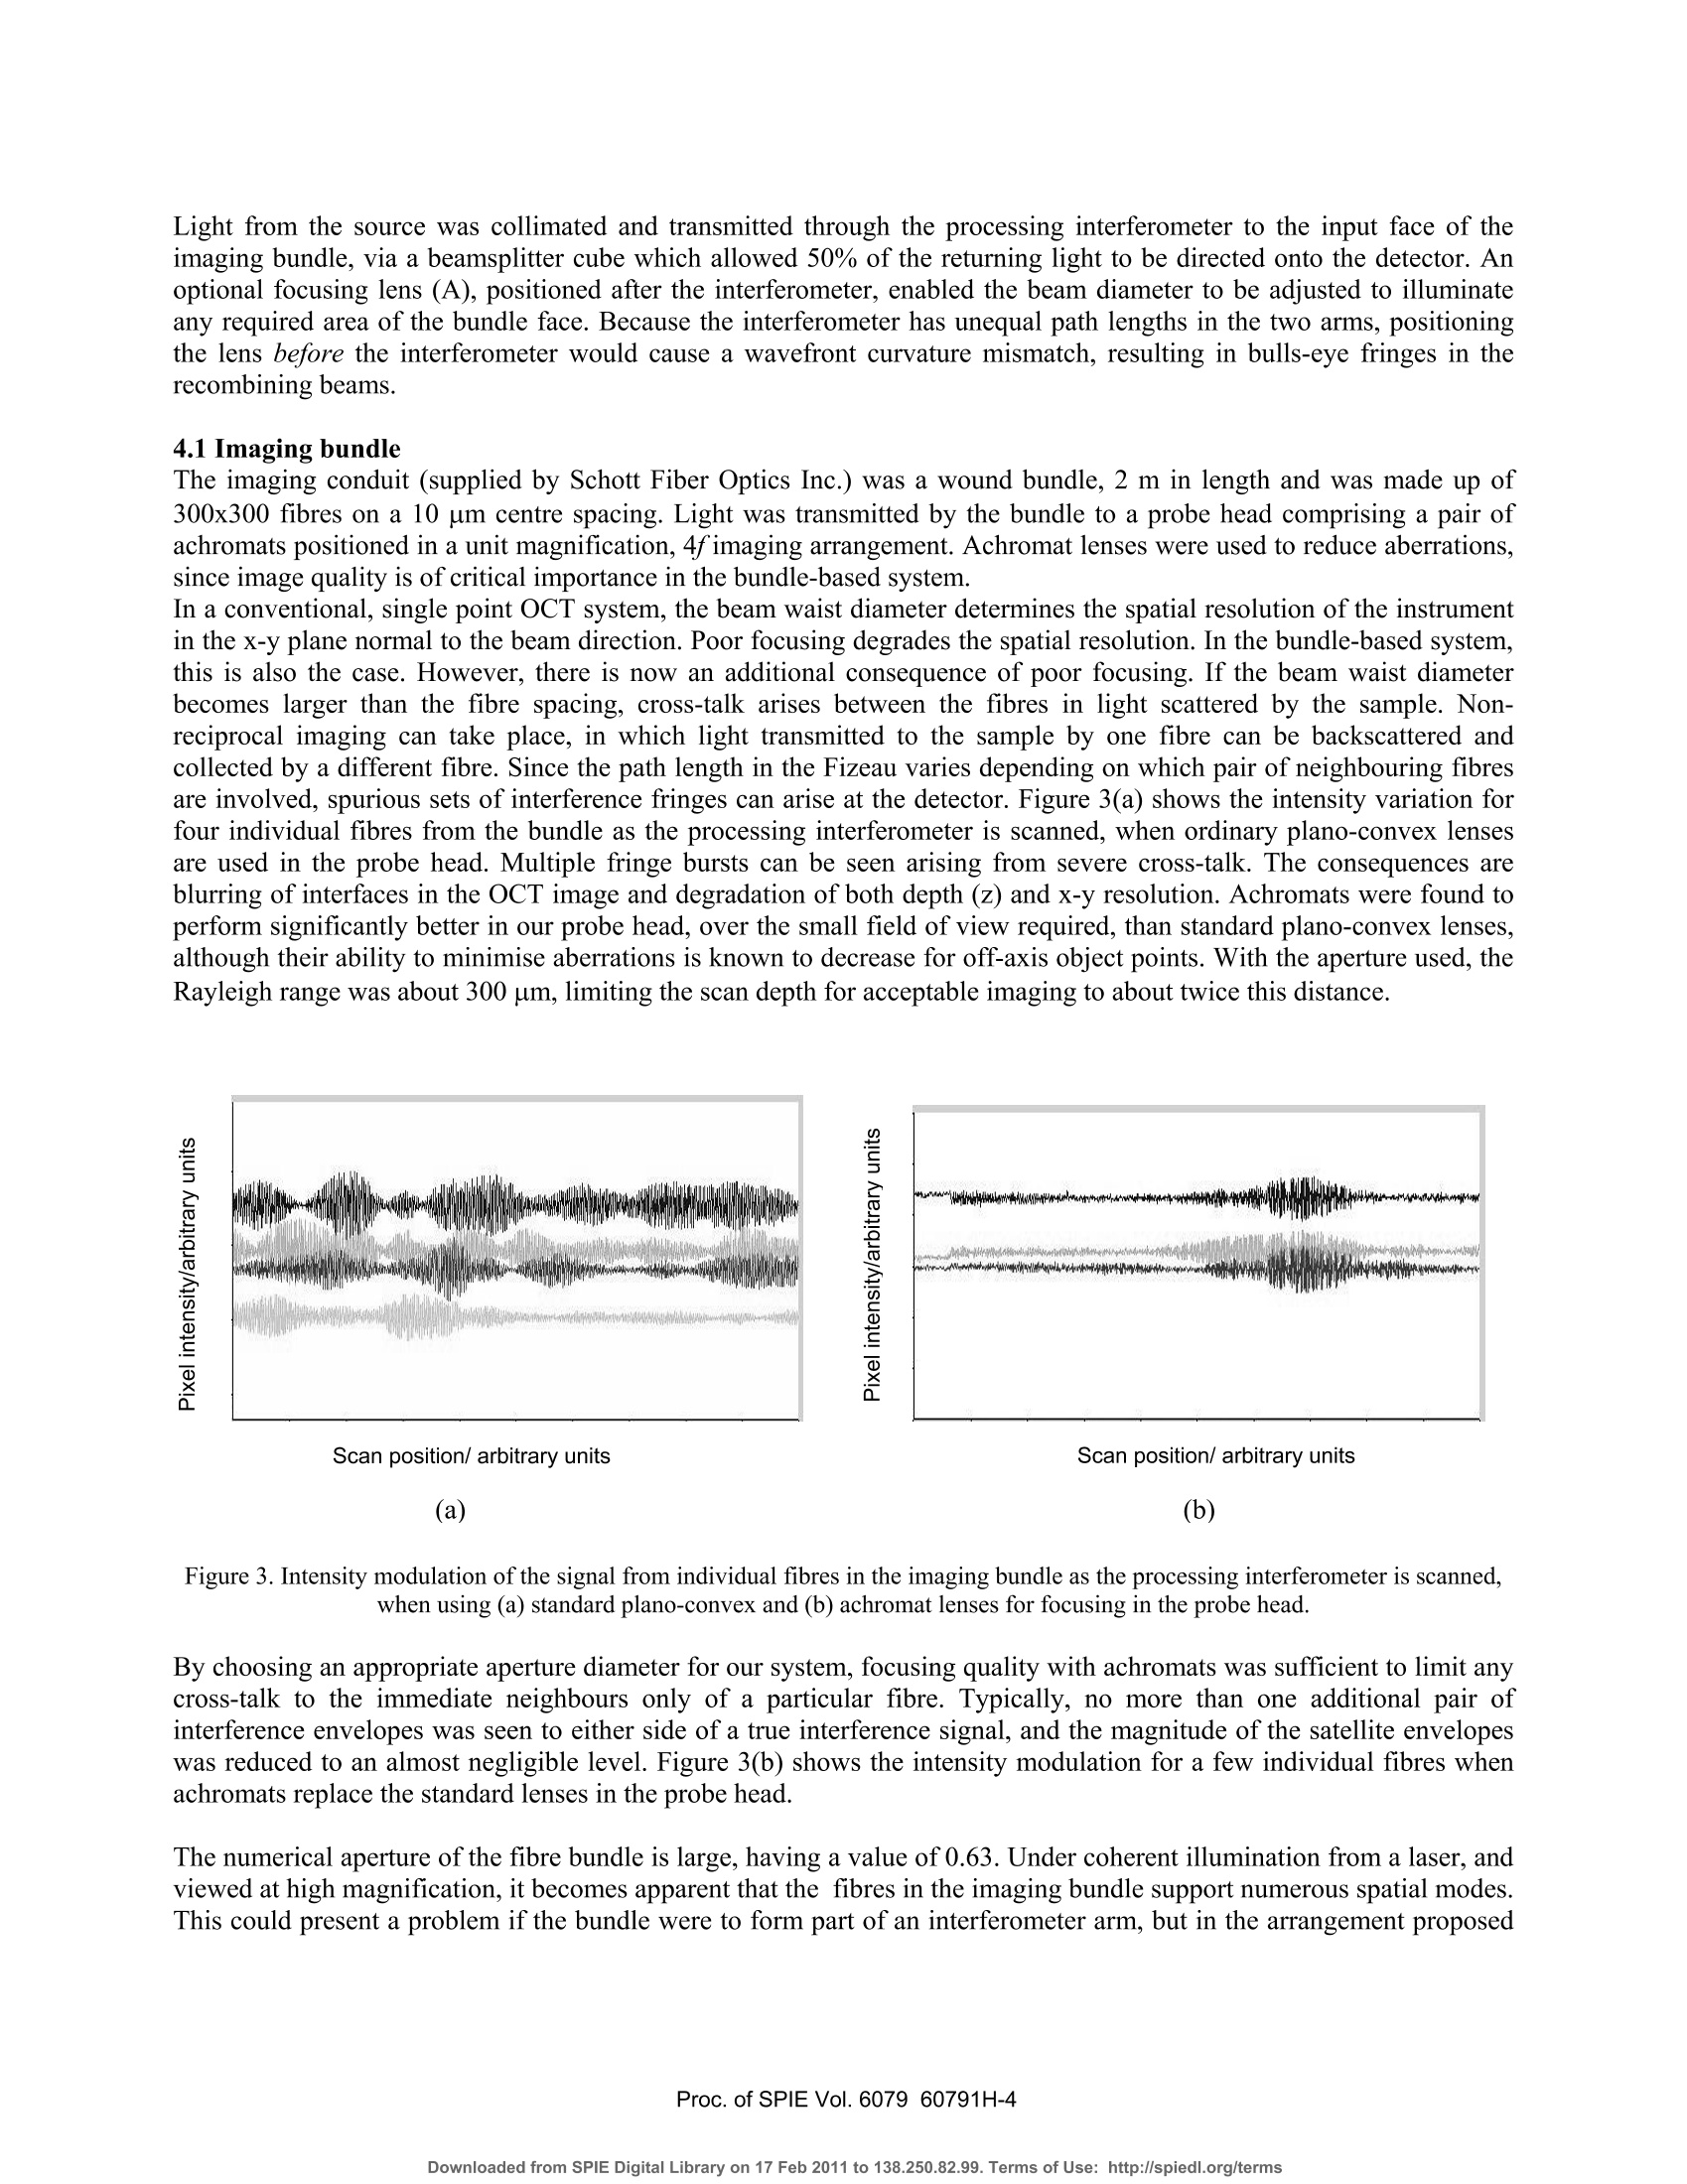
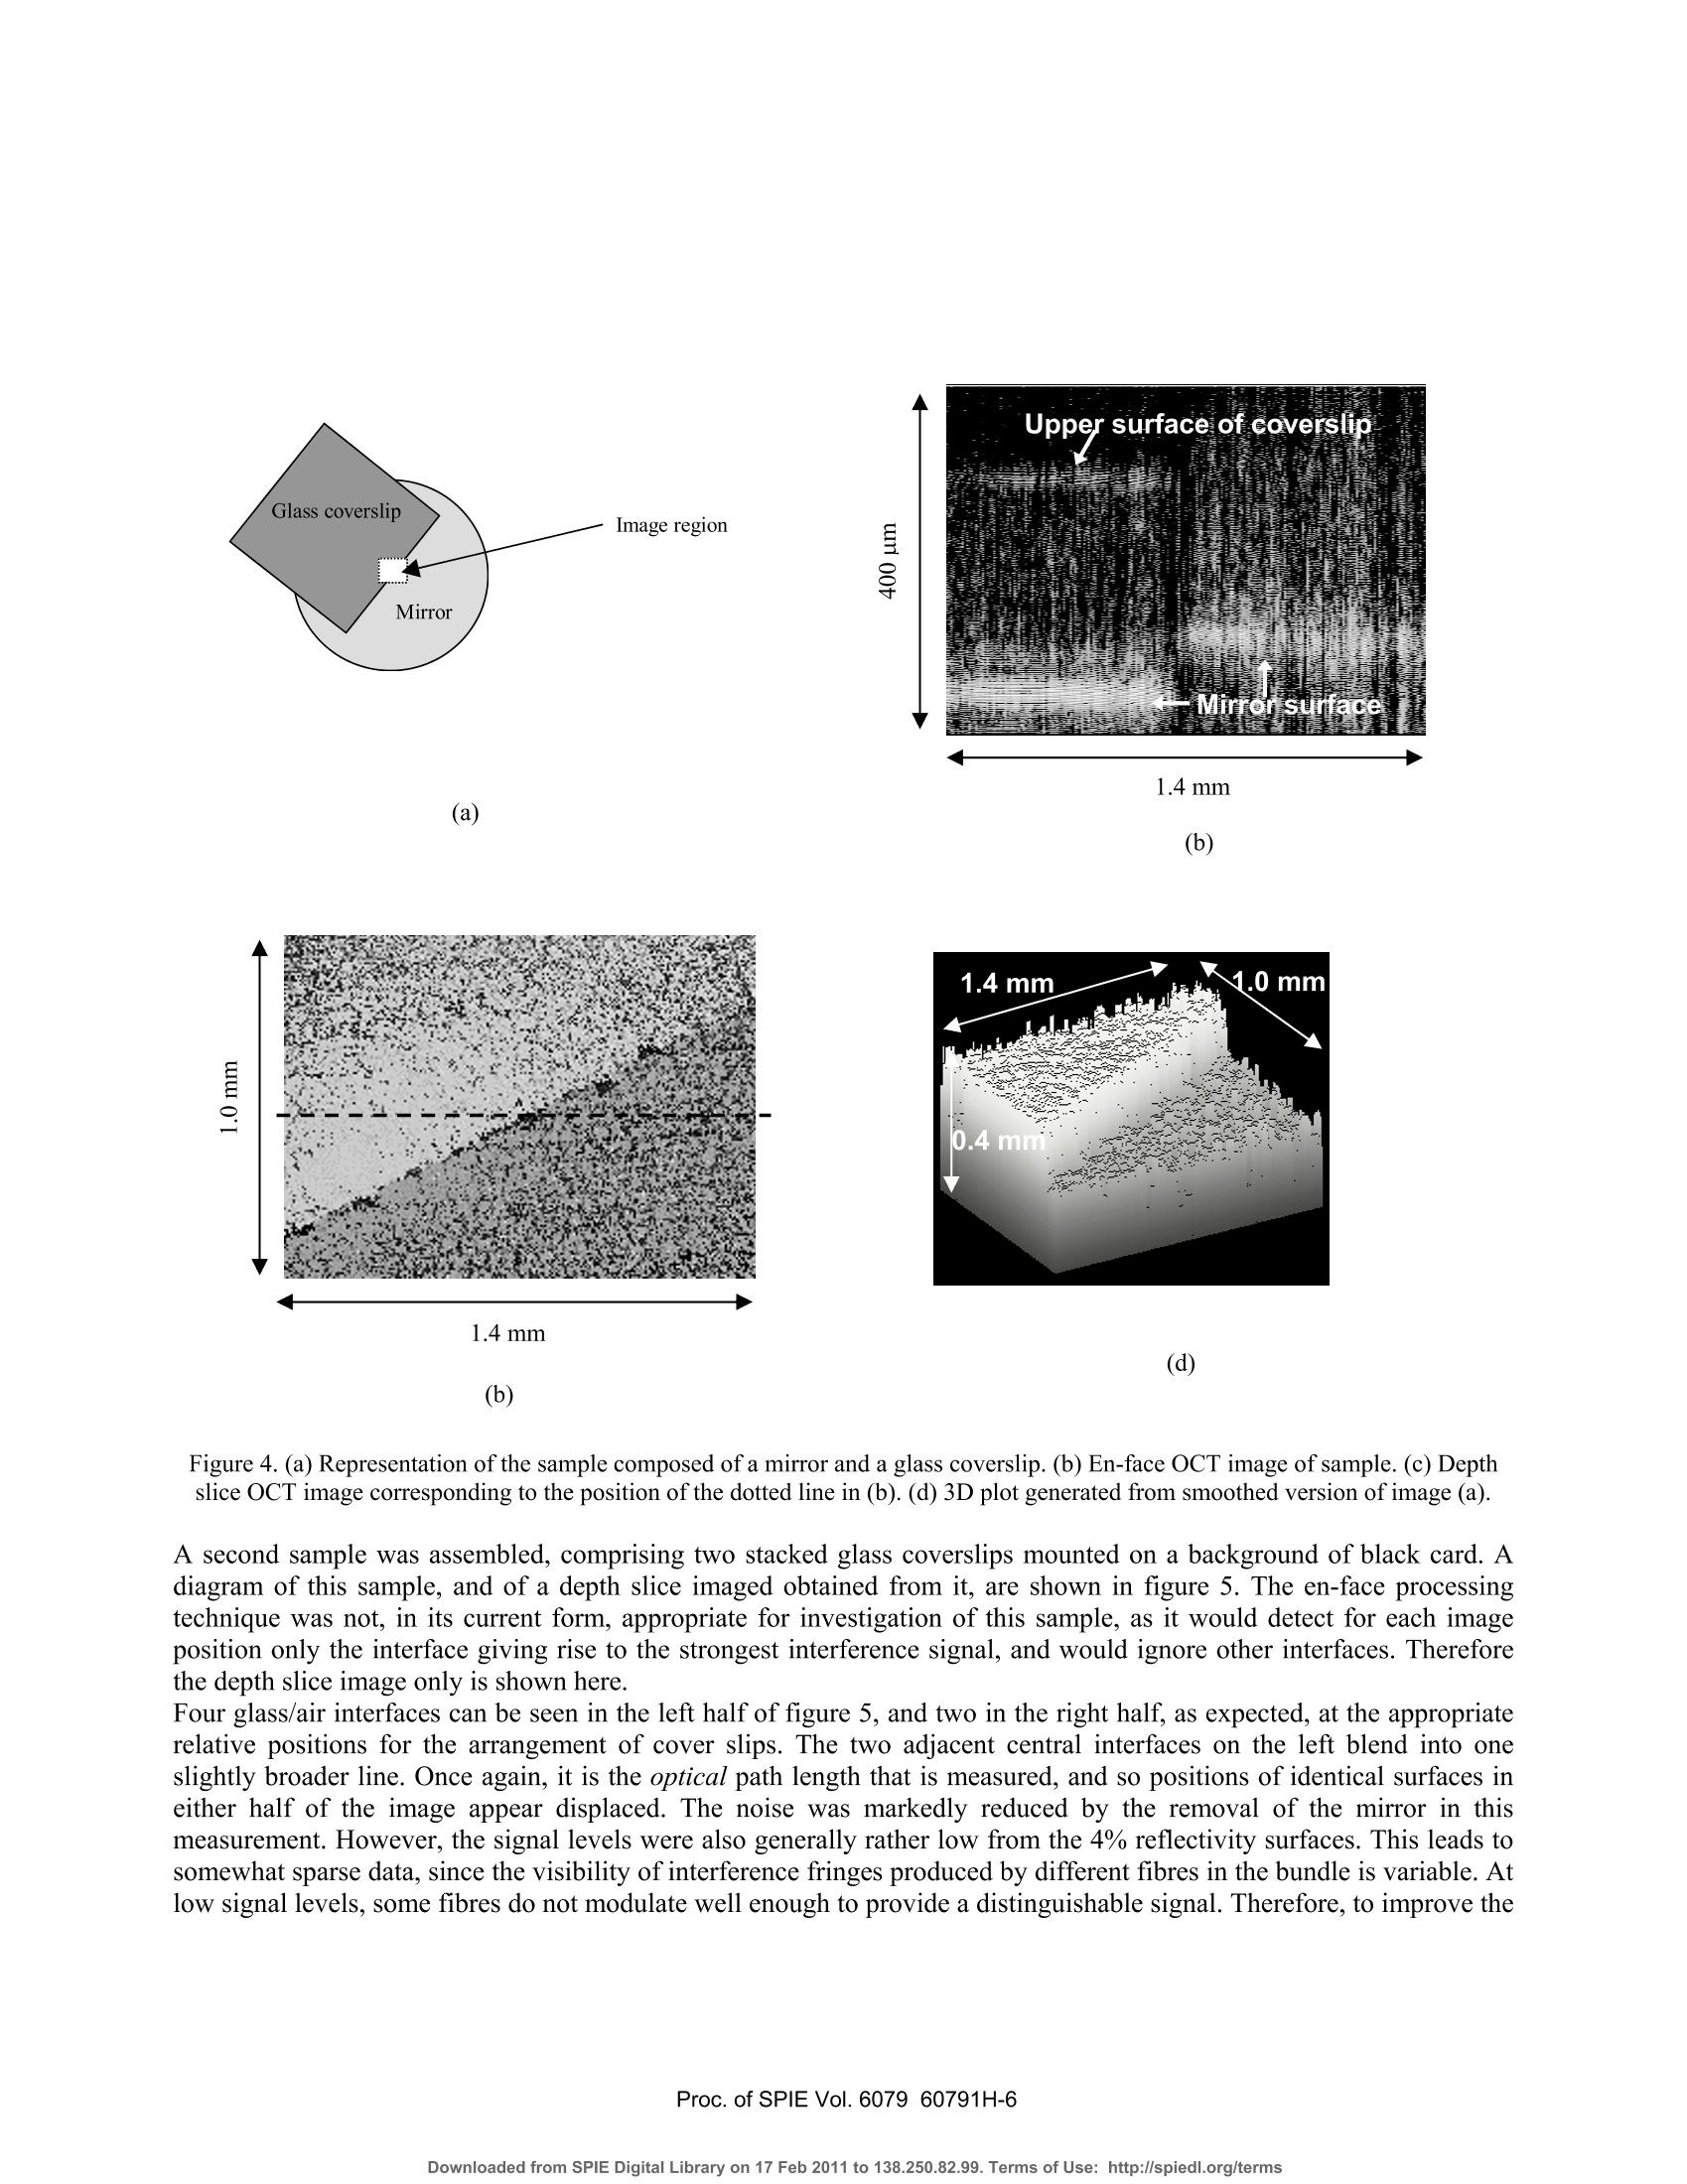
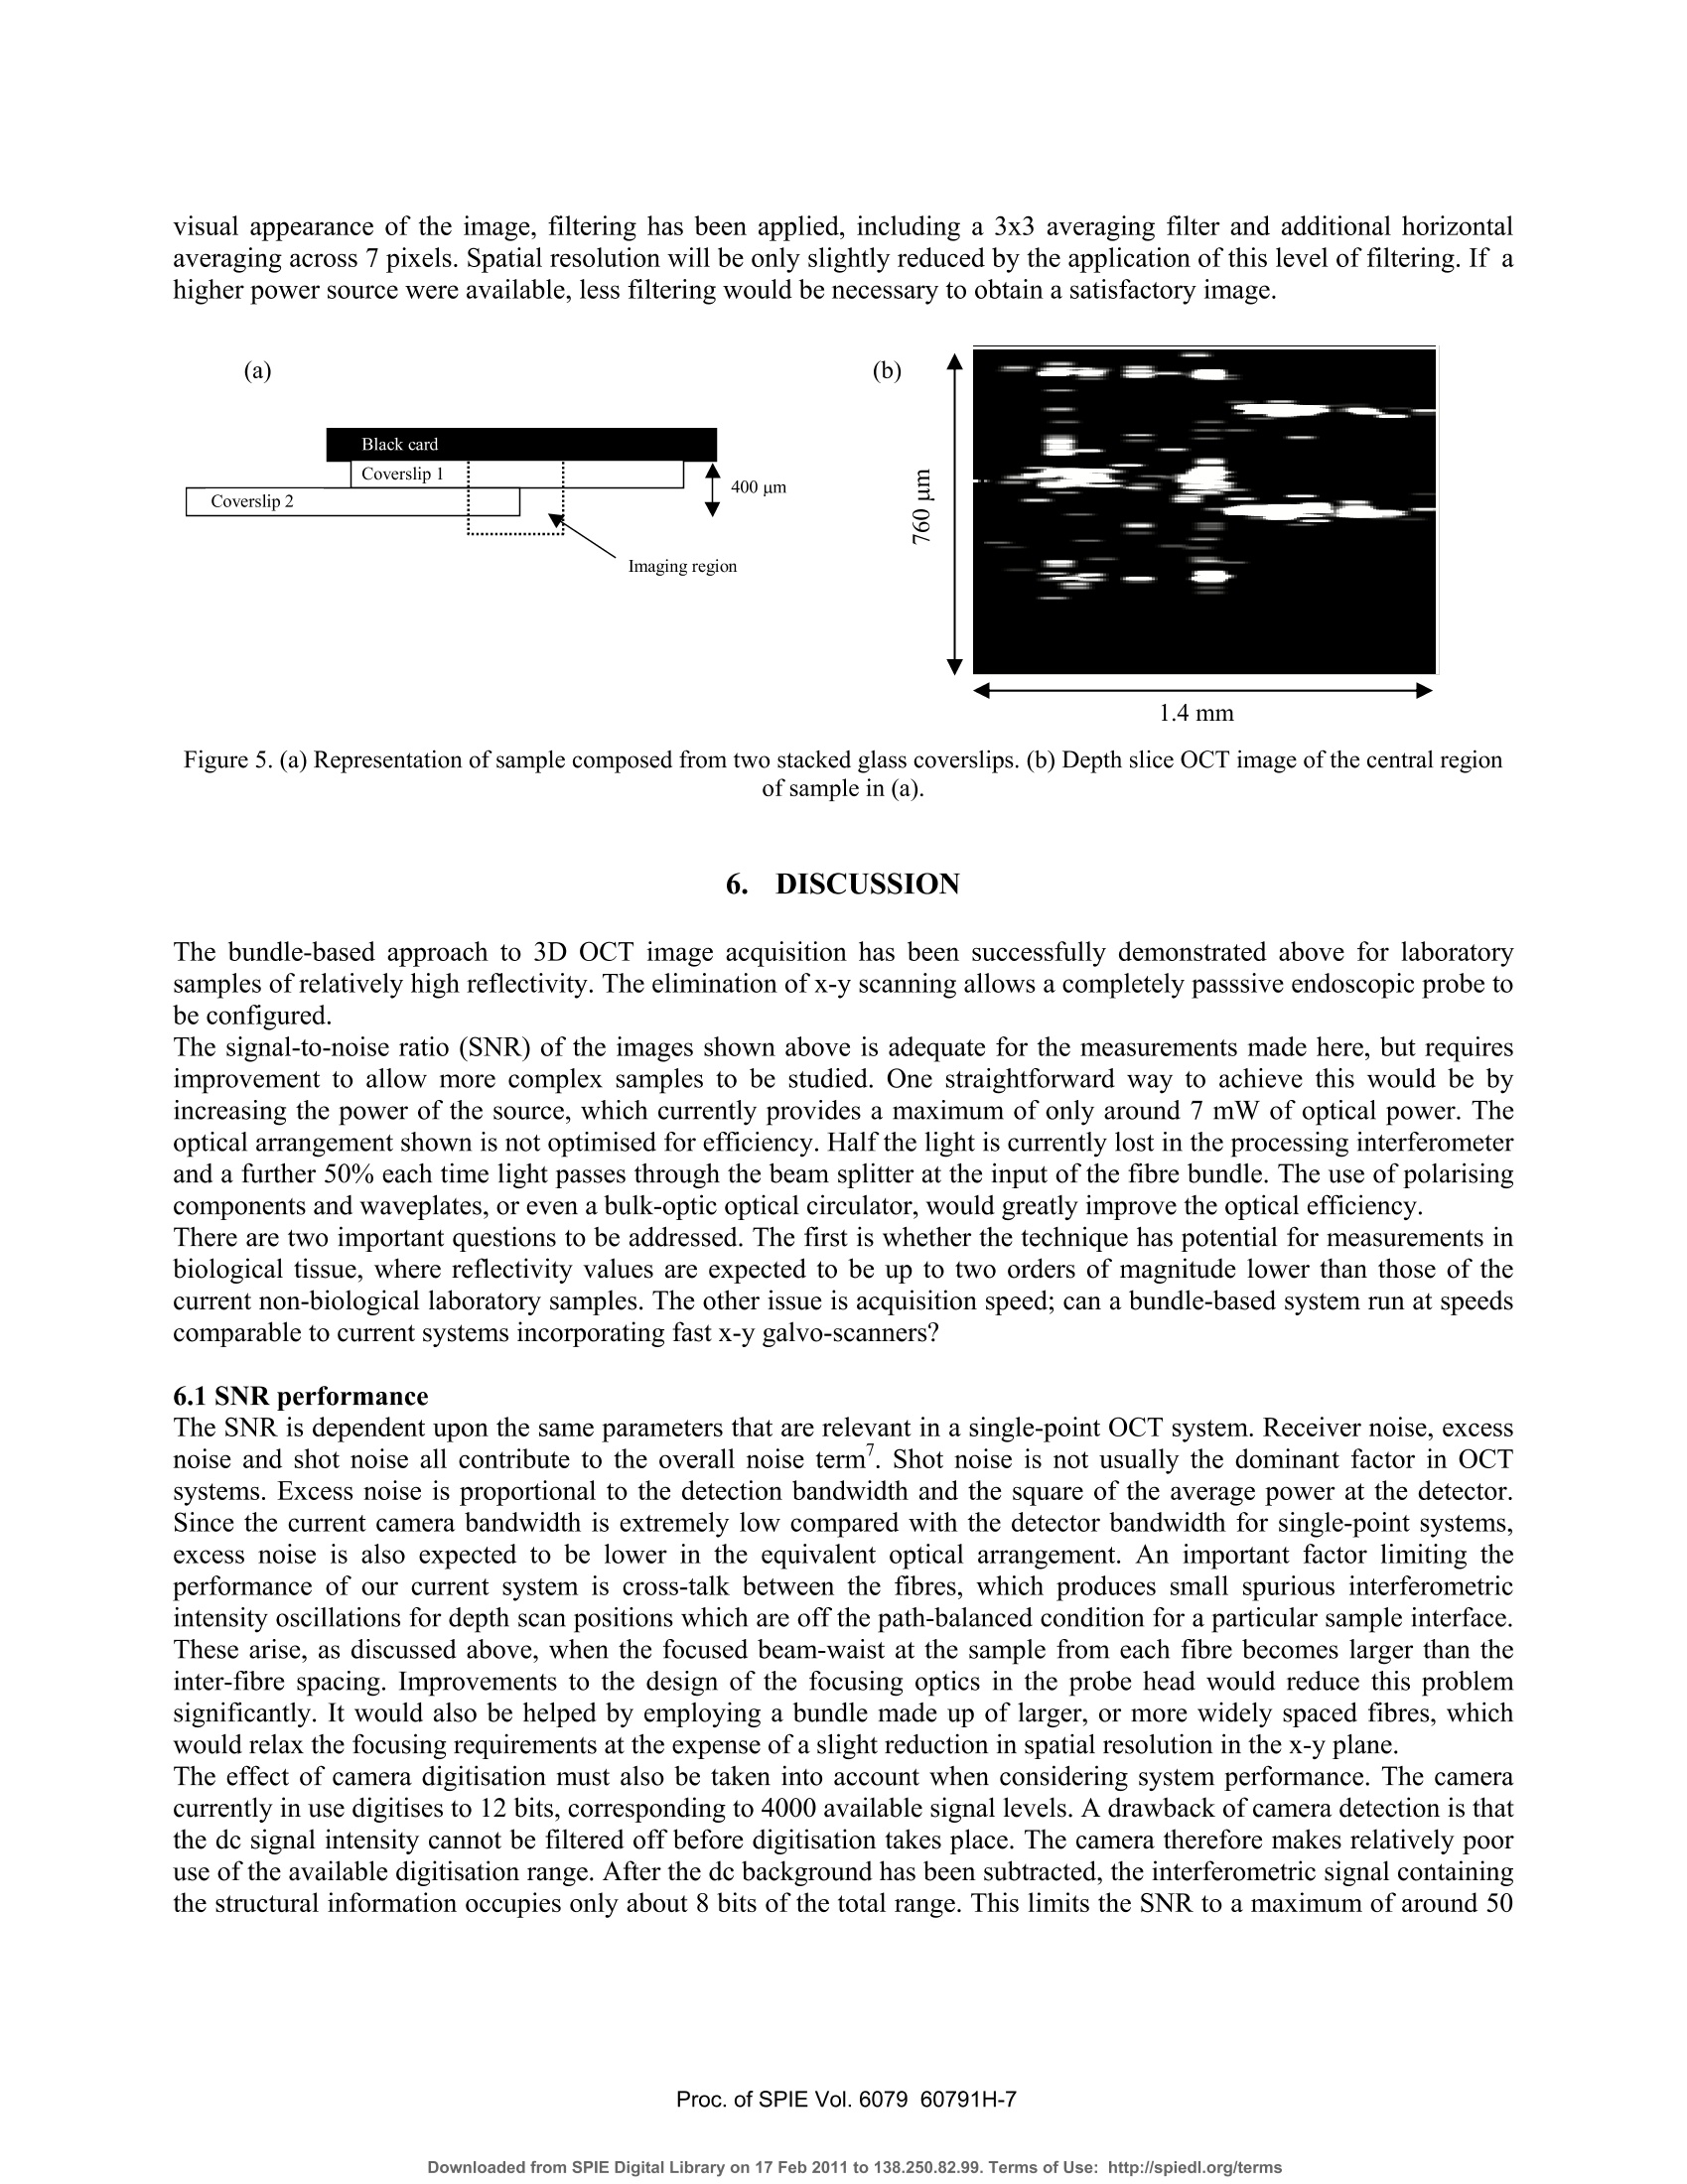
Proceedings of the Society of Photo-optical Instrumentation Engineers (SPIE),Coherence Domain Optical Methods and Optical Coherence Tomography in Biomedicine XBellingham,USA. isbn 0-8194-6121-0 Full-field optical coherence tomography using a fibre imaging bundle H D Ford and R P Tatam Optical Sensors Group, Centre for Photonics andOptical Engineering, School of Engineering, Cranfield University, Cranfield, Bedford, MK43 0AL, UK. ABSTRACT An imaging fibre bundle is demonstrated for spatially-multiplexed probe beam delivery in OCT, with the aim ofeliminating the mechanical scanning currently required at the probe. .t1ip in endoscopic systems. Each fibre in the bundleaddresses a Fizeau interferometer formed between the bundle end and the sample, allowing acquisition of informationacross a plane with a single measurement. Depth scanning components are now contained within a processinginterferometer external to the completely passive endoscope probe. The technique has been evaluated in our laboratory for non-biological samples. Images acquired using the bundle-basedsystem are presented. The potential of the system is assessed, with reference to SNR performance and acquisition speed. Keywords: OCT, coherence tomography, imaging bundles, coherent fibre bundles, Fizeau interferometer 1.. INTRODUCTION Optical coherence tomography (OCT) is a medical imaging technique employing low-coherence interferometry to imagethe morphology of biological tissue or non-biological semi-transparent composite materials. Appropriate illuminationwavelengths, in the visible and near infra red regions of the spectrum, are strongly scattered by tissue, limiting themaximum imaging depth to about 3 mm. However, the spatial resolution, in the range of about 1 to 30 um, is superior tothat achieved by other tomographic methods such as ultrasound, enabling cell-level detail to be observed in the highestresolution systems. Additionally, the use of near infra-red radiation, which is considered clinically safe at moderatepowers, is preferable to the ionising radiation required by techniques such as X-ray and PET. OCT is therefore of interestboth for in-vitro applications and for in-vivo measurements of epithelial and endothelial tissues’. In applications such asdetection of heat damage or pre-cancerous conditions, OCT has the potential to replace, or at least to reduce the necessityfor, invasive screening by excision of tissue samples. Laboratory testing can be conveniently performed using bulk-optic OCT instrumentation, but the acquisition of in-vivoimages, typically from within the gastro-intestinal tract, requires the use of a flexible, endoscopic probe. This is realisedby incorporating optical fibre components. In early systems, the typical configuration comprised a Michelsoninterferometer formed from a directional coupler. However, more recent implementations generally employ balanceddetection to increase the signal-to-noise ratio (SNR), and sometimes replace the coupler by an optical circulator,resulting in greater optical efficiency and a further increase in SNR . The majority of bulk and fibre-based OCT systems currently under investigation are based around a Michelsoninterferometer configuration. This allows an instrument to be constructed using relatively few components and providesgood signal-to-noise performance. However, optical fibre versions of the Michelson configuration are susceptible tosignal fading caused by bending-induced differences between the states of polarisation (SOP) of light in the referenceand signal arms. This is evidently more likely to be a problem during in-vivo measurements. Phase drifting of thefringes, caused by temperature fluctuations, is also likely under these conditions. Previous work in our dlaboratoemonstrry hasated that, for fibre-based OCT systems, the Michelson interferometer configuration may not always be theoptimum choice. A Fizeau interferometer configuration, incorporating an optical circulator and balanced detection, canoffer a SNR approaching that of the Michelson version, with the additional advantage of downlead insensitivity.Discussion of our current Fizeau OCT system has been previously reported. The usual procedure in OCT is to scan the position of the focused probe beam rapidly across the sample surface to buildup a 3D map of tissue structure. In this paper, we discuss the adaptation of the Fizeau configuration for use with a coherent fibre bundle, sometimes known as an imaging bundle, to acquire 3-dimensional volume information with asingle depth scan 3,14. The fibres within a coherent bundle are arranged in a regular array throughout the entire length ofup to several metres. An image projected onto one polished end of the bundle is thus transmitted undistorted, apartfrom pixelation effects, to the opposite end. In the proposed bundle-based OCT system, a separate Fizeau interferometeris formed between the distal end of each fibre in the bundle and the sample, enabling OCT information to be transmittedsimultaneously from many positions across the area of the sample illuminated by light from the bundle. Detection of theoptical signal over the area addressed by the bundle is performed by a digital camera array, allowing a 3D image to beconstructed from a single depth scan. 2. PRINCIPLES OF COHERENCE TOMOGRAPHY The structure that appears in an OCT tissue image results from refractive index discontinuities at boundaries betweeendifferent types of tissue. At such a boundary, an optical reflection is generated, much larger in magnitude than the levelof backscatter from within the continuum of the tissue. The task of the OCT system is to detect and locate the positionsof these boundary reflections with the maximum possible spatial resolution. Sometimes the source used is a swept laser but, more often, illumination is provided by a broadband non-laser device.The wavelength of choice is around 1300-1550 nm, where absorption of light by the tissue is at its lowest. The outputspectrum should be as broad as possible, since depth resolution is determined by the coherence length, which is inverselyrelated to source spectral width. For a typical superluminescent source, the spectral width is about 20-100 nm, resultingin a coherence length (and depth resolution) of 10-20 um. A typical single-spot OCT system consists of a Michelsoninterferometer in which the reference and sample arms are of closely similar length, as shown in figure 1. Figure 1.Michelson-configuration OCT system, based on an optical fibre direction coupler. BBS = broad band source, and a is thesplitting ratio of the coupler. The reference arm includes some form of scanned optical delay line, enabling the reference beam path to be swelptinearly over a range of several millimetres. For a tissue boundary at a particular depth within the sample, interferencefringes will be seen only when the reference beam path is set to match that of the signal beam, to within the 10-20 umcoherence length of the source. When this condition is satisfied, interference fringes are detected, modulated by thesource spectral envelope. Thus the positions of the various tissue boundaries can be located and mapped with highresolution as the reference path is scanned. Spatial resolution in the plane normal to the optical axis is determined by the spot size of the focused beam within thesample, and is typically similar to the depth resolution. It is determined by the quality of the probe head focusing optics.The refractive indices of the diverse biological materials within a particular sample of plant or animal tissue are typicallyrather similar, often differing in only the second or third decimal place. This implies low reflectivity values, and therequirement for appropriate, high SNR detection techniques to allow identification of the interference signals. Balanceddetection is widely used to achieve sufficient SNR performance. Imaging depth can be maximised by the use of opticalclearing agents, but is ultimately limited to about 3 mm by decreasing signal strength as light is scattered and absorbedwithin the sample. 3. FIZEAU-CONFIGURATION OCT USING A COHERENTOPTICAL FIBRE BUNDLE For single-spot OCT instruments, 3D information is obtained by rapid scanning of the probe beam, both through thesample depth and in a pattern across the sample surface. This is a reliable technique, and typically allows a 3D imageof a volume up to a few cubic millimetres to be obtained in a few seconds. However, when using this type of systemendoscopically, for internal in-vivo measurements, active scanning is required at the endoscope tip. Although this hasbeen successfully demonstrated using miniaturised components, it is not straightforward to implement, especially for 3-D measurement, and a passive probe would be advantageous for endoscopic use. A coherent fibre bundle, by allowing simultaneous OCT information to be obtained from an array of positions across thesample, eliminates the requirement for x-y scanning13,14. The bundle diameter of a few mm is ideal for endoscopic useand a fibre spacing as little as 6-10 um can be obtained. The potential spatial resolution is therefore similar to thatobtained from an x-y scanned system. A configuration appropriate for a bundle-based OCT system is shown in figure 2. It is similar to the arrangementemployed in our laboratory for a single-point system based around a Fizeau-type probe interferometer. This is formedbetween the end face of the bundle and the sample itself.,Path length matching cannot be achieved directly with theFizeau arrangement, so a scanned processing interferometer is employed, having an average path-length mismatchidentical to that of the Fizeau. In the work presented here, the processing interferometer is of the Michelson type, butother configurations are possible. The Fizeau arrangement is particularly appropriate for the bundle-based system, because the bundle itself does not formpart of either the sample or the processing interferometer. This is important, for several reasons, the most obvious ofwhich is that the instrument now has ‘downlead insensitivity'. Environmentally-induced phase and polarisation changeswithin the bundle do not affect the visibility of the interference signal. 4. EXPERIMENTAL DETAILS The experiments described in this paper were performed using the configuration shown in figure 2. The source was a 5mW, 830 nm superluminescent diode (SLD), with a bandwidth of about 15 nm, corresponding to a coherence length ofabout 30 um. Although this is not the optimum wavelength region for tissue measurements, it was chosen for theseproof-of-principle experiments to fall within the appropriate range for good sensitivity of the CCD camera used as the:detector. Mirror Figure 2. Configuration for 3D OCT employing a fibre imaging bundle. SLD=super-luminescent diode, A = optional focusing lenscontrolling illumination onto bundle face, B and C are probe head focusing lenses. The co-ordinate system used is as shown in thefigure, with the y-direction into the plane of the paper. Light from the source was collimated and transmitted through the processing interferometer to the input face of theimaging bundle, via a beamsplitter cube which allowed 50% of the returning light to be directed onto the detector. Anoptional focusing lens (A), positioned after the interferometer, enabled the beam diameter to be adjusted to illuminateany required area of the bundle face. Because the interferometer has unequal path lengths in the two arms, positioningthe lens before the interferometer would cause a wavefront curvature mismatch, resulting in bulls-eye fringes in therecombining beams. 4.1 Imaging bundle The imaging conduit (supplied by Schott Fiber Optics Inc.) was a wound bundle,2 m in length and was made up of300x300 fibres on a 10 um centre spacing. Light was transmitted by the bundle to a probe head comprising a pair ofachromats positioned in a unit magnification, 4fimaging arrangement. Achromat lenses were used to reduce aberrations,since image quality is of critical importance in the bundle-based system. In a conventional, single point OCT system, the beam waist diameter determines the spatial resolution of the instrumentin the x-y plane normal to the beam direction. Poor focusing degrades the spatial resolution. In the bundle-based system,this is also the case. However, there is now an additional consequence of poor focusing. If the beam waist diameterbecomes larger than the fibre spacing, cross-talk arises between the fibres in light scattered by the sample. Non-reciprocal imaging can take place, in which light transmitted to the sample by one fibre can be backcscattereollectd anded by a different fibre. Since the path length in the Fizeau varies depending on which pair of neighbouring fibresare involved, spurious sets of interference fringes can arise at the detector. Figure 3(a) shows the intensity variation forfour individual fibres from the bundle as the processing interferometer is scanned, when ordinary plano-convex lensesare used in the probe head. Multiple fringe bursts can be seen arising from severe cross-talk. The consequences areblurring of interfaces in the OCT image and degradation of both depth (z) and x-y resolution. Achromats were found toperform significantly better in our probe head, over the small field of view required, than standard plano-convex lenses,although their ability to minimise aberrations is known to decrease for off-axis object points. With the aperture used, theRayleigh range was about 300 um, limiting the scan depth for acceptable imaging to about twice this distance. Figure 3. Intensity modulation of the signal from individual fibres in the imaging bundle as the processing interferometer is scanned,when using (a) standard plano-convex and (b) achromat lenses for focusing in the probe head. By choosing an appropriate aperture diameter for our system, focusing quality with achromats was sufficient to limit anycross-talk to the immediate neighbours only of a particular fibre. Typically, no more than one additional pair ofinterference envelopes was seen to either side ofa true interference signal, and the magnitude of the satellite envelopeswas reduced to an almost negligible level. Figure 3(b) shows the intensity modulation for a few individual fibres whenachromats replace the standard lenses in the probe head. The numerical aperture of the fibre bundle is large, having a value of 0.63. Under coherent illumination from a laser, andviewed at high magnification, it becomes apparent that the fibres in the imaging bundle support numerous spatial modes.This could present a problem if the bundle were to form part of an interferometer arm, but in the arrangement proposed here, the bundle simply acts as an image conduit to transmit light from the measurement region to the detector. Inprinciple, ‘ghost’images could be seen if light travels to and from the measurement region in different modes, but forfibre lengths in excess of about half a metre, these appear outside the scanning range. To avoid unwanted intensityfluctuations, it is advisable to set the detector pixel-binning to ensure that each compound pixel covers a region of atleast half ofthe area occupied by a single fibre in the camera image. No other difficuties arise as a result of the multi-moded behaviour of the bundle. Similarly, because the bundle is external to the interferometers, any slight variation inthe physical length or optical path difference for different regions of the bundle is unimportant. The fill-factor for the bundle used in this project, in which fibres were arranged on a square grid, was about 30-40%.This is because data is collected only from the fibre core area, with the regions between fibres appearing dark. Use of abundle therefore gives a somewhat pixelated appearance to the images. The spatial resolution, however, is high, andinterpolation or slight smoothing can be used to improve the visual appearance of the OCT images. 4.2 Detection and processing The detector was a 12-bit digital camera (supplied by LaVision) with a 640 by 480 pixel array and an integration timevariable between 1 and 10000 us. The input face of the fibre bundle was imaged, via the beamsplitter onto the imageplane of the camera, with a magnification of about 4 to 5. Thus, in the image, a single fibre occupied an area of 16-25pixels. OCT data are acquired from the camera by downloading successive frames into image buffers as the mirror in theprocessing interferometer is scanned over a distance of typically 0.2-2 mm Data can be processed and displayed as 2D slices, showing x-z planes (depth slices) or x-y planes parallel to the samplesurface. Slices stored in either orientation can be stacked to produce a full 3D volume image, although this is moredifficult to interpret as a printed image. The sampling is set to produce data at 300-400 depth positions over a total depthscan range of about 600um, allowing for each fringe envelope encountered to be sampled at least ten times with thesource used. In x-y mode, sample interfaces can be identified by applying a sequential subtraction algorithm to pairs of incomingimages, and monitoring the difference value obtained for each pixel. When this value reaches a maximum, correspondingto the peak of a fringe envelope, the scan position is recorded in the final output buffer . At present, this software detectsonly a single maximum value per pixel, but is under modification to allow the positions of multiple local maxima to bestored, allowing full 3D data display. A number of samples were investigated, composed of combinations of mirrored and glass surfaces in air. The results ofthese measurements are detailed below. 5.)。RESULTS The ability of the system to detect surfaces of varying reflectivity was assessed by interposing a 200um thick microscopecover slip across and in contact with a mirror placed in the sample position, so as to cover about half of the cameraimage. Figure 4 shows (a) an en-face image, (b) a depth slice image, (C) a representation of the sample and (d) a3D plotgenerated from the en-face image with slight smoothing applied using a 3x3 median filter. The interface corresponding to the mirror surface can be clearly identified in both representations. The portion of thisinterface that is in contact with the coverslip appears shifted in the images by about 100um. This is because the coverslip increases the optical path length in the Fizeau by a distance t(ng-na), where t is the cover slip thickness and ng=1.5and na=1 the refractive indices of the glass and of air respectively. The sample area addressed is about 1.4 mm x1mm, with a scan depth of about 0.4 mm, and the depth slice corresponds to the central row in the en-face image, as shown.The glass/air interface at the front of the cover slip produces only a 4% reflection, and is therefore more difficult todetect than the mirrored surfaces. However, although much fainter than the signals produced from the mirror reflections,it is visible in the depth slice as a second line near to the top of the image. (b) Figure 4. (a) Representation of the sample composed of a mirror and a glass coverslip. (b) En-face OCT image of sample. (c) Depthslice OCT image corresponding to the position of the dotted line in (b). (d) 3D plot generated from smoothed version of image (a). A second sample was assembled, comprising two stacked glass coverslips mounted on a background ofd black ciagramard. A of this sample, and of a depth slice imaged obtained from it, are shown in figure 5. The en-face processingtechnique was not, in its current form, appropriate for investigation of this sample, as it would detect for each imageposition only the interface giving rise to the strongest interference signal, and would ignore other interfaces. Thereforethe depth slice image only is shown here. Four glass/air interfaces can be seen in the left half of figure 5, and two in the right half, as expected, at the appropriaterelative positions for the arrangement of cover slips. The two adjacent central interfaces on the left blend into oneslightly broader line. Once again, it is the optical path length that is measured, and so positions of identical surfaces ineither half of the image appear displaced. The noise was markedly reduced by the removal of the mirror in thismeasurement. However, the signal levels were also generally rather low from the 4% reflectivity surfaces. This leads tosomewhat sparse data, since the visibility of interference fringes produced by different fibres in the bundle is variable. Atlow signal levels, some fibres do not modulate well enough to provide a distinguishable signal. Therefore, to improve the visual appearance of the image, filtering has been applied, including a 3x3 averaging filter and additional horizontalaveraging across 7 pixels. Spatial resolution will be only slightly reduced by the application of this level of filtering. If ahigher power source were available, less filtering would be necessary to obtain a satisfactory image. Figure 5. (a) Representation of sample composed from two stacked glass coverslips. (b) Depth slice OCT image of the central regionof sample in (a). 6. DISCUSSION The bundle-based approach to 3D OCT image acquisition has been successfully demonstrated above for laboratorysamples of relatively high reflectivity. The elimination of x-y scanning allows a completely passsive endoscopic probe tobe configured. The signal-to-noise ratio (SNR) of the images shown above is adequate for the measurements made here, but requiresimprovement to allow more complex samples to be studied. One straightforward way to achieve this would be byincreasing the power of the source, which currently provides a maximum of only around 7 mW of optical power. Theoptical arrangement shown is not optimised for efficiency. Half the light is currently lost in the processing interferometerand a further 50% each time light passes through the beam splitter at the input of the fibre bundle. The use of polarisingcomponents and waveplates, or even a bulk-optic optical circulator, would greatly improve the optical efficiency. There are two important questions to be addressed. The first is whether the technique has potential for measurements inbiological tissue, where reflectivity values are expected to be up to two orders of magnitude lower than those of thecurrent non-biological laboratory samples. The other issue is acquisition speed; can a bundle-based system run at speedscomparable to current systems incorporating fast x-y galvo-scanners? 6.1 SNR performance The SNR is dependent upon the same parameters that are relevant in a single-point OCT system. Receiver noise, excessnoise and shot noise all contribute to the overall noise term’. Shot noise is not usually the dominant factor in OCTsystems. Excess noise is proportional to the detection bandwidth and the square of the average power at the detector.Since the current camera bandwidth is extremely low compared with the detector bandwidth for single-point systems,excess noise is also expected to be lower in the equivalent optical arrangement. An important factor limiting theperformance of our current system is cross-talk between the fibres, which produces small spurious interferometricintensity oscillations for depth scan positions which are off the path-balanced condition for a particular sample interface.These arise, as discussed above, when the focused beam-waist at the sample from each fibre becomes larger than theinter-fibre spacing. Improvements to the design of the focusing optics in the probe head would reduce this problemsignificantly. It would also be helped by employing a bundle made up of larger, or more widely spaced fibres, whichwould relax the focusing requirements at the expense of a slight reduction in spatial resolution in the x-y plane.The effect of camera digitisation must also be taken into account when considering system performance. The cameracurrently in use digitises to 12 bits, corresponding to 4000 available signal levels. A drawback of camera detection is thatthe dc signal intensity cannot be filtered off before digitisation takes place. The camera therefore makes relatively poor use of the available digitisation range. After the dc background has been subtracted, the interferometric signal containing the structural information occupies only about 8 bits of the total range. This limits the SNR to a maximum of around 50 dB, which is barely sufficient for OCT measurements in tissue. It would therefore appear at first sight that the potentialof system for biological measurements is very limited. However, there are ways in which the SNR performance can besignificantly improved. One possibility is simply to choose the best available camera, to maximise the full-well capacity and minimise the noise.Accumulating large numbers of images, although it slows down the acquisition process, leads to a big improvement inthe SNR. Averaging 100 images for each scan position will improve the SNR by about 20 dB. Figure 6 shows a depth slice OCT image of the surface of a ceramic tile with an opaque glaze. The tile surface could notbe clearly identified in an image generated from individual camera acquisitions, but is plainly visible in the figure below,which is generated from averages of 60 acquisitions at each depth position sampled. Figure 6. Depth slice OCT image of a ceramic tile with an opaque surface glaze, showing an area of approximately 1mm x0.5 mm. SNR can also be increased by the use of more sophisticated detection techniques, involving phase-synchronised acquisition of different regions of the modulation periodto isolate the coherent signal.Alternatively, the 3D OCT technique can be adapted to exploit the high-bandwidth, wide dynamic range capabilities ofstandard photodetectors, and to obtain the large increase in SNR offered by balanced detection, while also retaining theadvantages offered by the bundle. This could be achieved by re-introducing x-y galvo-scanners, but now positioning thescanners at the input to the bundle. Thus the input beam is scanned across the input face of the bundle, and the beamreturning from the sample region is redirected, again via the scanning mirror pair, onto point detectors. In this way, OCTinformation from each fibre in turn is multiplexed onto the detector, but the endoscopic section remains passive. 6.2 Acquisition speed The processing time currently required in our system to generate an image in either the x-y or x-z plane is of the order ofseveral minutes. However, this is limited primarily by a slow processing algorithm. The camera is capable of reading outdata at 30 frames per second; faster if pixel binning is employed to reduce the amount of data per frame. Thus a set ofsay 100 images acquired at a sampling interval of 2 um could be obtained within 3s or less and stored straight to RAM.Some further time would need to be allocated for post-processing, but 3D OCT information would be obtained inseconds rather than minutes. Current fast systems using galvanometer scanners produce an image in around 1-5s, so the potential acquisition speed of the camera system approaches that of mechanically scanned instruments. If the bundle-based configuration were modified to operate with galvo-scanners at the bundle input, the acquisition speedwould be expected to be similar to that of the conventional scanning versions with the scanning mirrors at the probe tip.Although the optical path-length scanning in the current system is achieved using a relatively slow mechanical scanningtechnique, the configuration is also compatible with use of a rapid-scanning Fourier delay line. 7. CONCLUSIONS An imaging fibre bundle has been employed to construct a full-field OCT system with a passive endoscopic probesection. It has been shown that 3D structural information can be obtained from a sample without any requirement forbeam-scanning in the x-y plane normal to the optical axis. The spatial resolution of the bundle-based system compareswell with that of active OCT designs using galvanometer mirrors. For the current system, the spatial resolution in the x-yplane and the depth resolution are both about 30um. Measurements have been successfully made on non-biological surfaces in air, over scan depths of up to about 0.75 mm.The SNR of the system is adequate to detect glass/air interfaces, but is currently insufficient to allow biologcal samplesto be imaged. However, modifications to improve the SNR to the required value have been discussed, including an increase in source power, inclusion of additional optical components to produce a more efficient configuration, and theuse of alternative detection techniques. Further investigation, following implementation of these improvements, willdetermine the ultimate quality of the 3D images acquired when bundle-based OCT is used to examine biological tissue. 8.ACKNOWLEDGEMENTS Helen Ford acknowledges a Daphne Jackson Research Fellowship sponsored by the Royal Academy of Engineering. 9..REFERENCES 1..(Colston, B.W., Everett, M.J., DaSilva, L.B., Otis, L.L., Stroeve, P. and Nathel, H.,“Imaging of hard- and soft-tissuestructure in the oral cavity by optical coherence tomography”,Applied Optics,37(16),3582-3585,1998. 2. Drexler, W., Morgner, U., Kartner, F.X., Pitris, C., Boppart, S.A., Li, X.D.,Ippen, E.P. and Fujimoto, J.G., “Opticalcoherence tomography for neurosurgical imaging of human intracortical melanoma”,Optics Letters, 24(17),1221-1223,1999. 3. Lazar, R., Brunner, H. and Steiner, R.,“Optical coherence tomography (OCT) of human skin with a slow-scan CCDcamera”, Proc. SPIE 2925, 143-151,1996. 4. Bamford, K.J., James, S.W., Barr, H. and Tatam, R.P.,“Optical low coherence tomography of bronchial tissue”Proc. SPIE 3858, 172-179,1999. 5. Bamford, K., James,J., Barr, H. and Tatam, R.P., “Radar detection of precancerous bronchial tissue”, Lasers inMedical Science, 15, 188-194,2000. 6. Izatt, J.A., Kulkarni, M.D., Wang, H.-W., Kobayashi, K. and Sivak, M.V. Jr.,“Optical coherence tomography andmicroscopy in gastrointestinal tissues”, IEEE Journal of Selected topics in quantum electronics, 2(4), 1017-1028,1996. 7. Rollins, A.M. and Izatt, J.A.,“Optimal interferometer designs for optical coherence tomography”, Optics Letters,24(21),1484-1486,1999. 8. Kersey, A.D., Marrone, M.J., Dandridge, A. and Tveten, A.B.,“Control scheme for polarization-induced signalfading in multiplexed optical fibre interferometric sensors”, Journal of Lightwave Technology, 6(10), 1599-1609,1988. 9. Beddows, R., James, S.W. and Tatam, R.P., “Improved performance interferometer designs for optical coherencetomography”, Presentation at the 15" International Conference on Optical Fibre Sensors (OFS-15), Portland, Oregon,6-10 May, 2002, IEEE Cat. No: 02EX533,527-530. 10. Ford, H.D., Beddows, R., Casaubieilh, P. and Tatam, R.P., “Comparative signal-to-noise analysis of fibre-opticbased OCT systems”,Journal of Modern Optics, 52,1965-1979,2005. 11. Casaubieilh, P., Ford, H.D. and Tatam, R.P.,“Optical coherence tomography with a Fizeau interferometerconfiguration”, Proc.SPIE 5858-18,2005. 12. Podoleanu A. Gh., Dobre, G.M. and Jackson D.A., “En-face coherence imaging using galvanometer scannermodulation”,Optics Letters,23(3),147-149,1998. 13. Ford,H.D. and Tatam,R.P.,“Full-field optical coherence tomography”, Proc. SPIE 5858-19,2005. 14. Xie, T., Mukai, D., Guo, S., Brenner, M. and Chen, Z.,“Fiber-optic-bundle-based optical coherence tomography”Optics Letters,30(14),1803-1805,2005. 15. http://www.us.schott.com/fiberoptics/english/products/imaging/index.html. 16. Chance, B. Photon Migration in Tissues’, Plenum Press: New York, 1988. 17. Tearney G.J., Boppart, S.A., Bouma, B.E., Brezinski, M.E., Weissman, N.J., Southern, J.F. and Fujimoto, J.G.,“Scanning single-mode fiber optic catheter-endoscope for optical coherence tomography”, Optics Letters, 21(7),543-545,1996. 18. I Balboa and R P Tatam, “Source considerations for low coherence speckle interferometry” Presented at the conference Optical Inspection and Micromeasurements II, Munich, Germany, 1997. Published inEOS/SPIE Proc. 3098,316-324,1997. 19. Dubois, A., Vabre, L., Boccara,A-C and Beaurepaire, E.,“High-resolution full-field optical coherence tomographywith a Linnik microscope”, Applied Optics, 41(4),805-812,2002. Coherence Domain Optical Methods and Optical Coherence Tomography in Biomedicine Xedited by Valery V. Tuchin, Joseph A. Izatt, James G. Fujimoto, Proc. of SPIE Vol. , (·$ doi: roc. of SPIE Vol. -Downloaded from SPIE Digital Library on Feb to Terms of Use: http://spiedl.org/terms Proc. of SPIE Vol. -Downloaded from SPIE Digital Library on Feb to Terms of Use: http://spiedl.org/terms
确定
还剩7页未读,是否继续阅读?

产品配置单

北京欧兰科技发展有限公司为您提供《组织,肿瘤中光学断层扫描检测方案(CCD相机)》,该方案主要用于其他中光学断层扫描检测,参考标准--,《组织,肿瘤中光学断层扫描检测方案(CCD相机)》用到的仪器有德国LaVision PIV/PLIF粒子成像测速场仪、Ekspla PGx01 皮秒光学参量发生器(OPA)
推荐专场


相关方案
更多
该厂商其他方案
更多