


方案详情
文
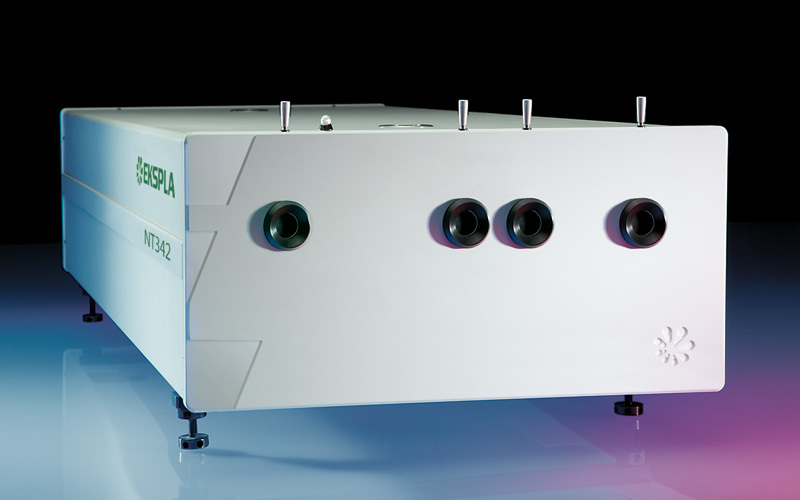
立陶宛Ekspla公司生产的光学参量振荡器,型号NT342A,重复频率10赫兹。脉冲宽度5纳秒。输出波长420-2300纳米。实验中采用的近红外激光峰值功率2千瓦,单脉冲能量1-15微焦。以此为光源,对人内耳蜗的原位声光模拟进行了研究分析。
方案详情

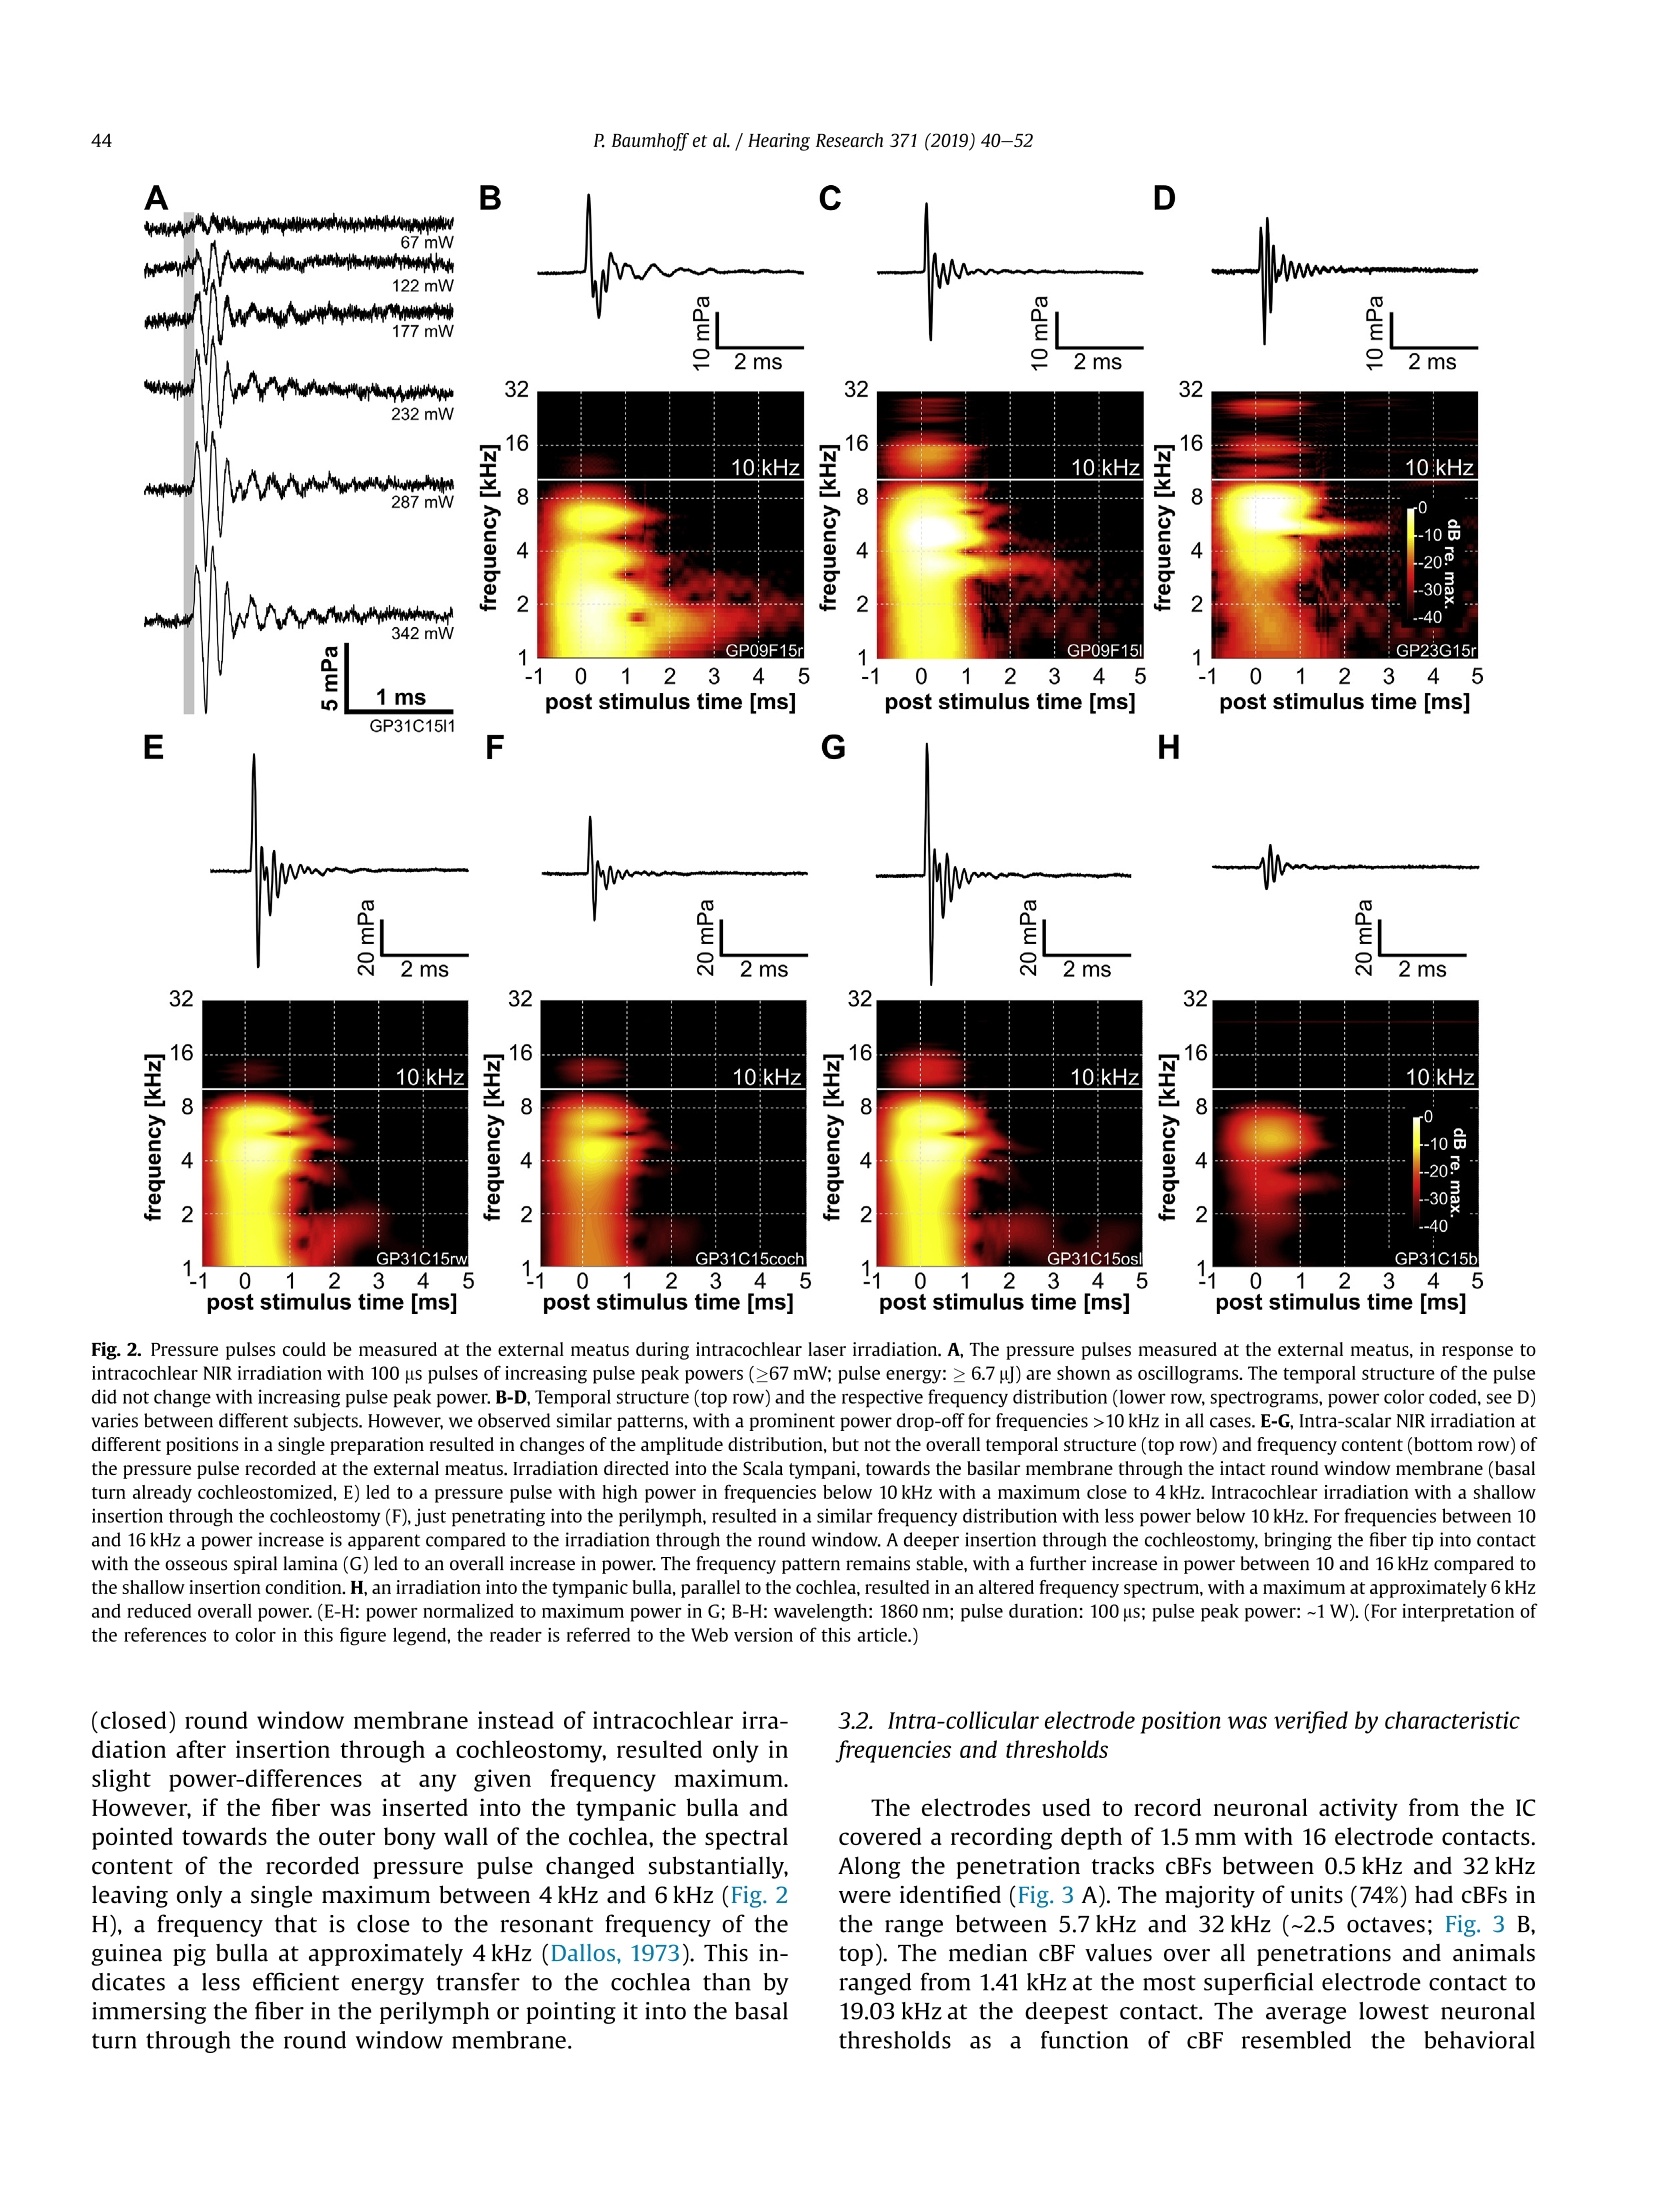
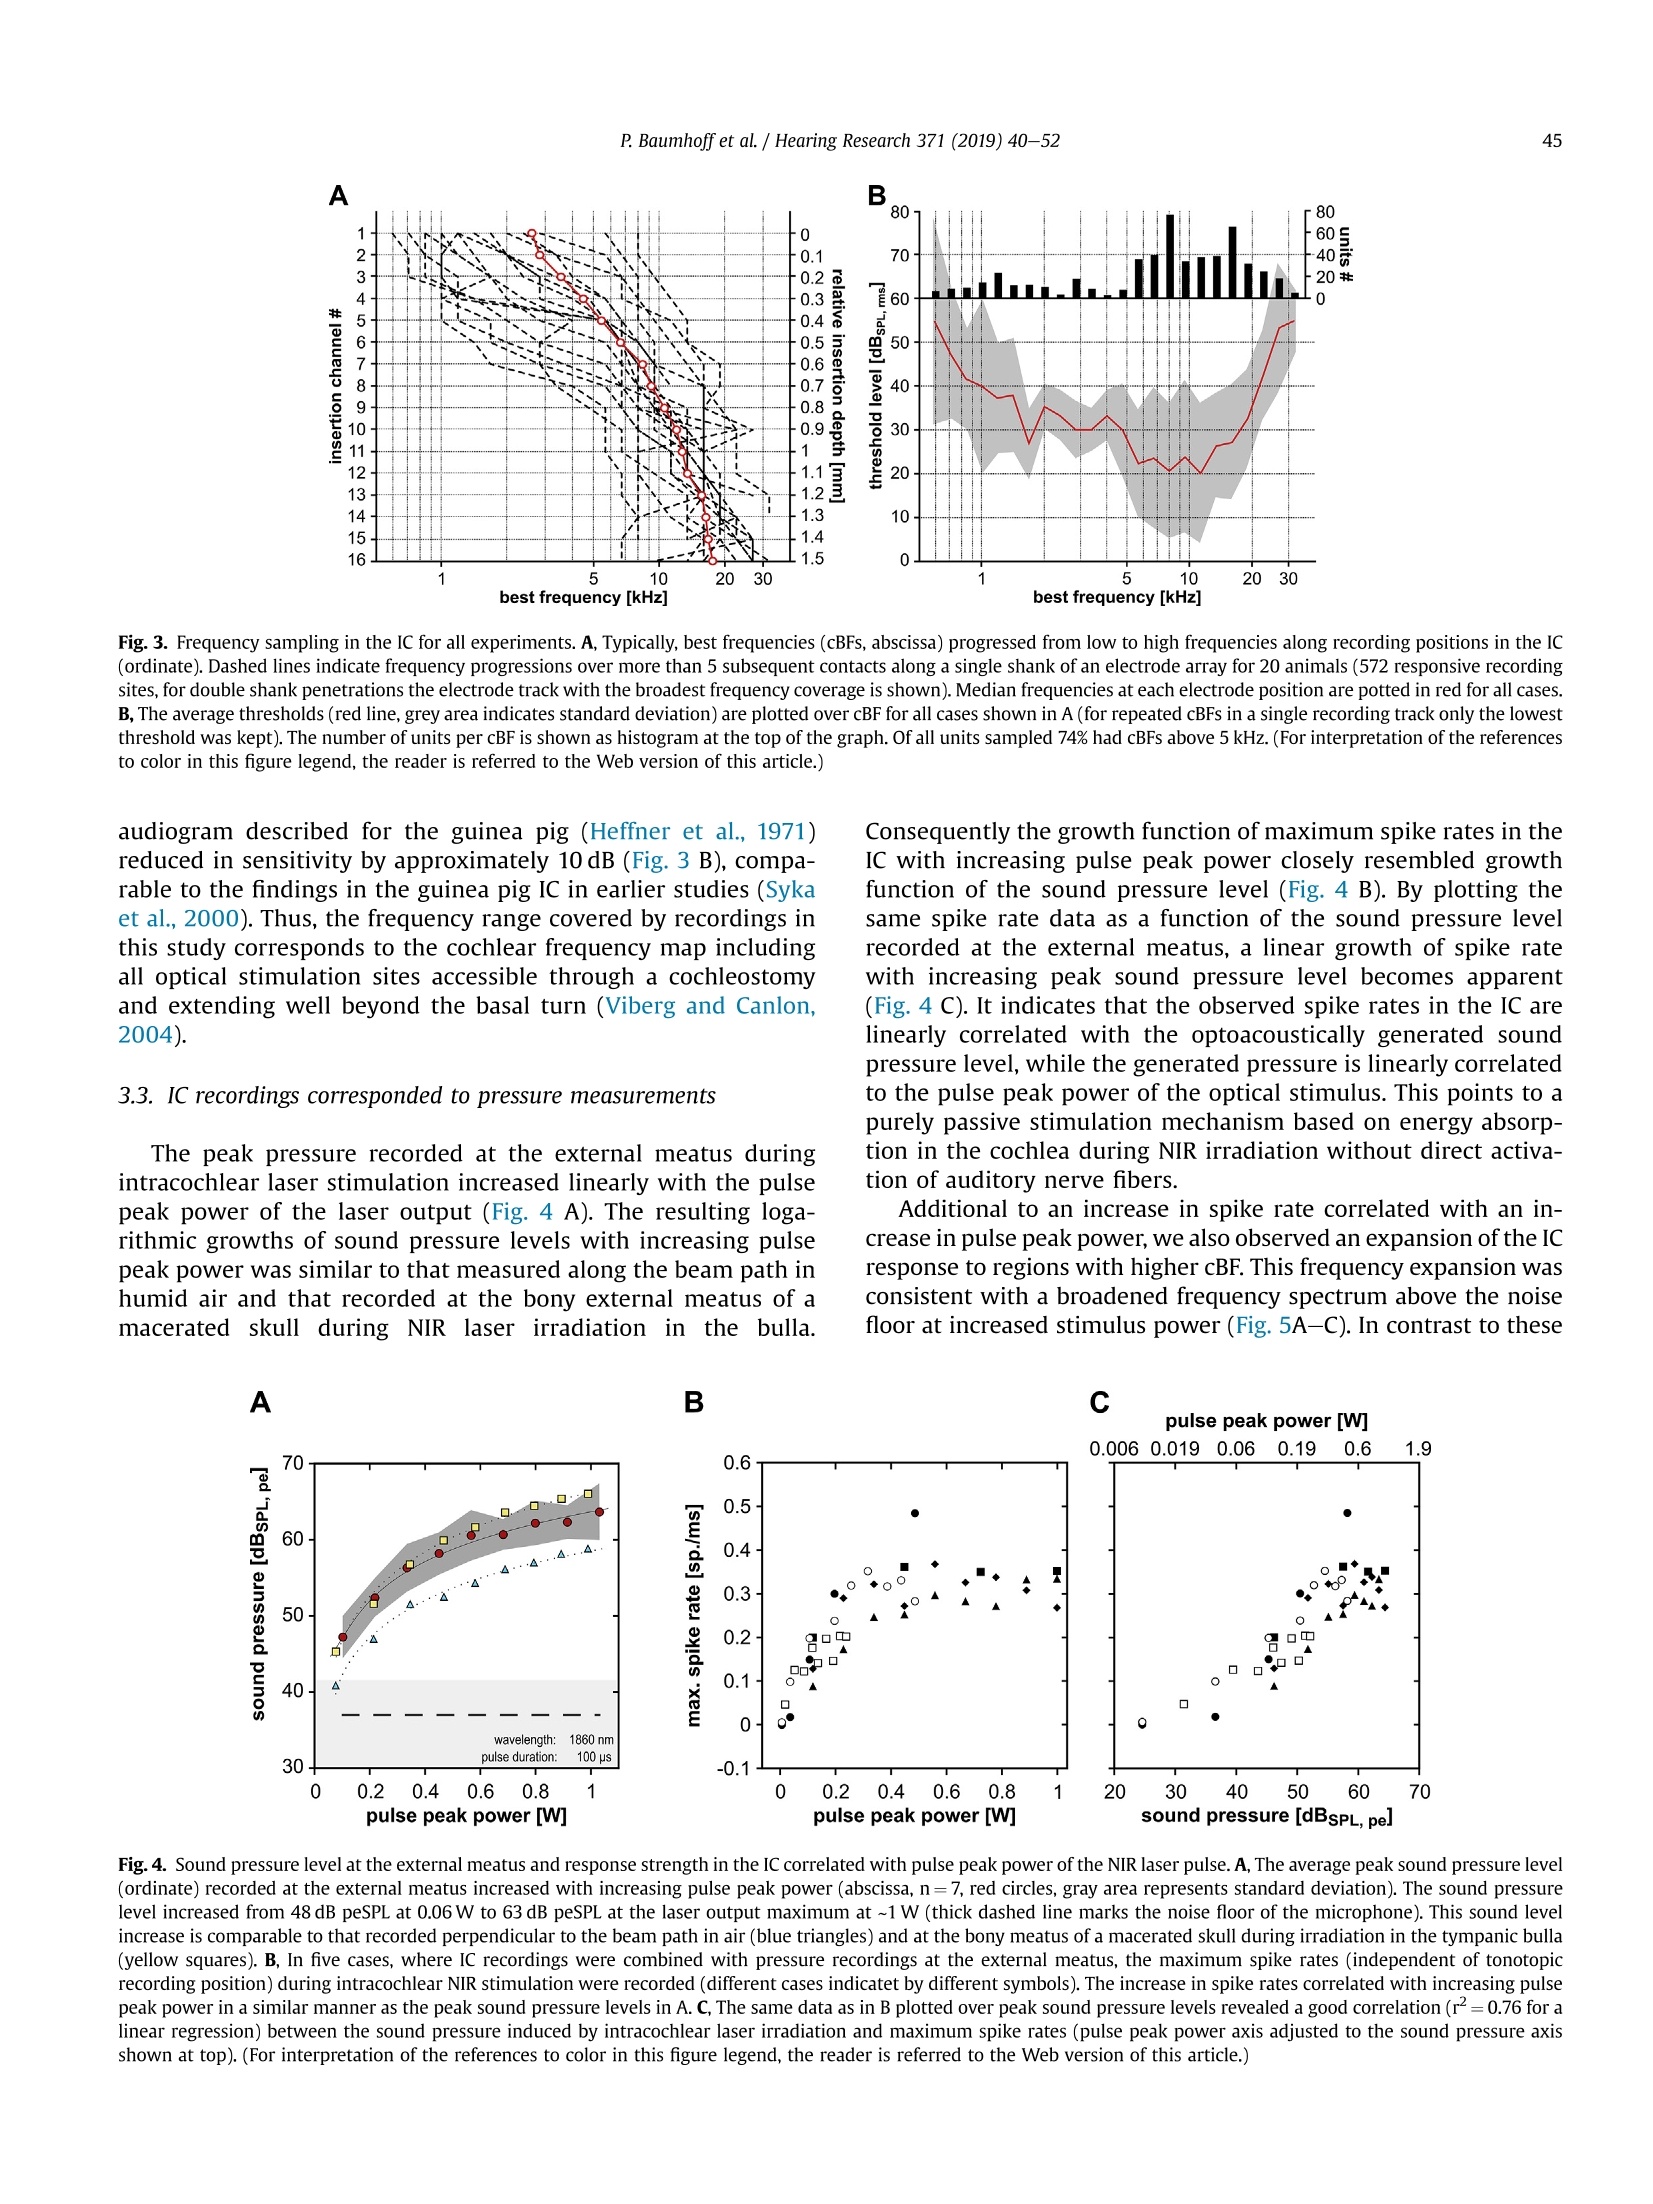
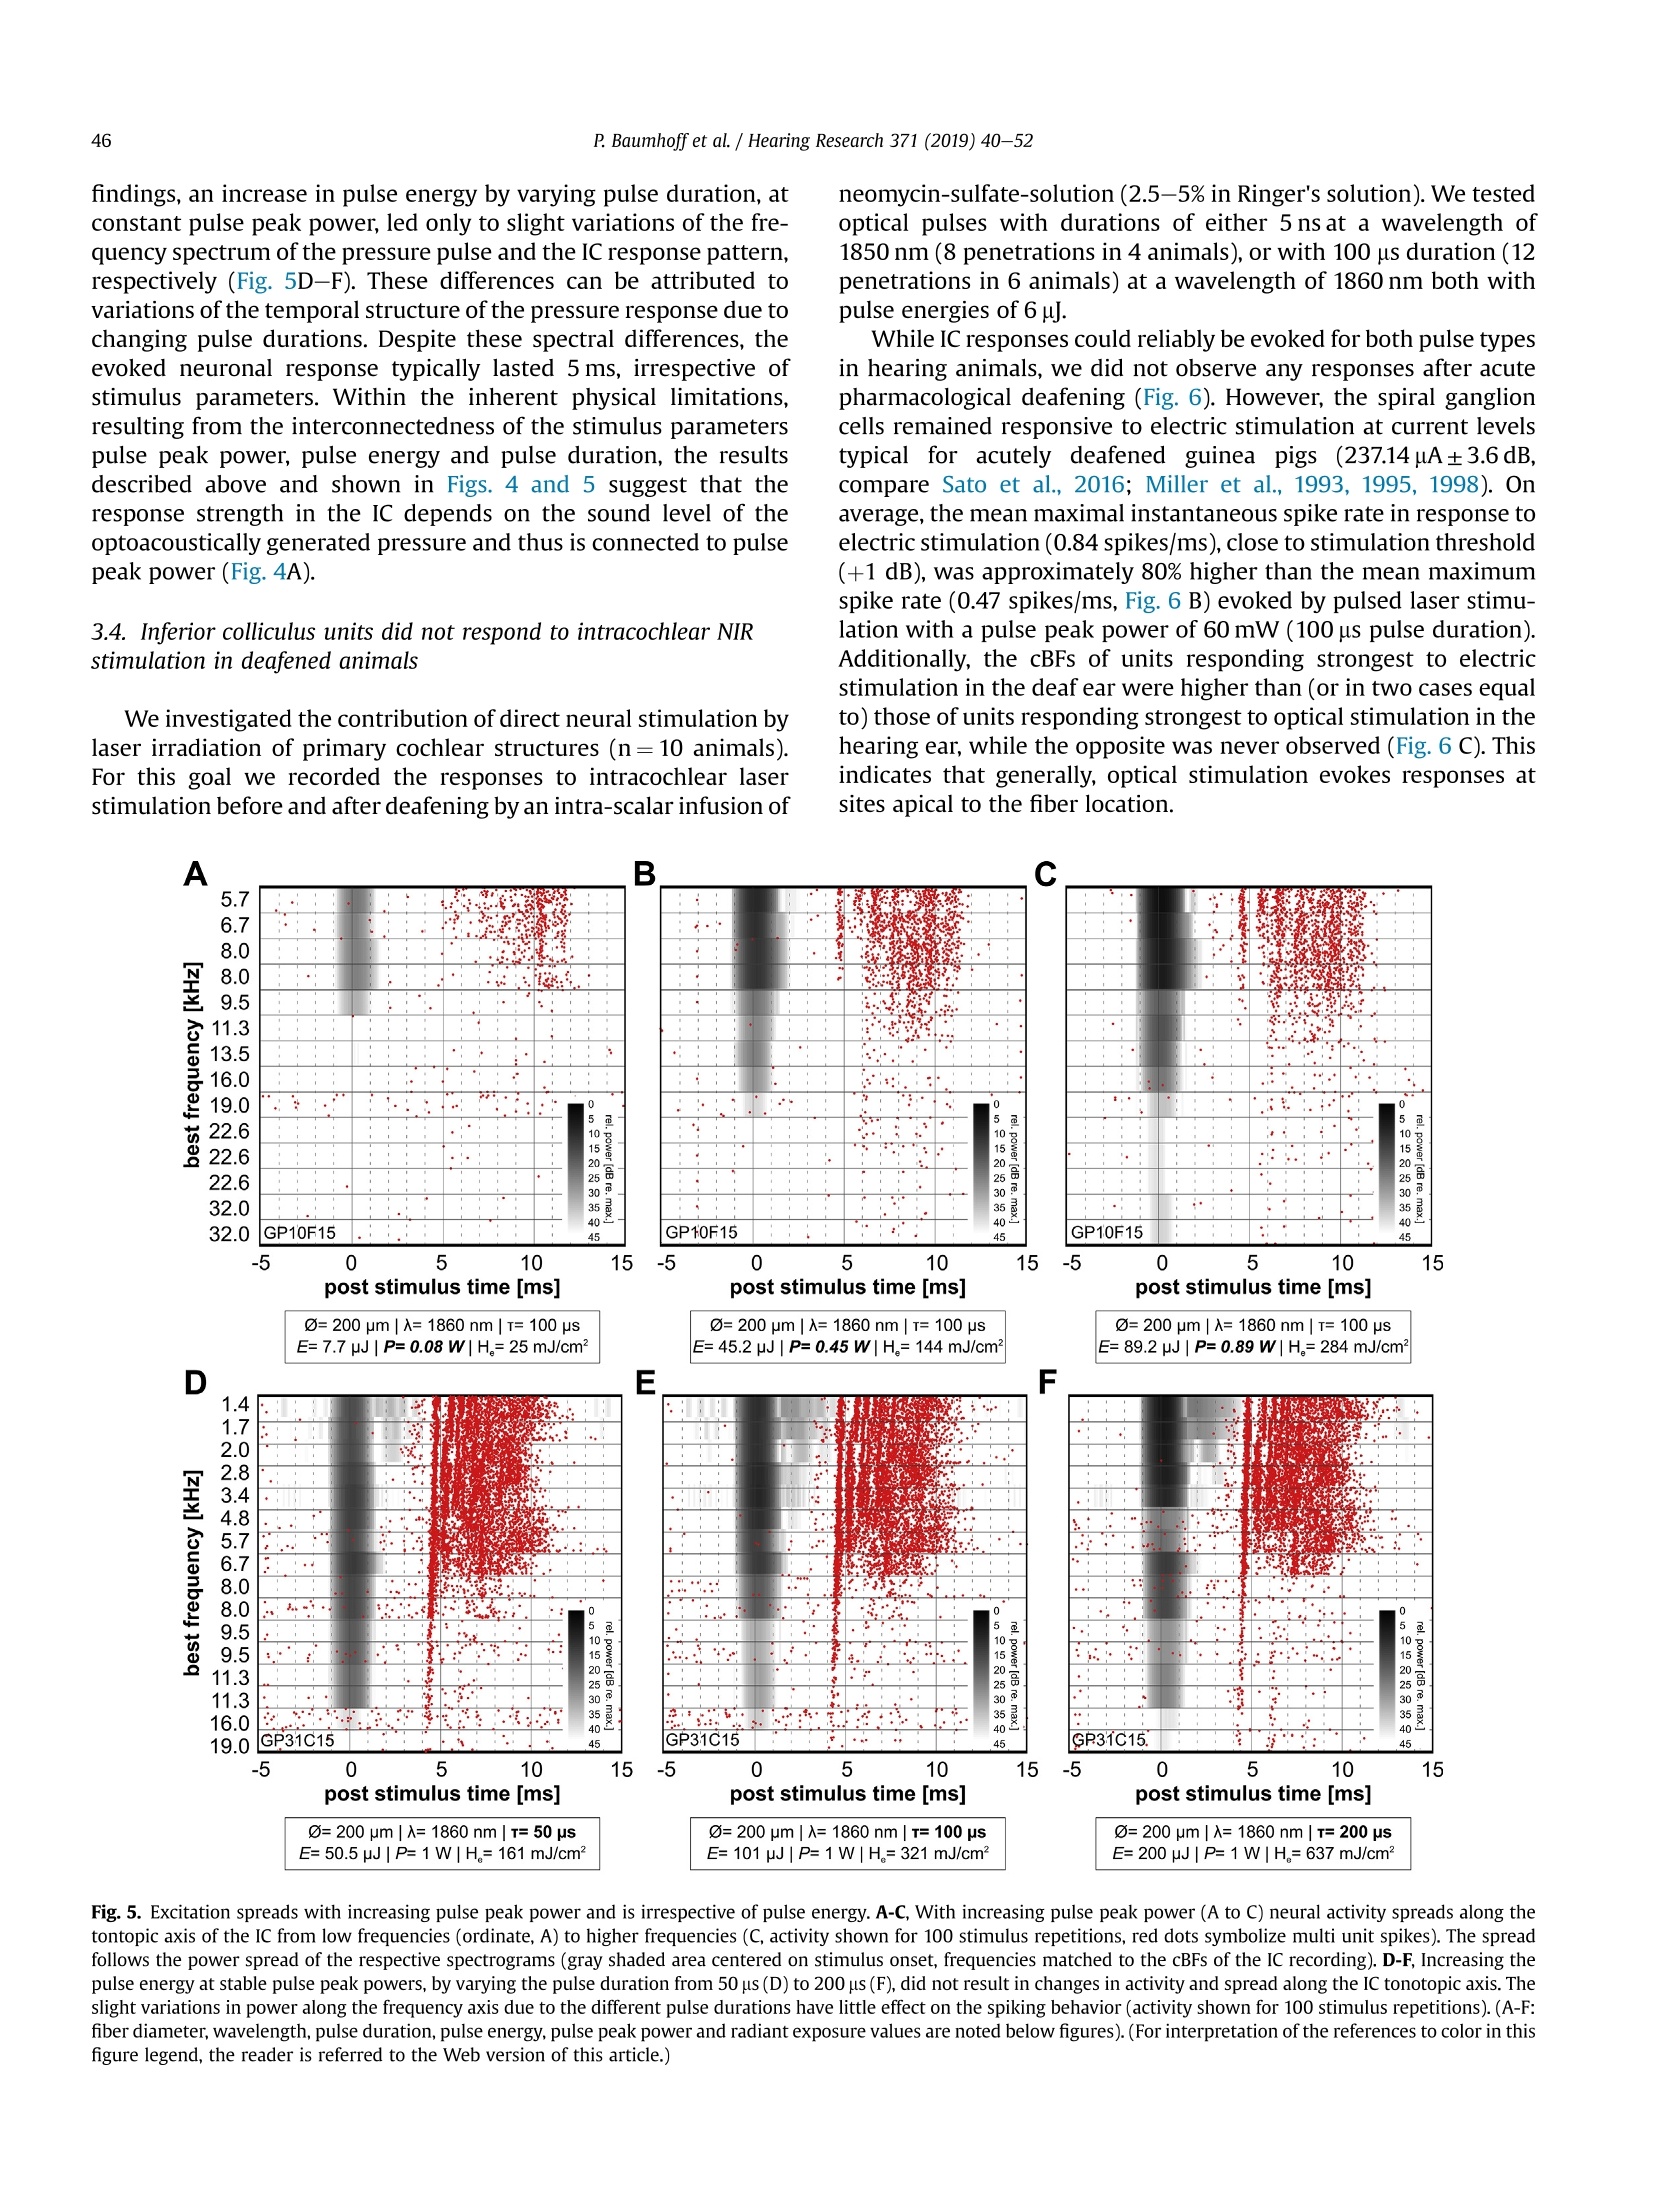
Hearing Research 371 (2019) 40-52 41P. Baumhoffet al. / Hearing Research 371 (2019) 40-52 https://doi.org/10.1016/j.heares.2018.11.0030378-5955/◎ 2018 The Authors. Published by Elsevier B.V. This is an open access article under the CC BY-NC-ND license (http://creativecommons.org/licenses/by-nc-nd/4.0/). Contents lists available at ScienceDirect Hearing Research ELSEVIER journalhomepage: www.elsevier.com/locate/heares Research Paper Intracochlear near infrared stimulation: Feasibility of optoacousticstimulation in vivo Peter Baumhoffa*, Nicole Kallweit b., Andrej Krala,c Institute of AudioNeuroTechnology and Department of Experimental Otology, ENT Clinics, Hannover Medical School, Stadtfelddamm 34, 30625, Hannover, Germany Laser Zentrum Hannover e.V.(LZH), Hollerithallee 8, 30419, Hannover, Germany ‘DFG Cluster of Excellence, Hearing 4 All, Germany ARTICLEINFO Article history:Received 4 July 2018Received in revised form4 October 2018Accepted 8 November 2018 Available online 12 November 2018 Keywords: Near infrared stimulation LaserOptoacoustic effectCochlea Inferior colliculus Guinea pig 1. Introduction Pulsed laser irradiation has been discussed as an alternative forstimulation of peripheral nerves (Tozburun et al., 2012; Duke et al.,2009; Wells et al., 2007a) since it avoids the disadvantage of aspreading electric field. Pulsed lasers in the near infrared range(NIR) have therefore been fathomed within auditory research (Tianet al., 2017; Guan et al., 2016; Tan et al., 2015; Richter et al., 2011a;Rajguru et al., 2010). NIR pulses were, however, shown to activatehair cells(Richardson et al., 2017; IThompson et al., 2015;Rettenmaier et al., 2014;Schultz et al., 2014; Verma et al., 2014; ( * Corresponding author. Institut e of AudioNeuroTechnology, Stadtfelddamm 34, 30625, Hannover, Germany. ) ( E-mail a ddresses: b aumhoff.peter@mh-hannover.de (P. Baumhoff), n i col e kallwei t @gmx. d e ( N . Kallweit),kr a l.andrej@ m h-han n over.de (A. K ral). ) Teudt et al., 2011). In those in vivo studies that involved profoundhearing loss, compound action potentials (CAPs) could not beevoked during intracochlear laser stimulation (Thompson et al.,2015; Schultz et al., 2012, 2014), contradicting the possibility tostimulate spiral ganglion cells (SGN) directly. Absorption of pulsedlasers in water generate pressure waves that are acoustically wellwithin hearing range, considering both frequency content andsound pressure levels (Kallweit et al., 2016; Xia et al., 2016; Schultzet al., 2012, 2014; Teudt et al., 2011). Such optoacoustic effects could under certain conditions bebeneficial, particularly for subjects with residual hearing. Theoptoacoustic signal could be used in combined opto-electric hear-ing devices for electro-(opto)acoustic stimulation and could beadvantageous due to the exceptionally small size of the sound-delivering object (the stimulating glass fiber) that can be easilyplaced even into the scala tympani. The inclusion of either an optical fiber or a laser diode into an integrated CI design could beused to apply optoacoustic intracochlear pressure, analogous to anactuator, and confer low frequency envelope information to haircells apically to the electrically stimulated (high frequency)regions.Pilot tests of the efficiency of envelope coding with stimuli corre-sponding to intracochlear optoacoustic signals showed promisingresults, particularly when considering the high-frequency hearingloss in EAS subjects (Kruiger et al., 2017). The instantaneous opticaloutput could be synchronized with the electric stimulation moreeasily than the delayed acoustic input from hearing aids, as used incurrent techniques. However, many possible drawbacks need to bealso considered. In the present study, the optoacoustic phenomena were char-acterized in vivo to explore the possibility of an application inhearing impaired subjects with residual low frequency hearing. Inorder to evaluate the feasibility of such an approach, we deter-mined whether the optoacoustic activation of the cochlea is strongenough in medium to low frequencies to evoke above thresholdresponses. To access the feasibility of optoacoustic stimulationdirect neural stimulation has to be excluded as confounding stim-ulation mode. We combined in vivo intracochlear optical stimula-tion with neuronal recordings along the tonotopic axis of theinferior colliculus (IC) in the auditory midbrain of normal hearinganimals and pressure recordings through a condenser microphoneat the external ear canal. We verified the optoacoustic origin of theIC activation by absence of responses to optical stimuli in deafenedanimals and comparison to electrical stimulation. Furthermore, weassessed the pressure spread in the cochlea by computing the po-wer spectrum of sound at the external ear and compared it to thetonotopic frequency range activated in the IC. Finally, we did notfind any signs of confounding direct neuronal stimulation by pulsedlaser in the present experiments. 2. Materials and methods All experiments of the present study were performed in 23 (5female) adult, normal hearing Dunkin-Hartley (albino) guinea pigs(485.2g±130.7g). All animals were handled and housed accordingto German (TierSchG, BGBl. I S. 1206, 1313) and European Union(ETS 123; Directive 2010/63/EU) guidelines for animal research andthe described animal experiments were approved by German stateauthorities (Lower Saxony State Office for Consumer Protection andFood Safety [LAVES] approval number 14/1514) and monitored bythe institute's animal welfare officer. 2.1. Surgical preparation Anesthesia was induced by an intramuscular injection of acombination of ketamine (50mg/kg), xylazine (10 mg/kg) andatropine sulfate (0.1 mg/kg). During the surgery and throughout theexperiments vital parameters and anesthesia level were continu-ously assessed by monitoring heart rate (ECG) and capnometry(CO2%/vol.). The absence of paw-withdrawal and corneal reflexeswas tested in regular intervals. Appropriate anesthesia level wasmaintained by follow-up injections of 20%-30% of the initial doseof ketamine and xylazine in intervals of 45 min or as needed. Insome cases, the xylazine dosage was reduced by half for cardiacrelief after all surgical procedures were completed. During the ex-periments, the body temperature was measured via a rectal probeand the maintained between 37.5 and 38.5°C using a heatingblanket (TC-1000 Temperature Controller, CWE Inc., Ardmore,USA). A custom-made endotracheal tube was inserted through atracheotomy and was connected to a capnometer (Normocap CO2 &O2 Monitor, Datex, Helsinki, Finland). The animals were eitherbreathing spontaneously or, if required, were artificially ventilated (Rodent Ventilator 7025, Ugo Basile, Comerio, Italy). To fit a skull mounted head holder, the animal's head waspositioned in a stereotactic frame (Stereotaxic Frame 1430, DavidKopf Instruments, Tujunga, USA) and initially fixed by ear bars(Non-Rupture Ear Bars 855, David Kopf Instruments) and a custombuilt snout holder. The skull was exposed dorsally and a purposebuild, stainless steel fixation-rod was cemented onto the ossanasales, anterior to suture-point Bregma using dental-acrylic (Pal-adur, Heraeus Kulzer GmbH, Dormagen, Germany) and 3 to 4bonescrews (0 0.85 mm, Fine Science Tools GmbH, Heidelberg, Ger-many). A hole was drilled near Bregma to place a reference silverball electrode onto the Dura mater. Stable electric contact of thereference was established using salt-free electrode gel (Spectra 360,Parker Laboratories, INC., Fairfield,USA), which was filled into thetrepanation hole. After complete polymerization of the dentalacrylic, the ear bars as well as the snout holder were removed. Both tympanic bullae were opened after retro-auricular incisionand retraction of the skin. At each side a cochleostomy was drilledinto the basal cochlear turn approximately 0.6 mm below the roundwindow. The pre- and post-surgical hearing status was verified byABR recordings (see acoustic stimulation for details). One cochlea(ipsilateral to the later recording site) was deafened (deafeningprocedure see below) to eliminate acoustic crosstalk between thecochleae by bone- or air-conduction. The skull was opened contra-lateral to the stimulation side,centered 12 mm caudally from Bregma and 4 mm laterally from themidline and the Dura mater. The opening had an approximatediameter of 7 mm. The stereotactic frame and the animal's headwere positioned in a way that allowed access to the ipsi-lateralcochleostomy. A linear single-shank electrode array with 16iridium contacts spaced by 100 um and an site area of 177um(NeuroNexus, Ann Arbor, USA) or a 32 channel double shank arraywith the described specifications for both shanks (ditto) was ster-eotactically inserted into the Inferior colliculus (IC) through theoverlaying cerebral cortex. The insertion site was in the middle ofthe trepanned area and the latero-medial insertion angle was set to~35-45° relative to midline. Prior to the recordings the brain wascovered with medical grade silicon oil (M 5000, Carl Roth GmbH &Co. KG, Karlsruhe, Germany) to prevent dehydration of the braintissue. The position of the recording track was histologically verifiedafter the experiment. To verify the stereotactic electrode position atthe beginning of the study, the electrode array was stained with afluorescent cell labeling solution (DiI or DiO, Life Technologies,Carlsbad, USA) prior to insertion in some cases for a better visibilityof the electrode track (Fig.1 A). 2.2. Acoustic stimulation The hearing thresholds were tested prior to surgery, aftercochleostomy and after deafening,by recording ABRs evoked by 50us clicks at increasing sound pressure levels (0-80 dB peSPL, 5 dBsteps). The stimuli were typically presented with 100 repetitionsthrough a headphone speaker (DT48, Beyerdynamic, Heilbronn,Germany). The signals were amplified by 100 dB and filtered be-tween 200 Hz and 5 kHz (6th order butterworth filter). Normalhearing was presumed for threshold-levels of 35 dB peSPL orbelow. All animals had normal hearing after insertion of the elec-trode array into the midbrain. The intra-collicular position wasverified by measuring frequency response curves (Fig. 1 B). Westimulated with 50 ms tone bursts (5 ms cosine ramp) at fre-quencies between 1 and 32 kHz with 4 steps per octave for soundpressure levels from 0 to 90 dB SPLrms in 10 dB steps through theheadphone speaker positioned~3 cm from the ear, contralateral tothe recording site. Stimulation and recordings were operated Fig. 1. Inferior colliculus (IC) recordings and optical stimulation approach. A, Example of the histological verification of the electrode position in the IC. For a histologic verification ofthe penetration path and the electrode position in the IC, the recording electrode array was stained with the fluorescent dye Dil prior to insertion. In the example shown, theelectrode was inserted in a 40° angle to position the 16 electrodes through the central part of the IC (Aq: cerebral aquaeduct; Ctx: cortex; Cb; cerebellum; Ic: inferior colliculus; d:dorsal; m: medial). B, Exemplary frequency response areas in the IC. For the verification of the IC position during the experiments, we recorded the neuronal frequency responseareas. Mean spike rate during 50 ms pure tone stimulation is plotted as a function of stimulation frequency and sound level for the 16 intra-collicular recording positions marked inA. The characteristic frequency (CF) at the tip ofeach frequency response area gradually increases from low frequencies at the more superficial to high frequencies at the deepercontacts, indicating an electrode penetration along the tonotopic axis of the central IC. C, Schematic representation of the setting for stimulation and pressure recording. Westimulated optically by a cochleostomic insertion of an optical fiber into the scala tympani in the basal cochlear turn. The intracochlear position could be varied by changinginsertion angle and depth of the fiber. We recorded the pressure at the external meatus by positioning a condenser microphone over the cartilageous external ear canal and looselysealing it with a fitted rubber ring. D, Photograph of the end of the optical fiber. Close to the light emitting fiber tip a stimulation contact was placed with conductive varnish. It wasconnected to a1 pin gold connector (not shown) by an insulated platinum micro wire. The custom design was prepared by MedEl Comp., Innsbruck, Austria. (For interpretation ofthe references to color in this figure legend, the reader is referred to the Web version of this article.) through a custom recording setup and software (AudiologyLab,Otoconsult, Franfurt a.M., Germany). The stimulation level wascalibrated through the software at each frequency prior to eachrecording using a condenser microphone (1/4”microphone [4939]in combination with a preamplifier [2670] and a Nexus condi-tioning amplifier [2690], Briel & Kjaer, Naerum, Denmark)perpendicular to the sound path between ear and speaker. Thestimuli were presented in randomized order with 10 repetitions foreach stimulus. The neuronal signals were acquired and amplifiedthrough a multichannel recording system (Lynx-8 amplifier system,amplification 5000-10000 times, butterworth filter 1 Hz -9kHz,rolloff: 12 dB per octave, Neuralynx, Bozeman, USA) and storedthrough AudiologyLab at a sampling rate of 25 kHz using a 32-channel MIO card (NI-6259 National Instruments, Austin, USA).Directly after the recording, we verified the electrode placement bydetermining the characteristic frequencies (CFs) of the multi unitresponses at the electrode contacts of the array using custom-madeMatlab routines (MathWorks, Natick, MA, USA). Throughout themanuscript each multi unit response is referred to as unit. Weassumed the position to be intra-collicular, when CFs progressivelyincreased from superficial to deep recordings (Fig. 1 B). For lateranalysis, the cumulative best frequency (cBF) was defined as thefrequency with the highest summed response rate over all stimu-lation levels. This cBF is closely correlated with the CF as shownpreviously (Konerding et al., 2018) with a tendency of being slightlylower than the CF. We chose this measure,to account for the un-certainty of the intensity level of the optoacoustic stimulation,which, considering the response strength, in many cases seemed tobe well above threshold. 2.3. Optical stimulation Two different laser systems were employed for optical stimu-lation. A tunable laser-system, based on an optical parametric oscillator (OPO, Ekspla,NT342A, Vilnius, Lithuania),produced 5 nspulses at a repetition rate of 10 Hz. Wavelengths were tunable be-tween 420 and 2300 nm. The energy output of this system wascalibrated prior to the experiment using a pyroelectric energyprobe (DPJ8,Spectrum Detector Inc., Oregon, USA). A second lasersystem generated adjustable pulse durations between 10 us and20 ms in a wavelength range between 1848 and 1862 nm (CapellaR-1850, Lockheed Martin Aculight, Bothell, USA). This system'senergy output was calibrated using a thermopile sensor (P10Q,Coherent Inc., Portland, USA) coupled to a powerand energy meter(LabMax-TOP,Coherent Inc., Portland,USA). After the position of the electrode-array within the IC had beenconfirmed, a cleaved optical multimode-fiber (low OH, core diam-eter either 105 um [FG 105LCA] or 200 um [FG 200LCC], Thorlabs,Newton, USA) was inserted into the basal turn through the coch-leostomy. The fiber was coupled to either laser system by a SMAconnector. The insertion was directed by a micro manipulator(MM33, Marzhauser Wetzlar GmbH & Co. KG, Wetzlar, Germany)and the fiber-tip was either pointed towards the basilar membraneor towards the osseous spiral lamina. The parameters of the optical stimuli used in this study aresummarized in Table 1. For stimulation at different wavelengthsand pulse durations in the ns and us range the energy output wasoften set to 6, a pulse energy that elicited robust CAP responsesand measurable sound pressures in earlier studies (Kallweit et al.,2016; Schultz et al., 2012). The responses to these stimuli wererecorded in the IC. After successful stimulation in the normalhearing ear, this ear was also deafened (deafening procedure seebelow). Then laser-stimulation was repeated and IC responses weremeasured. Afterwards electric stimulation followed (see below). In 6 cases both laser systems were used for stimulation in thesame preparation. In these cases the optical stimulations wereperformed sequentially.Each system was connected to a separateoptical fiber, in order to individually calibrate the output energy Summary of the optical stimulation parameters used in the study. laser system wavelength pulse energy pulse peak power pulse duration Capella 1850nm/1860 nm ≤3mJ <150mW 10 us to 20 ms Ekspla 420nm-2300nm 1-15可 ~2kW 5 ns prior to the in vivo experiments. Therefore the fiber of the firstsystem was retracted from the cochleostomy and the fiber of thesecond system was inserted. We used a micromanipulator to keepthe insertion depth and angle constant for stimulation with bothsystems. 2.4. Electric stimulation In 10 ears (N=7 animals), customized 200 um optical fibers ([FG200LCC], Thorlabs, Newton, USA) with a conductive contact at thefiber-tip (Fig. 1D; MedEL, Innsbruck, Austria) were used for opticalstimulation with the Capella laser system. This special designenabled an additional monopolar electric stimulation in closeproximity to the site of light emission and absorption. Biphasiccharge balanced electric pulses with a phase-duration of 100 uswere generated by a custom stimulation system (Otoconsult,Frankfurt a.M., Germany). Varying current levels between 30 uAand 1 mA, in 1 dB steps were used for electric stimulation. Re-sponses to electric stimulation were analyzed 1 dB above threshold,if not indicated otherwise. 2.5. Deafening procedure The animals were deafened by slowly applying 2.5-5%neomycin-sulfate (Caesar & Lorentz GmbH, Hilden, Germany) insaline(40-80 mM/L)atpH~7.0 andrroom temperature(~20-22C) through the cochleostomy into the Scala tympani untilall fluid was replaced by the solution. Excess liquid was allowed tooverflow into the Tympanic bulla. Following a waiting time of5-10 min, the Tympanic bulla was dried using absorbent swabs(Kettenbach GmbH & Co. KG, Eschenburg, Germany). Then thecochlea was slowly rinsed with Ringer's solution at room temper-ature to wash out the neomycin-sulfate. Afterwards excessive fluidwas removed from the bulla. When deafening was performed afterthe electrode insertion into the midbrain, the deafening successwas verified by the absence of acoustically evoked responses in theIC up to the highest sound pressure level tested (90 dB SPLrms). 2.6. In vivo pressure measurements The reversely transmitted pressure at the external ear canal wasaccessed during intracochlear optical stimulation at a wavelengthof 1860 nm (Capella laser system) with various pulse durations. Wesurgically removed the pinna and placed a condenser microphone(1/4”microphone and Nexus amplifier, sensitivity 3.08 V/Pa, Bruel& Kjaer, Naerum, Denmark) over the cartilaginous external meatusand sealed it to the surrounding muscle by a rubber ring, allowingfor pressure compensation (Fig.1 C). The pressure was transformedinto a voltage signal and recorded with a minimum sampling rate of100 kHz. The reverse middle ear transfer function was not assessedduring the experiments and the reported values were not adjustedfor transmission loss. 2.7. Ex vivo pressure measurements For comparison we performed ex vivo experiments to measurethe laser-induced sound pressure in air (relative humidity 40-45%)and in the macerated guinea pig tympanic bulla (whole skullpreparation). For the recordings in air, the tip of the optical fiberwas placed ~600 um off the middle and 2.5 mm below the micro-phone membrane with the fiber running perpendicular to themicrophone. In the recordings from the macerated tympanic bulla,the optical fiber was inserted into the bulla through an artificialfenestration parallel to the cochlea and positioned perpendicularand close to the center of the outer ear-canal using a micro- manipulator. The microphone was placed on the outer ear-canaland loosely sealed to the bone by a fitted rubber ring. For bothex vivo settings a variety of optical stimuli in the same range ofparameters as in the in vivo experiments were applied and theresulting sound pressures were recorded. 2.8. Data analysis All data was analyzed offline using custom programmedMATLAB R2012b (The MathWorks, Inc., Natick, Massachusetts,USA) routines. Multi unit activity (MUA) was analyzed by filteringthe signal between 400 Hz and 3 kHz and extracting all samplesas 'spikes’ for which the amplitude exceeded the background by3-4 times, depending on background noise level. Spontaneousspike rates were calculated in a 10 ms-time window beforestimulus onset and the evoked spike rates were calculated usinga time window of 15 ms after stimulus onset for tonal stimulationand 10 ms for click- and laser-stimulation, respectively. From thefrequency tuning the cBF was calculated and the thresholds werevisually determined and extracted from the data. Spectrograms (2.5 ms Hamming window, 2 ms overlap; MAT-LAB signal processing toolbox, function: spectrogram) and powerspectra (analysis restricted to pressure signal; MATLAB function:fft) were calculated from the pressure measurement data. For statistical analyses data was tested for normal distributionusing the Kolmogorov-Smirnov test. In all cases a normal distri-bution of the data could be verified and parametric tests werechosen to describe differences and correlations in the data. Whererequired the tests were corrected for multiple comparisons (Bon-ferroni correction). The test statistics are indicated in the text andfigure legends for each case. For graphical representation mean andstandard deviation were calculated and shown in the plots. For alltests p-values below 0.05 were considered significant. 3. Results 3.1. Intracochlear laser stimulation generated distinct pressurepulses at the external meatus Fig.2. Pressure pulses could be measured at the external meatus during intracochlear laser irradiation. A, The pressure pulses measured at the external meatus, in response tointracochlear NIR irradiation with 100 us pulses of increasing pulse peak powers (>67 mW; pulse energy:≥6.7可) are shown as oscillograms. The temporal structure of the pulsedid not change with increasing pulse peak power. B-D, Temporal structure (top row) and the respective frequency distribution (lower row, spectrograms, power color coded, see D)varies between different subjects. However, we observed similar patterns,with a prominent power drop-off for frequencies >10 kHz in all cases. E-G, Intra-scalar NIR irradiation atdifferent positions in a single preparation resulted in changes of the amplitude distribution, but not the overall temporal structure (top row) and frequency content (bottom row) ofthe pressure pulse recorded at the external meatus. Irradiation directed into the Scala tympani, towards the basilar membrane through the intact round window membrane (basalturn already cochleostomized, E)led to a pressure pulse with high power in frequencies below 10 kHz with a maximum close to 4kHz. Intracochlear irradiation with a shallowinsertion through the cochleostomy (F), just penetrating into the perilymph,resulted in a similar frequency distribution with less power below 10 kHz. For frequencies between 10and 16 kHz a power increase is apparent compared to the irradiation through the round window. A deeper insertion through the cochleostomy, bringing the fiber tip into contactwith the osseous spiral lamina (G) led to an overall increase in power. The frequency pattern remains stable, with a further increase in power between 10 and 16 kHz compared tothe shallow insertion condition. H, an irradiation into the tympanic bulla, parallel to the cochlea, resulted in an altered frequency spectrum, with a maximum at approximately 6 kHzand reduced overall power.(E-H: power normalized to maximum power in G; B-H:wavelength: 1860 nm; pulse duration: 100 us;pulse peak power: ~1 W). (For interpretation ofthe references to color in this figure legend, the reader is referred to the Web version of this article.) (closed) round window membrane instead of intracochlear irra-diation after insertion through a cochleostomy, resulted only inslight power-differences at any given frequency maximum.However, if the fiber was inserted into the tympanic bulla andpointed towards the outer bony wall of the cochlea, the spectralcontent of the recorded pressure pulse changed substantially,leaving only a single maximum between 4kHz and 6 kHz (Fig. 2H), a frequency that is close to the resonant frequency of theguinea pig bulla at approximately 4 kHz (Dallos,1973). This in-dicates a less efficient energy transfer to the cochlea than byimmersing the fiber in the perilymph or pointing it into the basalturn through the round window membrane. 3.2. Intra-collicular electrode position was verified by characteristicfrequencies and thresholds The electrodes used to record neuronal activity from the ICcovered a recording depth of 1.5 mm with 16 electrode contacts.Along the penetration tracks cBFs between 0.5 kHz and 32 kHzwere identified (Fig. 3 A). The majority of units (74%) had cBFs inthe range between 5.7kHz and 32 kHz (~2.5 octaves; Fig. 3 B,top). The median cBF values over all penetrations and animalsranged from 1.41 kHz at the most superficial electrode contact to19.03 kHz at the deepest contact. The average lowest neuronalthresholdss asaa function of cBF resembled the behavioral Fig. 3. Frequency sampling in the IC for all experiments. A, Typically, best frequencies (cBFs, abscissa) progressed from low to high frequencies along recording positions in the IC(ordinate). Dashed lines indicate frequency progressions over more than 5 subsequent contacts along a single shank of an electrode array for 20 animals (572 responsive recordingsites, for double shank penetrations the electrode track with the broadest frequency coverage is shown). Median frequencies at each electrode position are potted in red for all cases.B, The average thresholds (red line, grey area indicates standard deviation) are plotted over cBF for all cases shown in A (for repeated cBFs in a single recording track only the lowestthreshold was kept). The number of units per cBF is shown as histogram at the top of the graph. Of all units sampled 74% had cBFs above 5 kHz. (For interpretation of the referencesto color in this figure legend, the reader is referred to the Web version of this article.) audiogram described for the guinea pig (Heffner et al., 1971)reduced in sensitivity by approximately 10 dB (Fig. 3 B), compa-rable to the findings in the guinea pig IC in earlier studies (Sykaet al., 2000).Thus, the frequency range covered by recordings inthis study corresponds to the cochlear frequency map includingall optical stimulation sites accessible through a cochleostomyand extending well beyond the basal turn (Viberg and Canlon,2004). 3.3. IC recordings corresponded to pressure measurements The peak pressure recorded at the external meatus duringintracochlear laser stimulation increased linearly with the pulsepeak power of the laser output (Fig. 4 A). The resulting loga-rithmic growths of sound pressure levels with increasing pulsepeak power was similar to that measured along the beam path inhumid air and that recorded at the bony external meatus of amacerated skull during NIR laser irradiation in the bulla. Consequently the growth function of maximum spike rates in theIC with increasing pulse peak power closely resembled growthfunction of the sound pressure level (Fig. 4 B). By plotting thesame spike rate data as a function of the sound pressure levelrecorded at the external meatus, a linear growth of spike ratewith increasing peak sound pressure level becomes apparent(Fig. 4 C). It indicates that the observed spike rates in the IC arelinearly correlated with the optoacoustically generated soundpressure level, while the generated pressure is linearly correlatedto the pulse peak power of the optical stimulus. This points to apurely passive stimulation mechanism based on energy absorp-tion in the cochlea during NIR irradiation without direct activa-tion of auditory nerve fibers. Additional to an increase in spike rate correlated with an in-crease in pulse peak power, we also observed an expansion of the ICresponse to regions with higher cBF. This frequency expansion wasconsistent with a broadened frequency spectrum above the noisefloor at increased stimulus power (Fig.5A-C). In contrast to these A 1.9 aac0 70 60- 50- 白 40 30- 0 0.2 70 Fig. 4. Sound pressure level at the external meatus and response strength in the IC correlated with pulse peak power of the NIR laser pulse. A, The average peak sound pressure level(ordinate) recorded at the external meatus increased with increasing pulse peak power (abscissa, n=7,red circles, gray area represents standard deviation). The sound pressurelevel increased from 48 dB peSPL at 0.06 W to 63 dB peSPL at the laser output maximum at ~1W (thick dashed line marks the noise floor of the microphone). This sound levelincrease is comparable to that recorded perpendicular to the beam path in air (blue triangles) and at the bony meatus of a macerated skull during irradiation in the tympanic bulla(yellow squares).B, In five cases, where IC recordings were combined with pressure recordings at the external meatus, the maximum spike rates (independent of tonotopicrecording position) during intracochlear NIR stimulation were recorded (different cases indicatet by different symbols). The increase in spike rates correlated with increasing pulsepeak power in a similar manner as the peak sound pressure levels in A. C, The same data as in B plotted over peak sound pressure levels revealed a good correlation (r²=0.76 for alinear regression) between the sound pressure induced by intracochlear laser irradiation and maximum spike rates (pulse peak power axis adjusted to the sound pressure axisshown at top). (For interpretation of the references to color in this figure legend, the reader is referred to the Web version of this article.) findings, an increase in pulse energy by varying pulse duration, atconstant pulse peak power, led only to slight variations of the fre-quency spectrum of the pressure pulse and the IC response pattern,respectively (Fig. 5D-F). These differences can be attributed tovariations of the temporal structure of the pressure response due tochanging pulse durations. Despite these spectral differences, theevoked neuronal response typically lasted 5 ms, irrespective ofstimulus parameters. Within the inherent physical limitations,resulting from the interconnectedness of the stimulus parameterspulse peak power, pulse energy and pulse duration, the resultsdescribed above and shown in Figs. 4 and 5 suggest that theresponse strength in the IC depends on the sound level of theoptoacoustically generated pressure and thus is connected to pulsepeak power (Fig.4A). 3.4. Inferior colliculus units did not respond to intracochlear NIRstimulation in deafened animals We investigated the contribution of direct neural stimulation bylaser irradiation of primary cochlear structures (n=10 animals).For this goal we recorded the responses to intracochlear laserstimulation before and after deafening by an intra-scalar infusion of neomycin-sulfate-solution (2.5-5% in Ringer's solution). We testedoptical pulses with durations of either 5 ns at a wavelength of1850 nm (8 penetrations in 4 animals), or with 100 us duration (12penetrations in 6 animals) at a wavelength of 1860 nm both withpulse energies of 6 . While IC responses could reliably be evoked for both pulse typesin hearing animals, we did not observe any responses after acutepharmacological deafening (Fig. 6). However, the spiral ganglioncells remained responsive to electric stimulation at current levelstypical for acutely deafenedguinea pigs (237.14 uA±3.6 dB,compare Sato et al., 2016; Miller et al., 1993, 1995, 1998). Onaverage, the mean maximal instantaneous spike rate in response toelectric stimulation (0.84 spikes/ms), close to stimulation threshold(+1 dB), was approximately 80% higher than the mean maximumspike rate (0.47 spikes/ms, Fig. 6B) evoked by pulsed laser stimu-lation with a pulse peak power of 60 mW (100 us pulse duration).Additionally, the cBFs of units responding strongest to electricstimulation in the deaf ear were higher than (or in two cases equalto) those of units responding strongest to optical stimulation in thehearing ear, while the opposite was never observed (Fig. 6C). Thisindicates that generally, optical stimulation evokes responses atsites apical to the fiber location. Fig. 5. Excitation spreads with increasing pulse peak power and is irrespective of pulse energy. A-C, With increasing pulse peak power (A to C) neural activity spreads along thetontopic axis of the IC from low frequencies (ordinate, A) to higher frequencies (C, activity shown for 100 stimulus repetitions, red dots symbolize multi unit spikes). The spreadfollows the power spread of the respective spectrograms (gray shaded area centered on stimulus onset, frequencies matched to the cBFs of the IC recording). D-F, Increasing thepulse energy at stable pulse peak powers, by varying the pulse duration from 50 ps (D) to 200 us (F), did not result in changes in activity and spread along the IC tonotopic axis. Theslight variations in power along the frequency axis due to the different pulse durations have little effect on the spiking behavior (activity shown for 100 stimulus repetitions). (A-F:fiber diameter, wavelength, pulse duration, pulse energy, pulse peak power and radiant exposure values are noted below figures). (For interpretation of the references to color in thisfigure legend, the reader is referred to the Web version of this article.) Fig. 6. No IC responses can be optically evoked in deaf animals. A, In this typical raster plot example, multi unit activity (MUA, each point represents one spike) over time (abscissa)is plotted in relation to the length of the electrode array (ordinate, insertion depth relative to first contact), the stimulus onset is indicated by dashed lines. The most pronounced ICactivation occurs in the middle of the electrode array during optical stimulation (100 us pulse) of the normal hearing animal (left). After deafening no response above backgroundactivity can be evoked by optical stimulation (middle). An electric stimulation close to threshold level (threshold +1 dB) evokes a clearly discernible activation at the deepestelectrodes in the array (right,stimulus artifact blanked). B, This whisker-plot illustrates the maximum firing rates of IC units in response to intracochlear NIR-stimulation before andafter deafening and firing rates in response to electrical stimulation at 1 dB above the electric stimulation threshold. The data for ps and ns NIR-pulses were combined, as nosignificant difference between maximum firing rates and variance of these groups were observed (100 us, 6可 NIR pulses: 12 penetrations in 6 animals, blue; 5 ns, 6 可 pulses: 8penetrations in 4 animals,red). Firing rates in response to optical stimulation dropped to the spontaneous level after pharmacological deafening, while an intracochlear electricstimulation at the position of the optical fiber tip resulted in a robust activation of IC neurons. The firing rates evoked by electric stimulation at 1 dB above threshold weresignificantly higher than the responses to NIR stimulation. (*** p<0.00033; pairwise students t-test, two tailed, corrected for multiple comparisons) C, Maximum spike rates duringelectric stimulation typically occur at electrode positions with higher cBF (ordinate) than during optical stimulation (abscissa, same data as in B, only highest instantaneous spikerates per penetration and animal are shown, 100 ps pulses: blue;5 ns pulses: red). Electric stimulation in deaf animals (compare B) evoked maximum spike rates at deeperelectrodes in the IC with significantly higher cBF than optical stimulation. (*** p<0.001; pairwise students t-test, two tailed). (For interpretation of the references to color in thisfigure legend, the reader is referred to the Web version of this article.) 3.5. Response patterns in the IC are similar for various opticalstimulation parameters Additionally we stimulated sequentially using the nanosecondlaser system at 6可 pulse energy and ranging from visible light(434nm) to upper NIR range (1961 nm) and the microsecond lasersystem at a fixed NIR wavelength (1860 nm) and with various pulsedurations ranging from 10 us to maximally 20 ms(n=6).All stimuliled to an activation of IC neurons in similar cBF ranges and withsimilar latencies and response durations. The response strengthshowed slight variations depending on the stimulation parameters.Overall, we found similarities across activation patterns fordifferent laser-stimuli in all recordings (Fig. 7A-C). Units with lowacoustic response thresholds did respond well to optical stimuli atNIR wavelength in both the microsecond and nanosecond rangeand visible light in the nanosecond range. Units with responsethresholds between 30 and 40 dB SPLrms responded best whentheir cBFs were below 10 kHz. Another common feature of the re-sponses was less excitation of low cBF (<5kHz) units by nanosecond pulses than by microsecond pulses (compare Fig. 7 Aand C). However, electric stimulation (Fig. 7E and F) revealedapparent differences in the activation patterns compared to bothacoustic clicks (Fig.7 D) and optical stimulation (Fig.7A-C): strongactivation for units with cBFs above 10 kHz, independent of theacoustic stimulation threshold. At higher electric stimulation levels,the activity did spread to units with lower cBFs (threshold +3 dB,Fig. 7 F). Overall the IC activation by intracochlear NIR stimulationresembled evoked acoustic click responses besides less activationabove 10 kHz. This again points to an optoacoustic origin of theresponses. 3.6. Pressure spectra and IC response distribution indicated a globalcochlear activation by optical stimulation Finally, we pooled the responses of all 496 acoustically charac-terized IC units to intracochlear 100 us NIR stimulations at variouspulse peak powers (n=2096) from all animals with this type ofstimulation and recording (n=17) to provide a global response- 2 ●0.5 t3·0.25 Fig. 7. Group responses in the IC evoked by optical stimulation are similar to click-evoked responses, but distinct from electrically evoked responses. All IC units studied werecharacterized by their best frequencies (x-axes) and response thresholds to pure tone stimulation at cBF (y-axes) to pure tone stimulation and plotted into a gross IC response map.Given are the response-strengths (spike rate, circle area) to optical stimuli, acoustic clicks and electric pulses, respectively. A, The spike rates in the IC were highest in units withthresholds of ≤30 dB SPLrms during stimulation with ns-pulses of visible light. B, NIR stimulation with ns-pulses resulted in a stronger activation but with overall responsecharacteristics similar to A. C, During stimulation with us-pulses, IC units with thresholds ≤50 dB SPLrms had high spike rates with a somewhat less pronounced flank at high cBFunits, than in A and B. D, Stimulation with acoustic clicks at 10 dB above the absolute response threshold, resulted in a homogeneous activation of IC units. E and F, in contrast to A-D, an electric stimulation in the cochleae of deafened animals activates units that had threshold levels of up to 70 dB SPLrms during pure tone stimulation in hearing condition, butmostly at frequencies above 10 kHz. These responses were even stronger at high cBF further from threshold (threshold +3 dB, F). The numbers at the top of each plot indicate thenumber of units and animals, respectively. overview. In direct comparison, the cumulated IC responses of allrecordings were significantly correlated (Spearman correlation ofmean spike rate and mean signal power at the external meatus atthe same frequency as unit cBF, two tailed,r=0.8325, p<0.0001)with the average power spectrum of the pressure recordings at theexternal ear (Fig.8 A, top). Overall ~56% of the IC units with cBFsbelow 10kHz (n=318) were responsive to intracochlear NIRstimulation, a frequency range where the NIR-evoked sound hadthe highest spectral power (Fig. 8 A, bottom). In this range spikerates up to 1 sp/ms were measured. While some IC units with cBFsbeyond 10 kHz had relatively low acoustic response thresholds(compare thresholds in Fig.3 B), the maximum spike rates did notexceed 0.7 sp/ms and only ~25% of these units (n=178) wereresponsive to intracochlear NIR stimulation. In the pressure powerspectrum a side maximum was commonly found in this range (seeFig. 2C and D). Only a fraction of ~6% of units with cBFs above20 kHz (n=47) responded to intracochlear NIR stimuli. The spec-tral power of the NIR-evoked sound in this frequency range wasclose to the background noise level. We projected the IC response strengths onto their putative placeof origin according to their cBF and the frequency-place map of theguinea pig (Viberg and Canlon, 2004; Greenwood, 1990) in ageneric 3 dimensional model of a left guinea pig cochlea (computedfrom uCT data of a macerated skull specimen, Fig. 8 B). This pro-jection revealed that the majority of responding units (85%) and theresponses to various optical stimuli (72% of spike rates above spontaneous rates; n = 1562 stimulations), especially the strongestones (94% of responses exceeding 0.3 sp/ms; n=204 stim-ululations), originated outside of the reach of the optical fiber andthe respective direct NIR beam path (lateral half of the basal turn;~33% of the overall cochlear length; CF>12 kHz). Responses couldbe observed in units with cBFs below 1 kHz, far apical from thestimulation site. In contrast, over 50% of IC units activated byelectric stimulation close to threshold (n=147) had cBFs corre-sponding to locations in the basal turn of the cochlea (Fig. 8 C). Thespike rates evoked by NIR-stimulation neither correlated signifi-cantly with spike rates evoked by electric stimulation at 1 dB abovestimulationthreshold(Spearman correlation, two tailed.r= -0.2636, p<0.2482) nor at 10 dB above threshold (Spearmancorrelation, two tailed, r=-0.1429, p<0.5367). These resultsfurther support a global cochlear activation by optical stimulation,likely by optoacoustics, rather than a spatially restricted directactivation of neural elements or hair cells along the beam path. 4. Discussion The present study defines the acoustic features of pressurepulses induced by laser irradiation in the hearing guinea pig co-chlea. The neural response characteristics recorded from theauditory midbrain are corroborated by the pressure levels andspectral characteristics measured at the external ear. Sound pres-sure levels at the external ear reached up to 70 dB peSPL. Pressure frequency / BF [kHz] B optoacoustic stimulation C electric stimulation lateral view Fig. 8. External pressure measurements and IC response patterns revealed a broad intracochlear activation by laser stimulation.A. In the average power spectrum of 7 pressuremeasurements at the external meatus (black trace at the top, gray error bars are standard deviation), the power drop-offat frequencies above 10 kHz is the most prominent feature(compare Fig.2). No spectral fine structure is preserved below 10 kHz, partly due to differences between preparations, however, between 10 and 16 kHz and between 24 and 30 kHztwo local power maxima are discernible. The response strengths at cBFs between 0.5 and 32 kHz in the IC (spike rate proportional to the area of the red circles) for 2096 recordingsduring intracochlear NIR stimulation (1860 nm, 100 us) at various pulse peak powers (~0.006W -1 W) in 17 animals (bottom plot) correspond to the spectral power of the soundgenerated by the laser stimulus. All units identified in the IC (regardless of threshold level, response pattern or response strength) are combined in the plot. The proportion of unitsat each cBF that did respond to optical stimulation is overlayed as histogram (gray bars, response> 5% of the pure tone maximum). Units with lower cBFs had a higher probability ofresponding. B, A projection of the IC responses (red circles) according to their cBF onto a reconstruction of the guinea pig cochlea (uCT) reveals strong responses throughout thecochlea even though the fiber (shown schematically at one putative position) reached only the basal half turn of the cochlea (frequency position reconstruction according toGreenwood-function parameterized as follows:F=0.5*(102.1*(x/20.58)-1) (Viberg and Canlon, 2004), scale refers to B and C). C Compared to optoacoustic stimuli, electricstimulation at the fiber tip at 1 dB above threshold (n=147 in 6 animals) mostly lead to a midbrain activation corresponding to the basal cochlear turn (yellow circles). (Forinterpretation of the references to color in this figure legend, the reader is referred to the Web version of this article.) measurements and the dominant neural activation at cBFs between1 and 10 kHz indicate an excitation of cochlear regions apical to thestimulation site, not directly accessible by NIR irradiation. Concor-dantly, no neuronal responses could be evoked by optical stimu-lation in deafened animals, while electric stimulation of thedeafened ear was possible and predominantly resulted in an acti-vation of units with higher cBFs at threshold, indicating the fiberposition. These findings demonstrate the absence of any note-worthy direct neural stimulation. Overall our results reveal anoptoacoustic origin of the cochlear excitation in hearing conditions.Theoptoacoustic stimulation may be suitable and loud enough foran application in implantable hearing aids and hybrid electro-optoacoustic devices to drive residually hearing portions of thecochlea (for details see below). 4.1. Relation between intracochlear stimulation sites and ICrecordings The cochleostomic access enabled an optical stimulation of thecochlea in the lateral half of the basal turn of the guinea pig cochlea.Thus, according to the Greenwood function of the guinea pig,cochleotopic positions between approximately 8 kHz and 40 kHzcould be directly accessed with an optical fiber (Viberg and Canlon,2004; Greenwood, 1990). The fiber was located in the basal-most cochlear halfturn. We therefore assume that cochleotopic posi-tions below 8 kHz remained inaccessible to the light beam. The cBFsof all units identified in the IC ranged from approximately0.6kHz-32 kHz.This represents a typical range for recordings fromthe IC in guinea pigs (Sato et al., 2016; Richter et al., 2011b; Snyderet al., 2008). The tonotopic range of identified cBFs for unitsresponding to optical stimulation extended from the basal turn tothe 3rd turn of the guinea pig cochlea (Viberg and Canlon, 2004).This is beyond all putative optical stimulation sites that could beaccessed by an optical fiber insertion through a cochleostomy at thecochlear base. This indicates that the response to pulsed laser lightis predominantly optoacoustic. 4.2. Effect of deafening Acute deafening by intra-scalar infusion of neomycin sulfatesolution (2.5-5%) abolished all responses to acoustic stimulation,within minutes after infusion (compare Snyder et al, 2004;Middlebrooks and Bierer, 2002; Miller, 2001; Leake-Jones et al.,1982). In the current study, neomycin infusion was performed atthe end of the experiments, with approximately 2 h of recordingsafter deafening, sufficient for data collection but too brief forallowing functional effects of neomycin on SGNs (Leake-Jones et al.,1982). Supporting this, electric stimulation at current levels that were in a typical range for acutely pharmacologically deafenedguinea pigs (Sato et al., 2016; Snyder et al., 2004, 2008; Miller et al.,1993, 1998) resulted in the expected responses and confirmed thegood function of the auditory nerve. While IC responses to intracochlear NIR stimulation could reli-ably be evoked prior to deafening, we did not find spike ratesexceeding spontaneous activity after deafening. The electric stim-ulation current was delivered through an electrode at the tip of theoptical fiber.The activation of high cBF units in the IC in response toelectric stimulation close to threshold level can be attributed to thecorresponding frequency of the intracochlear location of the fiber(Sato et al., 2016; Snyder et al., 2008). In contrast, the stimulation ofthe hearing cochlea by NIR laser pulses was not spatially restrictedto the position of the fiber tip. It has been suggested that the laserbeam might stimulate SGNs in neighboring cochlear turns apical tothe intracochlear fiber position along the beam path (Moreno et al.,2011). But even taking these considerations into account, we didnot find any indication for an excitation exclusively along the beampath from the estimated fiber position. Taken together with theacoustic properties of the NIR-evoked sound and the cBFs of unitssensitive to NIR-stimulation, these results demonstrate an opto-acoustic origin of the responses during intracochlear laser stimu-lation in absence of any significant signs of direct stimulation ofSGNs or auditory. This is consistent with only minimal signs ofdepolarization, well below spiking threshold, in isolated SGCin vitro during pulsed laser stimulation (Rettenmaier et al., 2014).We therefore assume that direct neural stimulation is no con-founding factor during optoacoustic stimulation through thetechnique presented here. 4.3. IC responses to intracochlear laser stimulation The activation patterns in the IC during intracochlear opticalstimulation are similar regardless of wavelength and pulse durationof the optical stimulus. This could be observed in the spatio-temporal activation patterns of individual recordings and theoverall IC response pattern. The patterns were distinct from thoseduring monopolar, single-pulse electric stimulation, but similar tothose during acoustic click stimulation, yet with less activationabove 10 kHz. We observed only minor differences in responsepatterns for visual wavelength stimulation and NIR stimulationdespite large differences in penetration depth in aqueous envi-ronments (Palmer and Williams, 1974; Hale and Querry, 1973) andan energy absorption in different tissues (Schultz et al., 2012).Theobservation that pulse peak power rather than pulse energy canexplain the observed response strengths,further corroborates theoptoacoustic origin of the pressure wave in the lymphatic fluids ofthe inner ear, in accordance with earlier studies (Kallweit et al.,2016; Schultz et al., 2014). The lack of spatial selectivity of theoptic stimulation also speaks against a direct displacement of thebasilar membrane by the laser pulse, a possible stimulationmechanism that had been discussed earlier (Schultz et al., 2012).Furthermore, different fiber positions also resulted in only minorchanges of the IC response pattern in hearing animals. This findingpoints to a universal stimulation mechanism that is independent ofthe place of absorption. One such mechanism could e.g. be aresonance phenomenon within the temporal bone and the bulladriven by vibrations due to the fast energy deposition into thecochlear fluid volume. 4.4. Characteristics of the sound recorded at the external meatus The sound spectra recorded at the external meatus during op-tical stimulation differed between preparations. Yet for any givenpreparation they remained unchanged for different intracochlear fiber positions and even for a laser irradiation of the basal cochlearturn through the closed round window membrane. The reversetransfer function of the guinea pig middle ear is relatively flat up to10 kHz (Magnan et al., 1997).Therefore the sound spectrum below10 kHz mirrors the intracochlear pressure spectrum well, butattenuated by approximately 30 dB. Beyond 10 kHz a certain risk ofmisestimating the intracochlear pressure is given (Magnan et al.,1999) and the recorded values have to be carefully interpreted. If the fiber position in the tympanic bulla was pointed towardsthe outer bony wall of the cochlea, the spectrum exhibited only asingle maximum at 5.6kHz (Fig. 6 H) which is close to the reso-nance frequency of the guinea pig bulla (Dallos, 1973). This suggestsa stimulation mechanism based on resonance of the space in thebulla. That could be influenced by the exact position of the coch-leostomy, interindividiual differences in cochlear anatomy andprobably also the size and position of the bulla opening, thusexplaining the differences between different preparations. Overallthe data indicate a higher efficiency of optoacoustic stimulationwhen the optical energy is delivered directly into the cochleacompared to the tympanic bulla. The growth function of the soundlevel recorded for different optical stimulation parameters againpoints to pulse peak power as the determining factor. The maxi-mally determined extracochlear sound pressure level for single 100us pulses was 70 dB peSPL (at 1 W pulse peak power), which in-dicates intracochlear pressure levels of 100 dB SPL or moreconsidering the reverse middle ear transfer function of the guineapig (Magnan et al., 1997, 1999). Xia et al. (2016) recorded thepressure directly within guinea pig cochleae in cadaveric as well asin two in vivo preparations.They reported an intracochlear pressureof approximately 100 dB SPL during NIR stimulation at parameterssimilar to those reported here. A pulse with 100 us duration and apeak power of 1 W corresponds to a pulse energy of 100 and aradiant exposure of 320 mJ/cm’ for a fiber diameter of 200 umabout half of the damage threshold for single pulses reportedelsewhere (Wells et al., 2007b) for a wavelength 2120 nm. Whilethe safety for pulse trains will have to be evaluated in future, thisindicates that the pulses used in this study are sufficiently strongand save for use in “optoacoustic hearing aids". 4.5. Comparison between external meatus sound recordings and ICresponses The comparison between the sound pressure recordings andthe IC responses reveals a good agreement between both mea-sures. The increase in spike rate observed in the IC for pulses ofincreasing pulse peak power can be explained by the increase insound pressure level, as recorded at the external meatus. Thespike rates of units in the IC also correlated significantly with thespectral power at frequencies corresponding to their respectivecBFs for sound recordings at the external meatus. Even takinginto account uncertainties about the intracochlear pressureabove 10kHz in the reverse middle ear transfer function(Magnan et al., 1997, 1999), the responses in the IC below thisfrequency can reliably be explained by an NIR induced opto-acoustic pressure in the cochlea. There are apparent differencesto the power spectrum acquired from intracochlear pressuremeasurements during intracochlear NIR in the guinea pig by Xiaet al. (2016).The spectrum reported there had a prominent singlepeak above 20 kHz. In contrast, pressure recordings in theexternal meatus (Xia et al., 2016) resulted in a similar powerspectrum as reported in the present study with a pressure in-crease below 10 kHz and a side peak at ~15 kHz. This shows thelow-pass filter characteristic of the middle ear with the ossicularchain during reverse transmission. Therefore it needs to beconsidered that our method is not sensitive enough to reliably capture spectral components of the NIR induced sound beyond20 kHz. However, the neural responses recorded in the ICmirrored the increased spectral power below 10kHz, while onlyfew responses were recorded from units with cBFs above 20 kHz.In any case the presence of an acoustical high frequencycomponent would not serve as a confound to optoacousticstimulation of cochleae with residual function only in low fre-quencies. While this difference between intracochlear pressuremeasurements and measurements in or at the external meatuswould warrant further investigations, we can exclude a con-founding direct neural stimulation of the basal, high frequencyregion of the cochlea because the optoacoustically evoked re-sponses did not correlate with those evoked by electric stimu-lation in the basal turn. The IC response strength depends on pulse peak power ratherthan on pulse duration and with that pulse energy, corroboratingthe findings of Kallweit et al. (2016) who showed that the laserinduced pressure depends on the 1st derivative of the opticalpower. This means that sufficiently high sound pressures forintracochlear optoacoustic stimulation couldtpotentially bereached through modulating the pulse peak power of shortpulses, thus keeping the pulse energy low. This could facilitatethe heat dissipation between the pulses in order to avoid intra-cochlear heating for a stimulation with pulse trains (Thompsonet al., 2012). With sufficiently high repetition rates it could bepossible to transfer envelope information of an acoustic signal. Afirst simulation of such an envelope transfer by optoacousticstimulation was successfully tested in EAS users (Kruger et al.,2017). Despite such promising first results, the applicability andsafety of optoacoustic stimulation for EAS needs careful investi-gation. Considering the repetition rates necessary for an opto-acoustic transfer of envelope information, the lowered damagethreshold compared to single pulses needs to be considered(Wells et al., 2007b). Also heat accumulation and dissipation hasto be investigated. It has been suggested that heat dissipation isfast enough to avoid a decrease of neural responses over time forrepetitions rates lower than 250 Hz and radiant energies below 30可/pulse and no structural damage was observed in the guinea pigcochlear after a long term exposure with 127 可/pulse at repetitionrates of 250 Hz (Goyal et al., 2012), a value slightly above themaximum of 100 可/pulse used in the current study. Whether ornot this is safe for application in human users needs to be thefocus of future investigations. In the present study we could showthat stimulation through the intact RWM could be feasible.Leaving the optical stimulation device out of the lymphatic spaceof the cochlea might help to stay within temperature safety limitsfor pulsee trains fast enoughhtocarryyacoustic envelopeinformation. 5. Conclusions In this study we provide evidence for the feasibility of opto-acoustic intracochlear stimulation. With the parameters testedhere we saw a considerable activation of frequency regions apical tothe stimulation site. We further could show that a direct stimula-tion of primary auditory structures by NIR pulses can be excluded asconfounding stimulation mode in such an approach. The opticalenergy could be delivered through a single channel and be modu-lated to transmit envelope information to functioning apical re-gions of the cochlea. This appears to be possible for a stimulationthrough the closed round window membrane. Further study isneeded to determine, whether this approach of an“optical actu-ator"could potentially be combined with a conventional CI forelectric stimulation to provide combined EAS stimulation from a single device in the future. Funding Supported by Cluster of Excellence Hearing4All (DFG-EXC 1077),EU ACTION (FP7 ICT project 611230) and MedEl Company, Inns-bruck, Austria. Appendix A. Supplementary data Supplementary data to this article can be found online athttps://doi.org/10.1016/j.heares.2018.11.003. References Dallos, 1973. The Auditory Periphery: Biophysics and Physiology. Academic Press,New York. Duke, Cayce, Malphrus, Konrad, Mahavaden-Jansen, Jansen, 2009. Combined Op-6tical and Electrical Stimulation of Neural Tissue in Vivo, vol. 14, pp. 25-27 (6). Goyal, Rajguru, Matic, Izzo, Stock, Richter, 2012. Acute damage threshold forinfrared neural stimulation of the cochlea: functional and histological evalua-tion. Anat. Rec. 295(11),1987-1999. Greenwood, 1990. A cochlear frequency-position function for several species-29years later. J. Acoust. Soc. Am. 87 (6), 2592-2605. Guan, Wang, Yang, Zhu, Wang, Nie, 2016. Near-infrared laser stimulation of theauditory nerve in Guinea pigs.J. Opt. Soc. Korea 20 (2), 269-275. Hale, Querry, 1973. Optical constants of water in the 200-nm to 200-umwavelengthregion. Appl. Optic. 12 (3), 555. Heffner, Heffner, Masterton, 1971. Behavioral measurements of absolute andfrequency-difference thresholds in Guinea pig. J. Acoust. Soc. Am. 49 ((6).1888-1895. Kallweit, Baumhoff, Kruger, Tinne, Kral, Ripken, et al., 2016.Optoacoustic effect isresponsible for laser-induced cochlear responses. Sci. Rep. 6 (5092), 28141. Konerding, W.S., Froriep, U.P., Kral, A., Baumhoff, P., 2018.New Thin-Film SurfaceElectrode Array Enables Brain Mapping with High Spatial Acuity in Rodents. Sci.Rep. 8(1), 3825. Kriger, Fiedler, Baumhoff, Shah, Kral, Biichner, et al., 2017. Model based laserstimulation for speech coding in Cochlear Implant users with low frequencyresidual hearing. In: CIAP. Lake Tahoe. Leake-Jones, Vivion, O'Reilly, Merzenich, 1982. Deaf animal models for studies of amultichannel cochlear prosthesis. Hear. Res. 8 (2), 225-246. Magnan, Avan, Dancer, Smurzynski, Probst, 1997. Reverse middle-ear transferfunction in the Guinea pig measured with cubic difference tones. Hear. Res. 107(1-2), 41-45. Magnan, Dancer, Probst, Smurzynski, Avan, 1999. Intracochlear acoustic pressuremeasurements: transfer functions of the middle ear and cochlear mechanics.Audiol.Neuro. Otol. 4 (3-4), 123-128. Middlebrooks, Bierer, 2002. Auditory cortical images of cochlear-implant stimuli:coding of stimulus channel and current level. J. Neurophysiol. 87 (1), 493-507. Miller, 2001. Effects of chronic stimulation on auditory nerve survival in ototoxicallydeafened animals. Hear. Res. 151 (1-2),1-14. Miller, Abbas,Robinson, 1993. Characterization of wave I of the electrically evokedauditory brainstem response in the Guinea pig. Hear. Res. 69 (1-2), 35-44. Miller, Abbas, Rubinstein, Robinson, Matsuoka, Woodworth, 1998. Electricallyevoked compound action potentials of Guinea pig and cat: responses tomonopolar, monophasic stimulation. Hear. Res. 119 (1-2), 142-154. Miller, Woodruff, Pfingst, 1995. Functional responses from Guinea pigs withcochlear implants. I.Electrophysiological and psychophysical measures. Hear.Res. 92 (1-2), 85-99. Moreno, Rajguru, Matic, Izzo, Yerram, Robinson, Hwang,et al., 2011. Infrared neuralstimulation: beam path in the Guinea pig cochlea. Hear. Res. 282 (1-2),289-302. Palmer, Williams, 1974. Optical properties of water in the near infrared*. j.Opt. Soc.Am. 64 (8), 1107. Rajguru, Matic, Izzo, Robinson, Fishman, Moreno, Bradley, et al., 2010. Opticalcochlear implants: evaluation of surgical approach and laser parameters in cats.Hear. Res. 269(1-2),102-111. Rettenmaier, Lenarz, Reuter, 2014. Nanosecond laser pulse stimulation of spiralganglion neurons and model cells. Biomed. Opt. Express 5 (4), 1014. Richardson, Thompson, Wise, Needham, 2017. Challenges for the application ofoptical stimulation in the cochlea for the study and treatment of hearing loss.Expet Opin. Biol. Ther.17 (2), 213-223. Richter, Matic, Izzo, Wells, Jansen, Walsh, 2011a. Neural stimulation with opticalradiation. Laser Photon. Rev. 5 (1), 68-80. Richter, Rajguru,Matic, Izzo, Moreno, Fishman, Robinson, et al., 2011b. Spread ofcochlear excitation during stimulation with pulsed infrared radiation: inferiorcolliculus measurements. J. Neural. Eng. 8 (5), 056006. Sato, Baumhoff, Kral, 2016. Cochlear implant stimulation of a hearing ear generatesseparate electrophonic and electroneural responses. J.Neurosci.: Off. J. Soc.Neurosci. 36 (1), 54-64. Schultz, Baumhoff,Kallweit, Sato, Kruger, Ripken, et al., 2014. Optical stimulation ofthe hearing and deaf cochlea under thermal and stress confinement condition.SPIE BioS 8928, 1-7. Schultz, Baumhoff,Maier, Teudt, Kruger, Lenarz, Kral, 2012. Nanosecond laser pulsestimulation of the inner ear-a wavelength study. Biomed. Opt. Express 3 (12),3332-3345. Snyder, Bierer, Middlebrooks, 2004. Topographic spread of inferior colliculus acti-vation in response to acoustic and intracochlear electric stimulation. J.Assoc.Res. Otolaryngol.: JARO 5 (3), 305-322. Snyder, Middlebrooks, Bonham, 2008. Cochlear implant electrode configurationeffects on activation threshold and tonotopic selectivity. Hear. Res. 235 (1-2),23-38. Syka, Popelar, Kvasnak, Astl, 2000.Response properties of neurons in the centralnucleus and external and dorsal cortices of the inferior colliculus in Guinea pig.Exp. Brain Res. Experimentelle Hirnforschung. Experimentation cerebrale 133(2),254-266. Tan, Rajguru, Young, Xia, Stock, Xiao, Richter, 2015. Radiant energy required forinfrared neural stimulation. Sci. Rep. 5 (1),13273. Teudt, Maier, Richter, Kral, 2011. Acoustic events and “optophonic”cochlear re-sponses induced by pulsed near-infrared laser. IEEE Trans. Biomed. Eng. 58(6),1648-1655. Thompson, Fallon, Wise, Wade, Shepherd, Stoddart, 2015. Infrared neural stimulation fails to evoke neural activity in the deaf Guinea pig cochlea.Hear.Res. 324,46-53. Thompson, Wade, Brown, Stoddart, 2012. Modeling of light absorption in tissueduring infrared neural stimulation. J. Biomed.Optic. 17 (7),075002. Tian, Wang, Wei, Lu, Xu, Xia, 2017. Short-wavelength infrared laser activates theauditory neurons: comparing the effect of 980 vs. 810 nm wavelength. LaserMed. Sci. 32 (2), 357-362. Tozburun, Lagoda, Burnett, Fried, 2012. Subsurface near-infrared laser stimulationof the periprostatic cavernous nerves. J. Biophot. 5 (10), 793-800. Verma, Guex, Hancock, Durakovic, McKay, Slama, et al., 2014. Auditory responses toelectric and infrared neural stimulation of the rat cochlear nucleus. Hear. Res.310,69-75. February. Viberg, Canlon, 2004. The guide to plotting a cochleogram. Hear. Res. 197 (1-2),1-10. Wells, Kao, Konrad, Milner, Kim, Mahavaden-Jansen, Jansen, 2007a. Biophysicalmechanisms of transient optical stimulation of peripheral nerve. Biophys. J. 93(7),2567-2580. Wells, Thomsen, Whitaker, Jansen, Kao, Konrad, Mahavaden-Jansen, 2007b. Opti-cally mediated nerve stimulation: identification of injury thresholds. Laser Surg.Med. 39 (6), 513-526. Xia, Tan, Xu, Hou, Mao, Richter, 2016. Pressure in the cochlea during infraredirradiation. IEEE (Inst. Electr. Electron. Eng.) Trans. Biomed. Eng. 9294(c), 1-1. Intracochlear optical stimulation has been suggested as an alternative approach to hearing prosthetics in recent years. This study investigated the properties of a near infrared laser (NIR) induced optoacoustic effect. Pressure recordings were performed at the external meatus of anaesthetized guinea pigs during intracochlear NIR stimulation. The sound pressure and power spectra were determined. The results were compared to multi unit responses in the inferior colliculus (IC). Additionally, the responses to NIR stimulation were compared to IC responses induced by intracochlear electric stimulation at the samecochlear position to investigate a potentially confounding contribution of direct neural NIR stimulation.The power spectra of the sound recorded at the external meatus (n ¼ 7) had most power at frequencies below 10 kHz and showed little variation for different stimulation sites. The mean spike rates of IC units responding to intracochlear NIR stimulation (n ¼ 222) of 17 animals were significantly correlated with the power of the externally recorded signal at frequencies corresponding to the best frequencies of the IC units. The response strength as well as the sound pressure at the external meatus depended on the pulse peak power of the optical stimulus. The sound pressure recorded at the external meatus reached levelsabove 70 dB SPL peak equivalent. In hearing animals a cochlear activation apical to the location of the fiber was found. The absence of any NIR responses after pharmacologically deafening and the comparison to electric stimulation at the NIR stimulation site revealed no indication of a confounding direct neural NIR stimulation. Intracochlear optoacoustic stimulation might become useful in combined electro-acoustic stimulation devices in the future.
确定


还剩11页未读,是否继续阅读?

产品配置单
北京欧兰科技发展有限公司为您提供《内耳蜗中原位声光模拟检测方案(激光产品)》,该方案主要用于其他中原位声光模拟检测,参考标准--,《内耳蜗中原位声光模拟检测方案(激光产品)》用到的仪器有Ekspla NT340 高能量可调谐激光器(OPO)
推荐专场


相关方案
更多
该厂商其他方案
更多