


方案详情
文
在海冰形成的过程中将光学微氧传感器(Micro-optodes)冻结在冰中,直接测量其中的氧动力状态。
Oxygen micro-optodes were used to measure oxygen dynamics directly within the microstructure of sea ice by freezing the sensors into the ice during its formation.The experiment was conducted in a 4 m3 mesocosm filled with artificial seawater and inoculated with a unialgal culture of the common Antarctic ice diatom Fragilariopsis cylindrus (Bacillariophyceae) to a final chlorophyll a (chl a) concentration of 11 μg l–1. Ice growth was initiated 7 d after inoculation by reducing the air temperature to –10 ± 2°C and terminated 17 d later. The final ice thickness was 27 cm. One optode was frozen into grease ice and 2 others into the skeletal layer of the growing ice sheet. Increasing oxygen concentrations during ice crystal formation at the water surface and the ice-water interface revealed a strong inclusion of oxygen, which was either physically trapped and/or the result of photosynthesising diatoms. The major portion of oxygen was present as gas bubbles due to supersaturation as a result of increasing salinity and oxygen production by diatoms. An increase in salinity due to a concurrent decrease in ice temperatures during subsequent sea ice development reduced the maximum concentration of dissolved oxygen within brine. Thus, dissolved oxygen concentrations decreased over time, whereas gaseous oxygen was released to the atmosphere and seawater. The sensors are a significant advance on more conventional microelectrodes, because the recordings can be temperature and salinity compensated in order to obtain precise measurements of oxygen dynamics with regard to total (dissolved and gaseous) and dissolved oxygen in sea ice. Optodes do not consume oxygen during measurement over a long period under extreme conditions, which is another advantage for long-term deployment in the field.
方案详情

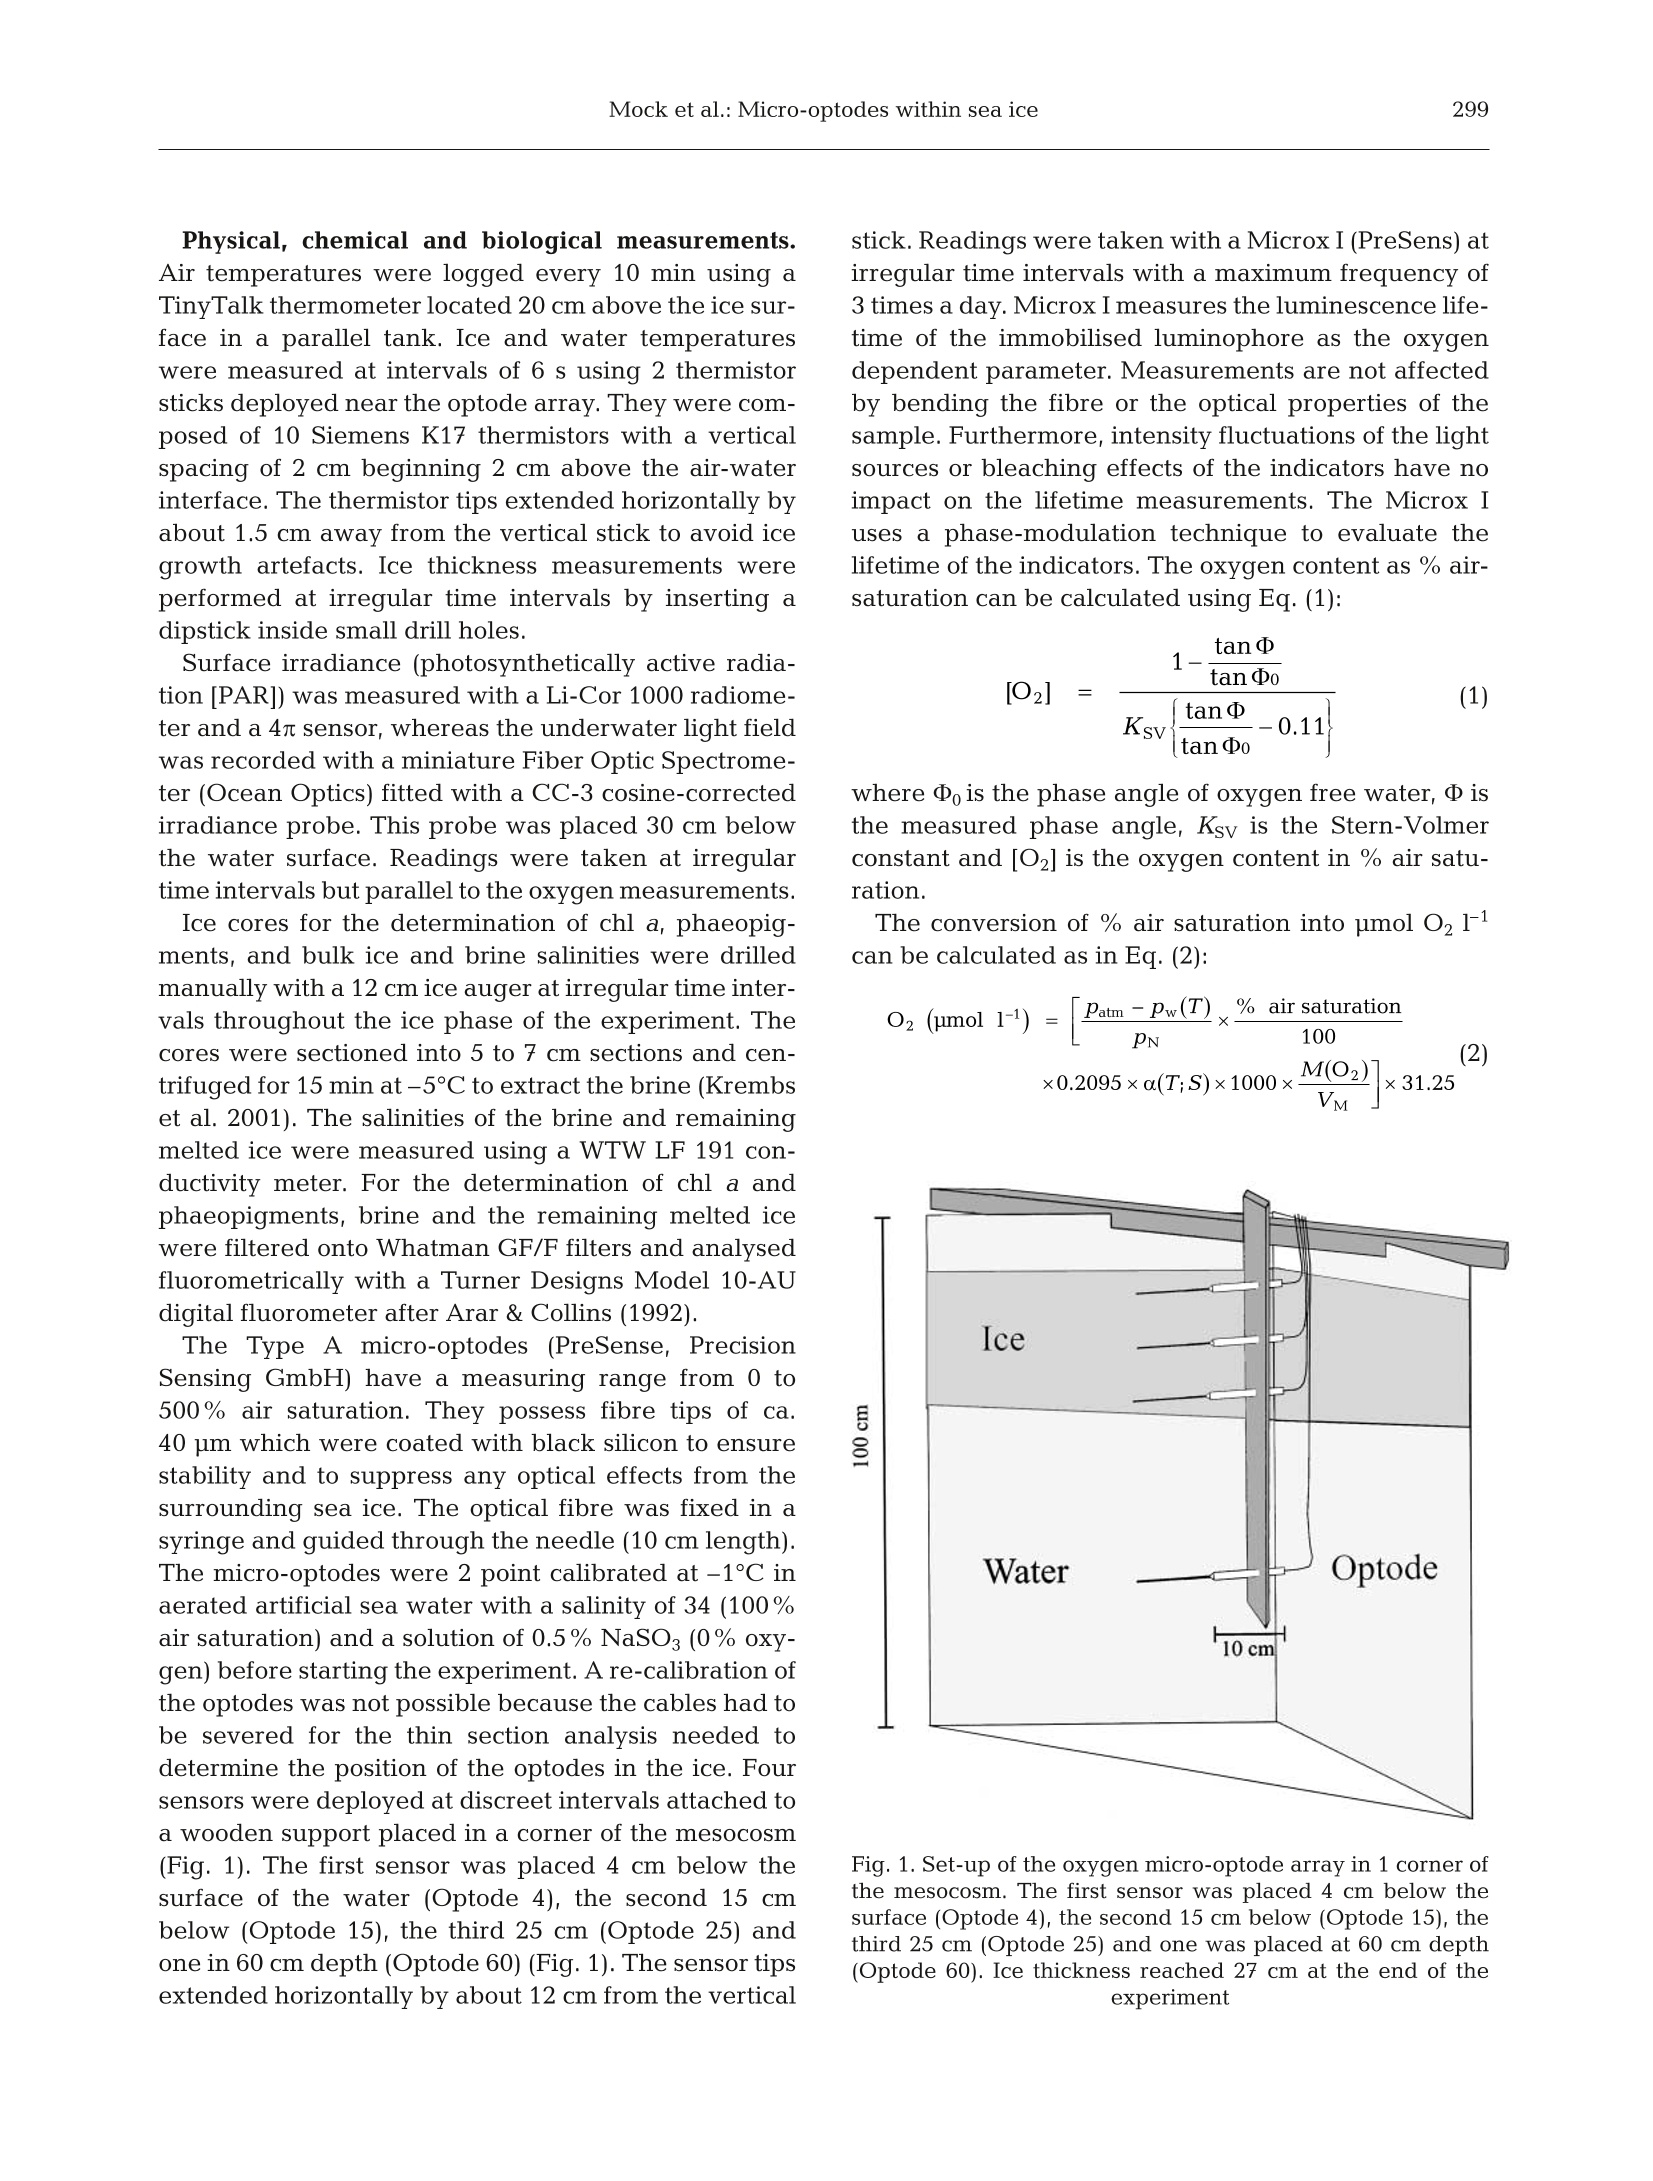
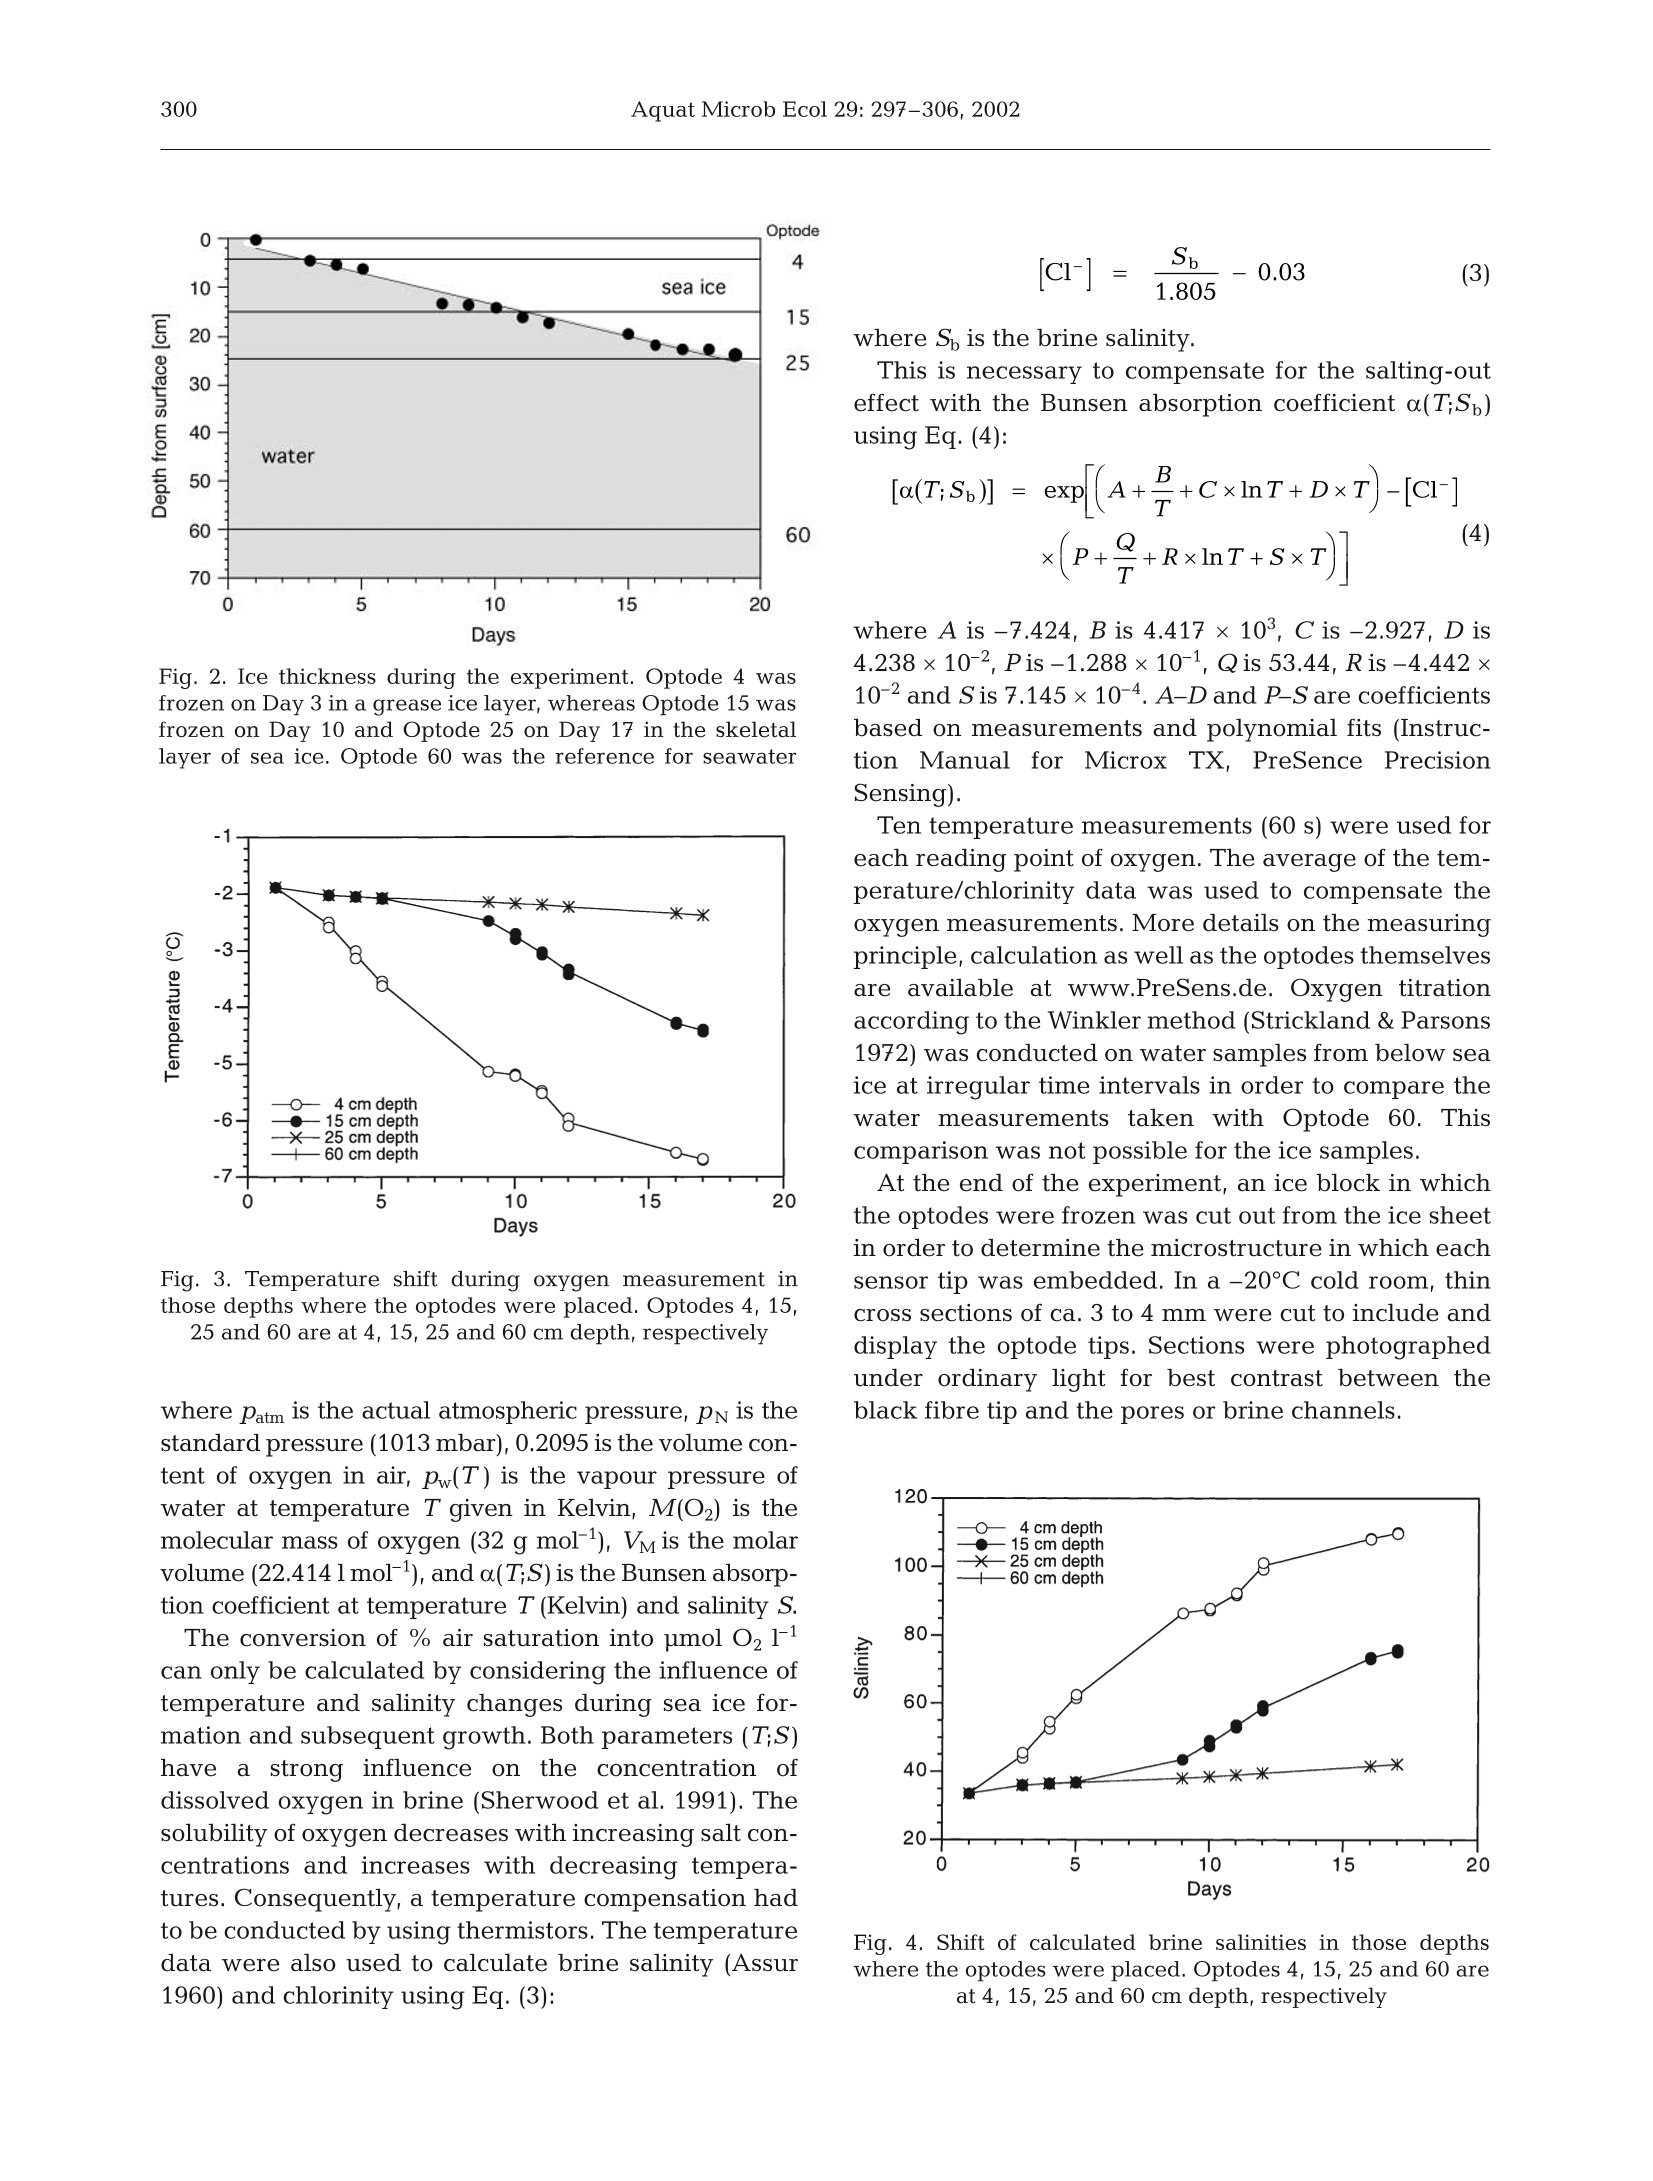
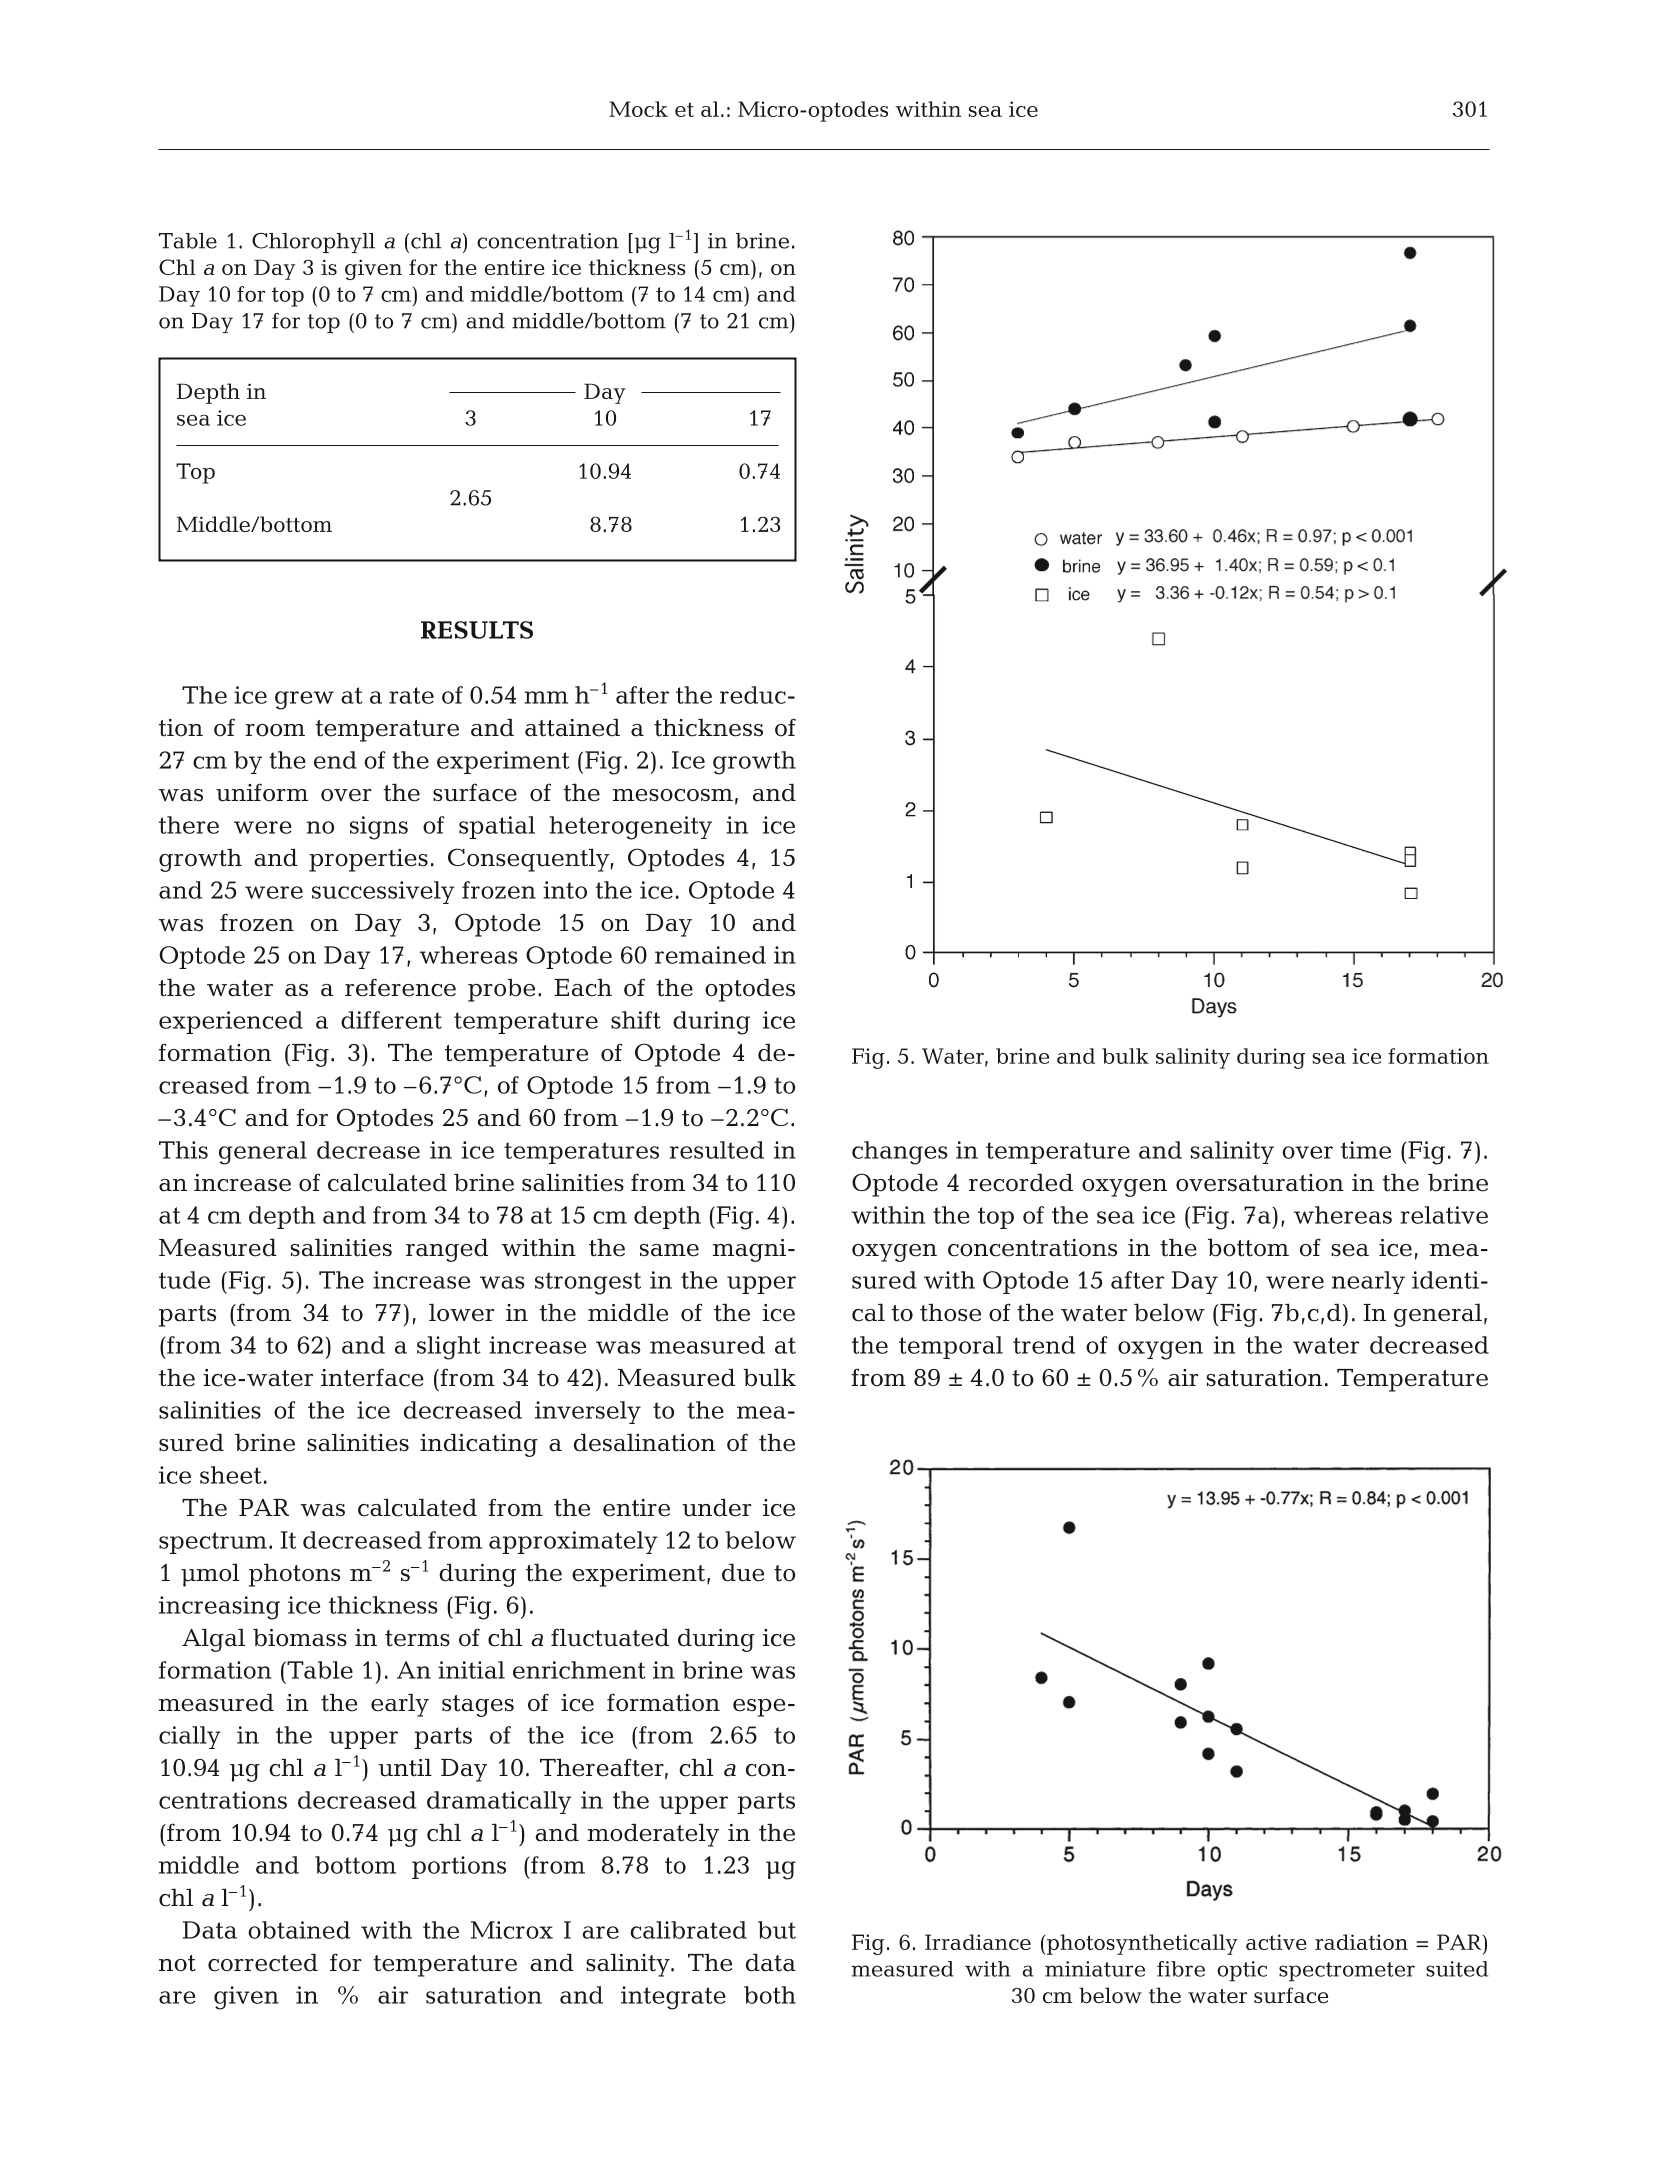
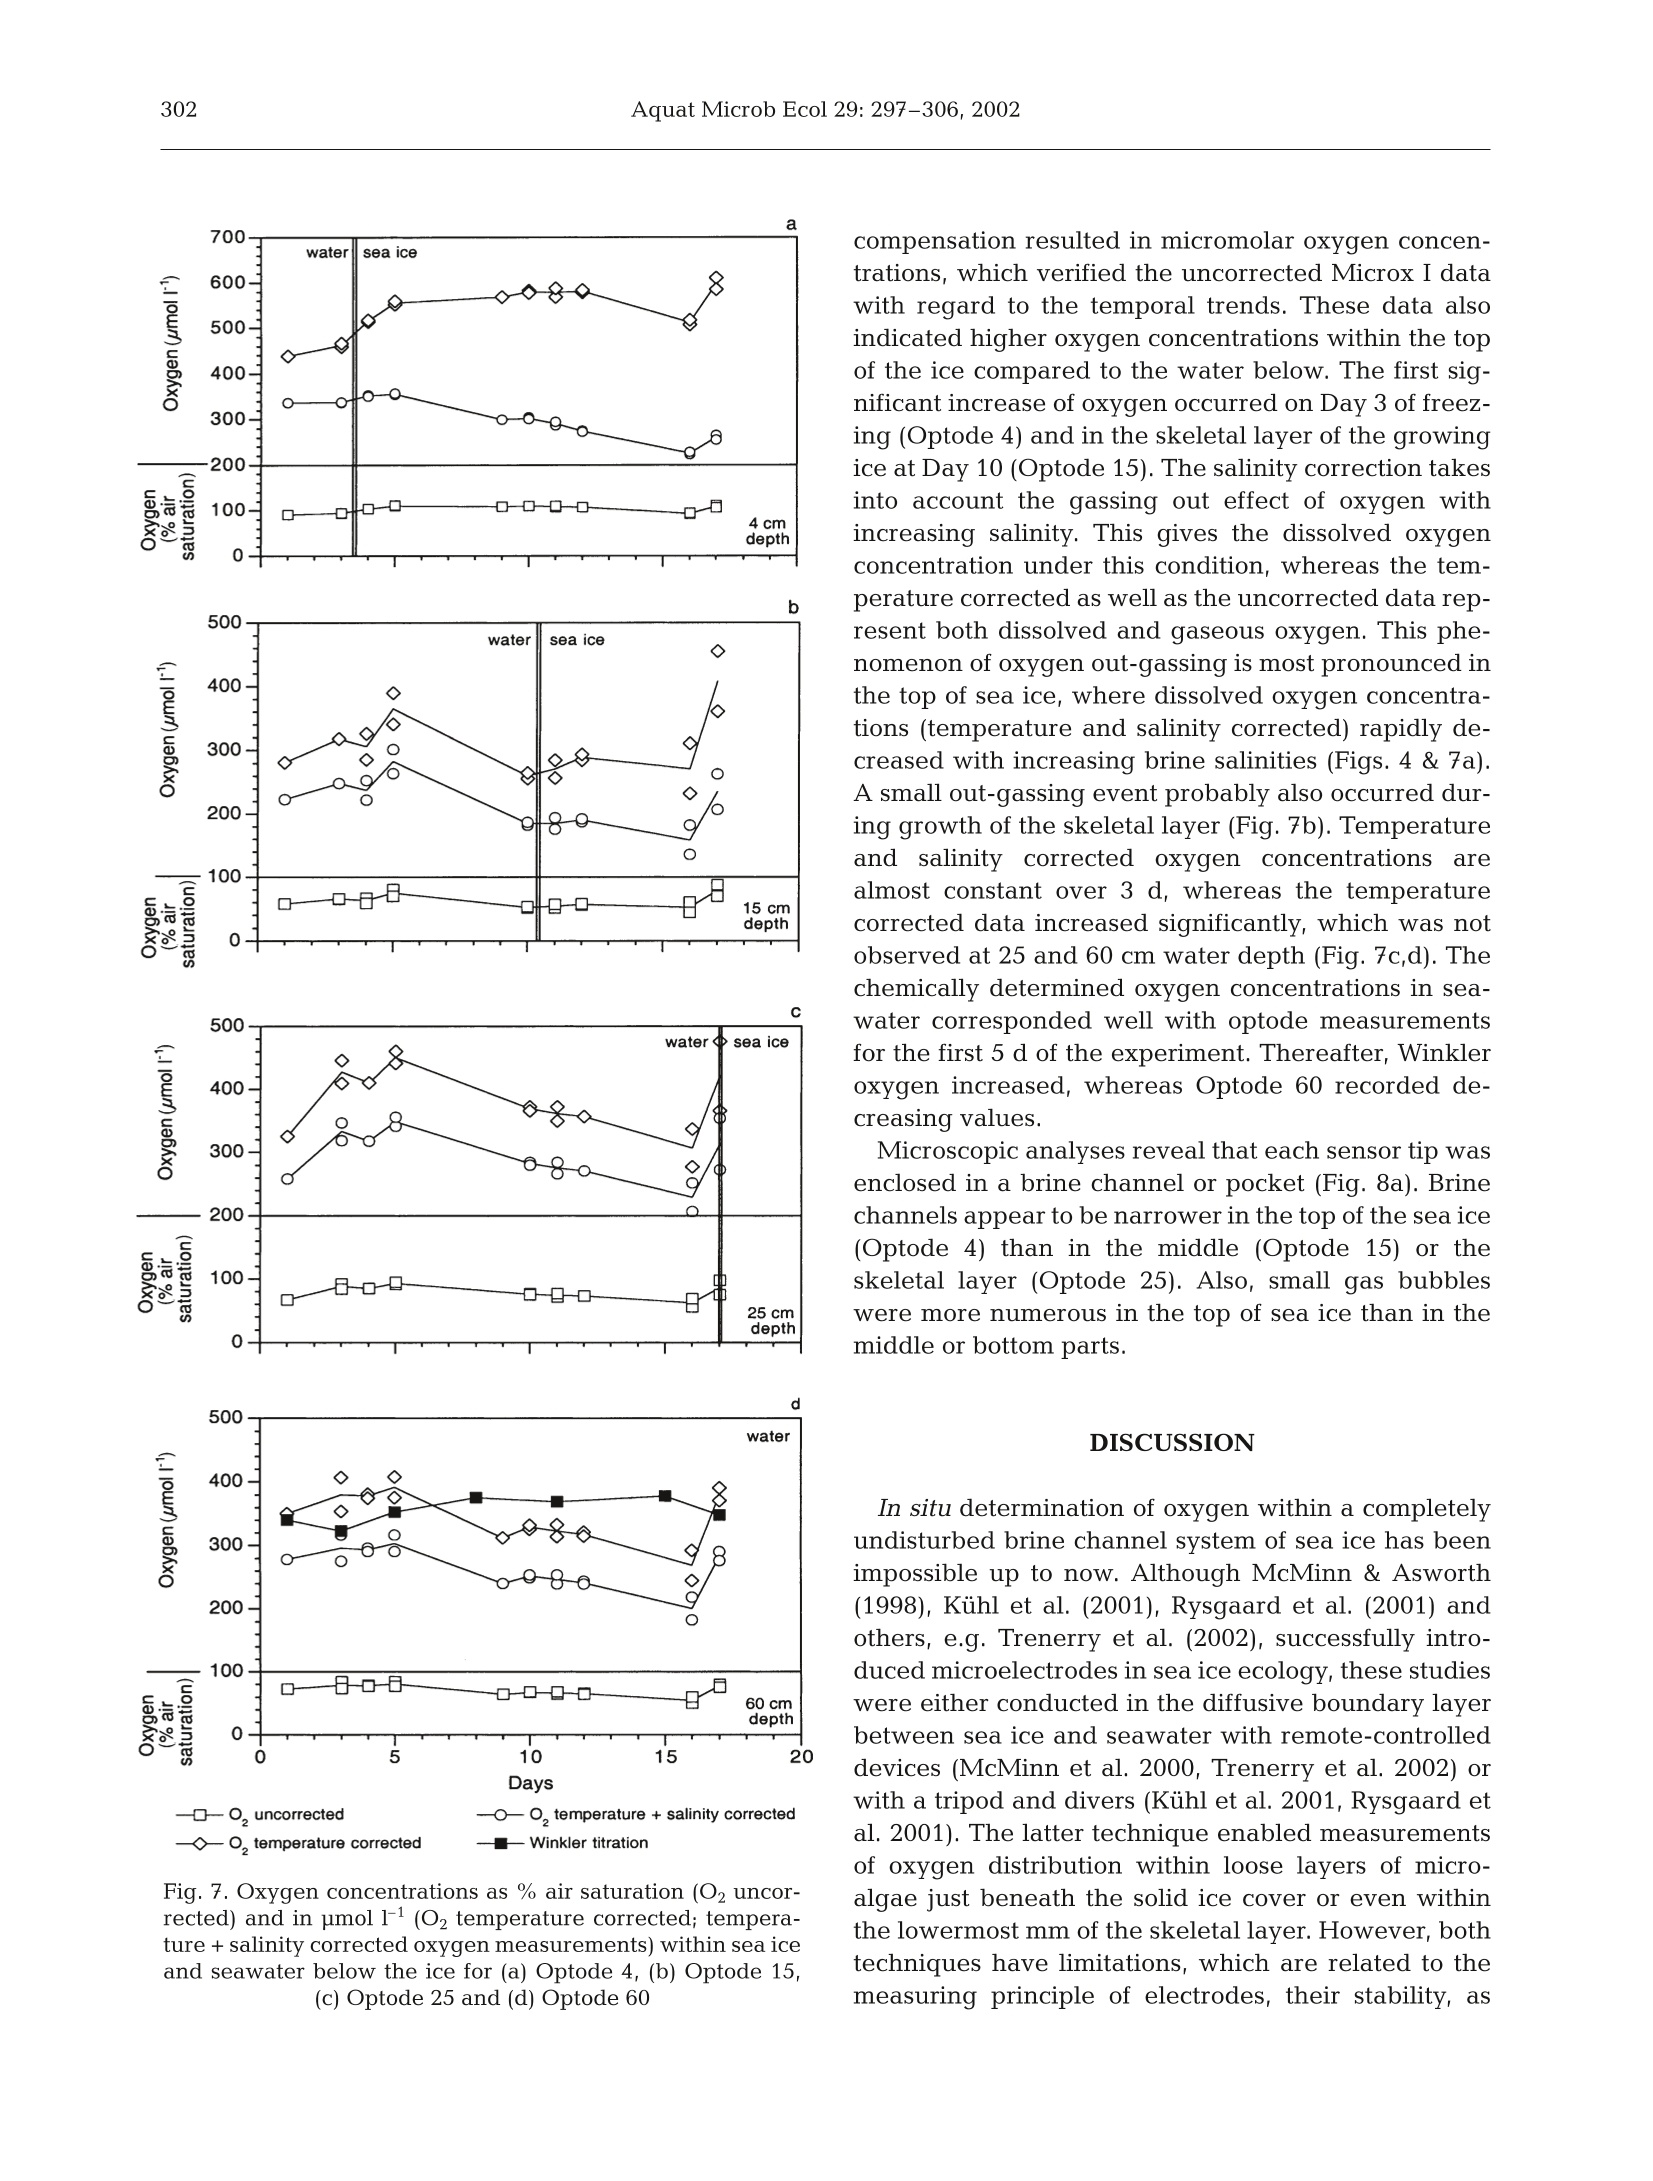
AQUATIC MICROBIAL ECOLOGYAquat Microb EcolPublished October 23Vol. 29:297-306,2002 298Aquat Microb Ecol 29: 297-306,2002 OInter-Research 2002·www.int-res.com Micro-optodes in sea ice: a new approach toinvestigate oxygen dynamics during sea iceformation Thomas Mockl*, Gerhard S. Dieckmannl, Christian Haas, Andreas Krelll,Jean-Louis Tison², Andre L. Beleml, Stathis Papadimitriou,David N. Thomass Alfred-Wegener-Institute for Polar and Marine Research, Am Handelshafen 12,27570 Bremerhaven, Germany Departement des Sciences de la Terre et de l'Environnement, Universite Libre de Bruxelles, 50 Avenue Franklin D. Roosevelt,1050 Bruxelles, Belgium School of Ocean Sciences,University of Wales-Bangor, Menai Bridge, Anglesey LL59 5AB, Wales, UK ABSTRACT: Oxygen micro-optodes were used to measure oxygen dynamics directly within themicrostructure of sea ice by freezing the sensors into the ice during its formation. The experiment wasconducted in a 4 m mesocosm filled with artificial seawater and inoculated with a unialgal culture ofthe common Antarctic ice diatom Fragilariopsis cylindrus (Bacillariophyceae) to a final chlorophyll a(chl a) concentration of 11 ug 1-1. Ice growth was initiated 7 d after inoculation by reducing the airtemperature to -10±2°C and terminated 17 d later. The final ice thickness was 27 cm. One optodewas frozen into grease ice and 2 others into the skeletal layer of the growing ice sheet. Increasingoxygen concentrations during ice crystal formation at the water surface and the ice-water interfacerevealed a strong inclusion of oxygen, which was either physically trapped and/or the result ofphotosynthesising diatoms. The major portion of oxygen was present as gas bubbles due to super-saturation as a result of increasing salinity and oxygen production by diatoms. An increase in salinitydue to a concurrent decrease in ice temperatures during subsequent sea ice development reducedthe maximum concentration of dissolved oxygen within brine. Thus, dissolved oxygen concentrationsdecreased over time, whereas gaseous oxygen was released to the atmosphere and seawater. Thesensors are a significant advance on more conventional microelectrodes, because the recordings canbe temperature and salinity compensated in order to obtain precise measurements of oxygen dynam-ics with regard to total (dissolved and gaseous) and dissolved oxygen in sea ice. Optodes do notconsume oxygen during measurement over a long period under extreme conditions, which is anotheradvantage for long-term deployment in the field. KEY WORDS: Fragilariopsis cylindrus·Oxygen·Methods · Micro-optodes· Sea ice· Biogeochemistry-Resale or republication not permitted without written consent of the publisher INTRODUCTION Ecology of sea ice has been studied intensively forseveral decades (e.g. Meguro 1962, Bunt & Lee 1970,Alexander et al. 1974, Horner 1985, Dieckmann et al.1991, Legendre et al. 1992, Gleitz et al. 1995, Arrigo etal. 1997, Melnikov 1997, Mock & Gradinger 1999, ( *E-mail: tmock@awi-bremerhaven.de ) Lizotte 2001, Brierley & Thomas 2002, Trenerry et al.2002), but it is only in recent years that sea ice biogeo-chemistry has received attention (Ginther & Dieck-mann 1999, Ginther et al. 1999, Thomas et al. 2001,Thomas & Dieckmann 2002). Due to the lack of com-prehensive temporal studies, the relationships be-tween abiotic factors (e.g. irradiance, temperature,nutrients, ice texture, ice thickness) and biological pro-cesses (e.g. carbon uptake by algae, remineralisation),are still unclear. For instance, several workers (Gleitz et al. 1995, Ginther et al. 1999) measured phosphateaccumulation as a consequence of heterotrophic pro-duction in combination with substantial dissolvedinorganic carbon (DIC) depletion and strong oxygenoversaturation. This is contradictory to the expectedoxygen consumption by microzooplankton and bacte-ria, of which the latter frequently exceeds primaryproduction of microalgae (Grossmann & Dieckmann1994). Such discrepancies can be best addressed bydefined laboratory ice experiments where the conceptsof brine channel architecture and internal surface areaas the basis for interactions of organisms, colonisationand biogeochemical processes can be studied indetail (Krembs et al.2000,2001). Cryo-microscopicalmethods are now available which enable the visual-isation of microorganisms in their brine channel habi-tat (Junge et al. 2001).Such developments are superbaids to define complex physicochemical and biogeo-chemical interactionsiVwithin the intricate sea icemicrobial networks. However, despite these develop-ments, we are still unable to determine chemical orphysical conditions in undisturbed brine channels.Consequently, our knowledge is mainly restricted tobulk parameters resulting in the development of con-cepts with unclear details about prevailing environ-mental conditions in the network of brine channels,pockets or bubbles. The main reason for this seriousshortcoming is the inaccessibility of the ice interior dueto texture and rigid nature of the ice. Many of the problems facing the sea ice researcherare similar to those encountered when measuring pro-duction processes and fluxes across biological filmsand surface sediments (Krembs et al. 2000,2001). Thetechnological progress that has been revolutionary inthe study of biofilms and sediments is the most appro-priate source of tools for a new era in sea ice research.One of the most striking advances in the past 15 yr hasbeen the development of microelectrodes for the studyof diffusive boundary layers and profiles of dissolvedgases with remarkably fine scale resolution (Herman &Rechnitz 1974, Revsbech et al. 1980, Jorgensen &Revsbech 1985, Revsbech & Jorgensen 1986, Klimantet al. 1995,De Beer et al. 1997). Several studies have used microelectodes in sea iceinvestigations (McMinn & Ashworth 1998,McMinn etal. 2000, Kuhl et al. 2001, Rysgaard et al. 2001, Glud etal. 2002, Trenerry et al. 2002). These microelectrodeswere constructed exclusively to measure dissolvedoxygen, however, they were not deployed directly inbrine channels (McMinn et al. 2000). They are able topenetrate loose layers of ice crystals at the ice-waterinterface and the bottom few millimetres of sea icewhich encompasses the bottom sea ice assemblagesthat are common in land fast ice (Rysgaard et al. 2001).In situ determination of dissolved oxygen, and there- fore photosynthesis and respiration, is of fundamentalimportance in understanding the driving forces behindbiogeochemical cycling within ice assemblages (Gleitzet al. 1995, Ginther et al. 1999, Glud et al. 2002).Chemical processesSsuchas]redox-reactionsarestrongly influenced by the presence orabsence of oxy-gen. The oxygen concentration is also influenced byphysical processes within brine channels (Tsurikov1979). Thus, oxygen is central in the interactionbetween physicochemical and biological processes(Jorgensen & Revsbech 1985). Unfortunately, there are major limitations to the useof microelectrodes within brine channels of sea ice.They are not flexible and consume oxygen, whichresults in a strong influence on oxygen concentrationswithin small pore spaces (Klimant et al. 1995, 1997,Gouin et al. 1997). To overcome these constraints andto further develop our understanding of oxygendynamics, we have investigated the use of oxygenmicro-optodes in artificially produced sea ice. An arrayof micro-optodes was frozen into the ice as it wasgrowing. Temperature and salinity compensation ofthe signals was possible by simultaneous freezing of achain of thermistors in the same sea ice depth. Salinitywas calculated based on temperature (Assur 1960).The deployment of the sensorswithin the brinechannels for ca. 17 d indicated that oxygen concentra-tions were influenced by freezing of sea water, brinesalinity, diffusive gas exchange and biological activity. MATERIALS AND METHODS Set-up of mesocosm experiment. The optodes weretested in a 4 m³polyethylene tank (mesocosm withoutexchange of water) placed in a large environmentalbasin at HSVA (Hamburgische Schiffbau- und Ver-suchsanstalt) in Hamburg, Germany. The mesocosmwas filled with artificial seawater (Instant Ocean Salt) toa final salinity of 34 and f/2 nutrients (Guillard & Ryther1962). At all times, the water was well mixed using a fil-terless water pump. Light was provided from above byfluorescence tubes (Osram,ultra-white). Surface irradi-ance at the ice surface was adjusted to 34 pmol photonsm-2s-1 for the entire period of the experiment. Themesocosm (water temperature 0C) was inoculatedwith batch cultures of non-axenic Fragilariopsis cylin-drus (Bacillariophyceae), originally isolated from theAntarctic, to a final chlorophyll a (chl a) concentrationof 11 pg1-1. This relatively high initial algal concentra-tion was chosen to initiate a dense algal bloom in theice. Ice growth was initiated 7d after inoculation by re-ducing the room temperature to -10±2°C and initiat-ing ice crystal formation by fine water spray over thewater surface (Haas etal. 1999,Krembs et al. 2001). Physical, chemical and biological measurements.Air temperatures were logged every 10 min using aTinyTalk thermometer located 20 cm above the ice sur-face in a parallel tank. Ice and water temperatureswere measured at intervals of 6 s using 2 thermistorsticks deployed near the optode array. They were com-posed of 10 Siemens K17 thermistors with a verticalspacing of 2 cm beginning 2 cm above the air-waterinterface. The thermistor tips extended horizontally byabout 1.5 cm away from the vertical stick to avoid icegrowth artefacts. Ice thickness measurements wereperformed at irregular time intervals by inserting adipstick inside small drill holes. Surface irradiance (photosynthetically active radia-tion [PAR]) was measured with a Li-Cor 1000 radiome-ter and a 4n sensor, whereas the underwater light fieldwas recorded with a miniature Fiber Optic Spectrome-ter (Ocean Optics) fitted with a CC-3 cosine-correctedirradiance probe. This probe was placed 30 cm belowthe water surface.Readings were taken at irregulartime intervals but parallel to the oxygen measurements. Ice cores for the determination of chl a, phaeopig-ments, and bulk ice and brine salinities were drilledmanually with a 12 cm ice auger at irregular time inter-vals throughout the ice phase of the experiment. Thecores were sectioned into 5 to 7 cm sections and cen·trifuged for 15 min at-5°C to extract the brine (Krembset al. 2001). The salinities of the brine and remainingmelted ice were measured using a WTW LF 191 con-ductivity meter. For the determination of chl a andphaeopigments, brine and the remaining melted icewere filtered onto Whatman GF/F filters and analysedfluorometrically with a Turner Designs Model 10-AUdigital fluorometer after Arar & Collins (1992). The Type A micro-optodes (PreSense, PrecisionSensing GmbH) have a measuring range from 0 to500% air saturation. They possess fibre tips of ca.40 um which were coated with black silicon to ensurestability and to suppress any optical effects from thesurrounding sea ice. The optical fibre was fixed in asyringe and guided through the needle (10 cm length).The micro-optodes were 2 point calibrated at -1℃ inaerated artificial sea water with a salinity of 34 (100%air saturation) and a solution of 0.5% NaSO3 (0% oxy-gen) before starting the experiment. A re-calibration ofthe optodes was not possible because the cables had tobe severed for the thin section analysis needed todetermine the position of the optodes in the ice. Foursensors were deployed at discreet intervals attached toa wooden support placed in a corner of the mesocosm(Fig. 1). The first sensor was placed4 cm below thesurface of the water (Optode 4), the second 15 cmbelow (Optode 15), the third 25 cm (Optode 25) andone in 60 cm depth (Optode 60) (Fig. 1). The sensor tipsextended horizontally by about 12 cm from the vertical stick. Readings were taken with a Microx I (PreSens) atirregular time intervals with a maximum frequency of3 times a day. Microx I measures the luminescence life-time of the immobilised luminophore as the oxygendependent parameter. Measurements are not affectedby bending the fibre or the optical properties of thesample. Furthermore, intensity fluctuations of the lightsources or bleaching effects of the indicators have noimpact on the lifetime measurements. The Microx Iuses a phase-modulation technique to evaluate thelifetime of the indicators. The oxygen content as % air-saturation can be calculated using Eq. (1): where D is the phase angle of oxygen free water, D isthe measured phase angle, Ksv is the Stern-Volmerconstant and [O2] is the oxygen content in % air satu-ration. The conversion of % air saturation into pmolO21can be calculated as in Eq. (2): Fig. 1. Set-up of the oxygen micro-optode array in 1 corner ofthe mesocosm. The first sensor was placed 4 cm below thesurface (Optode 4), the second 15 cm below (Optode 15), thethird 25 cm (Optode 25) and one was placed at 60 cm depth(Optode 60). Ice thickness reached 27 cm at the end of theexperiment Fig. 2. Ice thickness during the experiment. Optode 4 wasfrozen on Day 3 in a grease ice layer, whereas Optode 15 wasfrozen on Day 10 and Optode 25 on Day 17 in the skeletallayer of sea ice. Optode 60 was the reference for seawater Fig. 3. Temperature shift during oxygen measurement inthose depths where the optodes were placed. Optodes 4, 15,25 and 60 are at 4, 15, 25 and 60 cm depth,respectively where Patm is the actual atmospheric pressure, Pn is thestandard pressure (1013 mbar), 0.2095 is the volume con-tent of oxygen in air, pw(T) is the vapour pressure ofwater at temperature T given in Kelvin, M(O2) is themolecular mass of oxygen (32 g mol-1), VM is the molarvolume (22.4141 mol-1),and a(T;S) is the Bunsen absorp-tion coefficient at temperature T(Kelvin) and salinity S. The conversion of % air saturation into pmol O21can only be calculated by considering the influence oftemperature and salinity changes during sea ice for-mation and subsequent growth. Both parameters (T;S)have a strong influence on the concentration ofdissolved oxygen in brine (Sherwood et al. 1991). Thesolubility of oxygen decreases with increasing salt con-centrations and increases with decreasing tempera-tures. Consequently, a temperature compensation hadto be conducted by using thermistors. The temperaturedata were also used to calculate brine salinity (Assur1960) and chlorinity using Eq. (3): where S, is the brine salinity. This is necessary to compensate for the salting-outeffect with the Bunsen absorption coefficient a(T;S)using Eq. (4): where A is -7.424, B is 4.417 ×10³, C is -2.927, D is4.238×10-2, Pis-1.288×10⁻¹, Qis 53.44, R is -4.442 x10⁻² and S is 7.145×10⁻⁴. A-Dand P-S are coefficientsbased on measurements and polynomial fits (Instruc-tion ManualforMicrox TX, PreSence PrecisionSensing). Ten temperature measurements (60 s) were used foreach reading point of oxygen. The average of the tem-perature/chlorinity data was used to compensate theoxygen measurements. More details on the measuringprinciple, calculation as well as the optodes themselvesare available at www.PreSens.de. Oxygen titrationaccording to the Winkler method (Strickland & Parsons1972) was conducted on water samples from below seaice at irregular time intervals in order to compare thewater measurements taken with Optode 60. Thiscomparison was not possible for the ice samples. At the end of the experiment, an ice block in whichthe optodes were frozen was cut out from the ice sheetin order to determine the microstructure in which eachsensor tip was embedded.In a -20°C cold room, thincross sections of ca. 3 to 4 mm were cut to include anddisplay the optode tips. Sections were photographedunder ordinary light for best contrast between theblack fibre tip and the pores or brine channels. Fig. 4. Shift of calculated brine salinities in those depthswhere the optodes were placed. Optodes 4, 15, 25 and 60 areat 4, 15, 25 and 60 cm depth, respectively Table 1. Chlorophyll a (chl a) concentration [ug l-1] in brine.Chl a on Day 3 is given for the entire ice thickness (5 cm), onDay 10 for top (0 to 7 cm)and middle/bottom (7 to 14 cm) andon Day 17 for top (0 to 7 cm) and middle/bottom (7 to 21 cm) Depth in - Day sea ice 3 10 17 Top 2.65 10.94 0.74 Middle/bottom 8.78 1.23 RESULTS The ice grew at a rate of 0.54 mm h-after the reduc-tion of room temperature and attained a thickness of27 cm by the end of the experiment (Fig.2). Ice growthwas uniform over the surface of the mesocosm, andthere were no signs of spatial heterogeneity in icegrowth and properties. Consequently, Optodes 4, 15and 25 were successively frozen into the ice.Optode 4was frozen on Day 3, Optode 15 on Day 10 andOptode 25 on Day 17, whereas Optode 60 remained inthe water as a reference probe. Each of the optodesexperienced a different temperature shift during iceformation (Fig.3). The temperature of Optode 4 de-creased from -1.9 to-6.7°C, of Optode 15 from-1.9 to-3.4°C and for Optodes 25 and 60 from -1.9 to -2.2°C.This general decrease in ice temperatures resulted inan increase of calculated brine salinities from 34 to 110at 4 cm depth and from 34 to 78 at 15 cm depth (Fig.4).Measured salinities ranged within the same magni-tude (Fig. 5). The increase was strongest in the upperparts (from 34 to 77), lower in the middle of the ice(from 34 to 62) and a slight increase was measured atthe ice-water interface (from 34 to 42). Measured bulksalinities of the ice decreased inversely to the mea-sured brine salinities indicating a desalination of theice sheet. The PAR was calculated from the entire under icespectrum. It decreased from approximately 12 to below1 pmol photons m-²s-1 during the experiment, due toincreasing ice thickness (Fig. 6). Algal biomass in terms of chl a fluctuated during iceformation (Table 1). An initial enrichment in brine wasmeasured in the early stages of ice formation espe-cially in the upper parts of the ice (from 2.65 to10.94 ug chl a 1-1) until Day 10. Thereafter, chl a con-centrations decreased dramatically in the upper parts(from 10.94 to 0.74 pg chl al-1) and moderately in themiddle and bottom portions (from 8.78 to 1.23 ugchl al-1). Data obtained with the Microx I are calibrated butnot corrected for temperature and salinity. The dataare given in % air saturation and integrate both 80 >一 20 Fig. 5. Water, brine and bulk salinity during sea ice formation changes in temperature and salinity over time (Fig.7).Optode 4 recorded oxygen oversaturation in the brinewithin the top of the sea ice (Fig.7a),whereas relativeoxygen concentrations in the bottom of sea ice, mea-sured with Optode 15 after Day 10, were nearly identi-cal to those of the water below (Fig. 7b,c,d). In general,the temporal trend of oxygen in the water decreasedfrom 89±4.0 to 60±0.5% air saturation. Temperature Fig. 6. Irradiance (photosynthetically active radiation = PAR)measured with a miniature fibre optic spectrometer suited30 cm below the water surface d -◇-0,temperature corrected — Winkler titration Fig. 7. Oxygen concentrations as % air saturation (O2 uncor-rected) and in umol11 (O2 temperature corrected; tempera-ture + salinity corrected oxygen measurements) within sea iceand seawater below the ice for (a) Optode 4, (b) Optode 15,(c) Optode 25 and (d) Optode 60 compensation resulted in micromolar oxygen concen-trations, which verified the uncorrected Microx I datawith regard to the temporal trends. These data alsoindicated higher oxygen concentrations within the topof the ice compared to the water below. The first sig-nificant increase of oxygen occurred on Day 3 of freez-ing (Optode 4) and in the skeletal layer of the growingice at Day 10 (Optode 15). The salinity correction takesinto account the gassing out effect of oxygen withincreasing salinity. This gives the dissolved oxygenconcentration under this condition, whereas the tem-perature corrected as well as the uncorrected data rep-resent both dissolved and gaseous oxygen. This phe-nomenon of oxygen out-gassing is most pronounced inthe top of sea ice, where dissolved oxygen concentra-tions (temperature and salinity corrected) rapidly de-creased with increasing brine salinities (Figs. 4 & 7a).A small out-gassing event probably also occurred dur-ing growth of the skeletal layer (Fig. 7b). Temperatureand salinity corrected oxygen concentrationsarealmost constant over 3 d, whereas the temperaturecorrected data increased significantly, which was notobserved at 25 and 60 cm water depth (Fig. 7c,d). Thechemically determined oxygen concentrations in sea-water corresponded well with optode measurementsfor the first5 d of the experiment. Thereafter, Winkleroxygen increased, whereas Optode 60 recorded de-creasing values. Microscopic analyses reveal that each sensor tip wasenclosed in a brine channel or pocket (Fig. 8a). Brinechannels appear to be narrower in the top of the sea ice(Optode 4) than in the middle (Optode 15) or theskeletal layer (Optode 25). Also, small gas bubbleswere more numerous in the top of sea ice than in themiddle or bottom parts. DISCUSSION In situ determination of oxygen within a completelyundisturbed brine channel system of sea ice has beenimpossible up to now. Although McMinn & Asworth(1998), Kuhl et al. (2001), Rysgaard et al. (2001) andothers, e.g. Trenerry et al. (2002), successfully intro-duced microelectrodes in sea ice ecology, these studieswere either conducted in the diffusive boundary layerbetween sea ice and seawater with remote-controlleddevices (McMinn et al. 2000, Trenerry et al. 2002) orwith a tripod and divers (Kuhl et al. 2001, Rysgaard etal. 2001). The latter technique enabled measurementsof oxygen distribution within loose layers of micro-algae just beneath the solid ice cover or even withinthe lowermost mm of the skeletal layer. However, bothtechniques have limitations, which are related to themeasuring principle of electrodes, their stability, as well as the constructions of the devices (Klimant et al.1997). Oxygen optodes compared to oxygen electrodesdo not consume oxygen (Klimant et al. 1995) and theyare also able to measure gaseous oxygen. The elec-trode is immersed in an electrolyte and separated frominterfering species by a membrane permeable to oxy-gen. A flow of dissolved oxygen through this mem-brane is induced by the consumption of oxygen by theelectrode. Non-oxygen consuming sensors, however,are of paramount importance for long-term measure-ments in semi-enclosed brine channel systems of seaice. The stability of the optode is guaranteed by theflexibility of the glass fibre and the coating of the sen-sor with silicon (PreSens). These advantages make theoptodes an ideal instrument for determination of oxy-gen evolution or consumption in brine channels oreven enclosed brine pockets. This is only possible byfreezing of optodes during sea ice formation, a processwhich results in a change of physical and biogeo-chemical properties of seawater. The effects of suchchanges on the dynamics of oxygen which is influ-enced by chemical as well as biological processes arestill unknown. Nevertheless, measurements in small brine channelsor even spheres could reveal strong heterogeneity inoxygen concentrations caused by bubble formationand aggregates of either oxygen-producing (algae) oroxygen-consuming organisms (bacteria). One problemduring long-term deployment could be the develop-ment of bacterial films on the sensor tip, which wasnot observed during our experiment. Nonetheless, thegeneral differences in oxygen concentrations betweenthe optodes at the beginning of the experiment re-mains to be resolved because all the optodes were stillin the same well-mixed seawater (Fig. 7). With theexception of this problem, optode measurements areable to resolve small scale heterogeneity in sea ice.However, more sensor arrays would need to tbedeployed to obtain a representative overview of theoxygen dynamics within sea ice. Sack hole sampling ofbrine is not appropriate because brine collection takestoo long, thereby enabling gassing out of hyperoxicbrines (Gleitz et al. 1995). Optode measurements aremore precise, leading to a better estimate of ecosystemproductivity, which varies considerably during differ-ent stages of ice algal blooms and inducing dramaticchanges in biogeochemical cycles (Giinther et al. 1999,Thomas & Dieckmann 2002). The discrepancy between temperature corrected(total oxygen: dissolved and gaseous) and salinity cor-rected oxygen (dissolved oxygen) during ice crystalformation at the water surface and the ice-water inter-face revealed a strong incorporation of gaseous oxy-gen, which could be the result of physical entrapmentof oxygen producing algae and a salinity increase Fig. 8. Thin sections of frozen optodes at the end of the experiment.(a) Optode 4 (4 cm ice depth); (b) Optode 15 (15 cm ice depth);(c) Optode 25 (25 cm ice depth= skeletal layer) Fig. 9. Ice-water comparison of oxygen either as % air satura-tion (uncorrected measurements) or given in pimol oxygenF(temperature corrected; temperature + salinity correctedoxygen measurements) during freezing. The significantly higher concentra-tion of gaseous oxygen in comparison to dissolvedoxygen in sea ice could be elucidated by comparisonof total oxygen data for ice and water (Fig. 9). In con-trast to sea ice, no significant difference betweengaseous and dissolved oxygen could be found in theseawater. It is reasonable to assume that the diatomswere passively accumulated by grease ice formationand that their photosynthetic activity under the higherlight intensities at the surface, resulted in the elevatedoxygen concentrations.The brine channels couldtherefore be oversaturated with oxygen, resulting in arelease of gaseous oxygen from sea ice (see uncor-rected data of Optode 4). This is also indicated byhigh concentrations of gas bubbles around Optode 4(Fig. 8). A physical entrapment of oxygen within theprimary ice layer at the water surface at a time whenit consisted of separate crystals can also be assumed.The oxygen is probably incorporated partly from theatmosphere and partly from the water (Matsuo &Miyake 1966,Tsurikov1979). Experiments withmicroelectrodes in artificial sea ice by Glud et al.(2002) confirmed the observation that brine is super-saturated while melt water is undersaturated withrespect to dissolved oxygen. They speculated that themajor portion of oxygen associated with the sea icematrix is most likely trapped as gas bubbles thatdeveloped during the freezing process, which isconfirmed by our measurements. Nevertheless, bothphysical and biologicalpprocesses influence thegaseous oxygen in newly formed sea ice. Increasingsalinities due to decreasing ice temperatures reducethe maximum concentration of dissolved oxygenwithin brine channels.The higher the brine salinity,the lower the maximum oxygen concentration whichcanbe dissolved...This chemical relationship isassumed to be the reason for a temporal decrease in dissolved oxygen concentrations within sea ice (tem-perature and salinity corrected data of Optode 4). Thissalinity effect is most pronounced in the top of sea icewhere ice is colder in comparison to the ice-waterinterface. However, the dynamics of oxygen at theice-water interface is, in contrast, probably influencedby physically trapped oxygen and activity of algalcommunities, dominating the bottom habitat becausethe salinity difference to sea water was less pro-nounced here. Optode 15 recorded an increase intotal oxygen (temperature corrected oxygen) duringskeletal layer formation from Days 10 to 12. The high-est biomass in terms of chl a in this layer and a strongreduction of biomass in the top layers was also re-corded during this time. A release of gas from solutionduring subsequent freezing of sea water at the ice-water interface alsooccursduring iice growth(Tsurikov 1979). Winkler titrations and optode mea-surements (Fig. 7) confirmed the release of oxygenduring sea ice formation between Days 3 and5. How-ever, the oxygen concentrations in water remainedalmost constant after Day 5 as determined by Winkler,whereas optode measurements revealed decreasingvalues (Fig. 7b,c,d; water). Salinity and density of brine in the upper layer of thesea ice increase because of the rejection of salt by thegrowing ice sheet. This caused desalination of the ice,which is confirmed by decreasing bulk salinities dur-ing freezing (Fig. 5) and generated an unexpectedhigh loss of initially trapped diatoms. Nevertheless,such changes in pigment concentration could also becaused by changes of chl a:carbon ratios, which proba-bly decreased due to increasing irradiance in the top ofsea ice.Photosynthesis of diatoms at the sea ice surfacewas more likely inhibited by high salinities and lowtemperatures, whereas diatoms at the sea ice-waterinterface were probably inhibited by low photon fluxdensities of not more than 1 umol photons m-²s-1(Fig. 6). Nutrient limitation could be excluded in theartificial seawater enriched by f/2 nutrients. The measurementss with micro-optodes have im-proved our understanding of oxygen dynamics in seaice, which is vital for modelling biogeochemical cycles(Thomas & Dieckmann 2002). This method combinedwith novel measurements by Eicken et al. (2000) usingmagnetic resonance imaging (MRI) to investigatesmall scale processes in changing temperature re-gimes occurring during sea ice formation may help tobetter understandthe dramatic influence oftgasdynamics in sea ice and related biological activity.Optical observations to investigate microstructuralinfluences on the distribution of algae and bacteria(Junge et al. 2001) would complete the detailed inves-tigation of small scale microstructural processes withinsea ice brine channels and pockets. This study demonstrated the first use of micro-optodes to investigate oxygen dynamics within undis-turbed brine channels of sea ice. Although experi-ments were done in an artificial experimental tank, theresults give reason to believe that further develop-ments will enable their deployment in the field. Thesensors are a significant advance over more conven-tional microelectrodes. They are ideal for long-termdeployment in the field because they can be tempera-ture and salinity compensated and do not consumeoxygen during measurements over a long period underlow temperatures. The optodes withstand freezingwithout damage to the sensor tip, an important pre-requisite to measure directly within brine channels orbrine pockets of sea ice without disturbing the ice tex-ture or brine chemistry. Evidently, both physicochemi-cal and biological processes influence the oxygenconcentrations in sea ice. Oxygen is obviously in-corporated during sea ice formation and enhanced byphotosynthetic activity of micro-algae, resulting insupersaturation, especially in the top layers of sea ice.However, the major proportion of oxygen is not dis-solved in brine, but is concentrated in the form of airbubbles or released to the seawater. Acknowledgements. We would like to thank the HamburgShip Model Basin (HSVA), especially K. U. Evers and the icetank crew, for hospitality, technical support and professionalexecution of the test programme in the ARTECLAB. Theresearch activities carried out at the Major Research Infra-structure ARTECLAB were granted by the Human Potentialand Mobility Programme from the European Union throughgrant:HPRI-CT-1999-00035.D.N.T. is grateful also to the sup-port of the Hanse Institute of Advanced Study and a NERCsmall research grant to the Bangor group. Special thanks aregiven to Erika Allhusen for her excellent technical assistance. LITERATURE CITED Alexander V, Horner R, Clasby CR (1974) Metabolism ofArctic sea ice organisms, Rep R74-4. Institute of MarineScience, University of Alaska, Fairbanks, p 1-120 Arar EJ, Collins GB (1992) In vitro determination of chloro-phyll a and phaeophytin a in marine and freshwaterphytoplankton by fluorescence. Method445.0. In: US EPA(ed) Methods for the determination of chemical substancesin marine and estuarine environmental samples. US Envi-ronmental Protection Agency, Cincinnati Arrigo KR, Worthen DL, Lizotte MP, Dixon P, Dieckmann G(1997) Primary production in Antarctic sea ice. Science276:394-397 Assur A (1960) Composition of sea ice and its tensile strength.SIPRE Res, Rep 44, Wilmette, IL, p1-49 Brierley AS, Thomas DN (2002) The ecology of SouthernOcean sea ice. Adv Mar Biol 43:171-276 Bunt JS, Lee CC (1970) Seasonal primary production inAntarctic sea ice at McMurdo Sound in 1967.J Mar Res28:304-320 ( De Beer D, Glud A, Epping E, Kuhl M (1997) A fast-respond- ing CO2 microelectrode for profiling sediments, microbial TT42(7 mats, and biofilms. Limnol Oceanogr 42(7):1590-1600 ) ( Dieckmann G, Lange M, Ac k ley SF, Jennings J Jr (1991) The n utrient s tatus in sea ice o f th e Weddell Sea during winter: effects of sea ice texture and algae. Polar Biol 11:449-456 ) ( Eicken H , Bock C , W i ttig R, M i ller H, P o ertner H O (2000) M agnetic r e sonance imaging of sea-ice pore fluids: meth- ods a nd t hermal evolution of p ore microstructure. Cold Reg Sci Technol 31:207-225 ) ( Gleitz M, Vonderloeff MR , Thomas DN, Dieckmann GS, Millero FJ (1995) Comparison of summer a nd winterinorganic carbon, o xygen a n d nutrient concentrations in Antarctic sea ice brine. Mar Chem 51(2):81-91 ) ( Glud RN, Rysgaard S, Kuhl M (2002) A l a boratory study on O2 dynamics and p h otosynthesis i n i c e algal c ommunities: quantification by microsensors, O2-exchange rates, 1 4 c incubation and PAM f l uorometer. Aquat M icrob Ecol 27:301-311 ) ( Gouin JF, Baros F , Birot D, Andre JC (1997) A fibre-optic o x y- gen sensor f or oceanography. S ensors Actuators B 38-39: 401-406 ) ( Grossmann S, Dieckmann GS (1994) Bacterial standing stock,activity, and carbon p roduction d uring formation and growth of sea ice i n t he W eddell S e a, A n tarctica. Appl E nviron Microbiol 60:2746-2753 ) Guillard RR, Ryther JH (1962) Studies of marine planktondiatoms. I. Cyclotella nana (Husted) and Detonula confer-vacea (Cleve). Can J Microbiol 8:229-239 ( Gunther S , Diec k mann GS (1999) Seasonal d e velopment ofalgal biomass in s now-coverd fa s t i c e and the underlyingplatelet layer in the Weddell Sea, Antarctica. Antarct Sci11(3):305-315 ) Ginther S, Gleitz M, Dieckmann GS (1999) Biogeochemistryof Antarctic sea ice: a case study on platelet ice layers atDrescher Inlet, Weddell Sea. Mar Ecol Prog Ser 177:1-13 Haas C, Cottier F, Smedsrud LH, Thomas D and 7 others(1999) Multidisciplinary ice tank study shedding new lighton sea ice growth processes. EOS 80(43):507-513 Herman HB, Rechnitz GA (1974) Preparation and propertiesof a carbonate ion-selective membrane electrode. AnalChim Acta 76:155-164 Horner R (1985) Sea ice biota. CRC, Boca Raton Jorgensen BB, Revsbech NP (1985) Diffusive boundary layersand the oxygen uptake of sediments and detritus. LimnolOceanogr 30:111-122 Junge K, Krembs C, Deming J, Stierle A, Eicken H (2001) Amicroscopic approach to investigate bacteria under in situconditions in sea ice samples. Ann Glaciol 33:304-310 Kirst GO, Wiencke C (1995) Ecophysiology of polar algae.J Phycol 31:181-199 Klimant I, Meyer V, Kuhl M (1995) Fiber-optic oxygenmicrosensors, a new tool in aquatic biology. LimnolOceanogr 40:1159-1165 Klimant I, KuhlM, Glud RN, Holst G (1997) Optical measure-ment of oxygen and temperature in microscale: strategiesand biological applications. Sensors Actuators B 38-39:29-37 ( Krembs C, Gradinger R , Spindler M (2000) Implications of brine channel geometry and surface area for t he interac- tion of sympagic organisms i n Arctic sea ice . J Exp Mar Bio Ecol 243:55 - 80 ) Krembs C, Mock T, Gradinger R (2001) A mesocosm study ofphysical-biological interactions in artificial sea ice: effectsof brine channel surface evolution and brine movement onalgal biomass. Polar Biol 24:356-364 ( Kuhl M , Glud R N , Borum J, Roberts R, Rysgaard S ( 2002) ) Photosynthetic performance of surface associated algaebelow sea ice as measured with a pulse amplitude modu-lated (PAM) fluorometer and O2 microsensors. Mar EcolProg Ser 223:1-14 Legendre L, Ackley SF, Dieckmann GS, Gulliksen B and 6others (1992) Ecology of sea ice biota. 2. Global signifi-cance.Polar Biol 12:429-444 Lizotte M P (2001) The contributions of sea ice algae toAntarctic marine primary production. Am Zool 41:57-73 Matsuo S, Miyake Y(1966) Gas composition in ice samplesfrom Antarctica. J Geophys Res 71(22):5235-5241 ( McMinn A, Ashworth C (1998) The use of oxygen microelec- trodes to determine the net production by an Antarctic sea ice algal community. Antarct Sci 10:39-44 ) ( McMinn A , A s hworth C, R y an KG (2 0 00) In situ net primaryproductivity of an Antarctic fast ic e bottom algal commu- nity. Aquat Microb Ecol 21:177-185 ) Meguro H (1962) Plankton ice in the Antarctic ocean. AntarctRec 14:1192-1199 Melnikov IA (1997) The Arctic sea ice ecosystem.Gordon andBreach Science Publishers, Amsterdam Mock T, Gradinger R (1999) Determination of Arctic ice algalproduction with a new in situ incubation technique. MarEcol Prog Ser 177:15-26 Revsbech NP, Jorgensen BB (1986) Microelectrodes: their usein microbial ecology.In: Marshall KC (ed) Advances in Editorial responsibility: Karin Lochte, Kiel, Germany microbial ecology, Vol 9. Plenum Press, New York,p 293-352 Revsbech NP, Jorgensen BB, Blackburn TH (1980) Oxygen inthe sea bottom measured with a microelectrode. Science207:1355-1356 Rysgaard S, Kuhl M, Glud RN, Hansen JW (2001) Biomass,production and horizontal patchiness of sea ice algae in ahigh-Arctic fjord (Young Sound, NE-Greenland). Mar EcolProg Ser 223:15-26 Sherwood JE, Stagnitti F, Kokkin MJ, Williams WD (1991)Dissolved oxygen concentrations in hypersaline waters.Limnol Oceanogr 36(2):235-250 Strickland JD, Parsons TR (1972) A practical handbook of seawater analysis. Bull Fish Res Board Can 167:310 Thomas DN, Dieckmann GS (2002) Antarctic Sea ice-ahabitat for extremophiles. Science 295:641-644 Thomas DN, Kennedy H, Kattner G, Gerdes D, Gough C,Dieckmann GS (2001) Biogeochemistry of platelet ice: itsinfluence on particle flux under fast ice in the WeddellSea, Antarctica. Polar Biol 24:486-496 Trenerry LJ, McMinn A, Ryan KG (2002) In situ oxygenmicroelectrode measurements of the bottom-ice algalproduction in McMurdo Sound, Antarctica. Polar Biol25:72-80 ( Tsurikov VL (1979) The formation and c omposition of the gascontent o f sea ice. Journal of Glaciology 22:67-81 ) Submitted: January 14, 2002; Accepted: June 14, 2002Proofs received from author(s): September 19, 2002
确定

还剩8页未读,是否继续阅读?

产品配置单

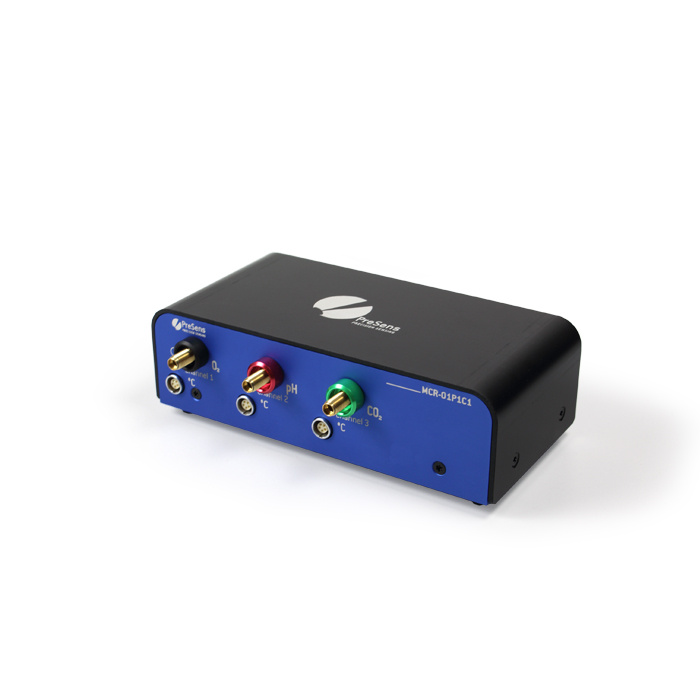
科艺仪器有限公司为您提供《海冰形成过程中氧动力学检测方案(氧分析仪)》,该方案主要用于环境水(除海水)中其他检测,参考标准--,《海冰形成过程中氧动力学检测方案(氧分析仪)》用到的仪器有光学O2、pH 和 CO2测量仪
推荐专场
相关方案
更多