


最近,一种新的离子源,实时直接分析(DART®)已经面世,该技术可以将生物样品直接导入质谱(MS)系统中。免除了通常在MS分析前需要进行的样品制备和高效液相色谱(HPLC)分离,大大缩短了周转时间、减轻了对环境的影响,也减少了经济成本与人力成本。这一新技术已开始在各种定性分析中得到应用,直接检测固体表面、液体和气体中的各种化合物。在本研究中,我们把在大气压下以接地电位操作的DART离子源,直接安装在Sciex 4000串联质谱上,将血浆样品直接导入DART-MS/MS系统中进行分析。所测生理体液中各种化合物均获得了良好的精密度和准确度(%CV和 误差%均 <10%)。此外,80%所测化合物的最低检测限均达到5 ng/mL或更低,完全可以支持药物开发研究。最后,我们对明显影响分析性能的实验条件进行了优化和限定。我们认为DART简便、数据获取速度快(3-5秒)、成本低,将在生物基质的定量药物分析中发挥重要作用。
方案详情

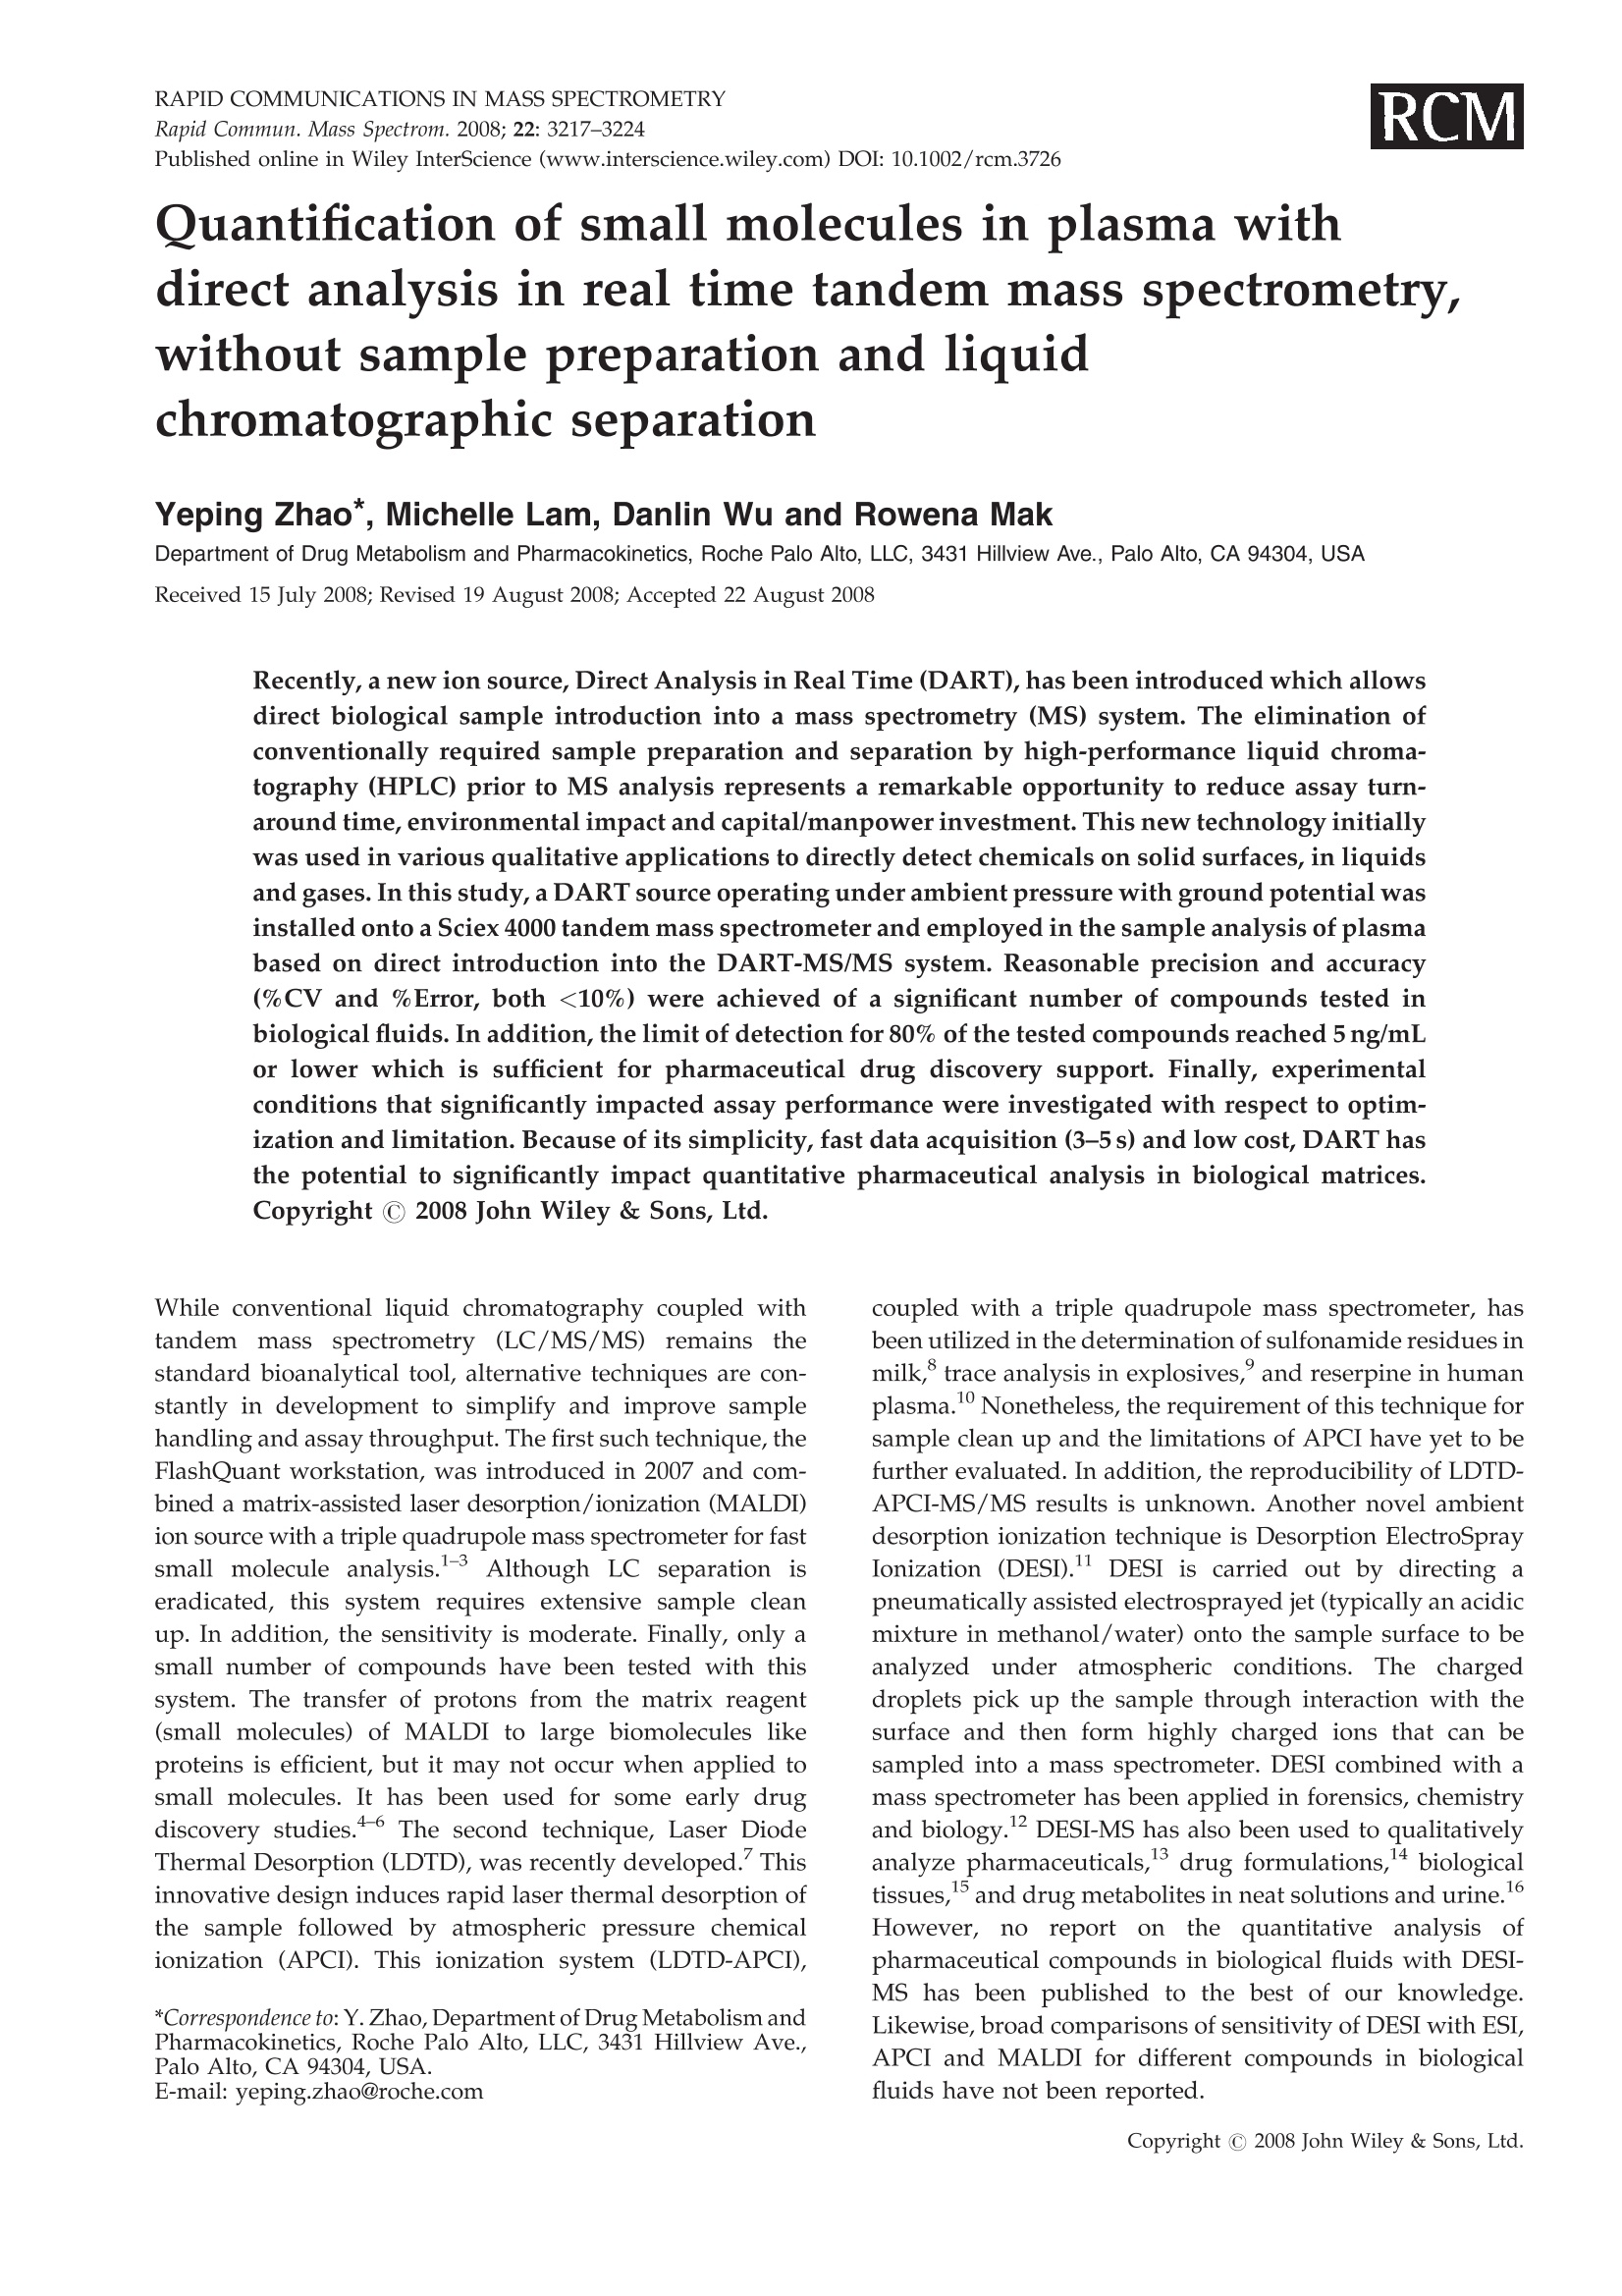
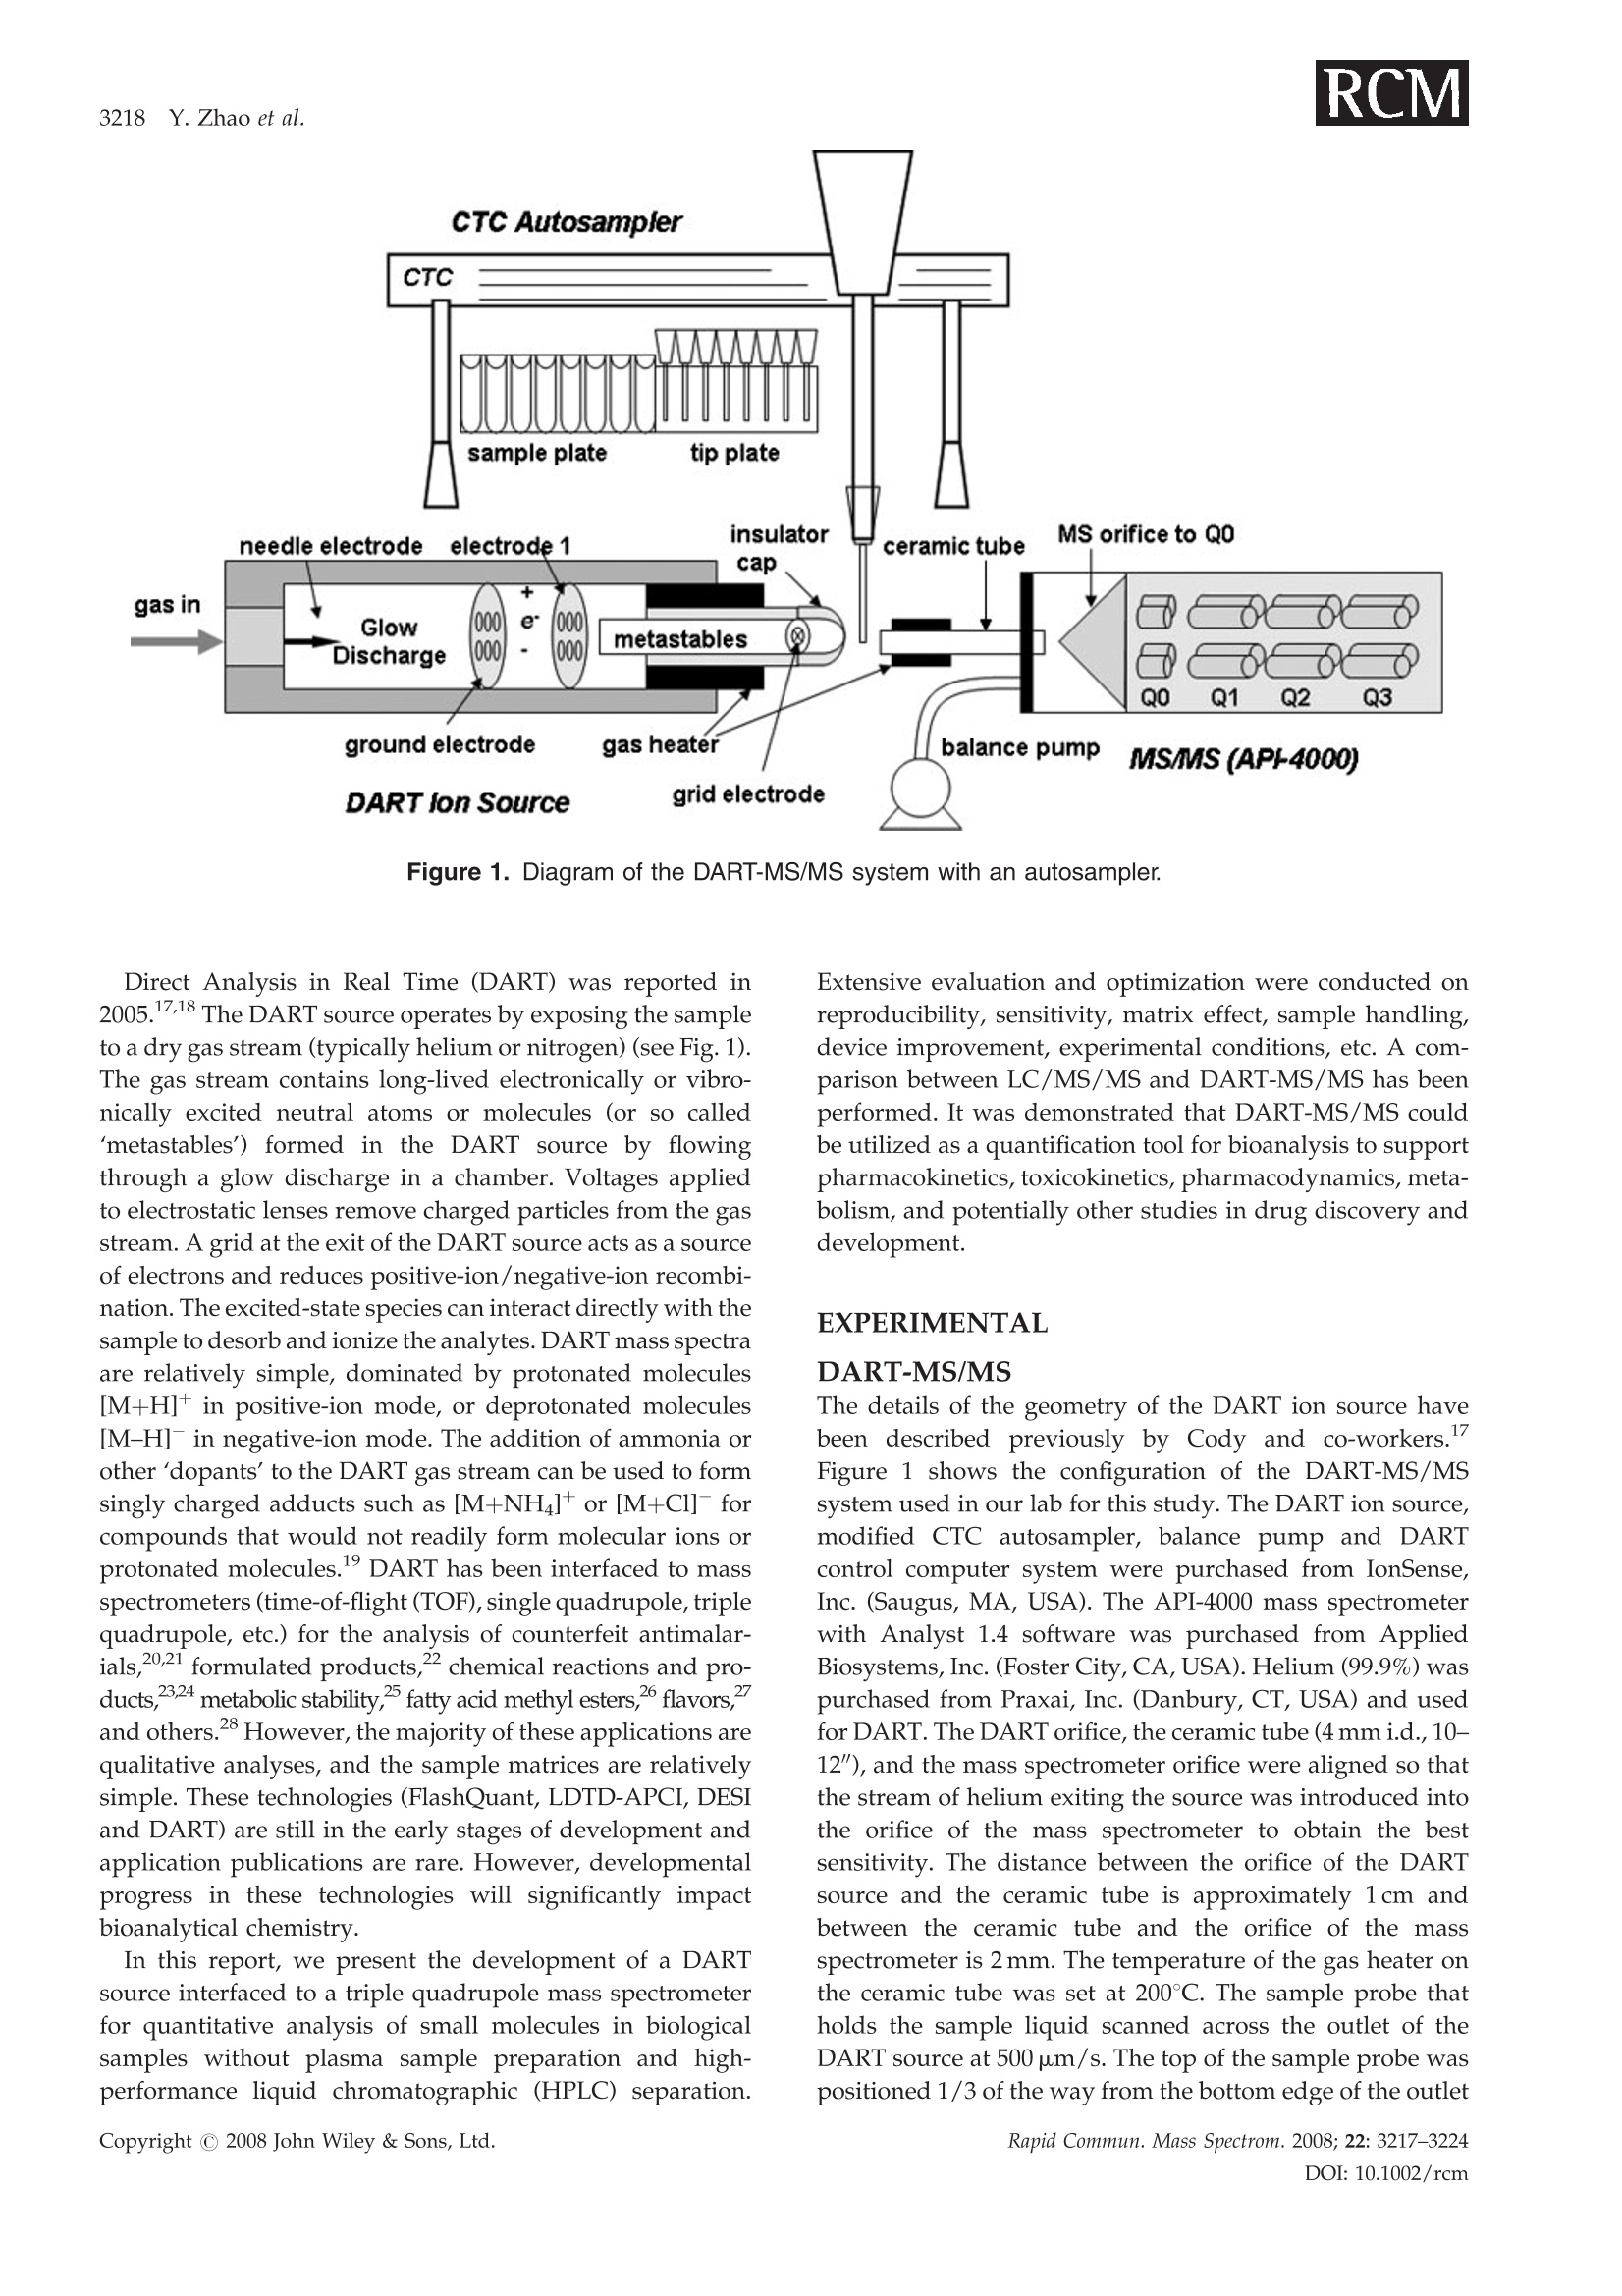
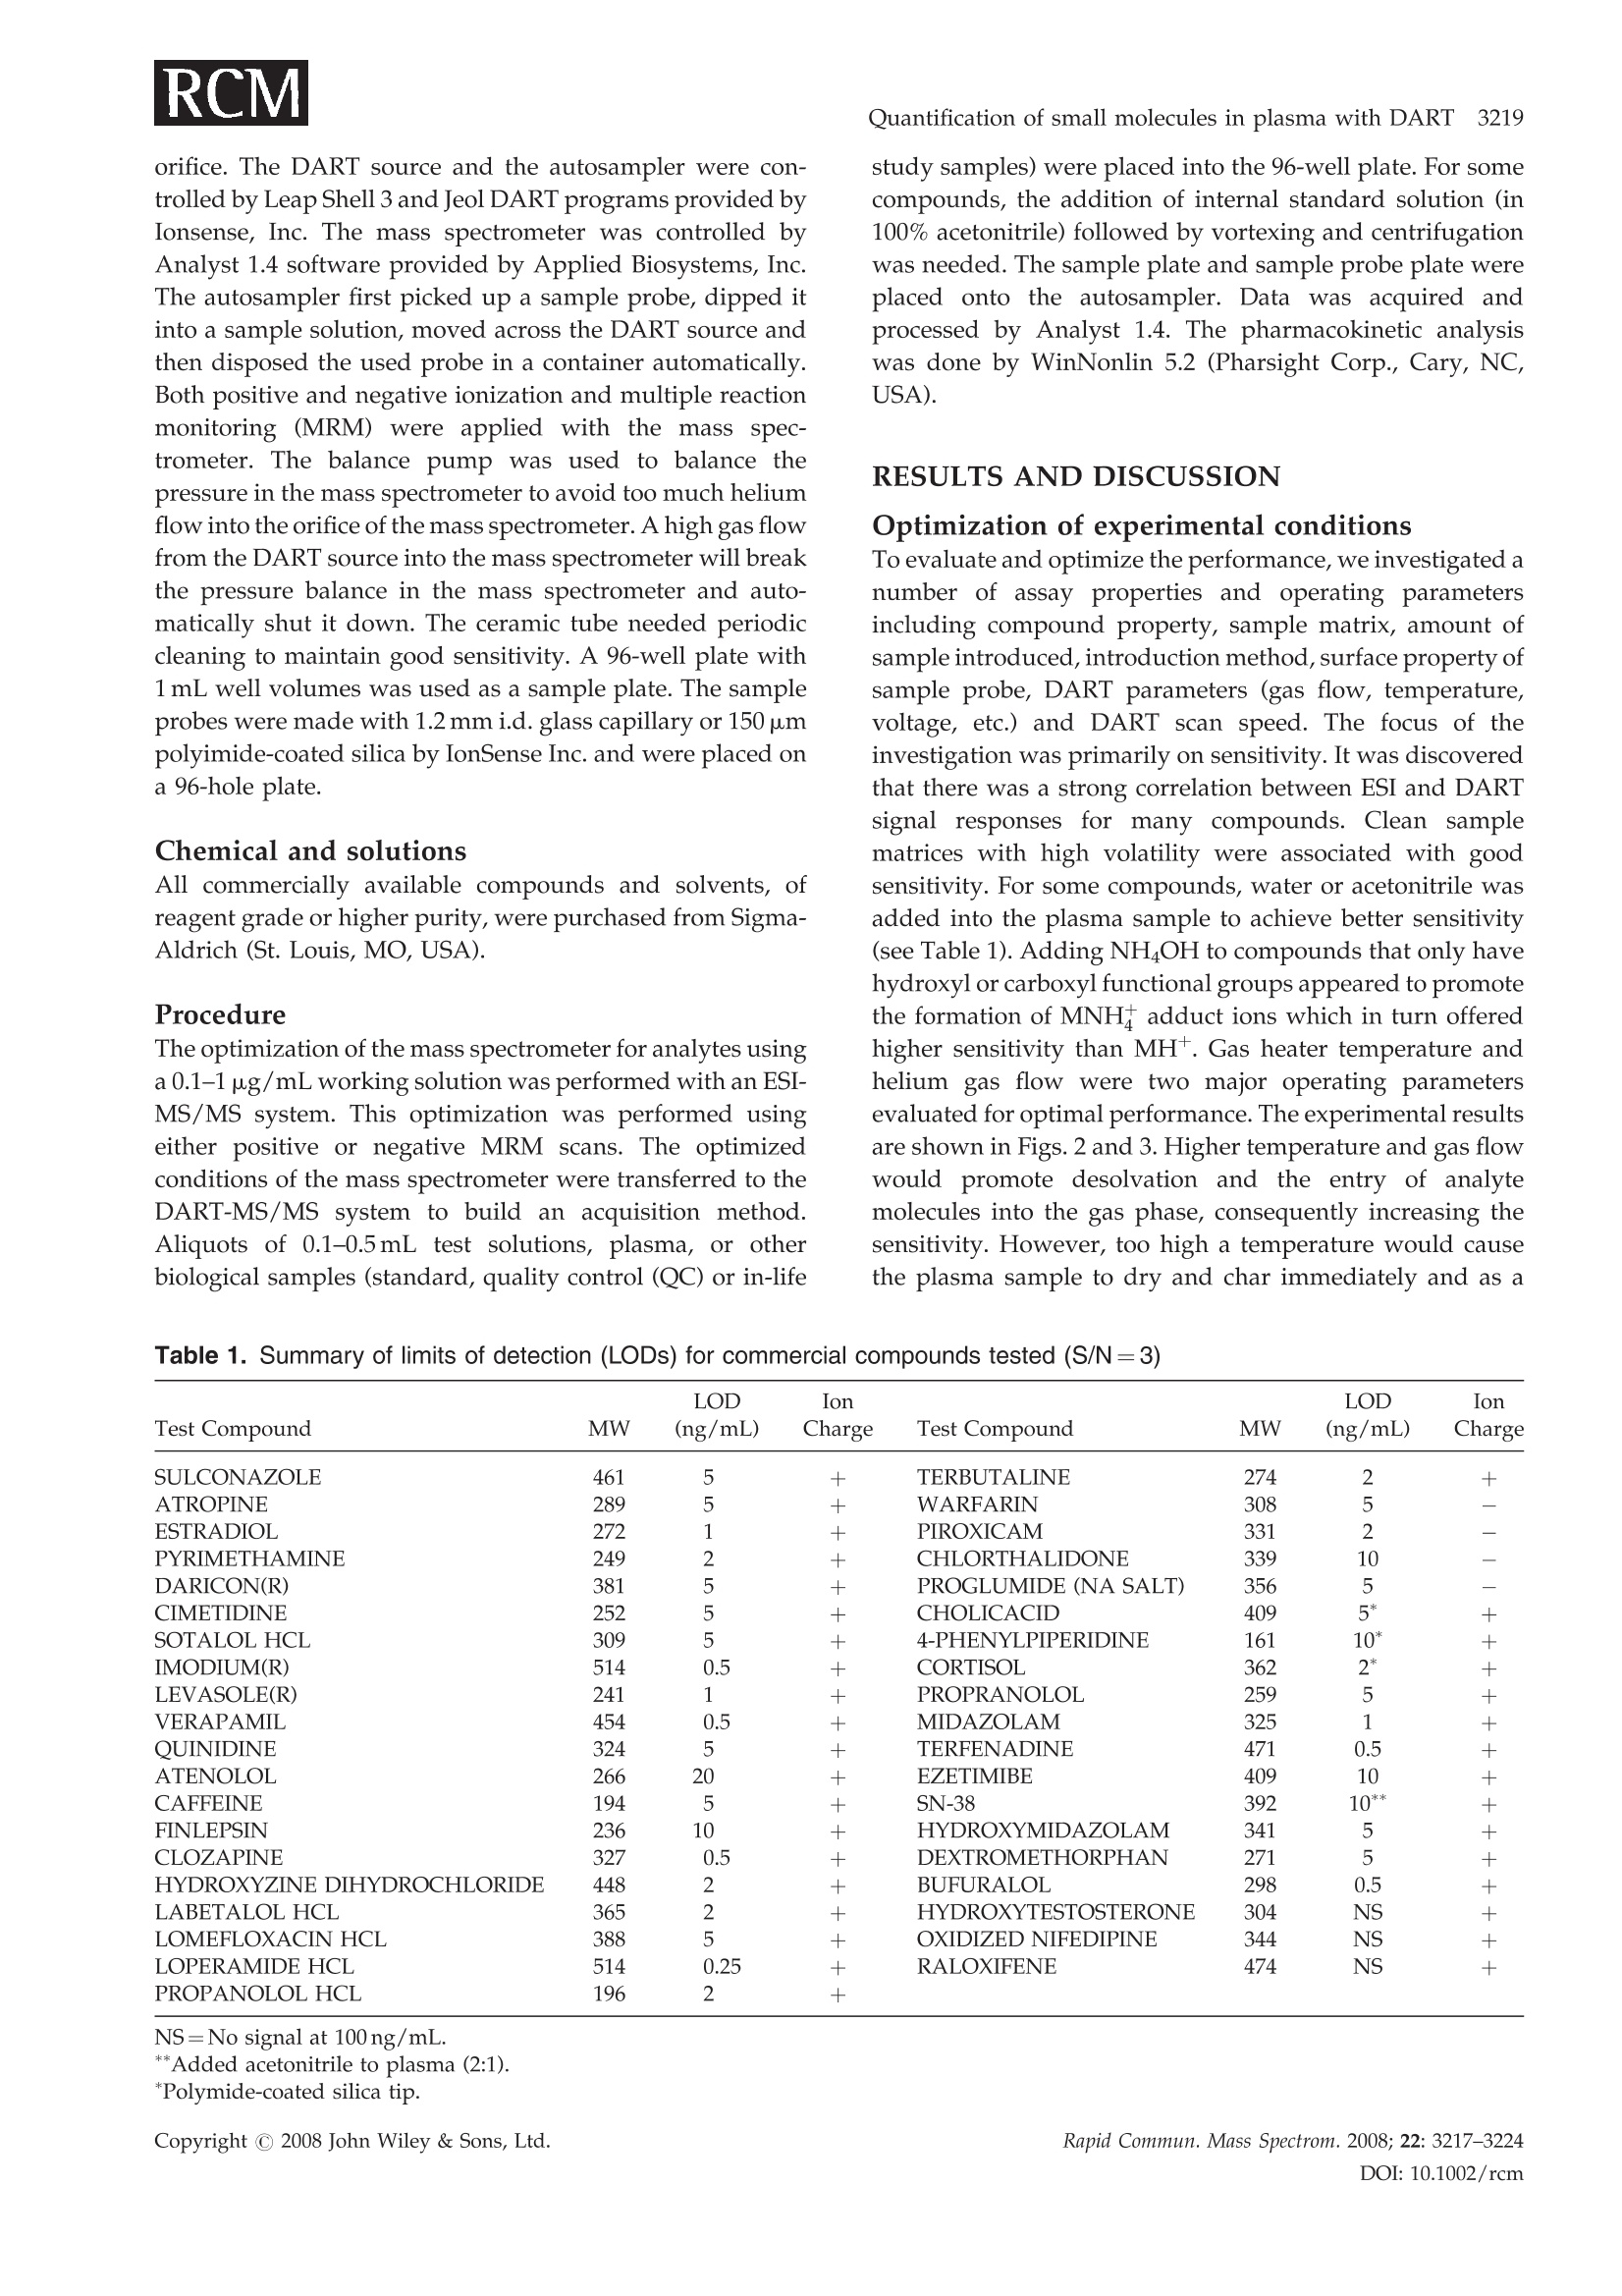
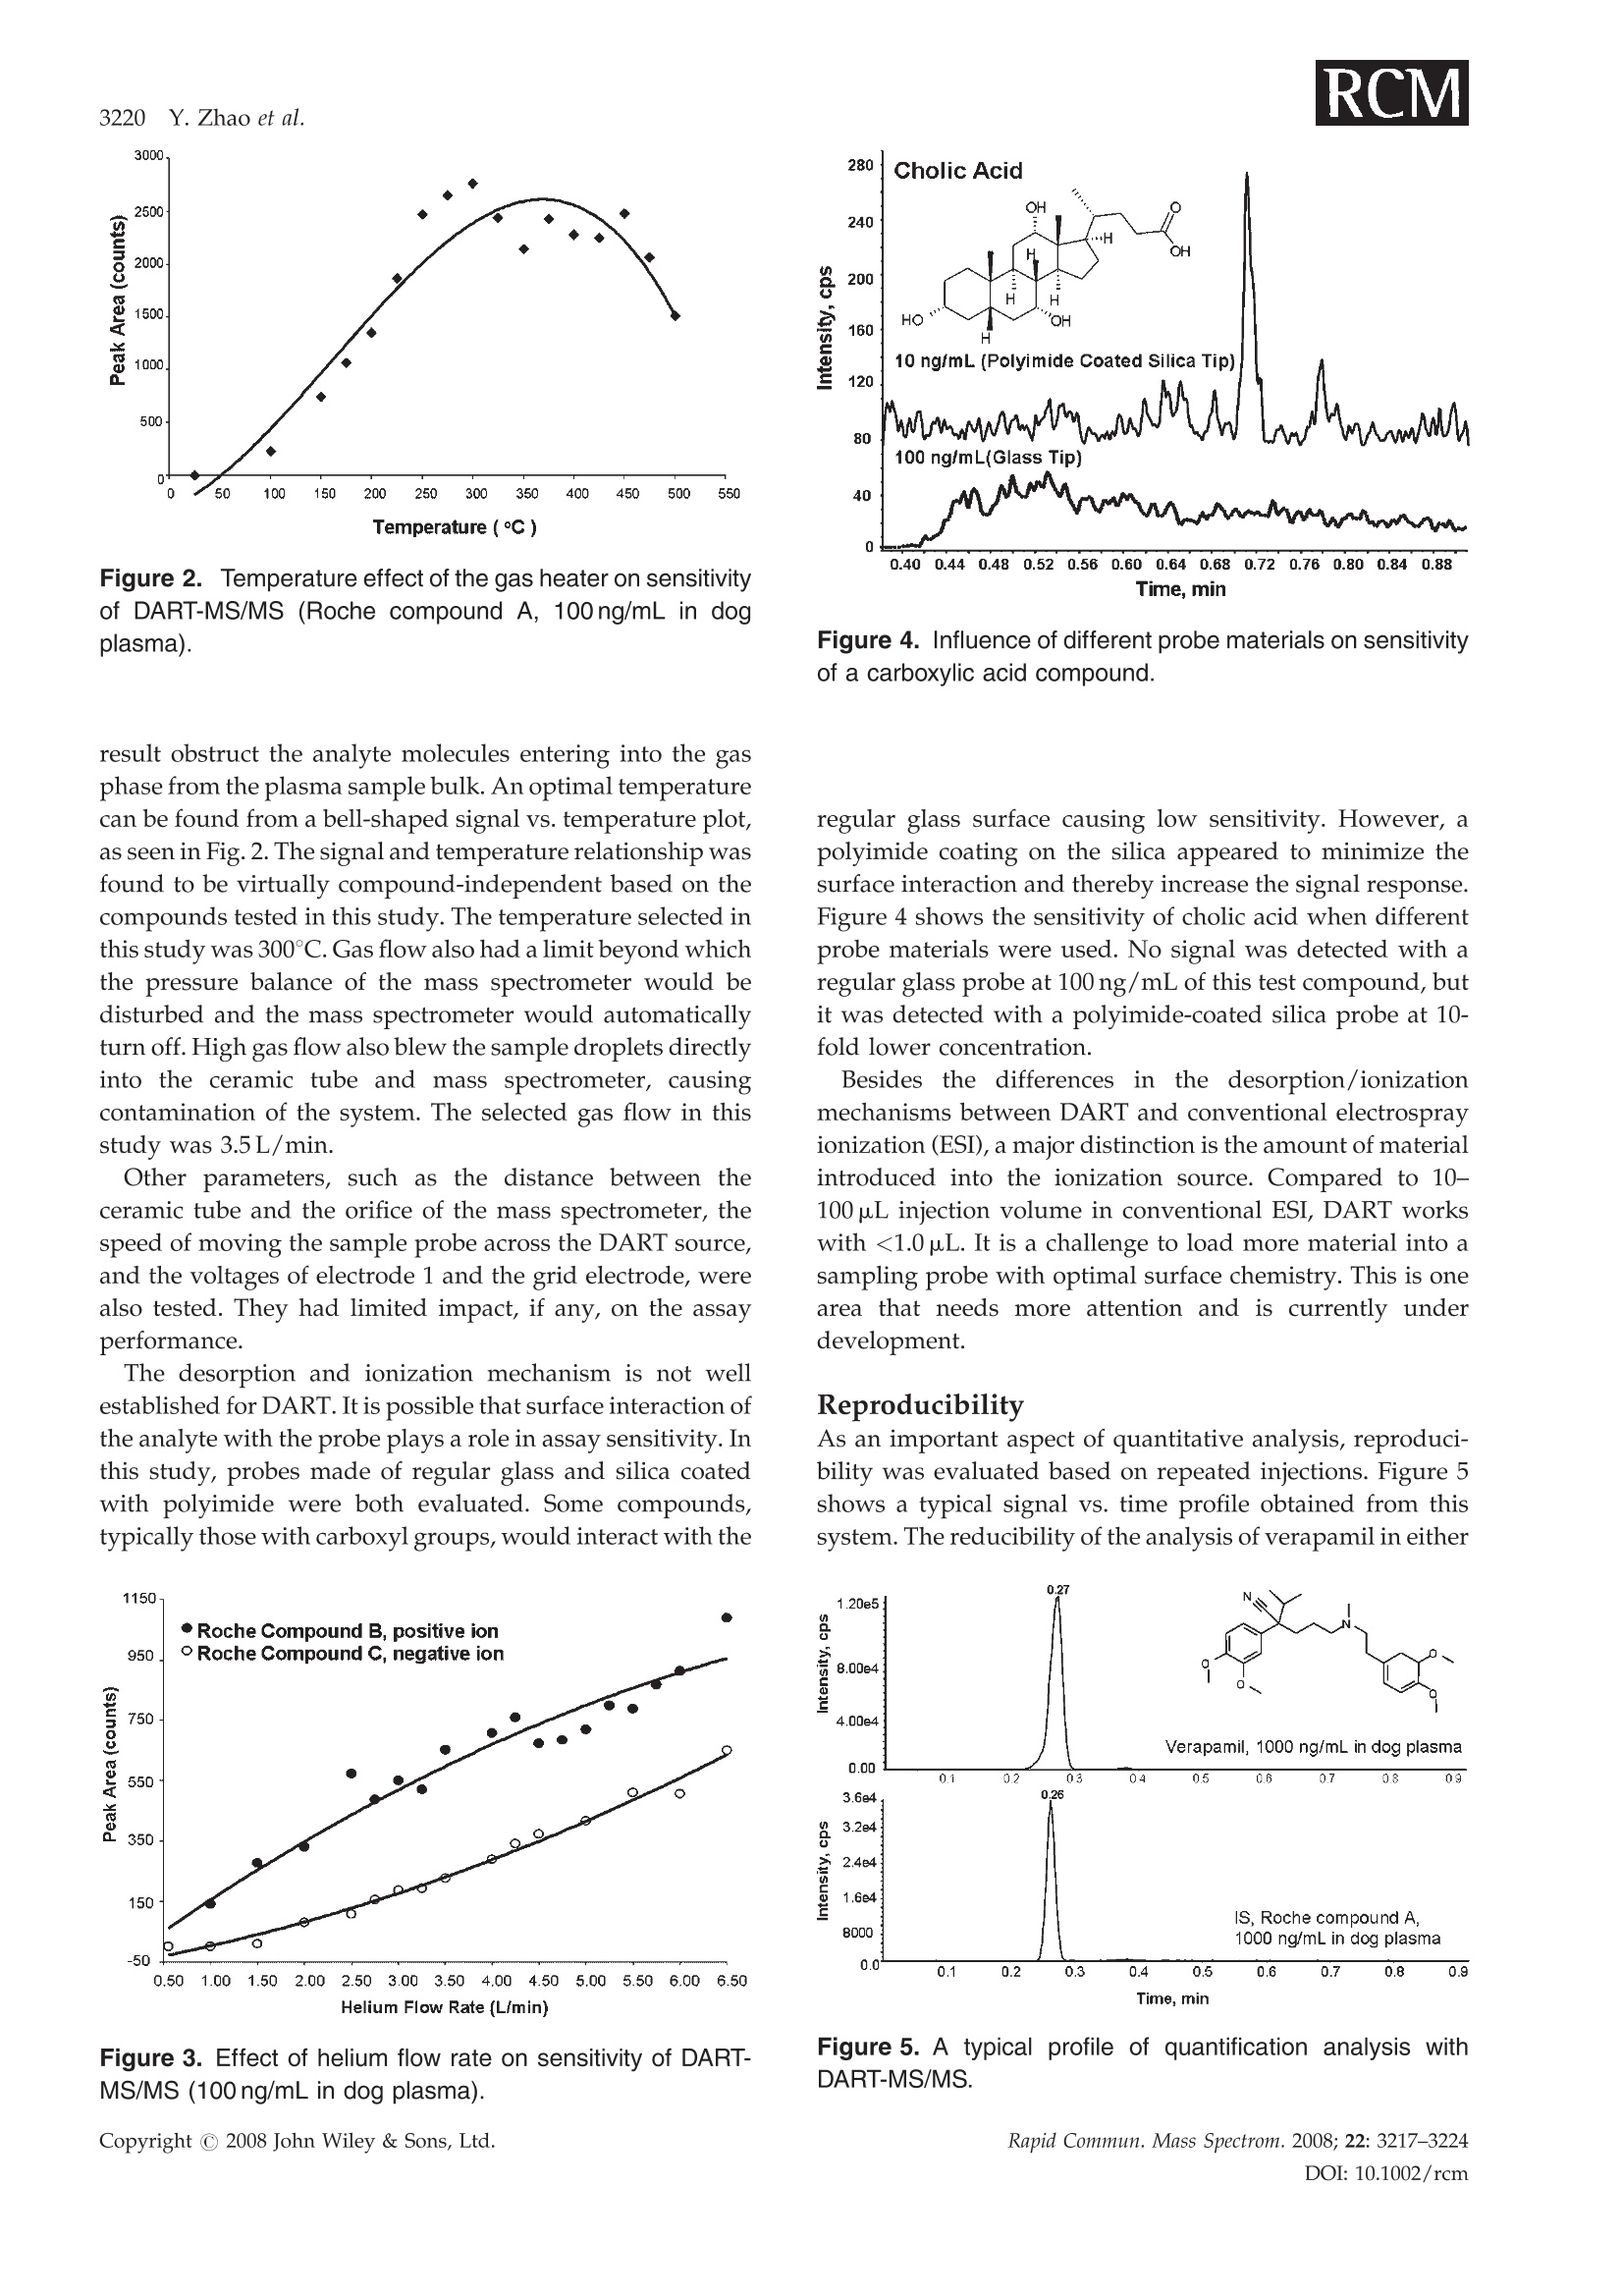
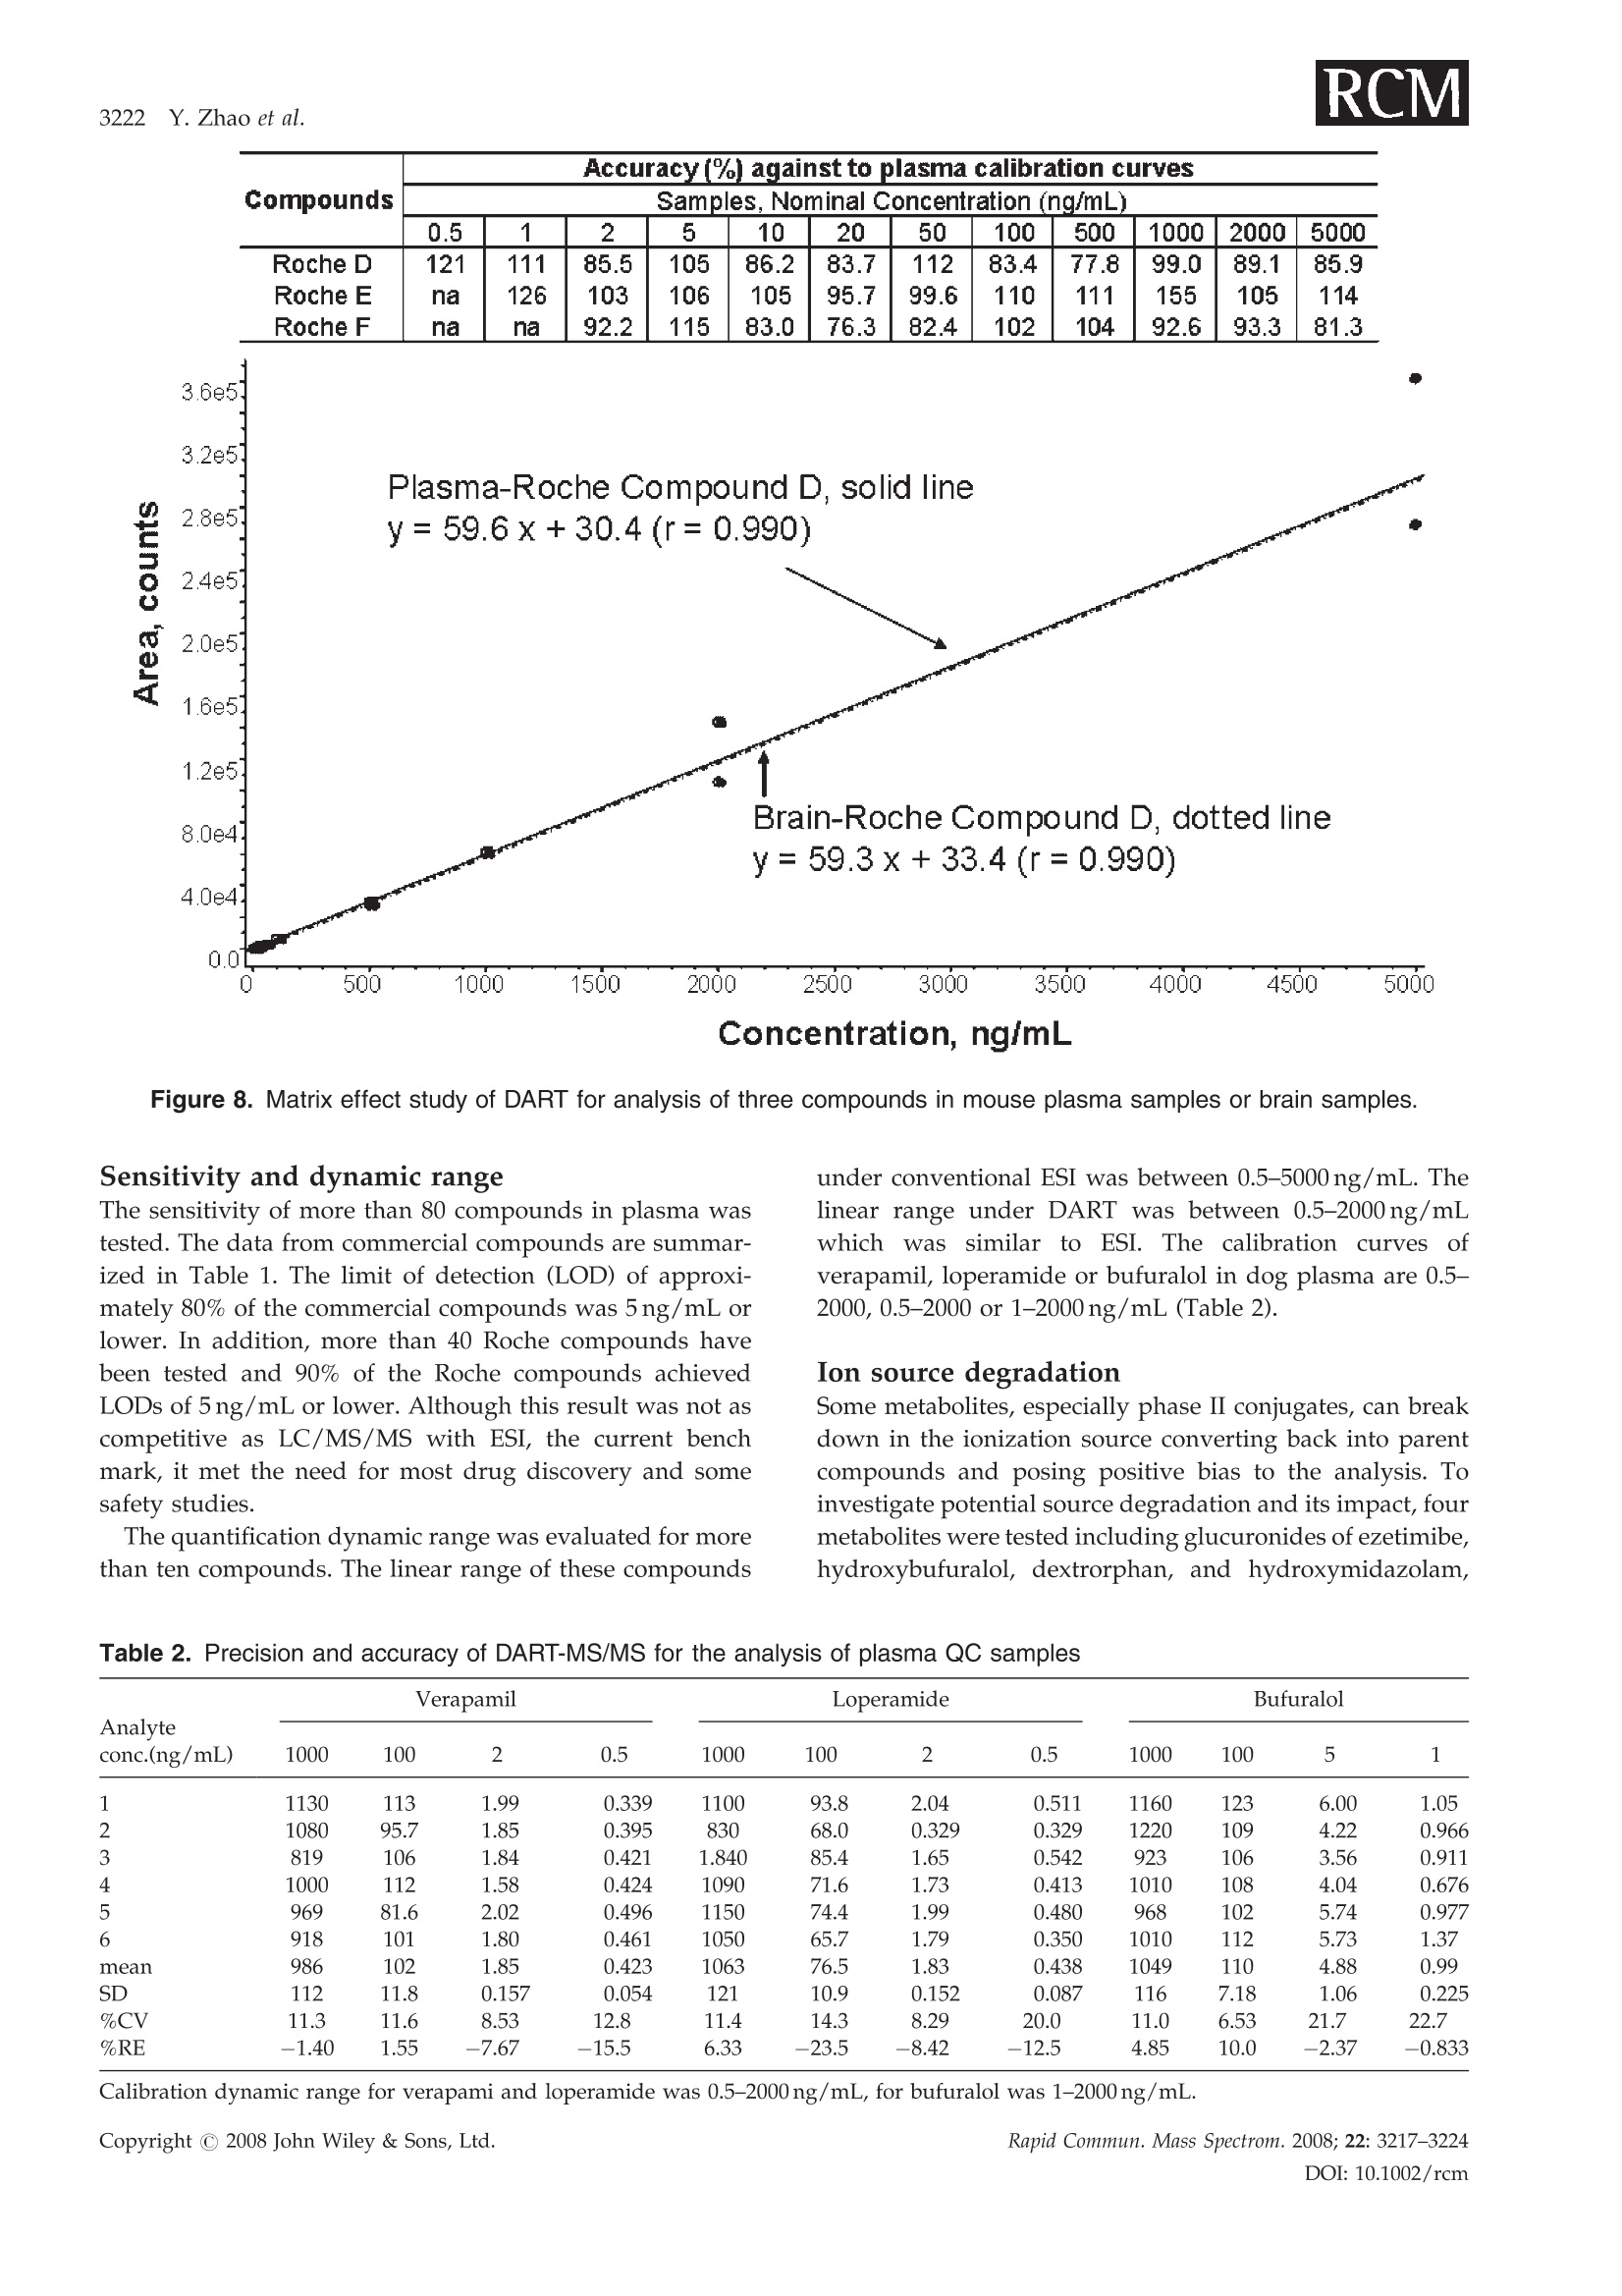
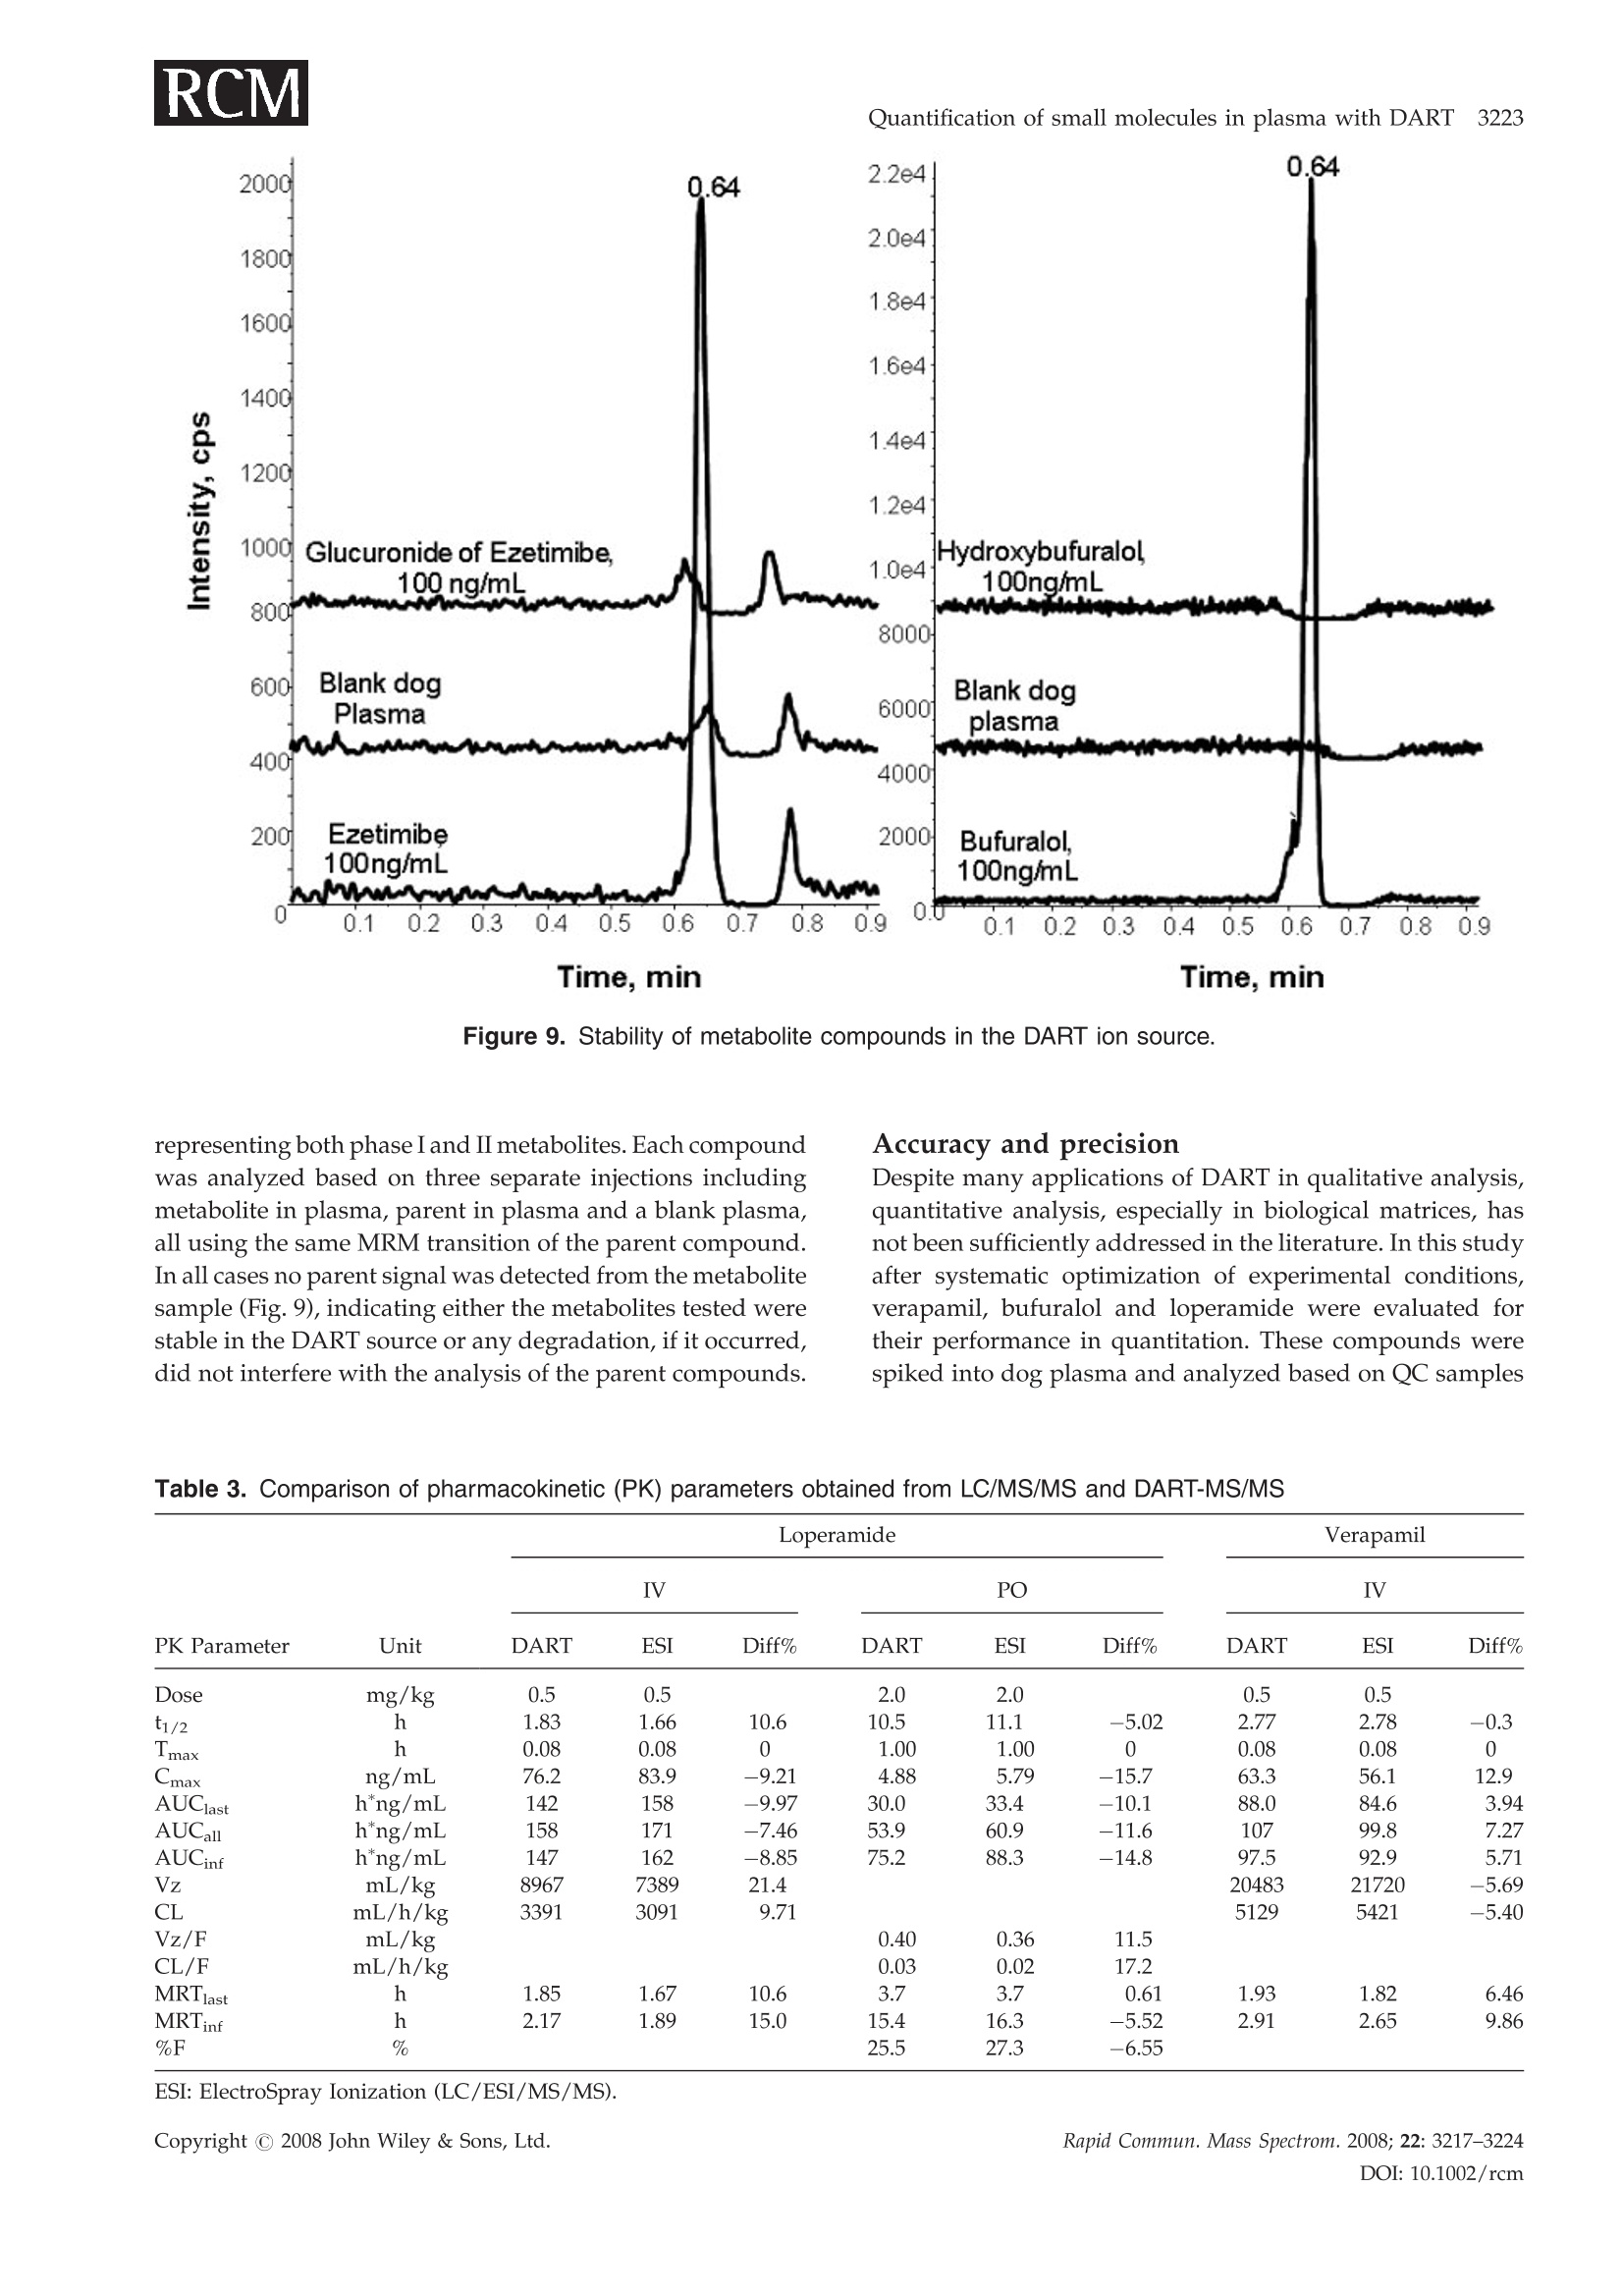
RAPID COMMUNICATIONS IN MASS SPECTROMETRYRapid Commun. Mass Spectrom. 2008; 22: 3217-3224Published online in Wiley InterScience (www.interscience.wiley.com) DOI: 10.1002/rcm.3726 3218 Y.Zhao et al. Quantification of small molecules in plasma withdirect analysis in real time tandem mass spectrometry,without sample preparation and liquidchromatographic separation Yeping Zhao*, Michelle Lam, Danlin Wu and Rowena Mak Department of Drug Metabolism and Pharmacokinetics, Roche Palo Alto, LLC, 3431 Hillview Ave., Palo Alto, CA 94304, USAReceived 15 July 2008; Revised 19 August 2008; Accepted 22 August 2008 Recently, a new ion source, Direct Analysis in Real Time (DART), has been introduced which allowsdirect biological sample introduction into a mass spectrometry (MS) system. The elimination ofconventionally required sample preparation and separation by high-performance liquid chroma-tography (HPLC) prior to MS analysis represents a remarkable opportunity to reduce assay turn-around time, environmental impact and capital/manpower investment. This new technology initiallywas used in various qualitative applications to directly detect chemicals on solid surfaces, in liquidsand gases. In this study, a DART source operating under ambient pressure with ground potential wasinstalled onto a Sciex 4000 tandem mass spectrometer and employed in the sample analysis of plasmabased on direct introduction into the DART-MS/MS system. Reasonable precision and accuracy(%CV and %Error, both <10%) were achieved of a significant number of compounds tested inbiological fluids. In addition, the limit of detection for 80% of the tested compounds reached 5 ng/mLor lower which is sufficient for pharmaceutical drug discovery support. Finally, experimentalconditions that significantly impacted assay performance were investigated with respect to optim-ization and limitation. Because of its simplicity, fast data acquisition (3-5 s) and low cost, DART hasthe potential to significantly impact quantitative pharmaceutical analysis in biological matrices.Copyright C 2008 John Wiley & Sons, Ltd. While conventional liquid chromatography coupled withtandem mass spectrometry (LC/MS/MS) remains thestandard bioanalytical tool, alternative techniques are con-stantly in development to simplify and improve samplehandling and assay throughput. The first such technique, theFlashQuant workstation, was introduced in 2007 and com-bined a matrix-assisted laser desorption/ionization (MALDI)ion source with a triple quadrupole mass spectrometer for fast1-3small molecule analysis.1-3 Although LC separation iseradicated, this system requires extensive sample cleanup. In addition, the sensitivity is moderate. Finally, only asmall number of compounds have been tested with thissystem. The transfer of protons from the matrix reagent(small molecules) of MALDI to large biomolecules likeproteins is efficient, but it may not occur when applied tosmall molecules. It has been used for some early drugdiscovery studies.4 6 The second technique, Laser DiodeThermal Desorption (LDTD), was recently developed.Thisinnovative design induces rapid laser thermal desorption ofthe sample followed by atmospheric pressure chemicalionization (APCI). This ionization system (LDTD-APCI), ( *Correspondence to:Y. Zhao,Department of Drug M etabolism andPharmacokinetics, R oche P a lo A l to, L L C, 3431 Hillview Ave.,Palo Alto, CA 94304, USA. ) ( E-mail: yeping.zhao@roche.com ) coupled with a triple quadrupole mass spectrometer, hasbeen utilized in the determination of sulfonamide residues inmilk, trace analysis in explosives, and reserpine in humanplasma.Nonetheless, the requirement of this technique forsample clean up and the limitations of APCI have yet to befurther evaluated. In addition, the reproducibility of LDTD-APCI-MS/MS results is unknown. Another novel ambientdesorption ionization technique is Desorption ElectroSprayIonization (DESI).11 DESI is carried out by directing apneumatically assisted electrosprayed jet (typically an acidicmixture in methanol/water) onto the sample surface to beanalyzed under atmospheric conditions. The chargeddroplets pick up the sample through interaction with thesurface and then form highly charged ions that can besampled into a mass spectrometer. DESI combined with amass spectrometer has been applied in forensics, chemistryand biology.DESI-MS has also been used to qualitativelyanalyze pharmaceuticals,13 drug formulations,4 biologicaltissues,and drug metabolites in neat solutions and urine.6However, no report onthe quantitative analysis1SOofpharmaceutical compounds in biological fluids with DESI-MS has been published to the best of our knowledge.Likewise, broad comparisons of sensitivity of DESI with ESI,APCI and MALDI for different compounds in biologicalfluids have not been reported. Figure 1. Diagram of the DART-MS/MS system with an autosampler. Direct Analysis in Real Time (DART) was reported in2005.17,18 The DART source operates by exposing the sampleto a dry gas stream (typically helium or nitrogen) (see Fig. 1).The gas stream contains long-lived electronically or vibro-nically excited neutral atoms or molecules (or so calledmetastables') formed in the DART source by flowingthrough a glow discharge in a chamber. Voltages appliedto electrostatic lenses remove charged particles from the gasstream. A grid at the exit of the DART source acts as a sourceof electrons and reduces positive-ion/negative-ion recombi-nation. The excited-state species can interact directly with thesample to desorb and ionize the analytes. DART mass spectraare relatively simple, dominated by protonated molecules[M+H]+ in positive-ion mode, or deprotonated molecules[M-H] in negative-ion mode. The addition of ammonia orother 'dopants' to the DART gas stream can be used to formsingly charged adducts such as [M+NH4]* or [M+Cl] forcompounds that would not readily form molecular ions orprotonated molecules.19DART has been interfaced to massspectrometers (time-of-flight (TOF), single quadrupole, triplequadrupole, etc.) for the analysis of counterfeit antimalar-ials,20.21 formulated products, chemical reactions and pro-ducts,2324 metabolic stability,fatty acid methyl esters,flavors,"and others.28 However, the majority of these applications arequalitative analyses, and the sample matrices are relativelysimple. These technologies (FlashQuant, LDTD-APCI, DESIand DART) are still in the early stages of development andapplication publications are rare. However, developmentalprogress in these technologies will significantly impactbioanalytical chemistry. In this report, we present the development of a DARTsource interfaced to a triple quadrupole mass spectrometerfor quantitative analysis of small molecules in biologicalsamples without plasma sample preparation and high-performance liquid chromatographic (HPLC) separation. Extensive evaluation and optimization were conducted onreproducibility, sensitivity, matrix effect, sample handling,device improvement, experimental conditions, etc. A com-parison between LC/MS/MS and DART-MS/MS has beenperformed. It was demonstrated that DART-MS/MS couldbe utilized as a quantification tool for bioanalysis to supportpharmacokinetics, toxicokinetics, pharmacodynamics, meta-bolism, and potentially other studies in drug discovery anddevelopment. EXPERIMENTAL DART-MS/MS The details of the geometry of the DART ion source havebeen described previously by Cody and co-workers.Figure 1 shows the configuration of the DART-MS/MSsystem used in our lab for this study. The DART ion source,modified CTC autosampler, balance pump and DARTcontrol computer system were purchased from IonSense,Inc. (Saugus, MA, USA). The API-4000 mass spectrometerwith Analyst 1.4 software was purchased from AppliedBiosystems, Inc. (Foster City,CA, USA). Helium (99.9%) waspurchased from Praxai, Inc. (Danbury, CT, USA) and usedfor DART. The DART orifice, the ceramic tube (4 mm i.d., 10-12"), and the mass spectrometer orifice were aligned so thatthe stream of helium exiting the source was introduced intothe orifice of the mass spectrometer to obtain the bestsensitivity. The distance between the orifice of the DARTsource and the ceramic tube is approximately 1cm andbetween the ceramic tube and the orifice of the massspectrometer is 2 mm. The temperature of the gas heater onthe ceramic tube was set at 200°C. The sample probe thatholds the sample liquid scanned across the outlet of theDART source at 500 um/s. The top of the sample probe waspositioned 1/3 of the way from the bottom edge of the outlet orifice. The DART source and the autosampler were con-trolled by Leap Shell 3 and Jeol DART programs provided byIonsense, Inc. The mass spectrometer was controlled byAnalyst 1.4 software provided by Applied Biosystems, Inc.The autosampler first picked up a sample probe, dipped itinto a sample solution, moved across the DART source andthen disposed the used probe in a container automatically.Both positive and negative ionization and multiple reactionmonitoring (MRM) were applied with the mass spec-trometer. The balance pump was used to balance thepressure in the mass spectrometer to avoid too much heliumflow into the orifice of the mass spectrometer. A high gas flowfrom the DART source into the mass spectrometer will breakthe pressure balance in the mass spectrometer and auto-matically shut it down. The ceramic tube needed periodiccleaning to maintain good sensitivity.A 96-well plate with1mL well volumes was used as a sample plate. The sampleprobes were made with 1.2 mm i.d. glass capillary or 150 umpolyimide-coated silica by IonSense Inc. and were placed ona 96-hole plate. Chemical and solutions All commercially available compounds and solvents, ofreagent grade or higher purity, were purchased from Sigma-Aldrich (St. Louis, MO, USA). Procedure The optimization of the mass spectrometer for analytes usinga 0.1-1 ug/mL working solution was performed with an ESI-MS/MS system. This optimization was performed usingeither positive or negative MRM scans. The optimizedconditions of the mass spectrometer were transferred to theDART-MS/MS system to build an acquisition method.Aliquots of 0.1-0.5 mL test solutions, plasma, or otherbiological samples (standard, quality control (QC) or in-life study samples) were placed into the 96-well plate. For somecompounds, the addition of internal standard solution (in100% acetonitrile) followed by vortexing and centrifugationwas needed. The sample plate and sample probe plate wereplaced onto the autosampler. Data was acquired andprocessed by Analyst 1.4. The pharmacokinetic analysiswas done by WinNonlin 5.2 (Pharsight Corp., Cary, NC,USA). RESULTS AND DISCUSSION Optimization of experimental conditions To evaluate and optimize the performance, we investigated anumber of assay properties and operating parametersincluding compound property, sample matrix, amount ofsample introduced,introduction method, surface property ofsample prsanobe, DART parameters (gas flow, temperature,voltage, etc.) and DART scan speed. The focus of theinvestigation was primarily on sensitivity. It was discoveredthat there was a strong correlation between ESI and DARTsignal responses for many compounds. Clean samplematrices with high volatility were associated with goodsensitivity. For some compounds, water or acetonitrile wasadded into the plasma sample to achieve better sensitivity(see Table 1). Adding NH4OH to compounds that only havehydroxyl or carboxyl functional groups appeared to promotethe formation of MNH+ adduct ions which in turn offeredhigher sensitivity than MH*. Gas heater temperature andhelium gas flow were two major operating parametersevaluated for optimal performance. The experimental resultsare shown in Figs. 2 and 3. Higher temperature and gas flowwould promote desolvation andthe entry of analytemolecules into the gas phase, consequently increasing thesensitivity. However, too high a temperature would causethe plasma sample to dry and char immediately and as a Table 1. Summary of limits of detection (LODs) for commercial compounds tested (S/N=3) LOD Ion LOD Ion Test Compound MW (ng/mL) Charge Test Compound MW (ng/mL) Charge SULCONAZOLE 461 5 + TERBUTALINE 274 2 + ATROPINE 289 5 + WARFARIN 308 5 ESTRADIOL 272 1 + PIROXICAM 331 2 一 PYRIMETHAMINE 249 2 + CHLORTHALIDONE 339 10 DARICON(R) 381 5 + PROGLUMIDE (NA SALT) 356 5 CIMETIDINE 252 5 CHOLICACID 409 5* 十 SOTALOL HCL 309 5 十 4-PHENYLPIPERIDINE 161 10* 十 IMODIUM(R) 514 0.5 + CORTISOL 362 2* LEVASOLE(R) 241 1 + PROPRANOLOL 259 5 + VERAPAMIL 454 0.5 + MIDAZOLAM 325 1 + QUINIDINE 324 5 + TERFENADINE 471 0.5 + ATENOLOL 266 20 + EZETIMIBE 409 10 + CAFFEINE 194 5 + SN-38 392 10** + FINLEPSIN 236 10 + HYDROXYMIDAZOLAM 341 5 + CLOZAPINE 327 0.5 + DEXTROMETHORPHAN 271 5 十 HYDROXYZINE DIHYDROCHLORIDE 448 2 + BUFURALOL 298 0.5 十 LABETALOL HCL 365 2 + HYDROXYTESTOSTERONE 304 NS + LOMEFLOXACIN HCL 388 5 + OXIDIZED NIFEDIPINE 344 NS + LOPERAMIDE HCL 514 0.25 + RALOXIFENE 474 NS + PROPANOLOL HCL 196 2 + NS=No signal at 100 ng/mL. **Added acetonitrile to plasma (2:1). *Polymide-coated silica tip. Figure 2. Temperature effect of the gas heater on sensitivityof DART-MS/MS (Roche compound A, 100ng/mL in dogplasma). result obstruct the analyte molecules entering into the gasphase from the plasma sample bulk. An optimal temperaturecan be found from a bell-shaped signal vs. temperature plot,as seen in Fig. 2. The signal and temperature relationship wasfound to be virtually compound-independent based on thecompounds tested in this study. The temperature selected inthis study was 300℃. Gas flow also had a limit beyond whichthe pressure balance of the mass spectrometer would bedisturbed and the mass spectrometer would automaticallyturn off. High gas flow also blew the sample droplets directlyinto the ceramic tube and mass spectrometer, causingcontamination of the system. The selected gas flow in thisstudy was 3.5 L/min. Other parameters, such as the distance between theceramic tube and the orifice of the mass spectrometer, thespeed of moving the sample probe across the DART source,and the voltages of electrode 1 and the grid electrode, werealso tested.They had limited impact, if any, on the assayperformance. The desorption and ionization mechanism is not wellestablished for DART.It is possible that surface interaction ofthe analyte with the probe plays a role in assay sensitivity. Inthis study, probes made of regular glass and silica coatedwith polyimide were both evaluated. Some compounds,typically those with carboxyl groups, would interact with the Figure 3. Effect of helium flow rate on sensitivity of DART-MS/MS (100 ng/mL in dog plasma).Copyright C 2008 John Wiley & Sons, Ltd. Figure 4. Influence of different probe materials on sensitivityof a carboxylic acid compound. regular glass surface causing low sensitivity. However, apolyimide coating on the silica appeared to minimize thesurface interaction and thereby increase the signal response.Figure 4 shows the sensitivity of cholic acid when differentprobe materials were used. No signal was detected with aregular glass probe at 100 ng/mL of this test compound, butit was detected with a polyimide-coated silica probe at 10-fold lower concentration. Besides the differences in the desorption/ionizationmechanisms between DART and conventional electrosprayionization (ESI), a major distinction is the amount of materialintroduced into the ionization source. Compared to 10-100 pL injection volume in conventional ESI, DART workswith <1.0pL. It is a challenge to load more material into asampling probe with optimal surface chemistry. This is onearea that needs more attention and is currently underdevelopment. Reproducibility As an important aspect of quantitative analysis, reproduci-bility was evaluated based on repeated injections. Figure 5shows a typical signal vs. time profile obtained from thissystem. The reducibility of the analysis of verapamil in either Figure 5. A typical profile of quantification analysis withDART-MS/MS. a neat solution of water/acetonitrile (50:50) or dog plasmahas been tested with the DART-MS/MS system. No internalstandard was used in the experiment. Interestingly, thereproducibility of plasma samples was much better than thatof neat solutions. The %CV of a neat solution at 1ug/mLbased on eight injections was 21.7%, while for plasmasamples the %CV was 5.86% based on eleven injections. It ispossible that sample viscosity influences the reproducibilityin this probe-based sample presentation. During sampleevaporation and adsorption, it is speculated that the shape/size of the sample liquid film coated on the probe (whichcontribute to signal response) constantly change as a result ofgravity. A high viscosity sample, less affected by gravity,tends to maintain better consistency in liquid shape/sizebetween samples and therefore is associated with lowervariability. It was not necessary to use an internal standardfor plasma analysis because the possibility of samplepreparation or instrument variability is very low due tothe simple and fast process. The precision test for verapamilin plasma with and without the internal standard (IS) (not aradiolabeled compound of the analyte) has been carried out;the data indicated that the IS did not improve the precision ofplasma sample analysis. However, an IS should be helpful ifit is a radiolabeled compound of the test compound or undercertain circumstances such as samples containing significantamounts of organic solvent. Matrix effect Matrix effect, of which ion suppression is a large contributor,is a major disadvantage of the ESI process. In DART thiseffect was also observed in plasma samples when comparedto a neat solution. A difference in sensitivity of verapamil in aneat solution vs. in dog plasma was observed. The peakheight of the analyte with an identical concentration in the neatsolution was approximately 20-fold higher than in the plasmasample. Two tests were performed to understand the matrixeffect. The results are given in Fig. 6. First, 100ng/mLverapamil in dog plasma was diluted with water to 50, 35, 25and 20ng/mL. The signal response decreased with concen-tration due to dilution. However, the decrease was notproportional to the concentration decease due to theaccompanying reduction in matrix effect. The signal onlydecreased 26% and 38% when the concentrations decreasedto 50% and 20%. In the second test, the same amount ofverapmail (fixed final concentration 100ng/mL) was spiked Figure 6. Matrix effect of DART for analysis of verapamil insamples by varying water content. Figure 7. Matrix effect of DART for analysis of verapamil insamples with different volatility(n=6). into plasma/water at varying % water (ranging from 0-80%).Sensitivity significantly increased 3.5-fold with an increase inwater content up to 80%, suggesting the presence of a matrixeffect and a way of reducing it based on dilution with water.This result indicated that the matrix effect on DART waslower and the sensitivity was higher for clean samples, thesame as an ESI source. Figure 7 shows the data from the testof the sensitivity for verapamil in solutions with differentvolatility and viscosity and similar matrix composition. Thisresult proved that high volatility and low viscosity are goodfor the sensitivity of DART. As we mentioned before, lowvolatility and high viscosity are favorable for reproducibility,but unfavorable for the sensitivity. Therefore, a clean samplewith appropriate volatility and viscosity will provide high-quality data in DART analysis Measurement of drug concentration in the brain isnecessary in the drug development of central nervoussystem (CNS) disorders. Ideally, it is desirable to quantifybrain drug level based on a plasma calibration curve toreduce workload (plasma is always measured anyway). Thiswould require the matrix effect being the same between thetwo matrices. However, it is common to see more significantbrain matrix effect than plasma in conventional LC/MS/MSunder ESI or even APCI. To investigate whether DARTwould offer any benefit in this matrix compatibility, weevaluated three CNS compounds based on a commoncalibration curve constructed in mouse plasma against whichmouse brain samples (same concentration levels as plasmacalibrants) were measured. The data are given in Fig. 8. Theindividually back-calculated brain values displayed notice-able variability, but the bias from nominal was both positiveand negative, indicating a random variability rather thandifference between matrices. After regression, the calibrationcurves of plasma and brain virtually overlapped, indicating astrong similarity in signal response between the two matricesunder the experimental conditions. Compounds Accuracy(%) against to plasma calibration curves Samples, Nominal Concentration (ng/mL) 0.5 1 2 5 10 20 50 100 500 1000 2000 5000 Roche DRoche E Roche F 121na na 111126na 85.510392.2 105106115 86.210583.0 83.795.776.3 11299.682.4 83.4110102 77.8111104 99.015592.6 89.1105 93.3 85.9114 81.3 Concentration, ng/mL Figure 8. Matrix effect study of DART for analysis of three compounds in mouse plasma samples or brain samples. Sensitivity and dynamic range The sensitivity of more than 80 compounds in plasma wastested. The data from commercial compounds are summar-ized in Table 1. The limit of detection (LOD) of approxi-mately 80% of the commercial compounds was 5ng/mL orlower. In addition, more than 40 Roche compounds havebeen tested and 90% of the Roche compounds achievedLODs of 5ng/mL or lower. Although this result was not ascompetitive as LC/MS/MS with ESI, the current benchmark, it met the need for most drug discovery and somesafety studies. The quantification dynamic range was evaluated for morethan ten compounds. The linear range of these compounds under conventional ESI was between 0.5-5000 ng/mL. Thelinear range under DART was between 0.5-2000ng/mLwhich was similar to ESI. The calibration curves ofverapamil, loperamide or bufuralol in dog plasma are 0.5-2000, 0.5-2000 or 1-2000ng/mL (Table 2). Ion source degradation Some metabolites, especially phase II conjugates, can breakdown in the ionization source converting back into parentcompounds and posing positive bias to the analysis. Toinvestigate potential source degradation and its impact, fourmetabolites were tested including glucuronides of ezetimibe,hydroxybufuralol, dextrorphan, and hydroxymidazolam, Table 2. Precision and accuracy of DART-MS/MS for the analysis of plasma QC samples Analyte conc.(ng/mL) Verapamil Loperamide Bufuralol 1000 100 2 0.5 1000 100 2 0.5 1000 100 5 1 1 1130 113 1.99 0.339 1100 93.8 2.04 0.511 1160 123 6.00 1.05 2 1080 95.7 1.85 0.395 830 68.0 0.329 0.329 1220 109 4.22 0.966 3 819 106 1.84 0.421 1.840 85.4 1.65 0.542 923 106 3.56 0.911 4 1000 112 1.58 0.424 1090 71.6 1.73 0.413 1010 108 4.04 0.676 5 969 81.6 2.02 0.496 1150 74.4 1.99 0.480 968 102 5.74 0.977 6 918 101 1.80 0.461 1050 65.7 1.79 0.350 1010 112 5.73 1.37 mean 986 102 1.85 0.423 1063 76.5 1.83 0.438 1049 110 4.88 0.99 sD 112 11.8 0.157 0.054 121 10.9 0.152 0.087 116 7.18 1.06 0.225 %CV 11.3 11.6 8.53 12.8 11.4 14.3 8.29 20.0 11.0 6.53 21.7 22.7 %RE -1.40 1.55 -7.67 -15.5 6.33 -23.5 -8.42 -12.5 4.85 10.0 -2.37 -0.833 Calibration dynamic range for verapami and loperamide was 0.5-2000 ng/mL, for bufuralol was 1-2000 ng/mL. 2.2e4. 0.64 Figure 9. Stability of metabolite compounds in the DART ion source. representing both phase I and II metabolites. Each compoundwas analyzed based on three separate injections includingmetabolite in plasma, parent in plasma and a blank plasma,all using the same MRM transition of the parent compound.In all cases no parent signal was detected from the metabolitesample (Fig.9), indicating either the metabolites tested werestable in the DART source or any degradation, if it occurred,did not interfere with the analysis of the parent compounds. Accuracy and precision Despite many applications of DART in qualitative analysis,quantitative analysis, especially in biological matrices, hasnot been sufficiently addressed in the literature. In this studyafter systematic optimization of experimental conditions,verapamil, bufuralol and loperamide were evaluated fortheir performance in quantitation. These compounds werespiked into dog plasma and analyzed based on QC samples Table 3. Comparison of pharmacokinetic (PK) parameters obtained from LC/MS/MS and DART-MS/MS Loperamide Verapamil IV PO IV PK Parameter Unit DART ESI Diff% DART ESI Diff% DART ESI Diff% Dose mg/kg 0.5 0.5 2.0 2.0 0.5 0.5 t1/2 1.83 1.66 10.6 10.5 11.1 -5.02 2.77 2.78 -0.3 T1 max 0.08 0.08 0 1.00 1.00 0 0.08 0.08 0 Cmax ng/mL 76.2 83.9 -9.21 4.88 5.79 -15.7 63.3 56.1 12.9 AUClast h*ng/mL 142 158 -9.97 30.0 33.4 -10.1 88.0 84.6 3.94 AUCall h*ng/mL 158 171 -7.46 53.9 60.9 -11.6 107 99.8 7.27 AUCinf h*ng/mL 147 162 -8.85 75.2 88.3 -14.8 97.5 92.9 5.71 mL/kg 8967 7389 21.4 20483 21720 -5.69 mL/h/kg 3391 3091 9.71 5129 5421 -5.40 Vz/F mL/kg 0.40 0.36 11.5 CL/F mL/h/kg 0.03 0.02 17.2 MRTlast 1.85 1.67 10.6 3.7 3.7 0.61 1.93 1.82 6.46 MRTinf 2.17 1.89 15.0 15.4 16.3 -5.52 2.91 2.65 9.86 %F 25.5 27.3 -6.55 ESI: ElectroSpray Ionization (LC/ESI/MS/MS). consisting of four concentration levels and calibration curves.The accuracy and precision were assessed and data aresummarized in Table 2. The data indicated that the precisionand accuracy meet the acceptance criteria for a quantificationanalysis to support discovery studies. The DART-MS/MSsystem should be able to be applied to quantitative analysisfor biological samples. Application of DART-MS/MS DART-MS/MS has been used for significant numbers ofpharmacokinetic and metabolism studies. The results fromDART-MS/MS have been compared with the data obtainedfrom LC/MS/MS. Table 3 shows some of these data. Acomparison of the metabolic stability data obtained by DART-MS/MS and LC/MS/MS has been done. The study resultsindicated that the pharmacokinetic parameters and profilesfrom DART-MS/MS and LC/MS/MS were very similar. CONCLUSIONS The DART-MS/MS system has demonstrated some advan-tages, for example, no sample preparation and LC separ-ation, over conventional LC/MS/MS in drug research;especially in bioanalytical support of discovery and earlydevelopment programs where simplicity and operatingspeed are a premium. The eradication of sample extractionand LC separation allowed rapid turnover. The analysis timefor a sample with DART-MS/MS is about 54s, but withconventional LC/MS/MS is from 3-5 min. However, theinstrument run time currently is limited by the cycle time(35-45s) of the autosampler designed for conventional LC/MS/MS. A new probe arrangement (four tips) is currentlyunder development aiming at much speedier sampleintroduction in order to be compatible with the DART scantime (5-10s). This new probe will allow four samples to beanalyzed in 54 s. The capital investment is low because theion source can be installed onto most existing MS/MSsystems. An added environmental benefit is the eliminationof the use of LC mobile phase. Some common difficultiesassociated with LC/MS/MS such as carryover, contami-nation and peak shape integrity are also removed. DART-MS/MS is less sensitive than LC/MS/MS and has difficultyin solving the matrix effect for some special samples at thistime. However, since DART-MS/MS is new, this is the firstpublication about its application of quantitative analysis forbiological samples, these problems will beovercome whenthis technology is improved. DART-MS/MS is a novel systemstill under development. An in-depth study needs to beperformed to understand why some compounds cannot beionized in DART. In addition, sensitivity needs to be improvedfor more general use in late-stage drug development. Acknowledgements We wish to thank Dr. Jing-Tao Wu at Millennium Pharma-ceuticals, Inc., for helpful discussions and scientific insights. We would also like to thank Dr. Brian Musselman at Ionsens,Inc., for the excellent technical support. REFERENCES 1. http://www3.appliedbiosystems.com/cms/groups/psm_marketing/documents/generaldocuments/cms_043663.pdf. 2. AlaryJ, Scott G, Zhong F, Corr J. Proc.55th ASMS Conf.MassSpectrometry and Allied Topics, Indianapolis, Indiana, June 3-7,2007. 3.Sasaki T,LeBlanc Y. Proc.55th ASMS Conf. Mass Spectrometryand Allied Topics, Indianapolis, Indiana, June 3-7, 2007. 4. Hoffman T, Zhong F, Ghobarah H, Lebre D, Scott G, Corr J.Proc. 55th ASMS Conf. Mass Spectrometry and Allied Topics,Indianapolis, Indiana, June 3-7, 2007. 5. Zhong F, Ghobarah H, Lebre D, Scott G, Impey G, Corr J.Proc. 55th ASMS Conf. Mass Spectrometry and AlA1lied Topics,Indianapolis, Indiana, June 3-7, 2007. 6. Zhong F, Ghobarah H, Scott G, Lebre D. The ApplicationNotebook, Applied Biosystems/MDS SCIEX, September 24,2007. 7. http://www.phytronix.com/eng/about-phytronix/about-phytronix.asp. 8. Tremblay P, Picard P, Gagnon L, Forter S. Proc. 55th ASMSConf. Mass Spectrometry and Allied Topics, Indianapolis,Indi-ana, June 3-7, 2007. 9. Picard P, Tremblay P, Gagnon L, Forter S. Proc. 55th ASMSConf. Mass Spectrometry and Allied Topics, Indianapolis, Indi-ana, June 3-7, 2007. 10..LLacoursiere J, Tremblay P, Picard PS. Proc. 55th ASMS Conf.Mass Spectrometry and Allied Topics, Indianapolis, Indiana,June 3-7,2007. 11. Takats Z, Wiseman JM, Gologan B, Cook RG. Science 2004;306:471. 12. Takats Z, Wiseman JM, Cooks RG. J. Mass Spectrom. 2005;40:1261. 13. Chen H, Talaty NN, Takats Z, Cooks RG. Anal. Chem. 2005;77:6915. 14. Weston DJ, Bateman R, Wilson ID, Wood TR, Creaser CS.Anal. Chem. 2005;77: 7572. 15. Wiseman JM, Puolitaival SM, Takats Z, Cooks RG, CaprioliRM. Angew. Chem.2005;44:7094. 16. Kauppila TJ, Wiseman JM, Ketola RA, Kotiaho T, Cooks RG,Kostiainen R. Rapid Commun. Mass Spectrom. 2006; 20:387. 17. Cody R, LarameeJ, Durst H. Anal. Chem. 2005; 77:2297. 18. http://www.jeol.com/PRODUCTS/AnalyticalInstruments/MassSpectrometers/AccuTOFDART/tabid/141/Default.aspx. 19. Cody R, Laramee J, Nills J, Durst H. JEOL News 2005; 40: 8. 20. Nyadong L, Hampton C, Leung H, Newton P, Green M,De Jesus V, Fernandez FM. Proc. 54th ASMS Conf. MassSpectrometry and Allied Topics, Seattle, WA. May 28-June 1,2006. 21. Fernandez FM, Cody RB, Green M, Hampton C,McGreadyR, Sengaloundeth S, White NJ, Newton P. Chem. Med. Chem.2006;1: 702. 22. Marcus A, New A. Presented at the 54th Meeting of theAmerican Society for Mass Spectrometry, Seattle, WA. May28-June 1, 2006. 23. Gomez M. Presented at the 54"Meeting of the American Societyfor Mass Spectrometry, Seattle, WA, May 28-June 1, 2006. 24. Petucci C, Diffendal J, Kaufman D, Mekonnen B, TerefenkoG, Musselman B. Anal. Chem. 2007; 79: 5064. 25. LLochansky M, Gomez M, Williams J, Johnson R, Miller L.Proc. 54th ASMS Conf. Mass Spectrometry and Allied Topics,Seattle, WA, May 28-June 1, 2006. 26. Pierce C, Barr J, Cody R, Massung R, Woolfitt A, Moura H,Thompson H, Fernandez F. Chem. Commun.2007;807. 27. Haefliger O, Jeckelmann N. Rapid Commun. Mass Spectrom.2007;21:1361. 28. http://www.jeol.com/home/tabid/36/default.aspx. Copyright C John Wiley & Sons, Ltd. Copyright C John Wiley & Sons, Ltd.Rapid Commun. Mass Spectrom. OI: rcm
确定

还剩6页未读,是否继续阅读?

华质泰科生物技术(北京)有限公司为您提供《血浆中小分子检测方案(液质联用仪)》,该方案主要用于全血/血清/血浆中小分子检测,参考标准--,《血浆中小分子检测方案(液质联用仪)》用到的仪器有
相关方案
更多