


方案详情
文
体液的代谢组指纹图谱能够揭示许多代谢异常相关性疾病的发病原因,从而成为疾病诊断和治疗预后诊断的潜在工具。本文报导了一种将实时直接分析(DART)与飞行时间质谱(TOF MS)联用的快速方法,用该方法对人血清代谢组指纹图谱进行了分析。在本研究中,首先对血清样品进行蛋白沉淀处理,并通过衍生化提高代谢物的挥发性,然后进行DART MS分析。用同体积健康人血清样品优化了电离气体温度和流速等仪器参数,获得了DART MS的最佳性能。实验表明这些参数对所检测代谢物全质量范围及DART质谱图信噪比有显著影响。每次DART分析只需要1.2分钟,在此过程中可以按时间顺序观察到1500多张不同的特征图谱。用手动取样臂得到的总离子信号重现性为4.1% 到4.5%。DART MS最令人感兴趣的特点是高通量、无记忆效应和简单性,因此有望成为代谢组指纹图谱研究极宝贵的工具。
代谢组指纹图谱,一种基于代谢模式或“指纹图谱”对样品分类的无偏差全面筛查方法,已经在尿、血浆、血清和体液等各种生物样品类型上进行了实验。核磁共振(NMR)和质谱是代谢组指纹图谱研究广泛使用的两种分析平台。NMR的优势是几乎不用进行样品处理,更容易获得大量数据,但成本高、灵敏度低是它的两个主要缺陷。气相色谱-质谱(GC-MS)和液相色谱-质谱(LC-MS)是代谢组学工作流程中常用的两项补充技术。除非常复杂以外, GC-MS和LC-MS还有分析通量低和有色谱记忆效应等缺点,尤其是在研究生物基质(如血清)中的代谢物时。为了克服上述局限,人们还在不断研究能有效分析代谢组学的技术。
实时直接分析(DART)是一种在室温和大气压条件下操作的基于等离子体的电离技术。属于大气压等离子体电离技术,该技术包括直接大气压光电离(DAPPI)、实时直接分析(DART)流动大气压辉光放电?(FAPA)、等离子体辅助解吸附电离(PADI)、低温等离子体(LTP)电离和介质阻挡放电电离(DBDI)等。DART以记忆效应最小的非接触方式电离。样品可以手动处理,也可以通过自动进样器辅助,主要的消耗品是高纯压缩气体(氦气或氮气),每个样品的分析成本较低。DART的工作原理是,首先在气流(氮气或氦气)中发生辉光放电,形成的亚稳原子与大气压中的水发生相互作用,生成质子化的水簇。这些clusters通过质子转移与热气流解吸附的分析物发生作用。在大多数情况下,不经过样品制备即可发生直接电离。DART已成功用于制药产品、仿冒药物、细菌脂肪酸、调料和香料等分析领域。
本文报导了一种用DART-TOF和DART-Q-TOF MS快速分析人血清代谢组指纹图谱的方法。讨论了各种实验参数的优化,通过精确质量测定和添加实验,对血清代谢物进行了鉴定。用DART离子源与Q-TOF质谱联接,用DART进行血清代谢组学研究的工作,迄今尚未见文献报导。
方案详情

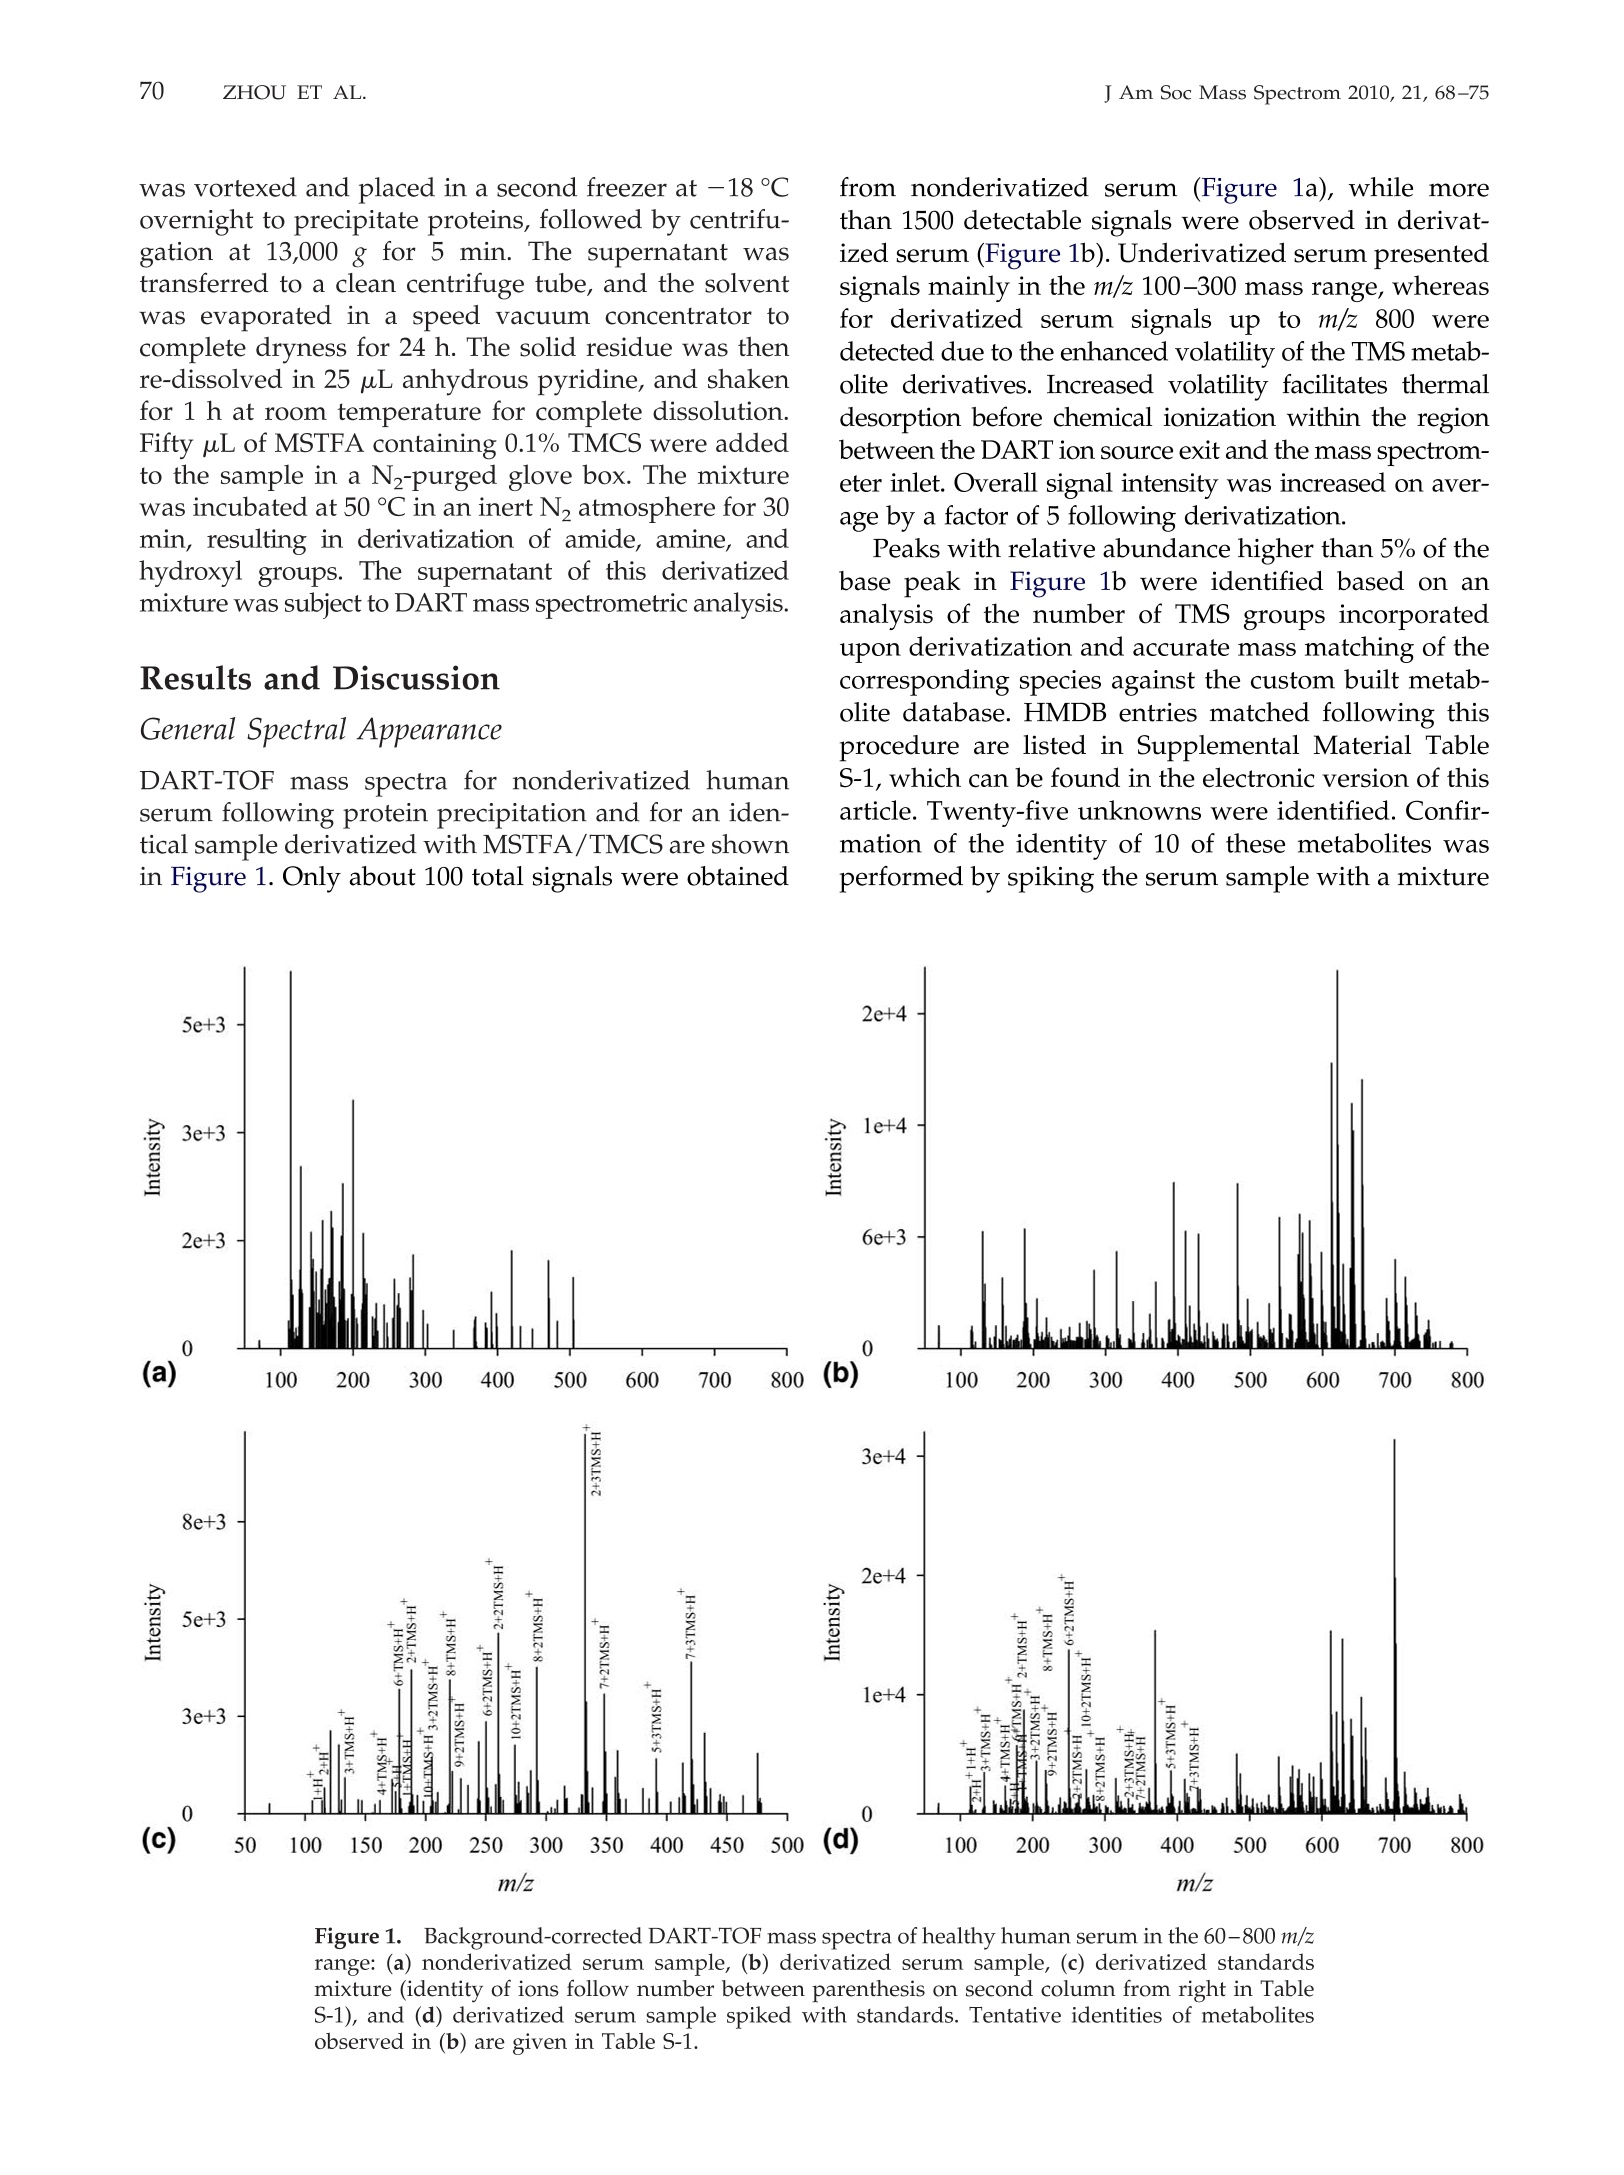
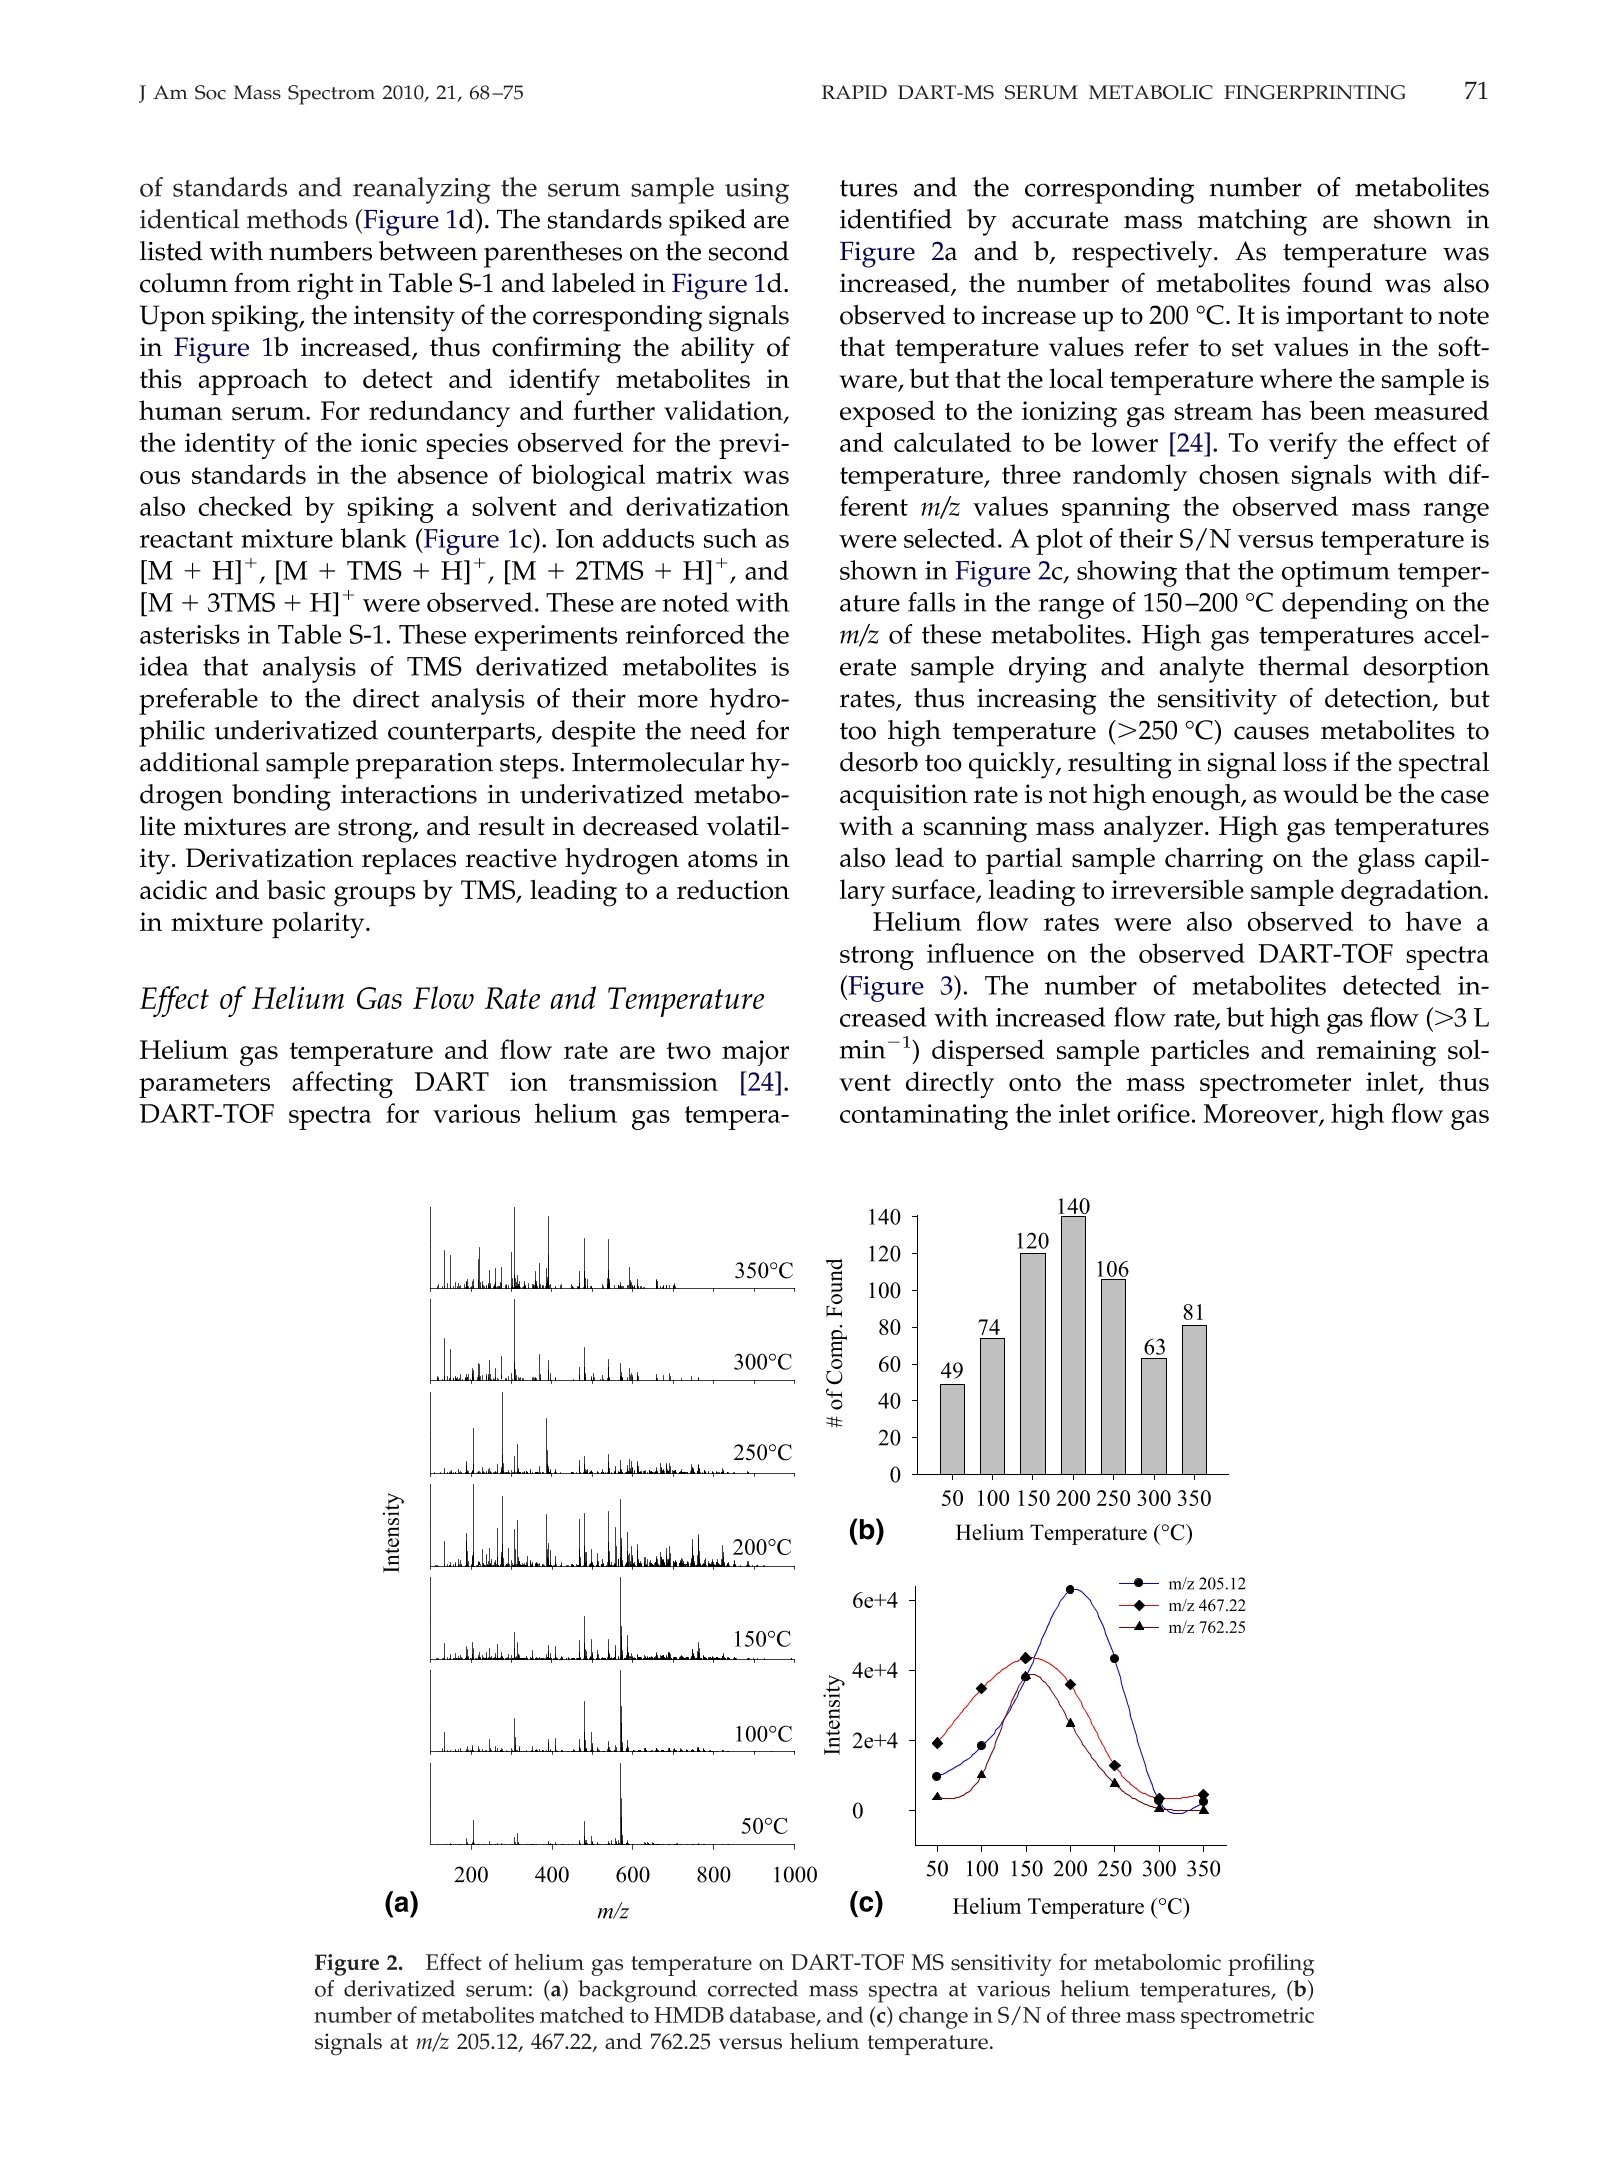
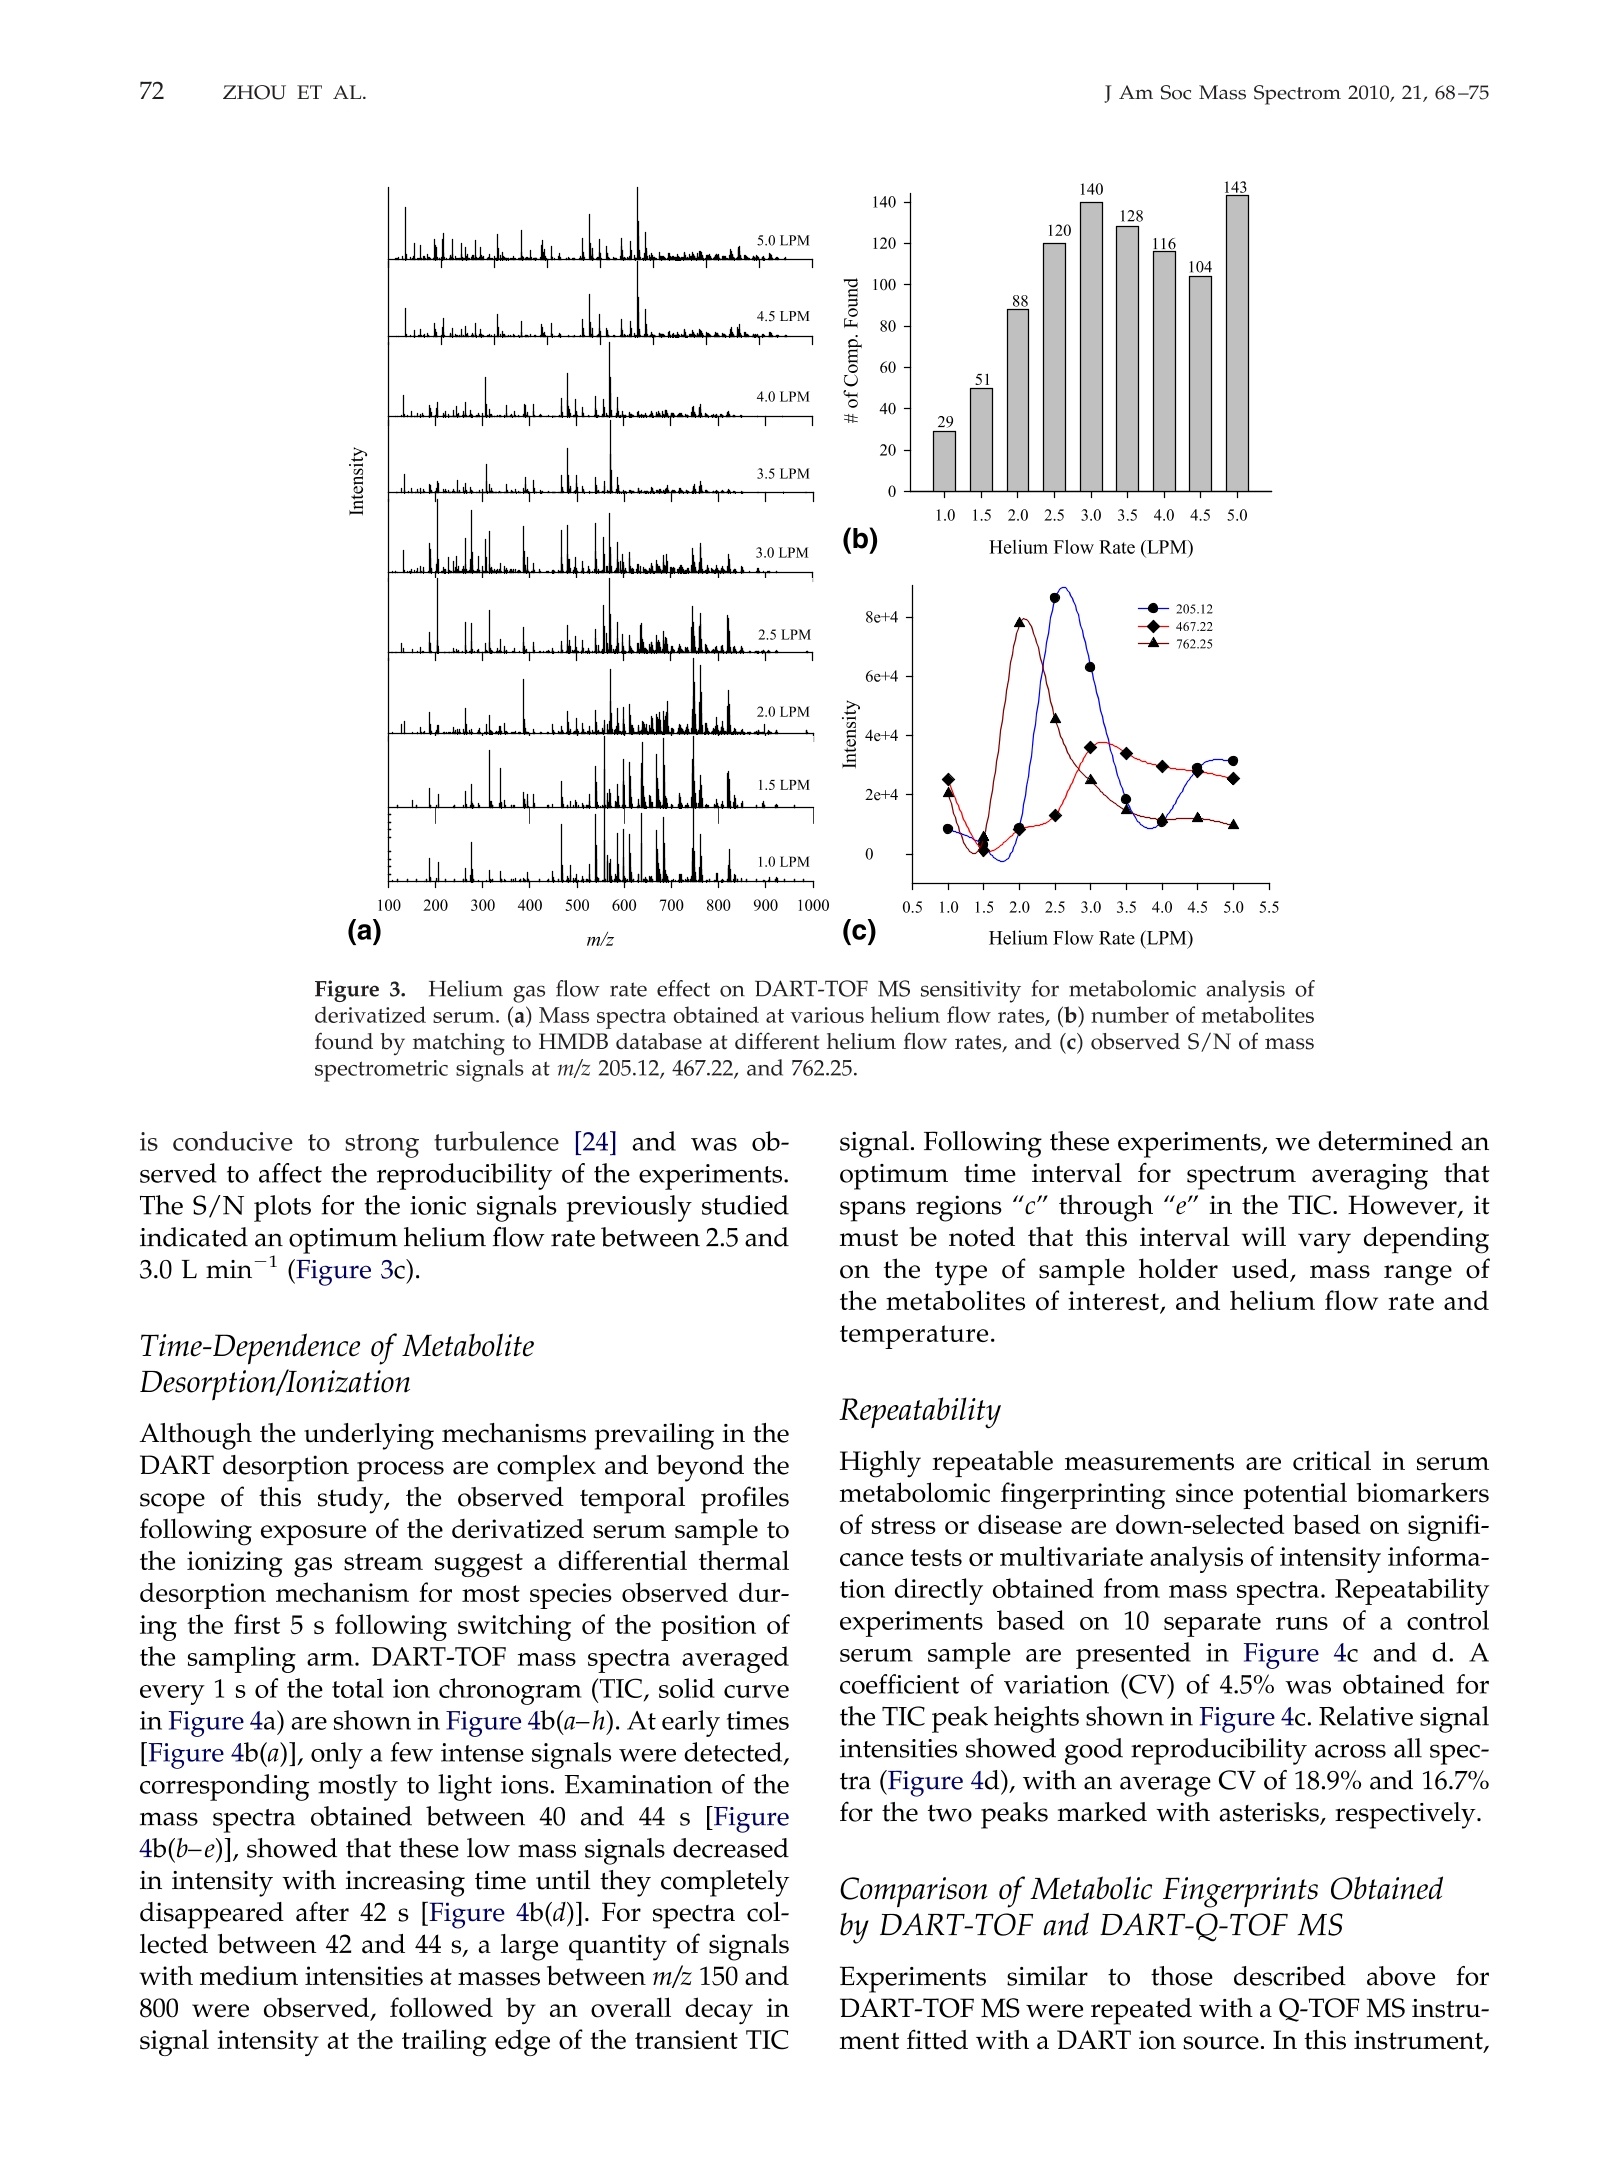
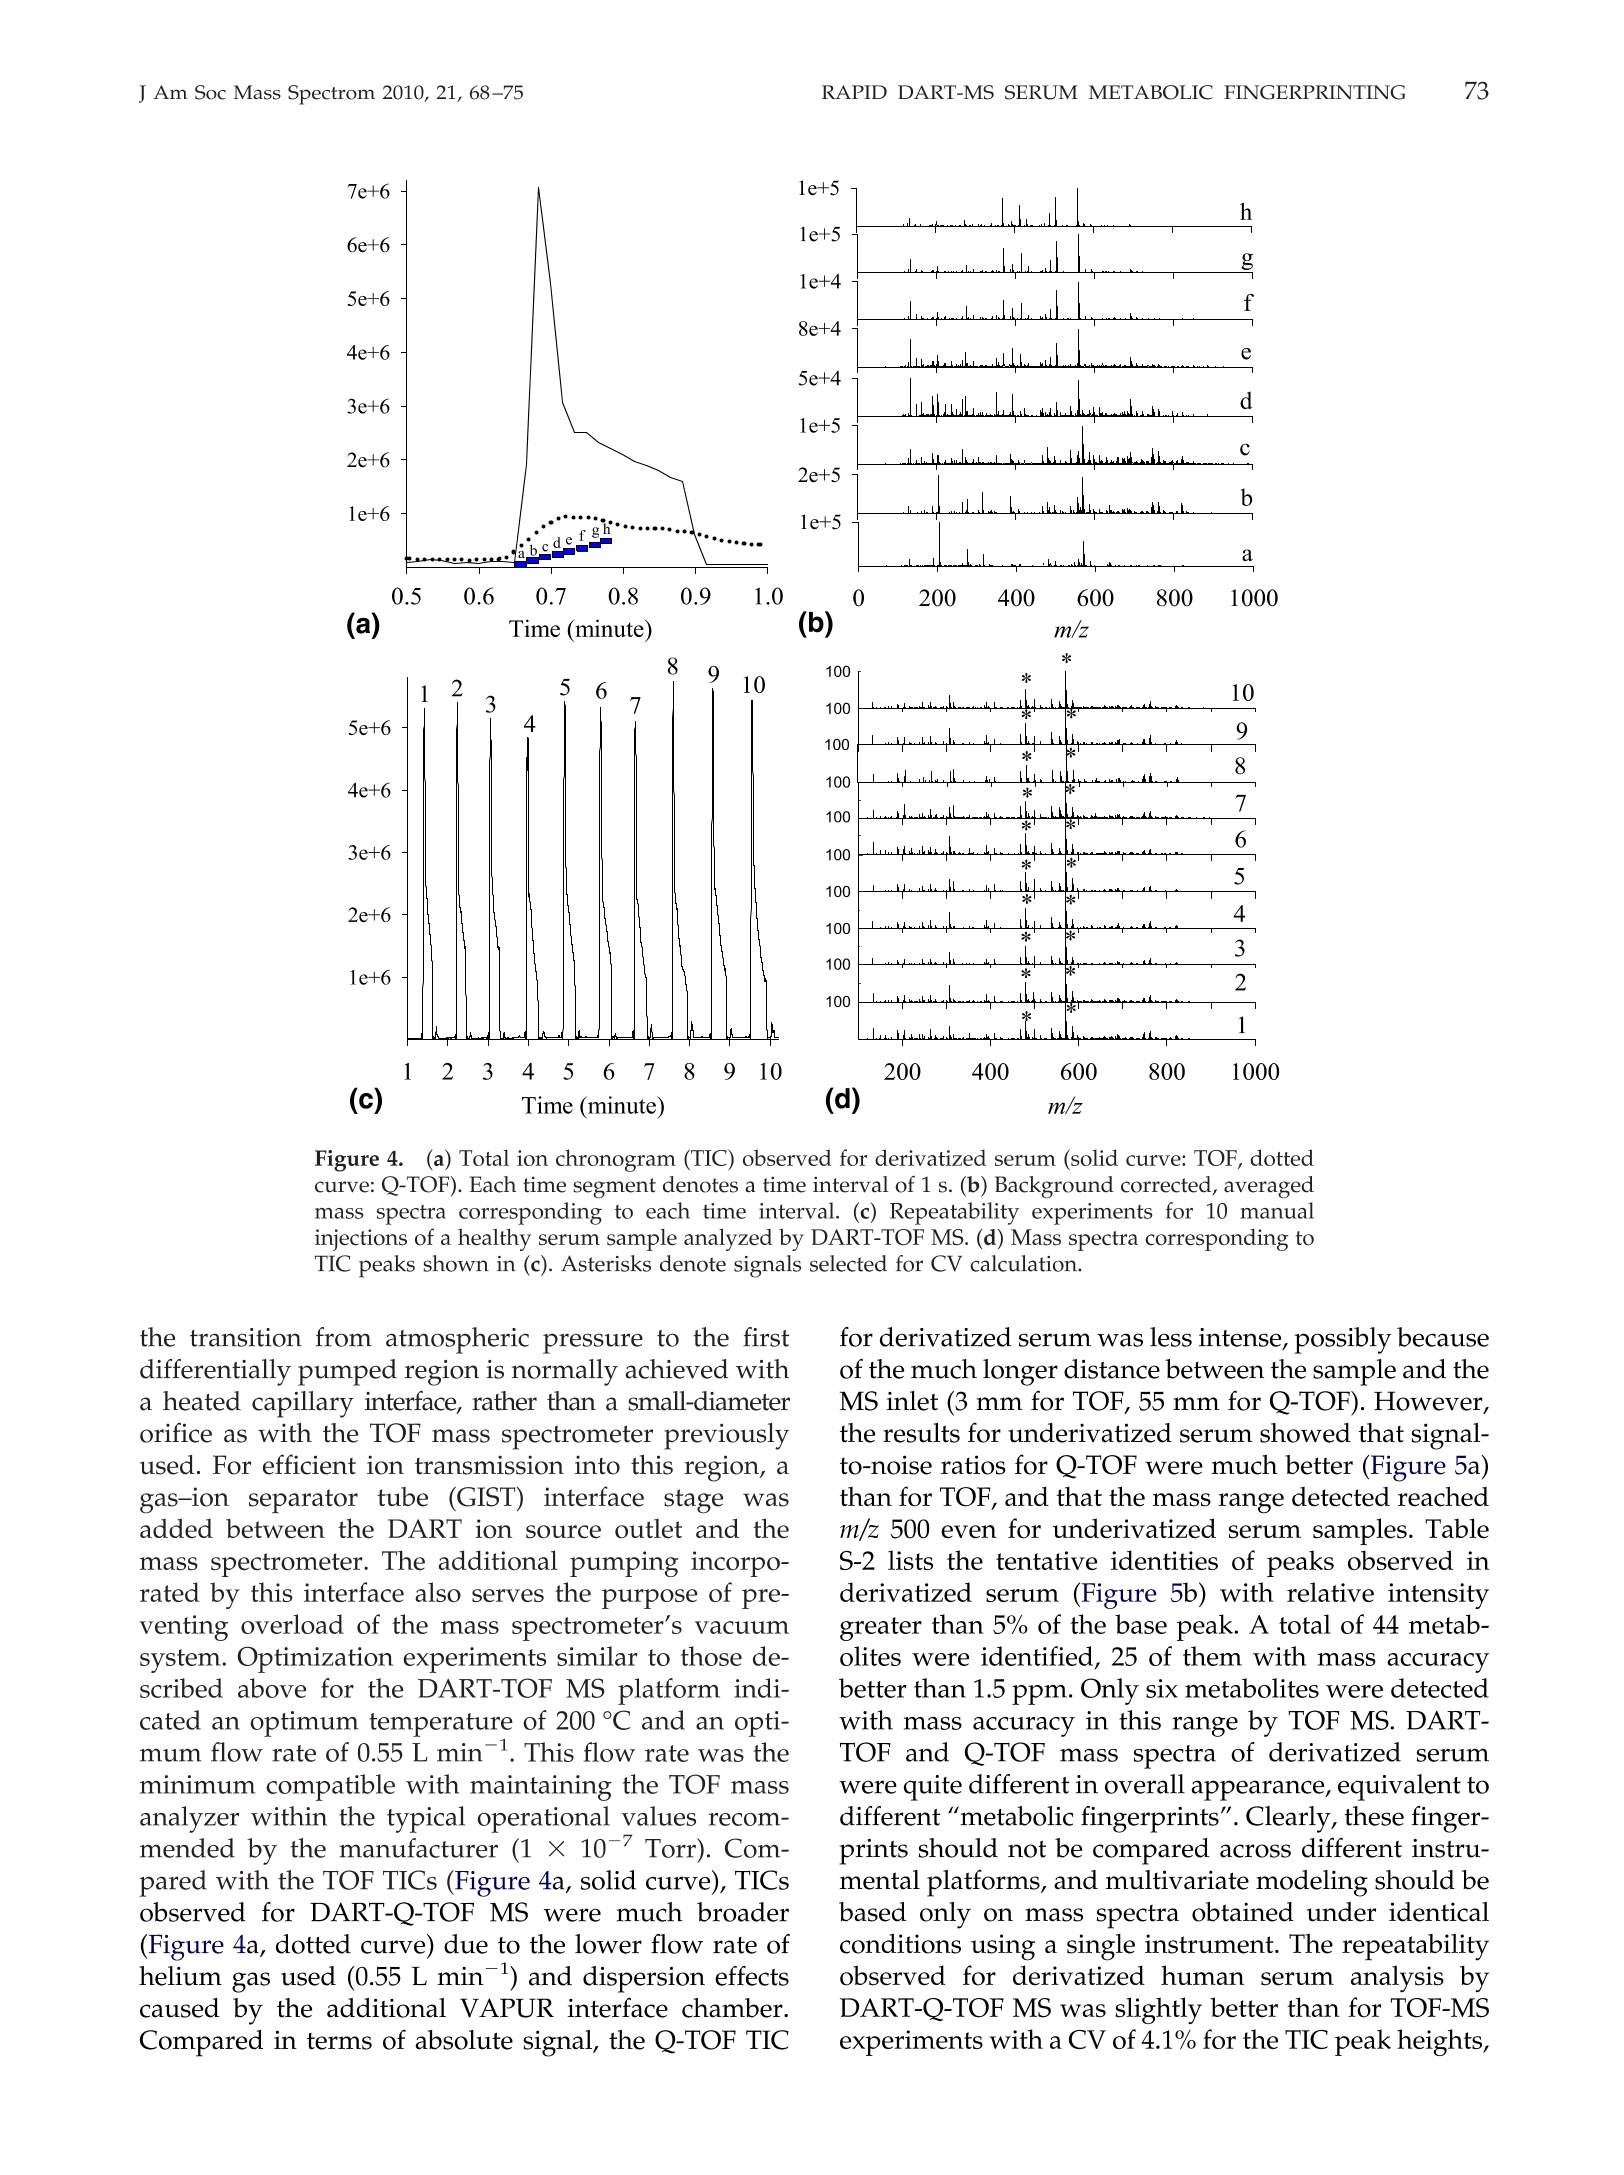
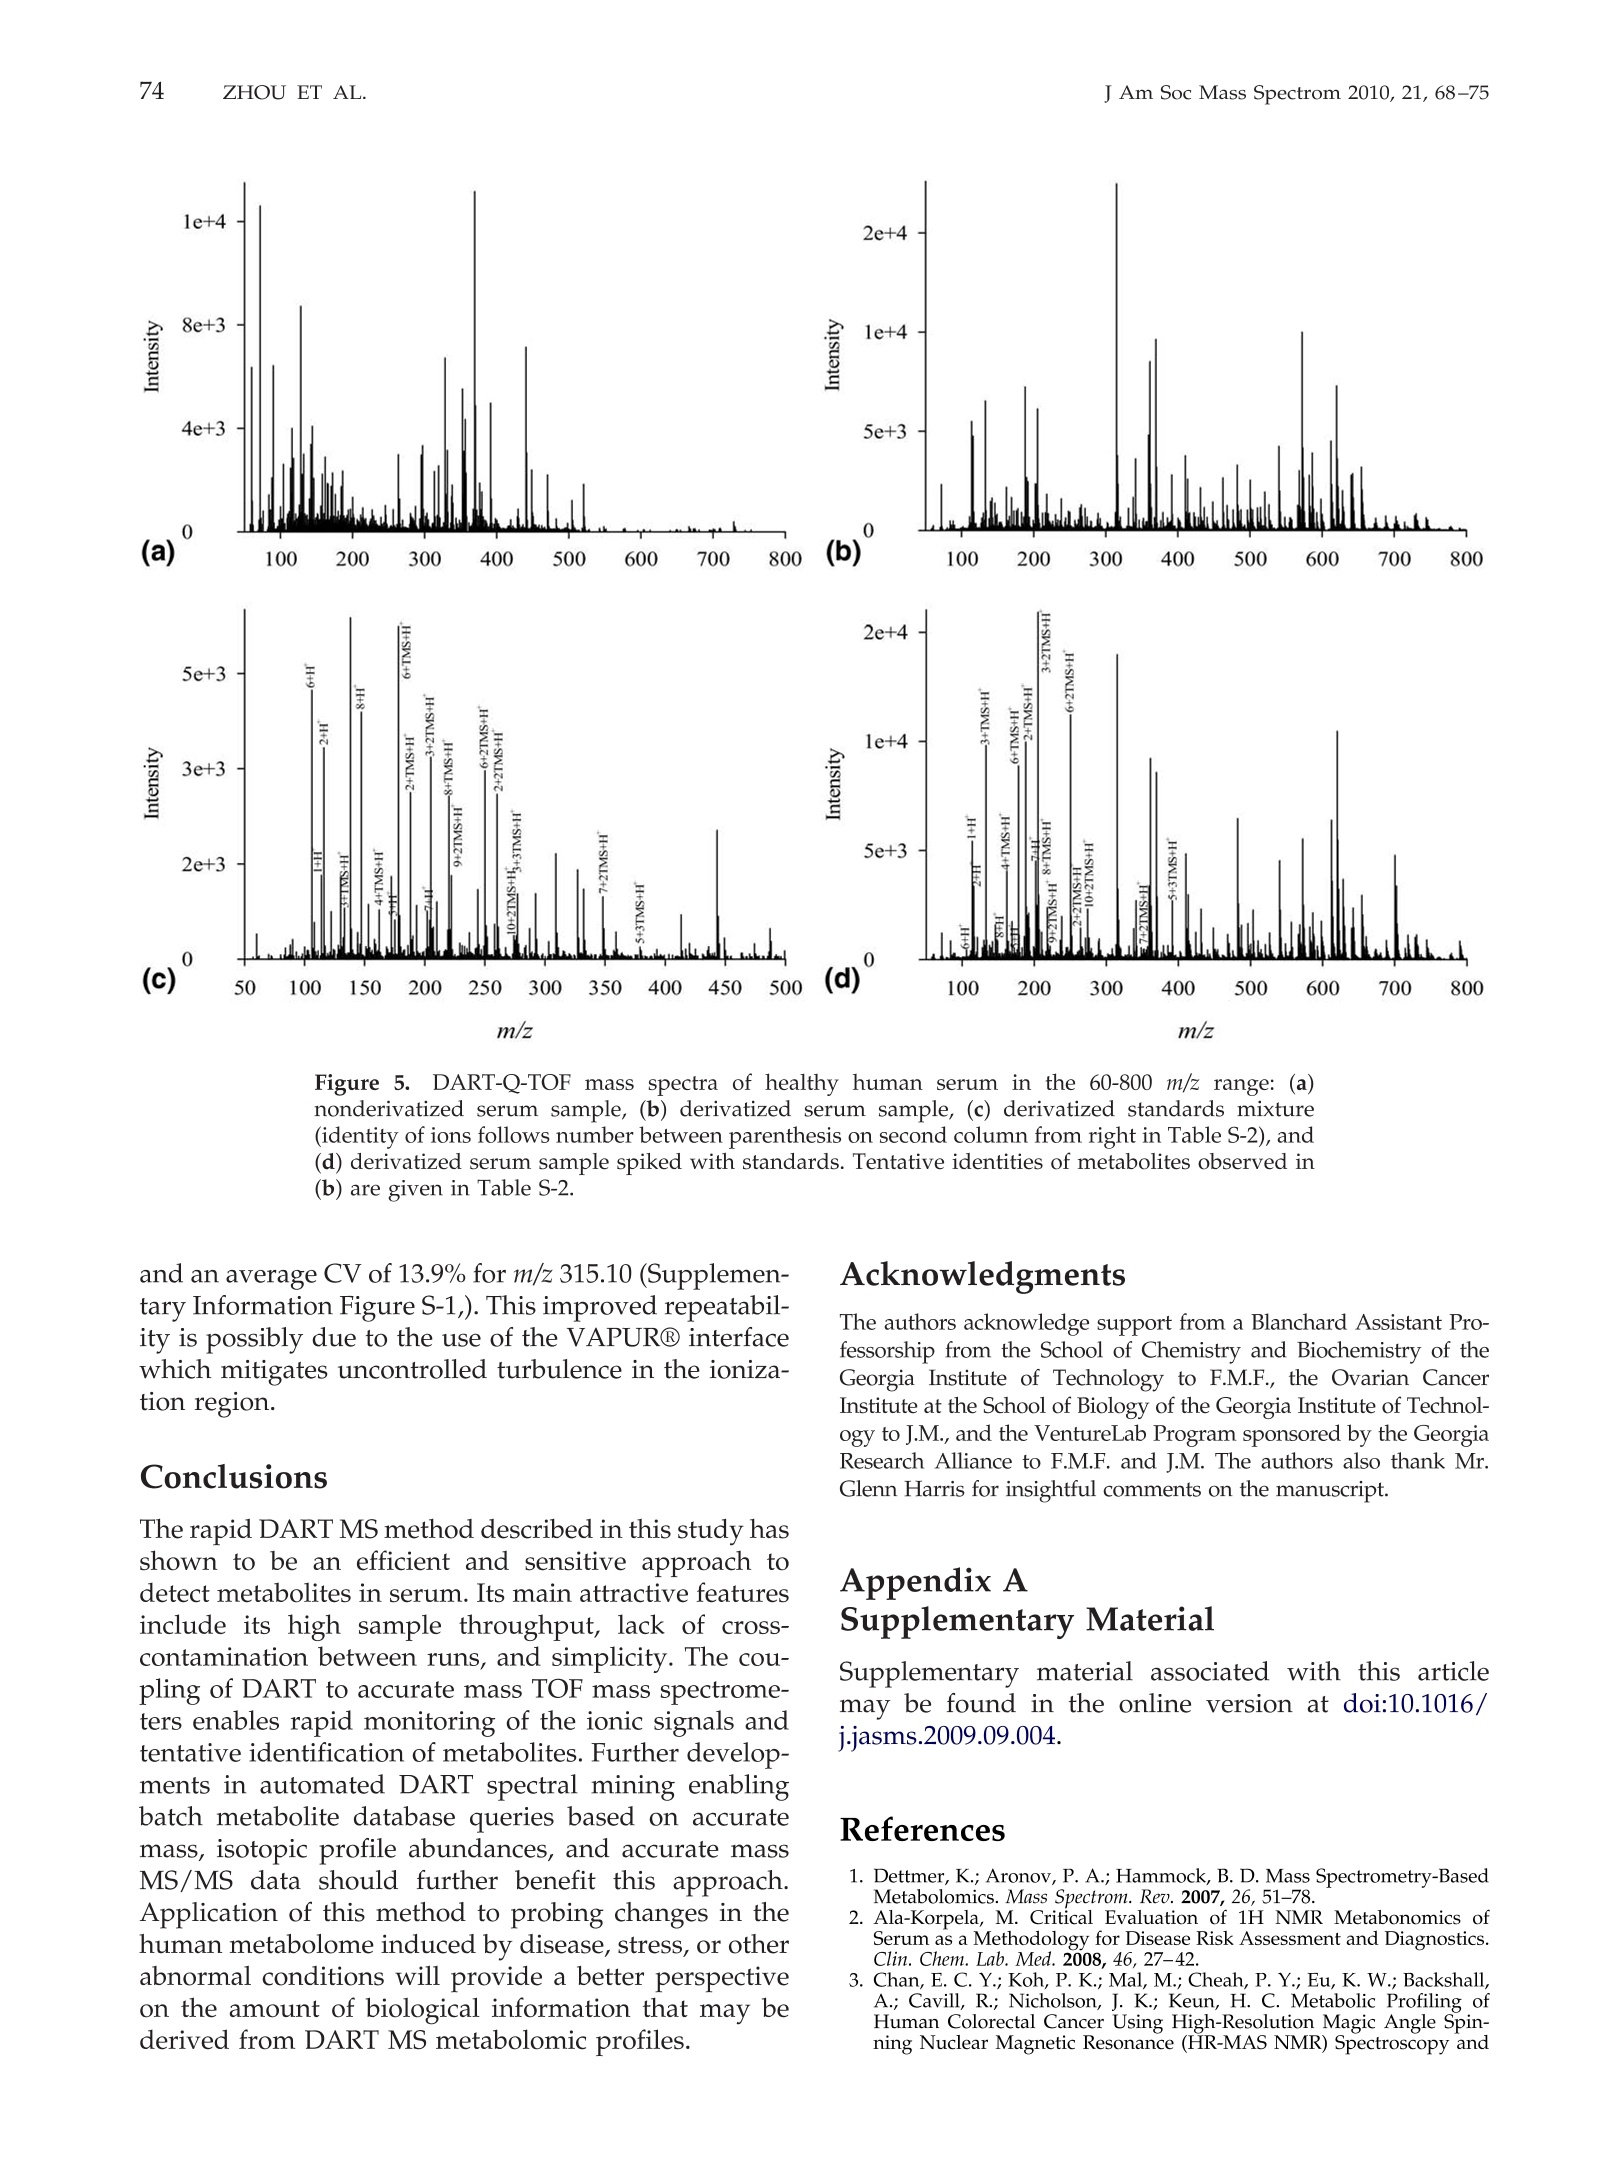
69RAPID DART-MS SERUM METABOLIC FINGERPRINTINGJ Am Soc Mass Spectrom 2010,21, 68-75 70J Am Soc Mass Spectrom 2010, 21, 68-75ZHOU ET AL. Published online September 17, 2009Received April 30, 2009Revised September 4, 2009Accepted September 5, 2009doi:10.1016/j.jasms.2009.09.004 Optimization of a Direct Analysis in Real Time/Time-of-Flight Mass Spectrometry Method forRapid Serum Metabolomic Fingerprinting Manshui Zhou, John F. McDonald, and Facundo M. Fernandez a School of Chemistry and Biochemistry, Georgia Institute of Technology, Atlanta, Georgia, USASchool of Biology, Georgia Institute of Technology, Atlanta, Georgia, USA ‘Ovarian Cancer Institute, Atlanta, Georgia, USA Metabolomic fingerprinting of bodily fluids can reveal the underlying causes of metabolicdisorders associated with many diseases, and has thus been recognized as a potential tool fordisease diagnosis and prognosis following therapy. Here we report a rapid approach in whichdirect analysis in real time (DART) coupled with time-of-flight (TOF) mass spectrometry (MS)and hybrid quadrupole TOF (Q-TOF) MS is used as a means for metabolomic fingerprintingof human serum. In this approach, serum samples are first treated to precipitate proteins, andthe volatility of the remaining metabolites increased by derivatization, followed by DART MSanalysis. Maximum DART MS performance was obtained by optimizing instrumental param-eters such as ionizing gas temperature and flow rate for the analysis of identical aliquots of ahealthy human serum samples. These variables were observed to have a significant effect onthe overall mass range of the metabolites detected as well as the signal-to-noise ratios in DARTmass spectra. Each DART run requires only 1.2 min, during which more than 1500 differentspectral features are observed in a time-dependent fashion. A repeatability of 4.1% to 4.5% wasobtained for the total ion signal using a manual sampling arm. With the appealing features ofhigh-throughput, lack of memory effects, and simplicity, DART MS has shown potential tobecome an invaluable tool for metabolomic fingerprinting. (J Am Soc Mass Spectrom 2010,21,68-75)O 2010 American Society for Mass Spectrometry "etabolomic fingerprinting, an unbiased, globalscreening approach to classify samples based on_metabolite patterns or "fingerprints", has beenperformed in a wide variety of biological sample typessuch as urine, plasma, serum, and tissues [1]. Nuclearmagnetic resonance (NMR) and mass spectrometry aretwo widely used analytical platforms applied to metabo-lomic fingerprinting. NMR has the advantage of requiringlittle sample preparation, and of producing datasets thatare more easily mined [2-4], but cost and sensitivity aretwo of its major limitations. Gas chromatography-massspectrometry (GC-MS) and liquid chromatography-massspectrometry (LC-MS) are two additional techniques com-monly used in metabolomic workflows [1,5-9]. Despitebeing extremely comprehensive, GC-MS and LC-MS suf-fer from low analysis throughput and memory effects ofthe chromatographic supports, particularly when investi-gating metabolites in biological matrices such as serum.To overcome the above described limitations, enablingtechnologies for the effective analysis of metabolomes arestill rapidly evolving. Direct analysis in real time (DART) is a plasma-basedion generation technique that operates under ambient ( Address reprint requests to Dr. F . M . F e rnandez, School of Chemistry andBiochemistry, Georgia Institute of Technology, 901 Atlantic Dr.NW, Atlanta, GA 3 0 332-0400, USA. E-mail: facundo.fernandez@chemistry.g a tech.edu ) conditions. It belongs to a wider family of ambientplasma ionization techniques that includes direct atmo-spheric pressure photo-ionization (DAPPI) [10], directanalysis in real time (DART)[11], flowing atmosphericpressure afterglow (FAPA) [12], plasma-assisted de-sorption ionization (PADI) [13], desorption atmosphericpressure photoionization (DAPCI) [14], low-temperatureplasma (LTP) ionization [15], and dielectric barrierdischarge ionization (DBDI) [16]. DART enables ioniza-tion in a noncontact fashion with minimal memoryeffects. Samples are handled either manually or withthe assistance of autosamplers, and mainly high puritycompressed gases (He or N) are required as consum-ables resulting in low cost per sample [11]. DARToperates by first creating a glow discharge within aflowing stream of gas (N2 or He) to form metastablesthat interact with water in the atmosphere to produceprotonated water clusters. These clusters react by pro-ton transfer with analytes desorbed by the heated gasstream. In most cases, immediate ionization can beachieved with no sample preparation. DART has beensuccessfully applied to the analysis of pharmaceuticals[17, 18], counterfeit drugs [19], bacterial fatty acidmethyl esters [20], flavors and fragrances [21], andseveral other interesting applications [22, 23]. In this work, we report a method for the rapidmetabolomic fingerprintingg ofhumanSserum via ( O 2010 American Society f o r Mass Spectrometry. P u blished b y Elsevier Inc.1044-0305/10/$32.00 ) DART-TOF and DART-Q-TOF MS. The optimization ofvarious experimental parameters is discussed, and theidentification of metabolites in serum is demonstratedusing accurate mass measurements and spiking exper-iments. To the best of our knowledge, this is the firstreport on the coupling of a DART ion source to a hybridQ-TOF mass spectrometer, and on the use of DART forserum metabolomics. Experimental Samples and Reagents N-trimethylsilyl-N-methyltrifluoroacetamide (MSTFA)and trimethylchlorosilane (TMCS) were obtained fromAlfa Aesar (Ward Hill, MA, USA), anhydrous pyridine,acetonitrile (ACN), acetone, and isopropanol were fromEMD Chemicals (Gibbstown, NJ, USA), polyethyleneglycol standard 400 and 600 (PEG 400, 600) were fromFluka Chemical Corp. (Milwaukee, WI, USA),healthyhuman serum (S7023-50 mL), creatinine, urea, cysteam-ine, triethylamine, L-proline, L-alanine, L-arginine, L-serine, and L-lysine were purchased from Sigma-AldrichCorp. (St. Louis, MO, USA), pyroglutamic acid wasfrom AnaSpec (San Jose,CA, USA), 3-indolebutyric acidwas from TCI America (Wellesley Hills, MA, USA), andhelium (99.999% purity) was purchased from Airgas,Inc. (Atlanta,GA, USA). Mass Spectrometry Serum metabolomic analysis was performed in positiveion mode via a DART ion source (IonSense, Saugus,MA, USA) coupled to (1) an orthogonal time-of-flight(TOF) mass spectrometer (JEOL AccuTOF; Tokyo, Japan)and (2) a Q-TOF mass spectrometer (Bruker micr-OTOF-Q I; Bremen, Germany). The Q-TOF mass spec-trometer interface was modified before coupling toDART by adding to its front end a custom madeVAPUR gas-ion separator tube (IonSense, Saugus, MA,USA). This VAPUR interface was itself connected to anEdwards E2M2 roughing pump (Edwards, Westmin-ster, MD, USA) to remove the excess discharge gasflowing into the mass spectrometer inlet. The AccuTOFTOF mass spectrometer was interfaced to the DART ionsource directly through a small orifice (~375 um diam-eter) interface. In both cases, derivatized serum sampleswere placed within the ionization region using a home-built sampling arm which secured Dip-it tips (IonSense,Saugus,MA, USA) at a fixed 3 mm distance from theion source gas exit. Before DART MS analysis, 0.5 uL ofderivatized serum solution was pipette-deposited ontothe glass end of the Dip-tip coupled to the samplingarm, a 1.2 min data acquisition run started, and thesample allowed to air dry for 0.65 min. The samplingarm was then rapidly switched so that the dried samplewas exposed to the ionizing zone of the DART ionsource. After 0.9 min in the acquisition run (0.25 minsampling time), the sample was removed, and a new Dip-it placed on the sample holder, while the remaining0.3 min of the run was completed. DART ion source helium flow rates of 3.0 L minand 0.55 L min-heated to 200C were chosen for TOFand Q-TOF experiments, respectively. The glass tip-endwas positioned 1.5 mm below the mass spectrometerinlet for TOF experiments and at the center of theceramic tube inlet for Q-TOF experiments. A dischargeneedle voltage of +3600 V, perforated electrode voltageof +150 V,and grid electrode voltages of +250 V(TOF),and +50 V (Q-TOF) were chosen, respectively. Accuratemass spectra were acquired in the m/z 60-1000 rangewith a spectral recording interval of 1.0 s. For TOFexperiments, the RF ion guide peak voltage was set to1200 V to enable ion transmission of a wide range ofspecies present in serum. The remaining settings for theTOF mass spectrometer were as follows: ring lens, +8V, orifice 1, +40V,orifice 2, +6V, orifice 1 temperature,80℃, and detector voltage, -2800 V. TOF mass driftcompensation was performed after analysis of eachsample using a 0.20 mM PEG 600 standard in methanol.The measured resolving power of the TOF mass spec-trometer was 6000 at FWHM, with observed massaccuracies in the range 2-20 ppm, depending on thesignal-to-noise ratio (S/N) of the particular peak underinvestigation. The settings for the Q-TOF mass spectrometer wereas follows: capillary voltage,-1500V, end plate offset,500 V, drying gas flow, 2.0 L min-, drying gastemperature, 150C. The minimum measured resolvingpower of the Q-TOF mass spectrometer was 14,500 atFWHM for m/z 415.25, with observed mass accuracies inthe range 0.6-2.0 ppm. The instrument was mass cali-brated before performing experiments using a custommixture of trimethylamine, PEG 400, and 600 in meth-anol (1:2:2:1200 vol/vol), and all mass spectra werecentroided in real time. Metabolites were tentatively identified by matchingaccurate masses against a custom built database con-taining 2924 entries corresponding to unique endoge-nous human metabolites found in the Human Metabo-lome Database (HMDB, www.hmdb.ca). Each entrywas manually expanded to take into account the mono-,di-, and/or tri-trimethylsilane (TMS) derivatives. En-tries for families of compounds not reacting with theMSTFA/TMCS reagent mixture were not expanded.Matching of database accurate mass records to experi-mental data were performed using the SearchFromListapplication included in the Mass Spec Tools suite ofprograms (ChemSW, Fairfield, CA, USA) using a toler-ance of 5 um and a relative intensity cutoff of 5%. Sample Preparation Upon removal from a -80 ℃ freezer, serum sampleswere immediately thawed on ice. Two-hundred uLserum aliquots were pipetted and mixed with 1 mL offreshly-prepared, chilled (-8℃) and degassed 2:1(vol/vol) acetone:isopropanol mixture. The mixture was vortexed and placed in a second freezer at -18 ℃overnight to precipitate proteins, followed by centrifu-gation at 13,000 g for 5 min. The supernatant wastransferred to a clean centrifuge tube, and the solventwas evaporated in a speed vacuum concentrator tocomplete dryness for 24 h. The solid residue was thenre-dissolved in 25 uL anhydrous pyridine, and shakenfor 1 h at room temperature for complete dissolution.FiftyuL ofMSTFA containing 0.1% TMCS were addedto the sample in a Nz-purged glove box. The mixturewas incubated at 50 ℃ in an inert N2 atmosphere for 30min, resulting in derivatization of amide, amine, andhydroxyl groups. The supernatant of this derivatizedmixture was subject to DART mass spectrometric analysis. Results and Discussion General Spectral Appearance DART-TOF mass spectra for nonderivatized humanserum following protein precipitation and for an iden-tical sample derivatized with MSTFA/TMCS are shownin Figure 1. Only about 100 total signals were obtained from nonderivatized serum (Figure 1a), while morethan 1500 detectable signals were observed in derivat-ized serum (Figure 1b). Underivatized serum presentedsignals mainly in the m/z 100-300 mass range, whereasfor derivatized serum signals up to m/z 800 weredetected due to the enhanced volatility of the TMS metab-olite derivatives. Increased volatility facilitates thermaldesorption before chemical ionization within the regionbetween the DART ion source exit and the mass spectrom-eter inlet. Overall signal intensity was increased on aver-age by a factor of 5 following derivatization. Peaks with relative abundance higher than 5% of thebase peak in Figure 1b were identified based on ananalysis of the number of TMS groups incorporatedupon derivatization and accurate mass matching of thecorresponding species against the custom built metab-olite database. HMDB entries matched following thisprocedure are listed in Supplemental Material TableS-1, which can be found in the electronic version of thisarticle. Twenty-five unknowns were identified. Confir-mation of the identity of 10 of these metabolites wasperformed by spiking the serum sample with a mixture Figure 1. Background-corrected DART-TOF mass spectra of healthy human serum in the 60-800 m/zrange: (a) nonderivatized serum sample, (b) derivatized serum sample, (c) derivatized standardsmixture (identity of ions follow number between parenthesis on second column from right in TableS-1), and (d) derivatized serum sample spiked with standards. Tentative identities of metabolitesobserved in (b) are given in Table S-1. of standards and reanalyzing the serum sample usingidentical methods (Figure 1d). The standards spiked arelisted with numbers between parentheses on the secondcolumn from right in Table S-1 and labeled in Figure 1d.Upon spiking, the intensity of the corresponding signalsin Figure 1b increased, thus confirming the ability ofthis approach to detect and identify metabolites inhuman serum. For redundancy and further validation,the identity of the ionic species observed for the previ-ous standards in the absence of biological matrix wasalso checked by spiking a solvent and derivatizationreactant mixture blank (Figure 1c). Ion adducts such as[M +H]+,[M + TMS + H]+, [M + 2TMS + H]+,and[M +3TMS +H]+ were observed. These are noted withasterisks in Table S-1. These experiments reinforced theidea that analysis of TMS derivatized metabolites ispreferable to the direct analysis of their more hydro-philic underivatized counterparts, despite the need foradditional sample preparation steps. Intermolecular hy-drogen bonding interactions in underivatized metabo-lite mixtures are strong, and result in decreased volatil-ity. Derivatization replaces reactive hydrogen atoms inacidic and basic groups by TMS, leading to a reductionin mixture polarity. Effect of Helium Gas Flow Rate and Temperature Helium gas temperature and flow rate are two majorparameters affecting DART ion transmission [24].DART-TOF spectra for various helium gas tempera- tures and the corresponding number of metabolitesidentified by accurate mass matching are shown inFigure 2a and b, respectively. As temperature wasincreased, the number of metabolites found was alsoobserved to increase up to 200 °C. It is important to note.that temperature values refer to set values in the soft-ware, but that the local temperature where the sample isexposed to the ionizing gas stream has been measuredand calculated to be lower [24]. To verify the effect oftemperature, three randomly chosen signals with dif-ferent m/z values spanning the observed mass rangewere selected. A plot of their S/N versus temperature isshown in Figure 2c, showing that the optimum temper-ature falls in the range of 150-200°℃ depending on them/z of these metabolites. High gas temperatures accel-erate sample drying and analyte thermal desorptionrates, thus increasing the sensitivity of detection, buttoo high temperature (>250℃) causes metabolites todesorb too quickly, resulting in signal loss if the spectralacquisition rate is not high enough, as would be the casewith a scanning mass analyzer. High gas temperaturesalso lead to partial sample charring on the glass capil-lary surface, leading to irreversible sample degradation Helium flow rates were also observed to have astrong influence on the observed DART-TOF spectra(Figure 3). The number of metabolites detected in-creased with increased flow rate, but high gas flow (>3 Lmin-l) dispersed sample particles and remaining sol-vent directly onto the mass spectrometer inlet, thuscontaminating the inlet orifice. Moreover, high flow gas Figure 2.Effect of helium gas temperature on DART-TOF MS sensitivity for metabolomic profilingof derivatized serum: (a) background corrected mass spectra at various helium temperatures,(b)number of metabolites matched to HMDB database,and (c) change in S/N of three mass spectrometricsignals at m/z 205.12, 467.22, and 762.25 versus helium temperature. 140 143 Figure 3.Helium gas flow rate effect on DART-TOF MS sensitivity for metabolomic analysis ofderivatized serum. (a) Mass spectra obtained at various helium flow rates, (b) number of metabolitesfound by matching to HMDB database at different helium flow rates, and (c) observed S/N of massspectrometric signals at m/z 205.12, 467.22, and 762.25. is conducive to strong turbulence [24] and was ob-served to affect the reproducibility of the experiments.The S/N plots for the ionic signals previously studiedindicated an optimum helium flow rate between 2.5 and.3.0Lmin-(Figure 3c). Time-Dependence of MetaboliteDesorption/Ionization Although the underlying mechanisms prevailing in theDART desorption process are complex and beyond thescope of this study, the observed temporal profilesfollowing exposure of the derivatized serum sample tothe ionizing gas stream suggest a differential thermaldesorption mechanism for most species observed dur-ing the first 5 s following switching of the position ofthe sampling arm. DART-TOF mass spectra averagedevery 1 s of the total ion chronogram (TIC, solid curvein Figure 4a) are shown in Figure 4b(a-h). At early times[Figure 4b(a)], only a few intense signals were detected,corresponding mostly to light ions. Examination of themass spectra obtained between 40 and 44 s [Figure4b(b-e)], showed that these low mass signals decreasedin intensity with increasing time until they completelydisappeared after 42 s [Figure 4b(d)]. For spectra col-lected between 42 and 44 s, a large quantity of signalswith medium intensities at masses between m/z 150 and800 were observed, followed by an overall decay insignal intensity at the trailing edge of the transient TIC signal. Following these experiments, we determined anoptimum time interval for spectrum averaging thatspans regions “c" through“e" in the TIC. However, itmust be noted that this interval will vary dependingon the type of sample holder used, mass range ofthe metabolites of interest, and helium flow rate andtemperature. Repeatability Highly repeatable measurements are critical in serummetabolomic fingerprinting since potential biomarkersof stress or disease are down-selected based on signifi-cance tests or multivariate analysis of intensity informa-tion directly obtained from mass spectra. Repeatabilityexperiments based on 10 separate runs of a controlserum sample are presented in Figure 4c and d. Acoefficient of variation (CV) of 4.5% was obtained forthe TIC peak heights shown in Figure 4c. Relative signalintensities showed good reproducibility across all spec-tra(Figure 4d), with an average CV of 18.9% and 16.7%for the two peaks marked with asterisks, respectively. Comparison of Metabolic Fingerprints Obtainedby DART-TOF and DART-Q-TOF MS Experiments similar to those described above forDART-TOF MS were repeated with a Q-TOF MS instru-ment fitted with a DART ion source. In this instrument, Figure 4.((a) Total ion chronogram (TIC) observed for derivatized serum (solid curve: TOF, dottedcurve: Q-TOF). Each time segment denotes a time interval of 1 s. (b) Background corrected, averagedmass spectra corresponding to each time interval. (c) Repeatability experiments for 10 manualinjections of a healthy serum sample analyzed by DART-TOF MS. (d) Mass spectra corresponding toTIC peaks shown in (c). Asterisks denote signals selected for CV calculation. the transition from atmospheric pressure to the firstdifferentially pumped region is normally achieved witha heated capillary interface, rather than a small-diameterorifice as with the TOF mass spectrometer previouslyused. For efficient ion transmission into this region, agas-ion separator tube (GIST) interface stage wasadded between the DART ion source outlet and themass spectrometer. The additional pumping incorpo-rated by this interface also serves the purpose of pre-venting overload of the mass spectrometer’s vacuumsystem. Optimization experiments similar to those de-scribed above for the DART-TOF MS platform indi-cated an optimum temperature of 200 ℃ and an opti-mum flow rate of 0.55 L min-1. This flow rate was theminimum compatible with maintaining the TOF massanalyzer within the typical operational values recom-mended by the manufacturer (1 ×10- Torr). Com-pared with the TOF TICs (Figure 4a, solid curve), TICsobserved for DART-Q-TOF MS were much broader(Figure 4a, dotted curve) due to the lower flow rate ofhelium gas used (0.55 L min-) and dispersion effectscaused by the additional VAPUR interface chamber.Compared in terms of absolute signal, the Q-TOF TIC for derivatized serum was less intense, possibly becauseof the much longer distance between the sample and theMS inlet (3 mm for TOF, 55 mm for Q-TOF). However,the results for underivatized serum showed that signal-to-noise ratios for Q-TOF were much better (Figure 5a)than for TOF, and that the mass range detected reachedm/z 500 even for underivatized serum samples. TableS-2 lists the tentative identities of peaks observed inderivatized serum (Figure 5b) with relative intensitygreater than 5% of the base peak. A total of 44 metab-olites were identified, 25 of them with mass accuracybetter than 1.5 ppm. Only six metabolites were detectedwith mass accuracy in this range by TOF MS. DART-TOF and Q-TOF mass spectra of derivatized serumwere quite different in overall appearance,equivalent todifferent"metabolic fingerprints". Clearly, these finger-prints should not be compared across different instru-mental platforms, and multivariate modeling should bebased only on mass spectra obtained under identicalconditions using a single instrument. The repeatabilityobserved for derivatized human serum analysis byDART-Q-TOF MS was slightly better than for TOF-MSexperiments with a CV of 4.1% for the TIC peak heights, Figure 5.5.DART-Q-TOF mass spectra of healthy human serum in the 60-800 m/z range: (a)nonderivatized serum sample, (b) derivatized serum sample, (c) derivatized standards mixture(identity of ions follows number between parenthesis on second column from right in Table S-2), and(d) derivatized serum sample spiked with standards. Tentative identities of metabolites observed in(b) are given in Table S-2. and an average CV of 13.9% for m/z 315.10 (Supplemen-tary Information Figure S-1,). This improved repeatabil-ity is possibly due to the use of the VAPURQ interfacewhich mitigates uncontrolled turbulence in the ioniza-tion region. Conclusions The rapid DART MS method described in this study hasshown to be an efficient and sensitive approach todetect metabolites in serum. Its main attractive featuresinclude its high sample throughput, lack of cross-contamination between runs, and simplicity. The cou-pling of DART to accurate mass TOF mass spectrome-ters enables rapid monitoring of the ionic signals andtentative identification of metabolites. Further develop-ments in automated DART spectral mining enablingbatch metabolite database queries based on accuratemass, isotopic profile abundances, and accurate massMS/MS data should further benefit this approach.Application of this method to probing changes in thehuman metabolome induced by disease, stress, or otherabnormal conditions will provide a better perspectiveon the amount of biological information that may bederived from DART MS metabolomic profiles. Acknowledgments The authors acknowledge support from a Blanchard Assistant Pro-fessorship from the School of Chemistry and Biochemistry of theGeorgia Institute of Technology to F.M.F., the Ovarian CancerInstitute at the School of Biology of the Georgia Institute of Technol-ogy to J.M., and the VentureLab Program sponsored by the GeorgiaResearch Alliance to F.M.F. and J.M. The authors also thank Mr.Glenn Harris for insightful comments on the manuscript. Appendix ASupplementary Material Supplementary material associated with this articlemay be found in the online version at doi:10.1016/j.jasms.2009.09.004. References 1. Dettmer, K.;Aronov, P. A.; Hammock, B. D. Mass Spectrometry-BasedMetabolomics.Mass Spectrom. Rev. 2007, 26,51-78. 2.Ala-Korpela, M. Critical Evaluation of 1H NMR Metabonomics ofSerum as a Methodology for Disease Risk Assessment and Diagnostics.Clin. Chem. Lab. Med.2008, 46,27-42. 3. Chan, E. C. Y.; Koh,P. K.; Mal, M.; Cheah, P. Y.; Eu, K. W.; Backshall,A.; Cavill, R.; Nicholson, J. K.; Keun, H. C. Metabolic Profiling ofHuman Colorectal Cancer Using High-Resolution Magic Angle Spin-ning Nuclear Magnetic Resonance (HR-MAS NMR) Spectroscopy and Gas Chromatography Mass Spectrometry (GC/MS). J. Proteome Res.2009,8,352-361. 4.Makinen, V.P.; Soininen, P.; Forsblom, C.; Parkkonen, M.; Ingman, P.;Kaski, K.; GroopP,/ P.H.; Ala-Korpela, M.; FinnDiane Study Group.Diagnosing Diabetic Nephropathy by HNMR metabonomics of serum.MAGMA 2006, 19, 281-296. 5. D1enkert, C.; Budczies, J.; Kind, T.; Weichert, W.; Tablack, P.; Sehouli,J.;Niesporek, S.; Konsgen, D.; Dietel, M.; Fiehn, O. Mass Spectrometry-Based Metabolic Profiling Reveals Different Metabolite Patterns inInvasive Ovarian Carcinomas and Ovarian Borderline Tumors. CancerRes.2006, 66, 10795-10804. 6.Fancy, S.A.; Beckonert, O.; Darbon, G.; Yabsley, W.; Walley, R.; Baker,D.; Perkins,G. L.; Pullen, F. S.;Rumpel, K. Gas Chromatography/FlameIonization Detection Mass Spectrometry for the Detection of Endoge-nous Urine Metabolites for Metabonomic Studies and Its Use as aComplementary Tool to Nuclear Magnetic Resonance Spectroscopy.Rapid Commun. Mass Spectrom. 2006, 20,2271-2280. 7. Lu, W.; Bennett, B. D.; Rabinowitz, J. D. Analytical Strategies forLC-MS-Based Targeted Metabolomics.J. Chromatogr. 2008,871,236-242. 8. Michopoulos, F.;Lai, L.; Gika, H.; Theodoridis, G.; Wilson, I. UPLC-MS-Based Analysis of Human Plasma for Metabonomics Using SolventPrecipitation or Solid Phase Extraction. J. Proteome Res.2009, 8, 2114-2121. 9. Pasikanti, K. K.; Ho, P. C.; Chan, E. C. Y. Gas Chromatography/MassSpectrometry in Metabolic Profiling of Biological Fluids. J. Chromatogr.2008, 871, 202-211. 10. Haapala, M.; Pol, J.; Saarela,V.; Arvola, V.; Kotiaho, T.; Ketola, R. A.;Franssila, S.; Kauppila, T. J; Kostiainen, R. Desorption AtmosphericPressure Photoionization. Anal. Chem. 2007,79,7867-7872. 11. Cody,R. B.; Larame,J. A.;Durst, H. D. Versatile New Ion Source for theAnalysis of Materials in Open Air Under Ambient Conditions. Anal.Chem. 2005,77, 2297-2302. 12.Andrade,F. J.;Shelley,J. T.;Wetzel, W. C.; Webb,M. R.; Gamez,G.; Ray,S. J; Hieftje, G. M. Atmospheric Pressure Chemical Ionization Source. 2.Desorption-Ionization for the Direct Analysis of Solid Compounds.Anal. Chem. 2008, 80, 2654-2663. 13. Ratcliffe, L. V.; Rutten, F. J; Barrett, D. A.; Whitmore, T.; Seymour, D.;Greenwood, C.; Aranda-Gonzalvo, Y.; Robinson, S.; McCoustra, M.Surface Analysis Under Ambient Conditions Using Plasma-AssistedDesorption/Ionization Mass Spectrometry. Anal. Chem. 2007, 79, 6094-6101. 14. Jackson, A. T.; Scrivens, J. H.; Williams, J. P.; Baker, E. S.; Gidden, J;Bowers, M. T. Microstructural and Conformational Studies of PolyetherCopolymers. Int. J. Mass Spectrom. 2004, 238,287-297. 15. Harper, J. D.; Charipar, N. A.;Mulligan, C. C.;Zhang, X.; Cooks, R. G.;Ouyang, Z. Low-Temperature Plasma Probe for Ambient DesorptionIonization. Anal. Chem. 2008, 80, 9097-9104. 16. Na,N.; Zhang, C.;Zhao, M.; Zhang, S.; Yang, C.; Fang, X.; Zhang, X.Direct Detection of Explosives on Solid Surfaces by Mass Spectrometrywith an Ambient Ion Source Based on Dielectric Barrier Discharge.J. Mass Spectrom. 2007, 42,1079-1085. 17. Petucci, C.; Diffendal, J; Kaufman, D.; Mekonnen, B.; Terefenko, G.;Musselman, B. Direct Analysis in Real Time for Reaction Monitoring inDrug Discovery. Anal. Chem. 2007, 79,5064-5070. 18. Zhao, Y.; Lam, M.; Wu,D.;Mak, R. Quantification of Small Molecules inPlasma with Direct Analysis in Real Time Tandem Mass Spectrometry,Without Sample Preparation and Liquid Chromatographic Separation.Rapid Commun. Mass Spectrom. 2008, 22, 3217-3224. 19. Fernandez, F. M.; Cody,R. B.; Green, M.D.; Hampton, C. Y.;McGready,R.; Sengaloundeth, S.; White, N. J; Newton, P. N. Characterization ofSolid Counterfeit Drug Samples by Desorption Electrospray Ionizationand Direct Analysis-in-Real-Time Coupled to Time-of-Flight MassSpectrometry.Chem. Med. Chem. 2006, 1,702-705. 20. Pierce, C. Y.; Barr, J. R.; Cody, R. B.; Massung, R. F.; Woolfitt, A. R.;Moura, H.; Thompson, H. A.; Fernandez, F. M. Ambient Generation ofFatty Acid Methyl Ester Ions from Bacterial Whole Cells by DirectAnalysis in Real Time (DART) Mass Spectrometry. Chem. Commun.2007,8,807-809. 21. Haefliger, O. P.; Jeckelmann, N. Direct Mass Spectrometric Analysis ofFlavors and Fragrances in Real Applications Using DART. Rapid Com-mun. Mass Spectrom. 2007, 21,1361-1366. 22. Schurek, J; Vaclavik, L.; Hooijerink, H. D.; Lacina, O.; Poustka, J;Sharman, M.; Caldow, M.; Nielen, M. W. F.; Hajslova, J. Control ofStrobilurin Fungicides in Wheat Using Direct Analysis in Real TimeAccurate Time-of-Flight and Desorption Electrospray Ionization LinearIon Trap Mass Spectrometry. Anal. Chem. 2008, 80, 9567-9575. 23. Williams, J. P.; Patel, V. J.; Holland, R.; Scrivens, J. H. The Use ofRecently Described Ionization Techniques for the Rapid Analysis ofSome Common Drugs and Samples of Biological Origin. Rapid Commun.Mass Spectrom. 2006,20,1447-1456. ( 24. H arris, G. A.; Fernandez, F. M. Simulations and Experimental Inve s ti- 8fA gation of Atmospheric Transport in a n Ambient Metastable-Induced C h emical Ionization Source. Anal. Chem. 2009,81,322-329. )
确定
还剩6页未读,是否继续阅读?

华质泰科生物技术(北京)有限公司为您提供《血清中代谢组指纹图谱的方法优化检测方案(液质联用仪)》,该方案主要用于全血/血清/血浆中代谢组指纹图谱的方法优化检测,参考标准--,《血清中代谢组指纹图谱的方法优化检测方案(液质联用仪)》用到的仪器有
相关方案
更多