


We have investigated the dynamic mechanical behavior of two cross-linked polymer networks with very different topologies: one made of backbones randomly linked along their length; the other with fixed-length strands uniformly cross-linked at their ends. The samples were analyzed using oscillatory shear, at very small strains corresponding to the linear regime. This was carried out at a range of frequencies, and at temperatures ranging from the glass plateau, through the glass transition, and well into the rubbery region. Through the glass transition, the data obeyed the time-temperature superposition principle, and could be analyzed using WLF treatment. At higher temperatures, in the rubbery region,the storage modulus was found to deviate from this, taking a value that is independent of frequency.This value increased linearly with temperature, as expected for the entropic rubber elasticity, but with a substantial negative offset inconsistent with straightforward enthalpic effects. Conversely, the loss modulus continued to follow time-temperature superposition, decreasing with increasing temperature, and showing a power-law dependence on frequency.
方案详情

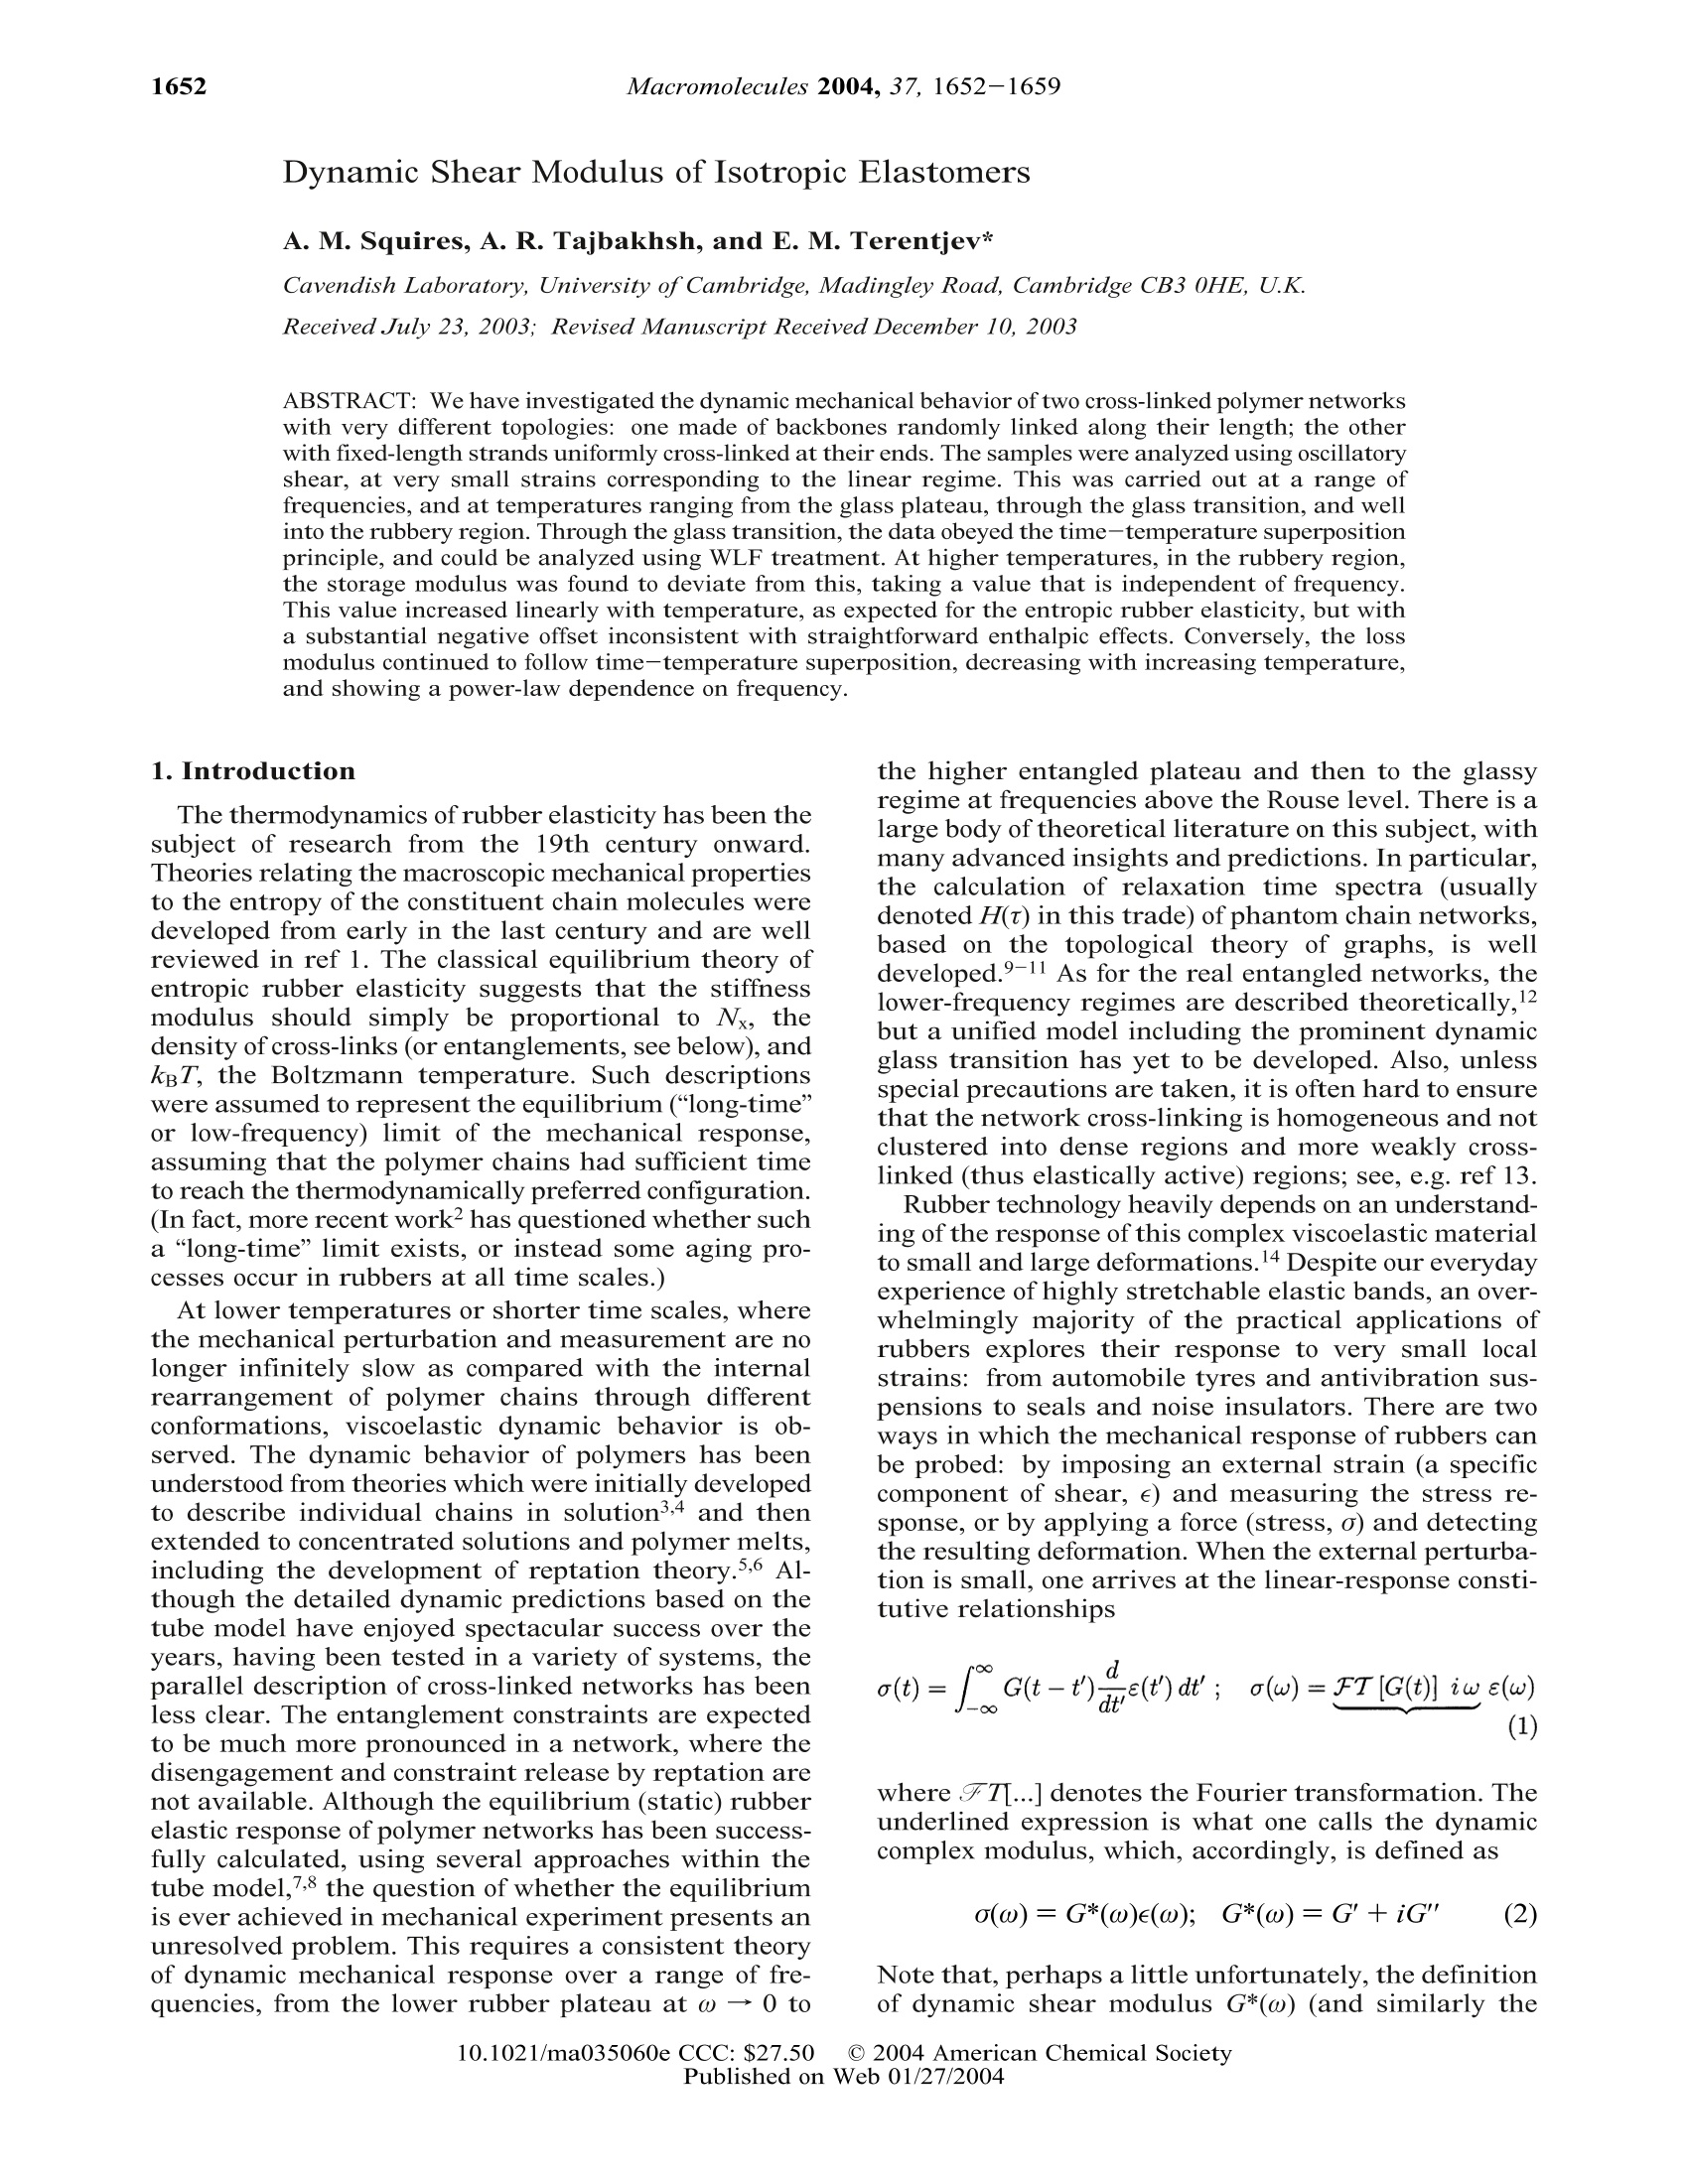
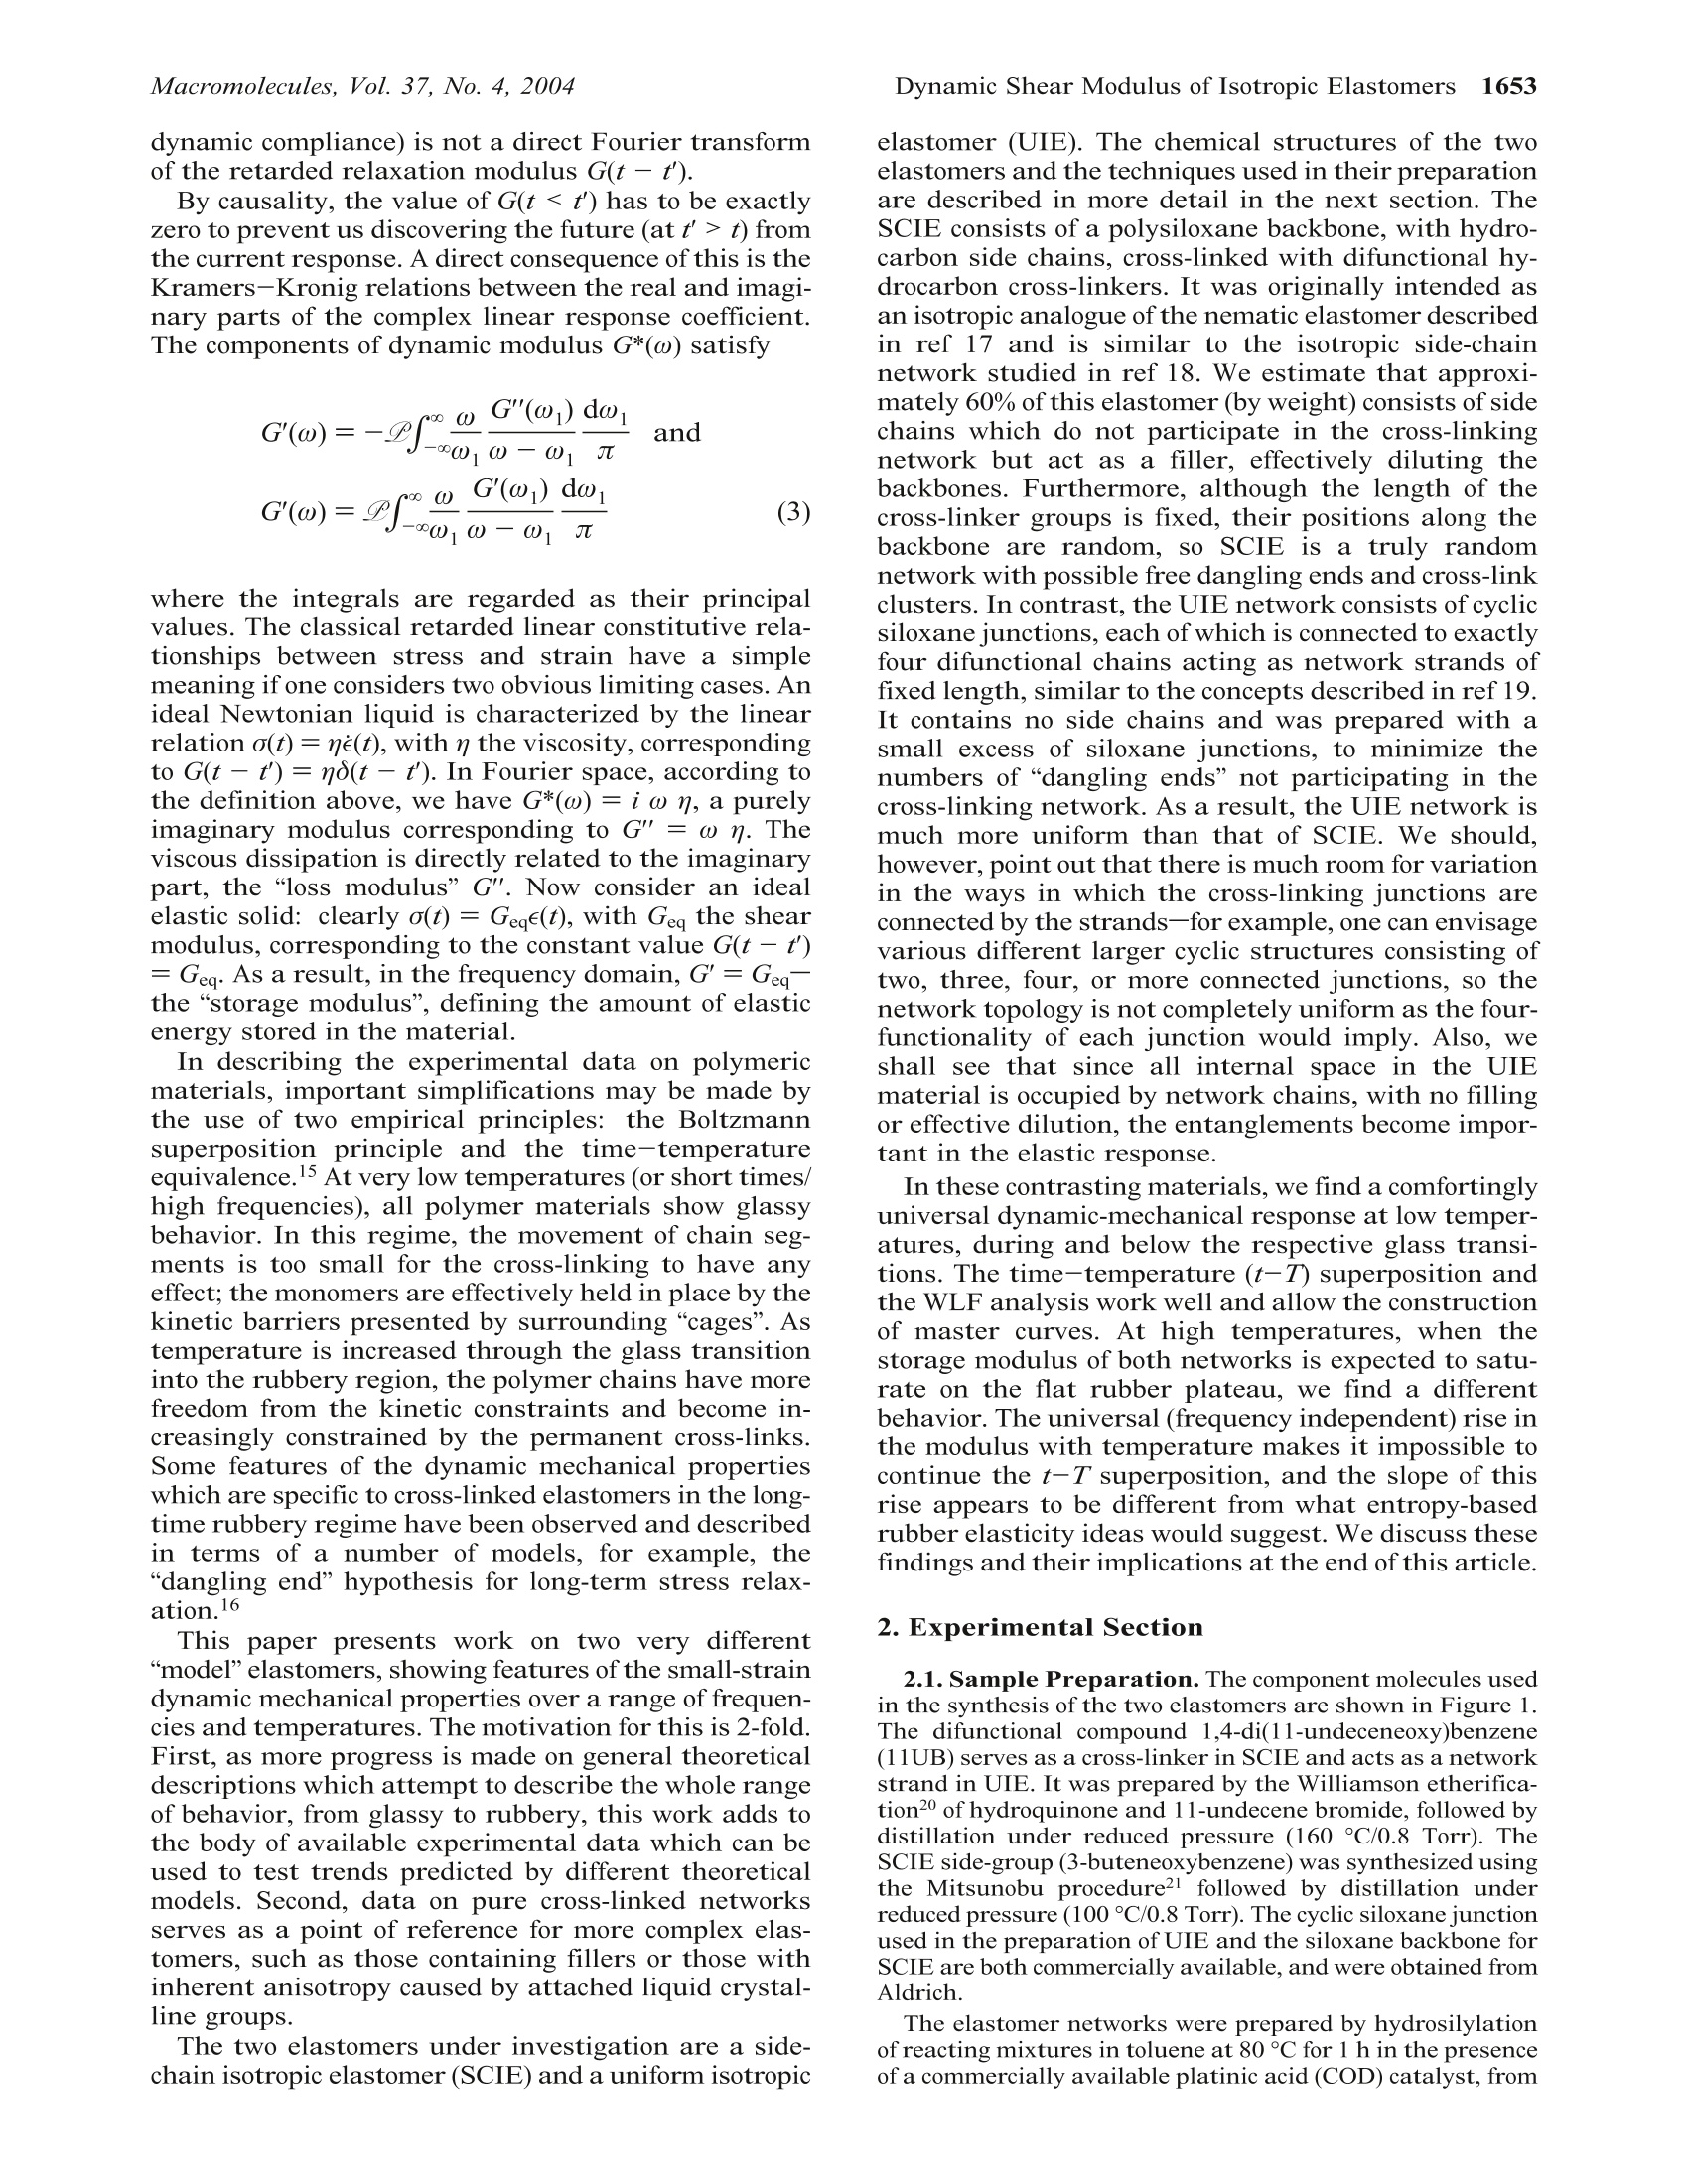
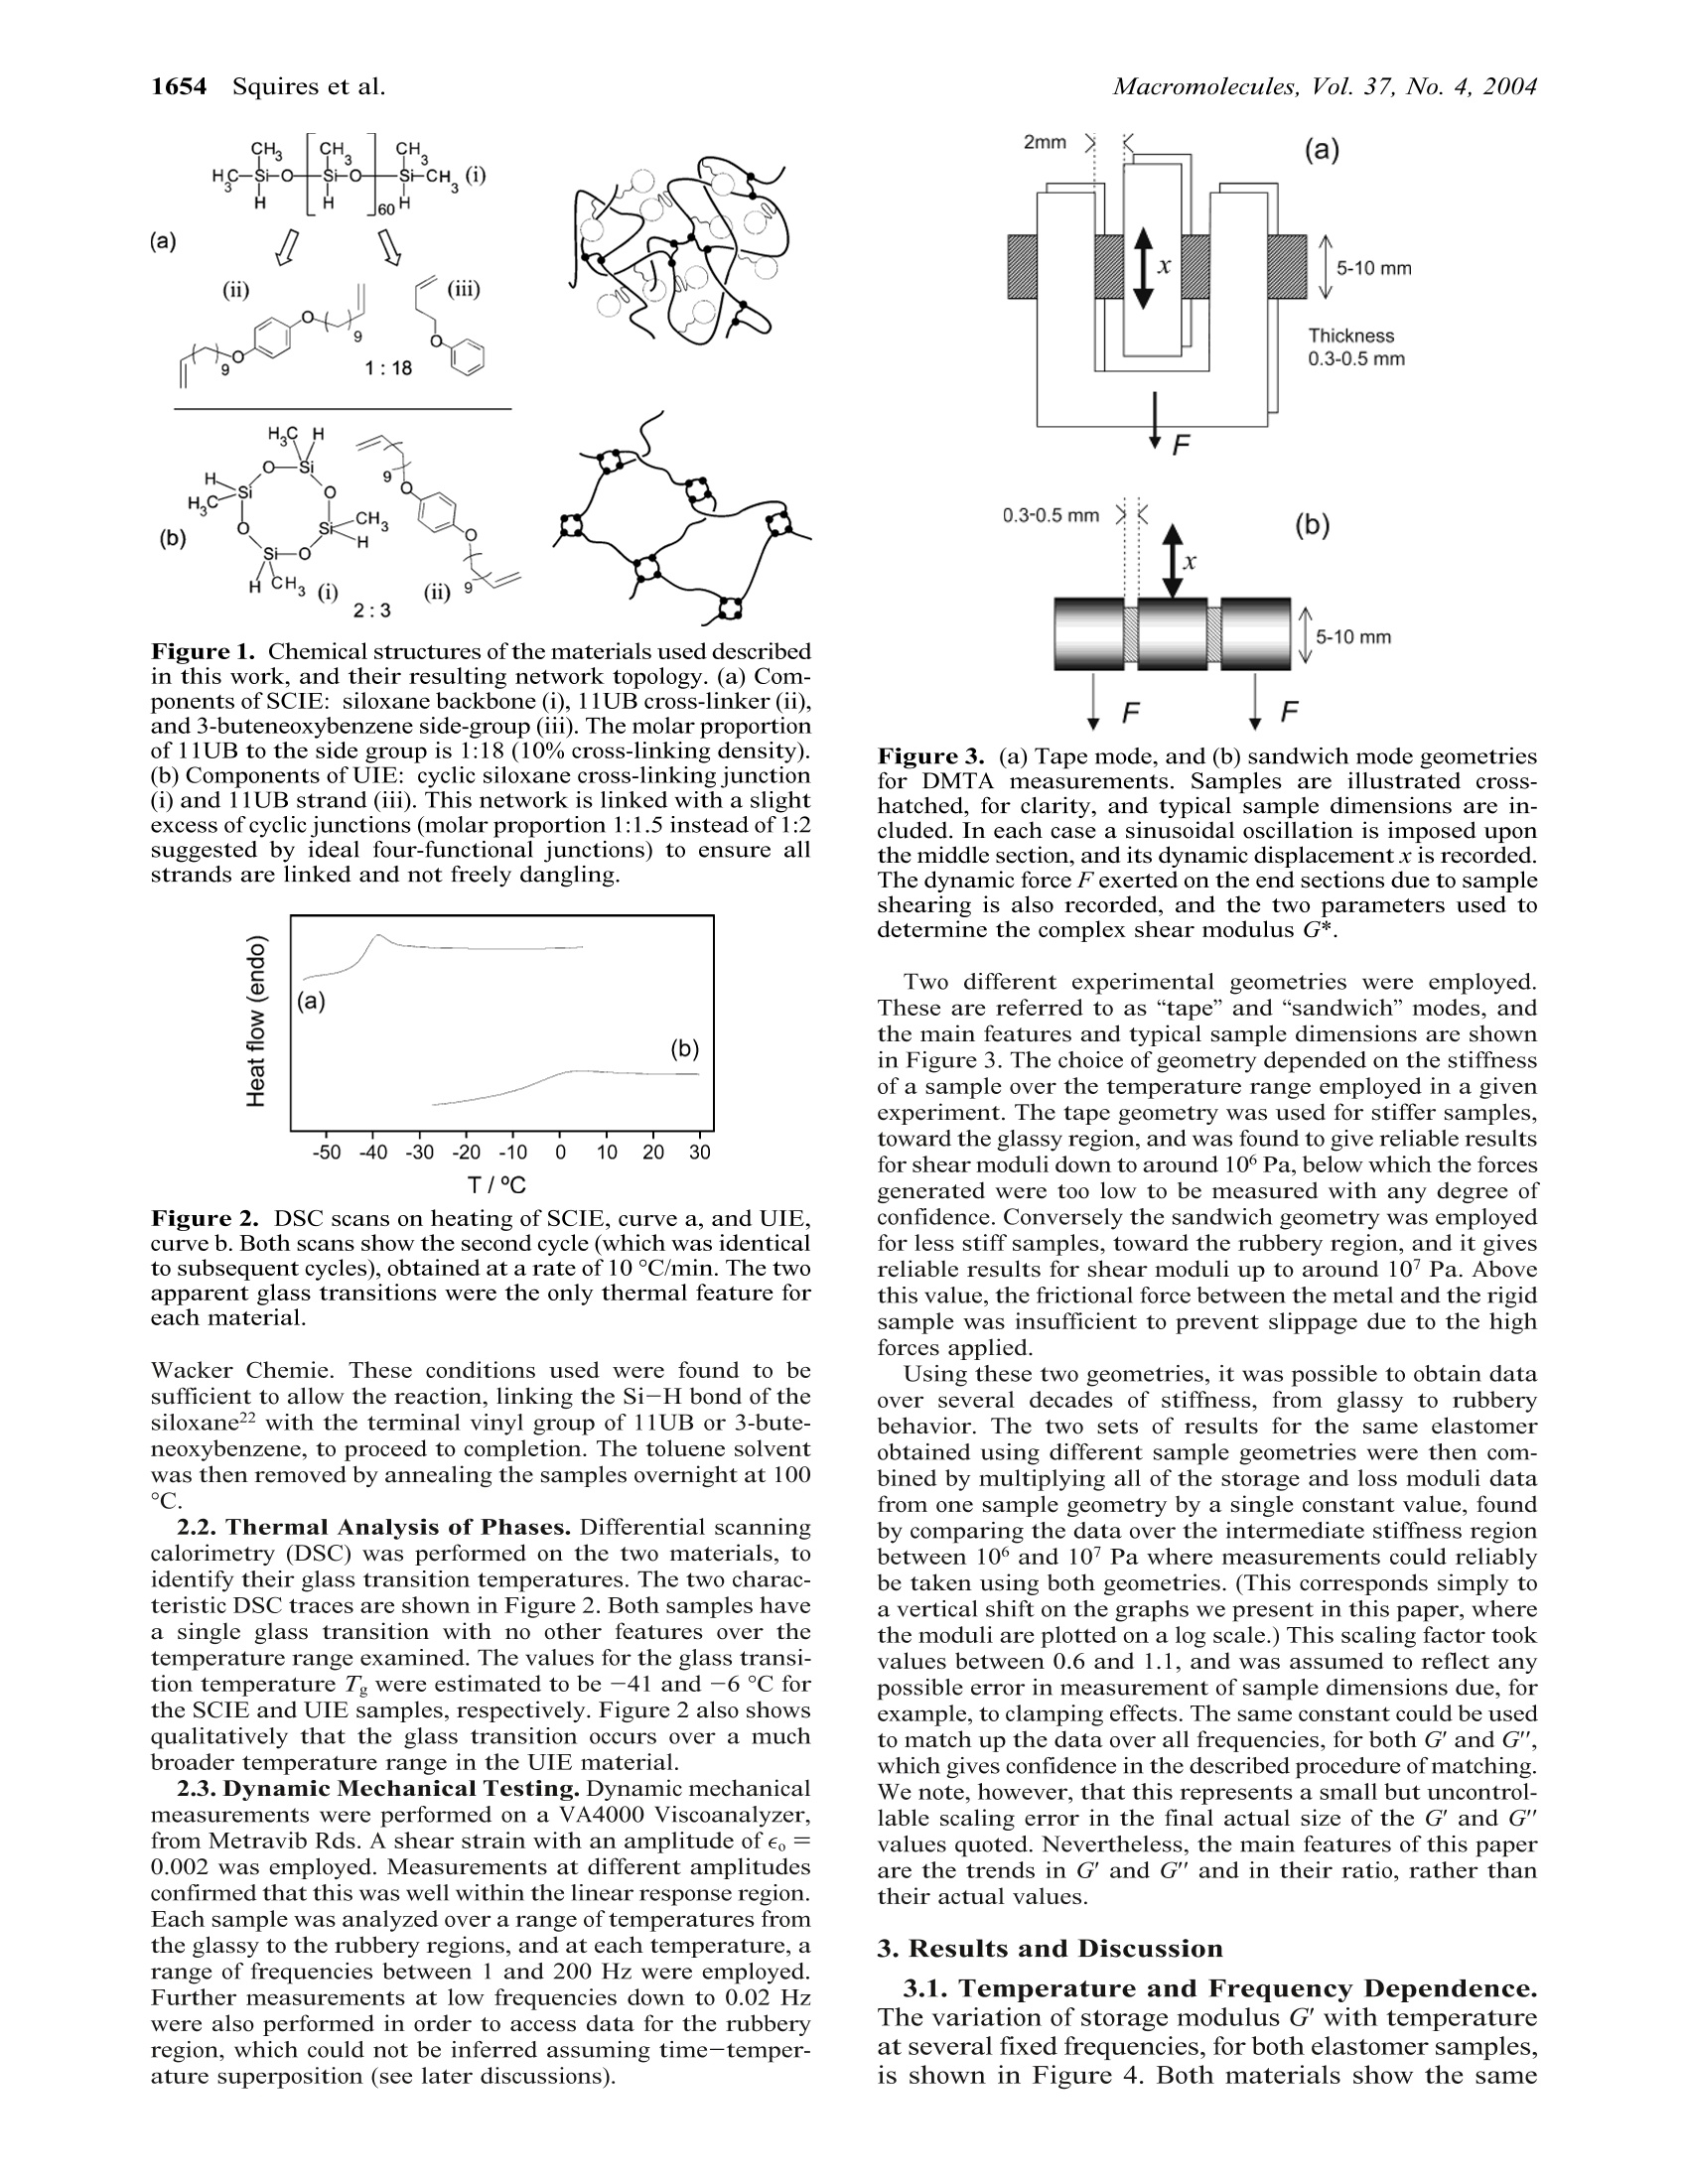
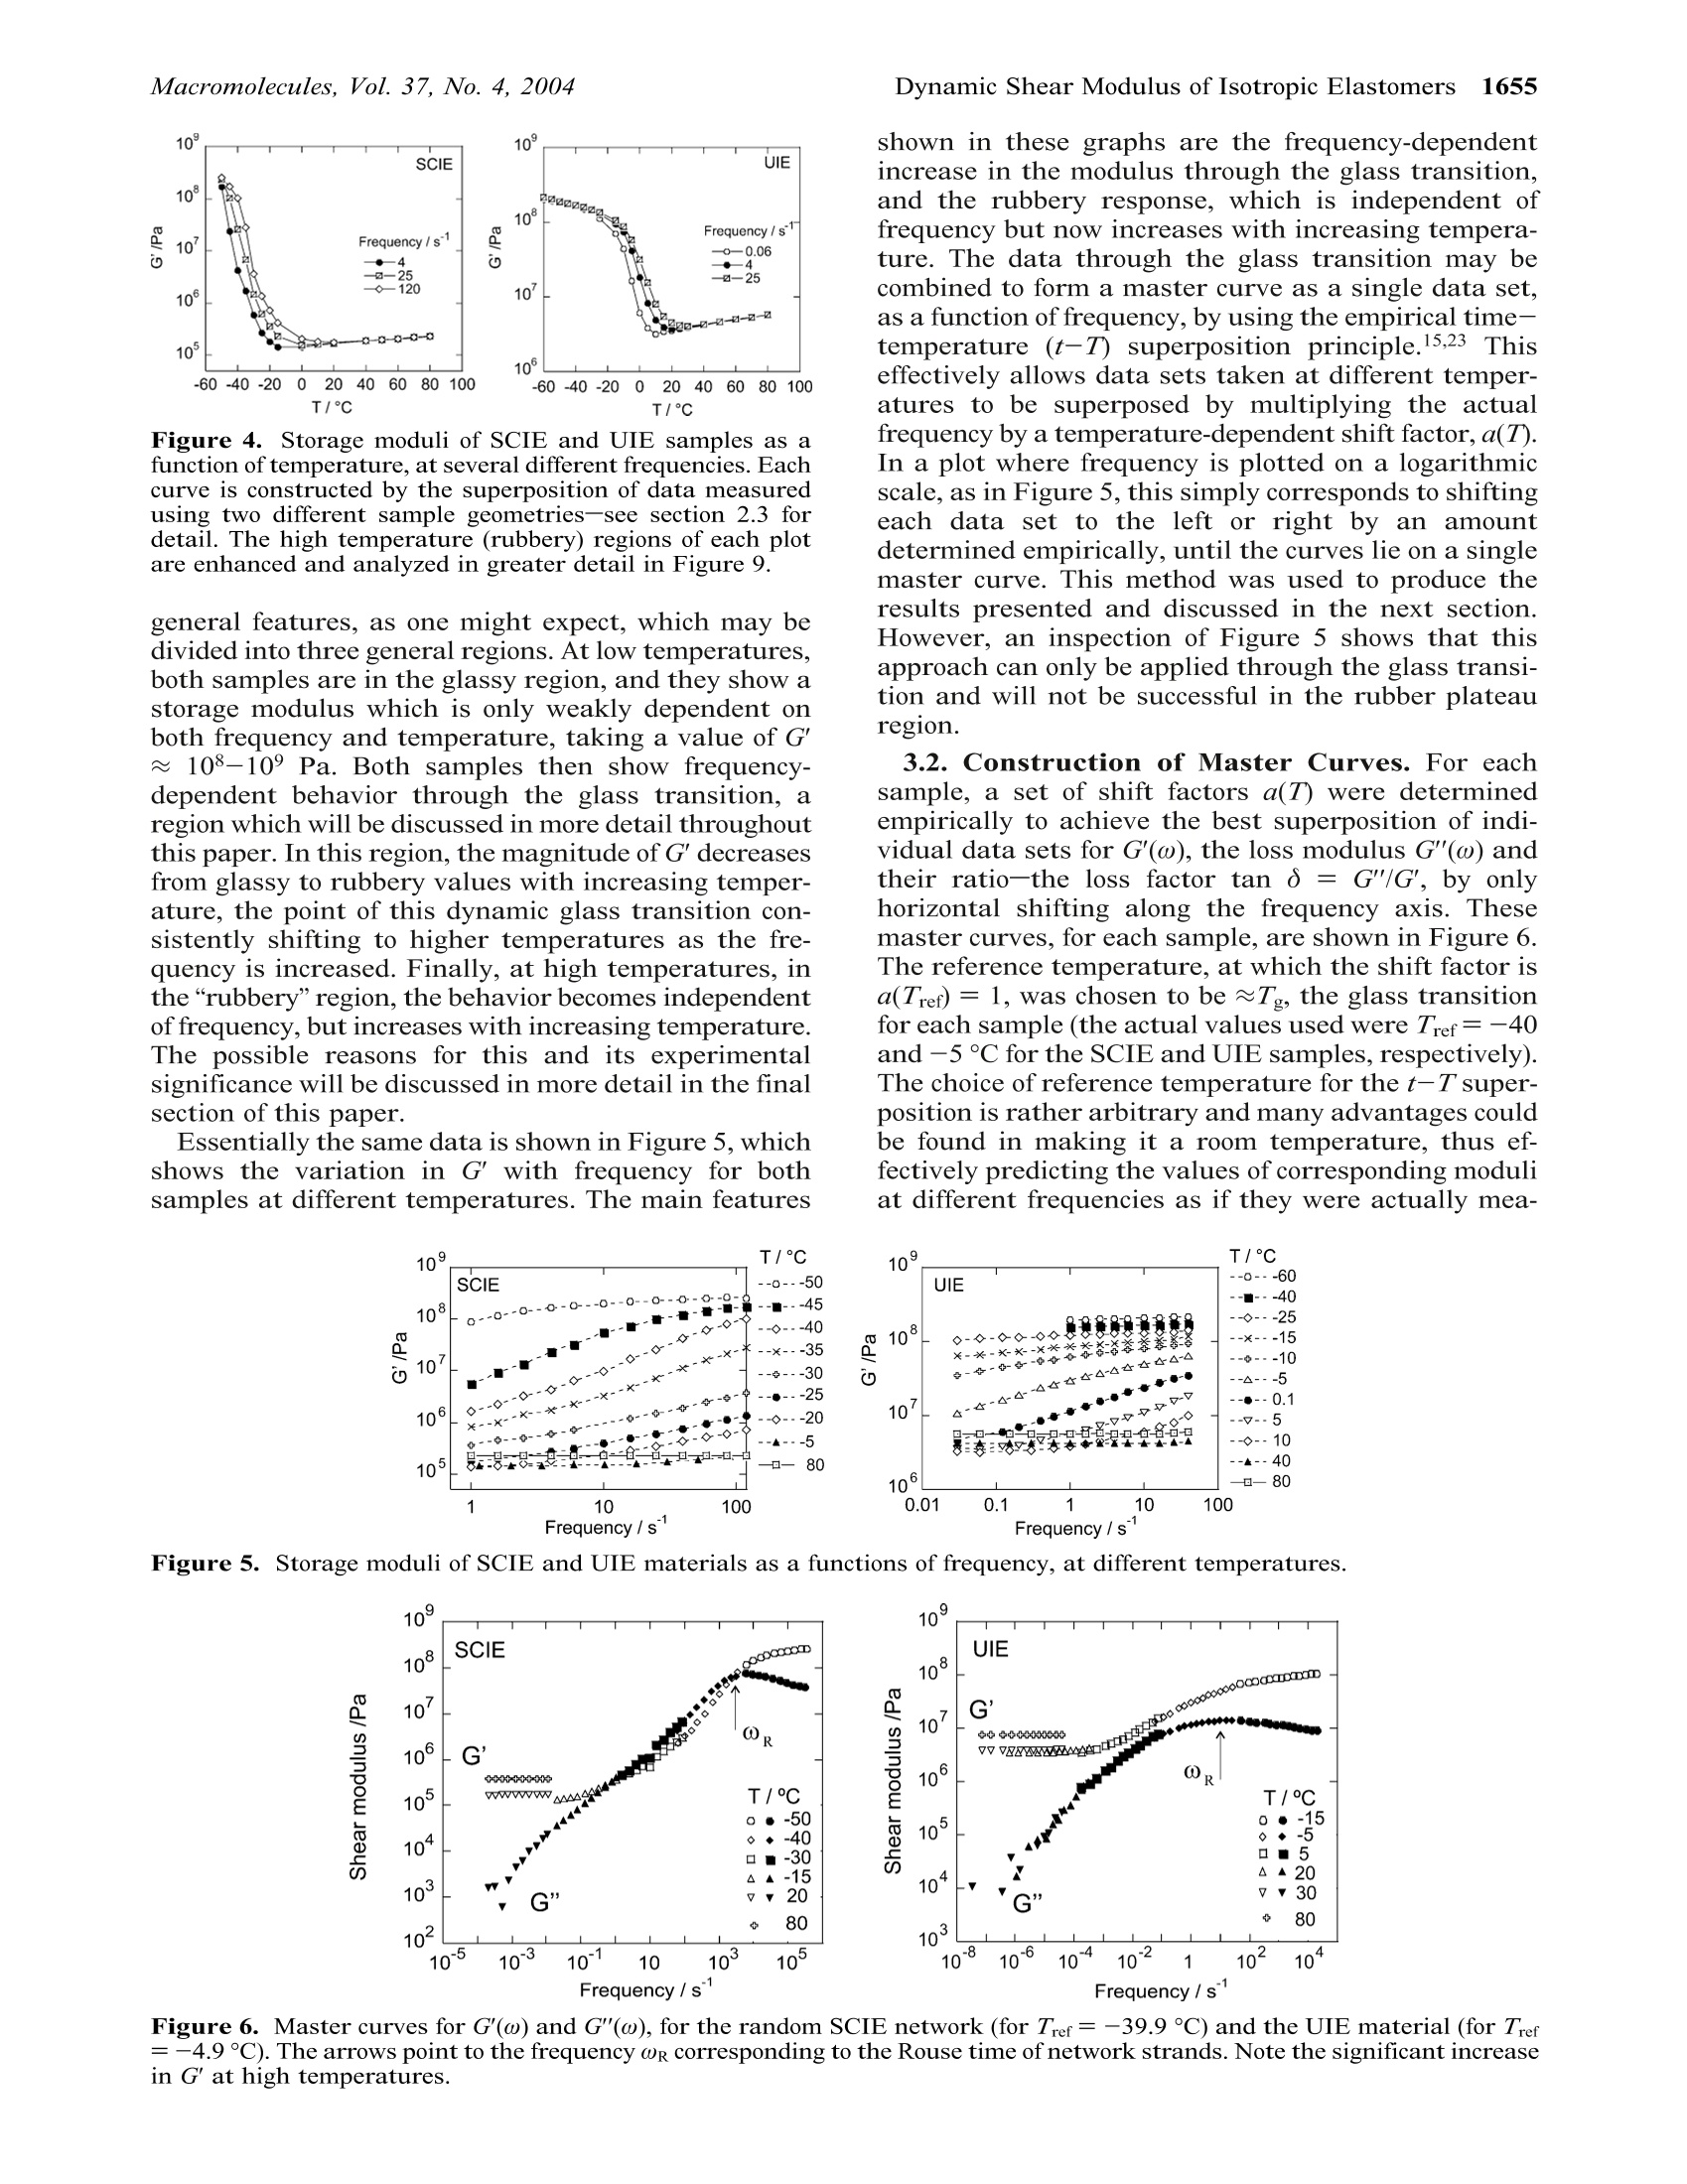
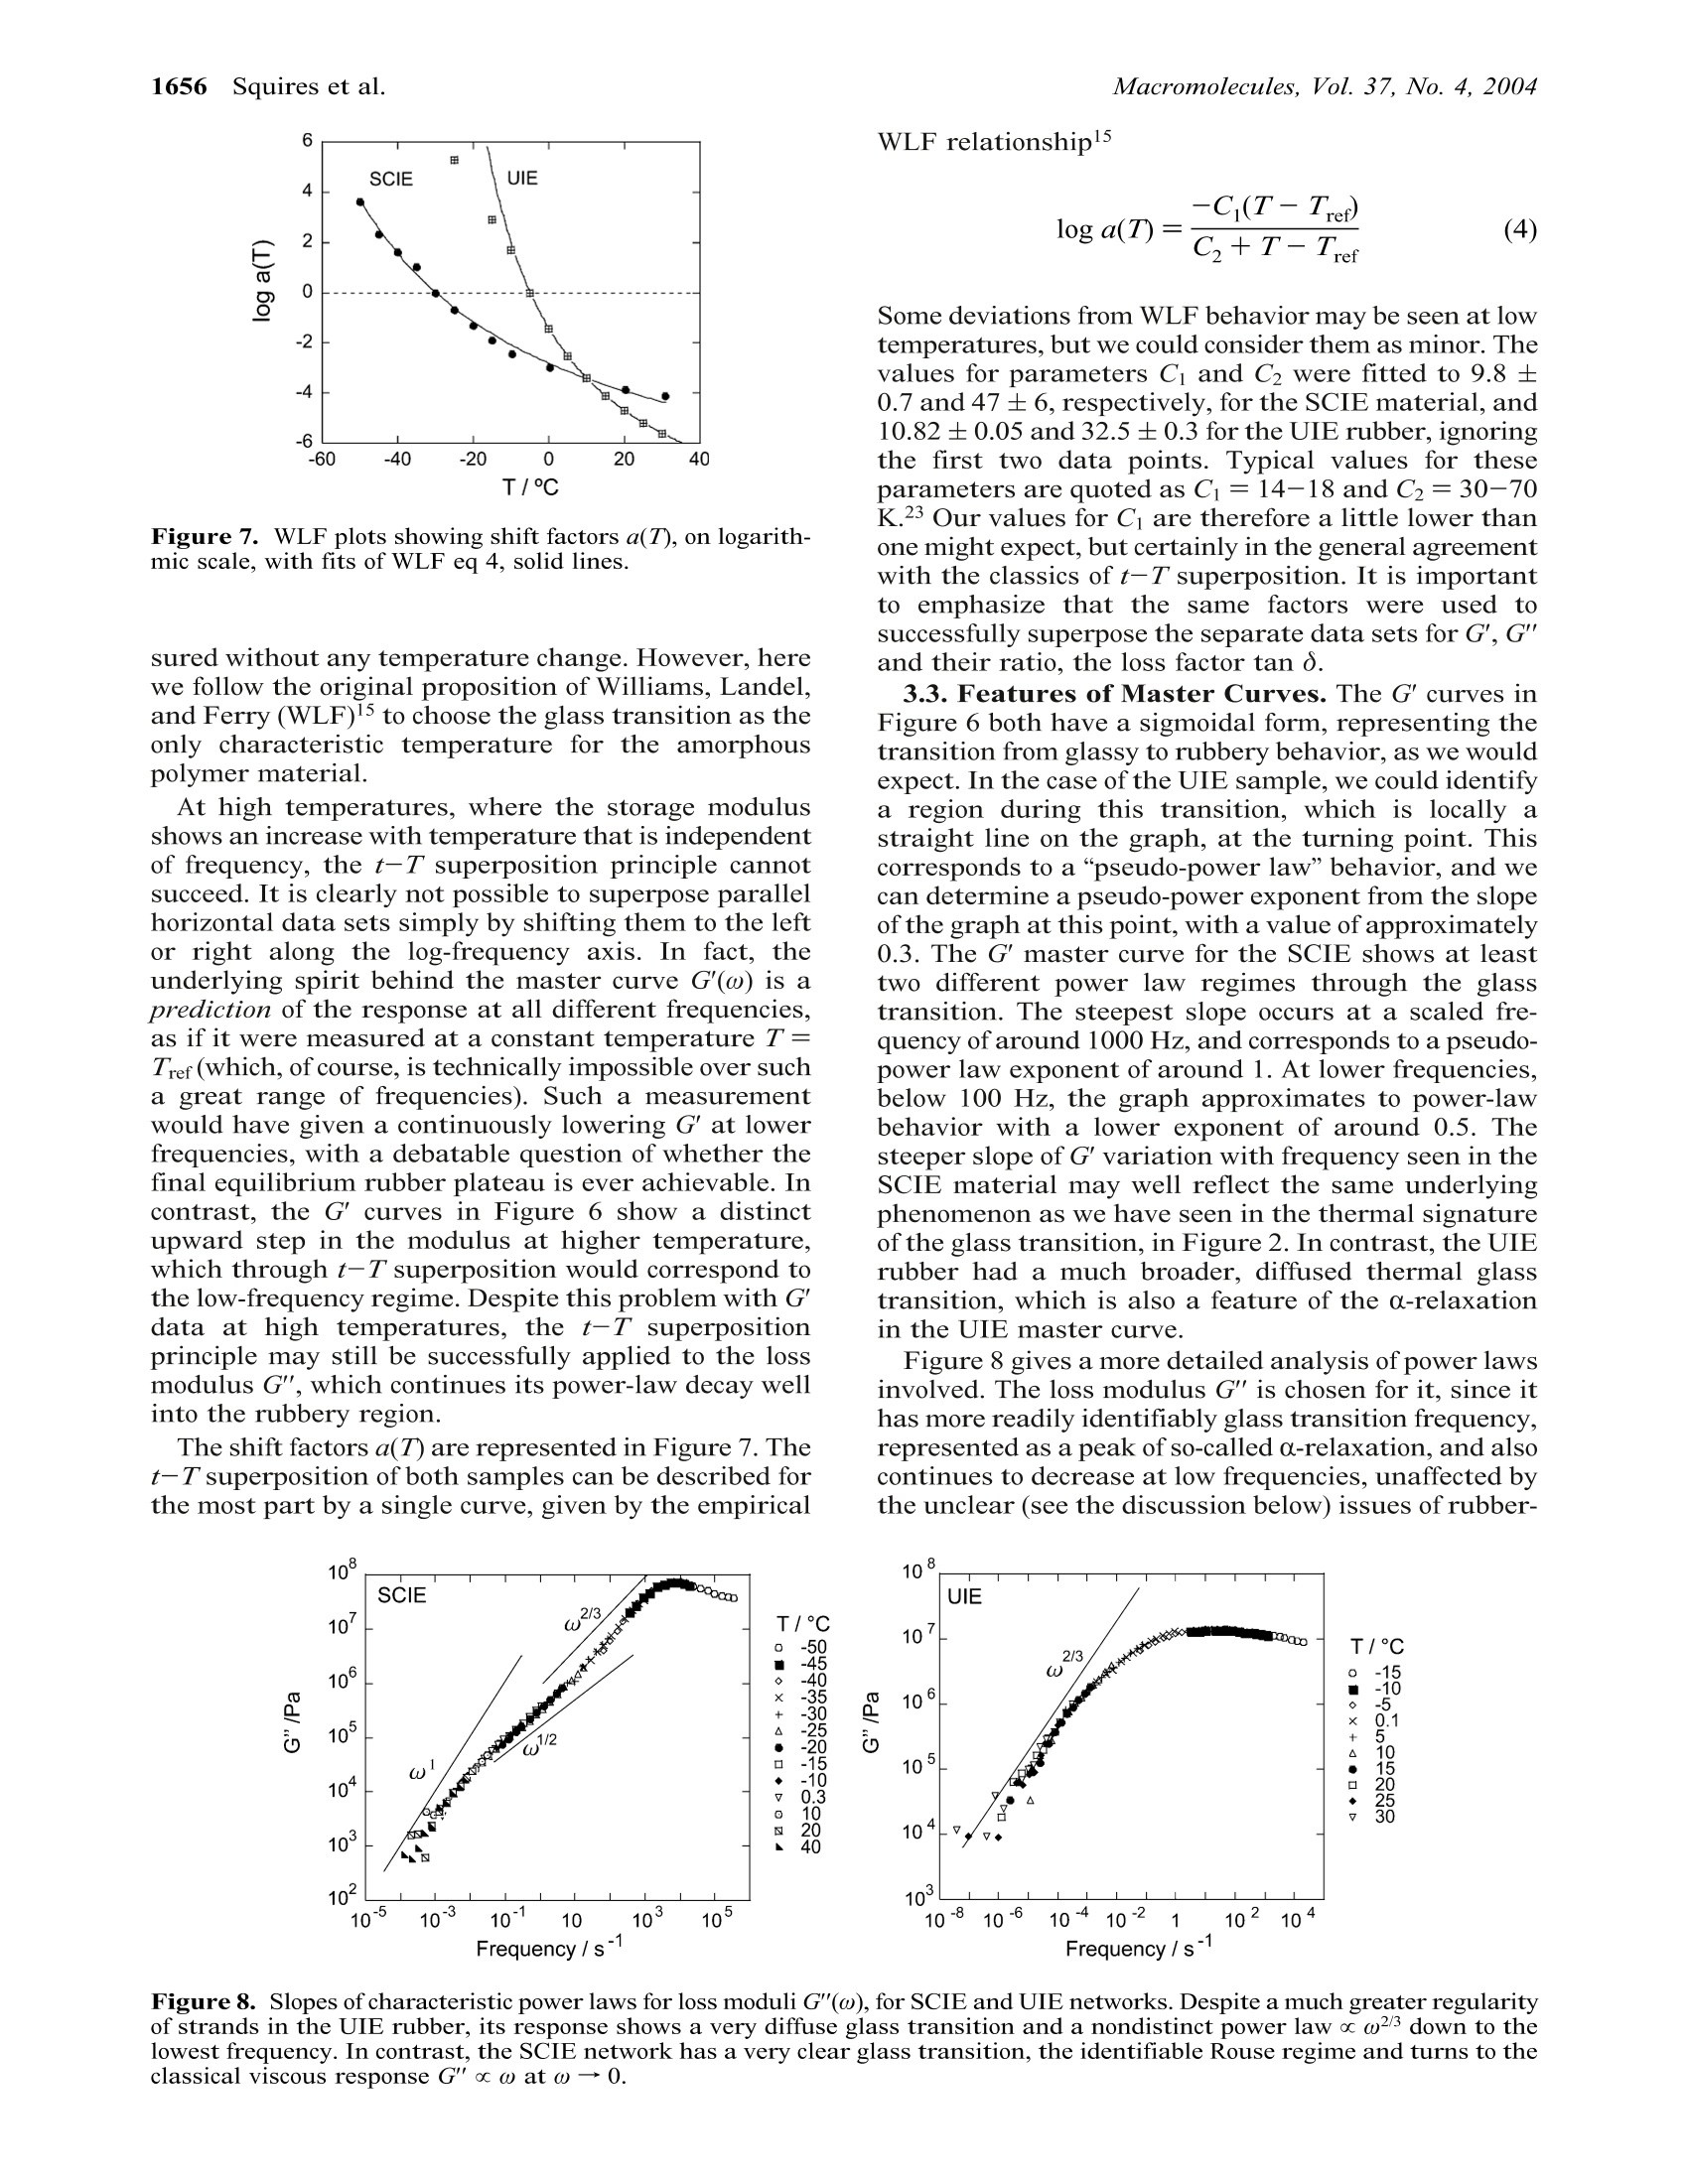
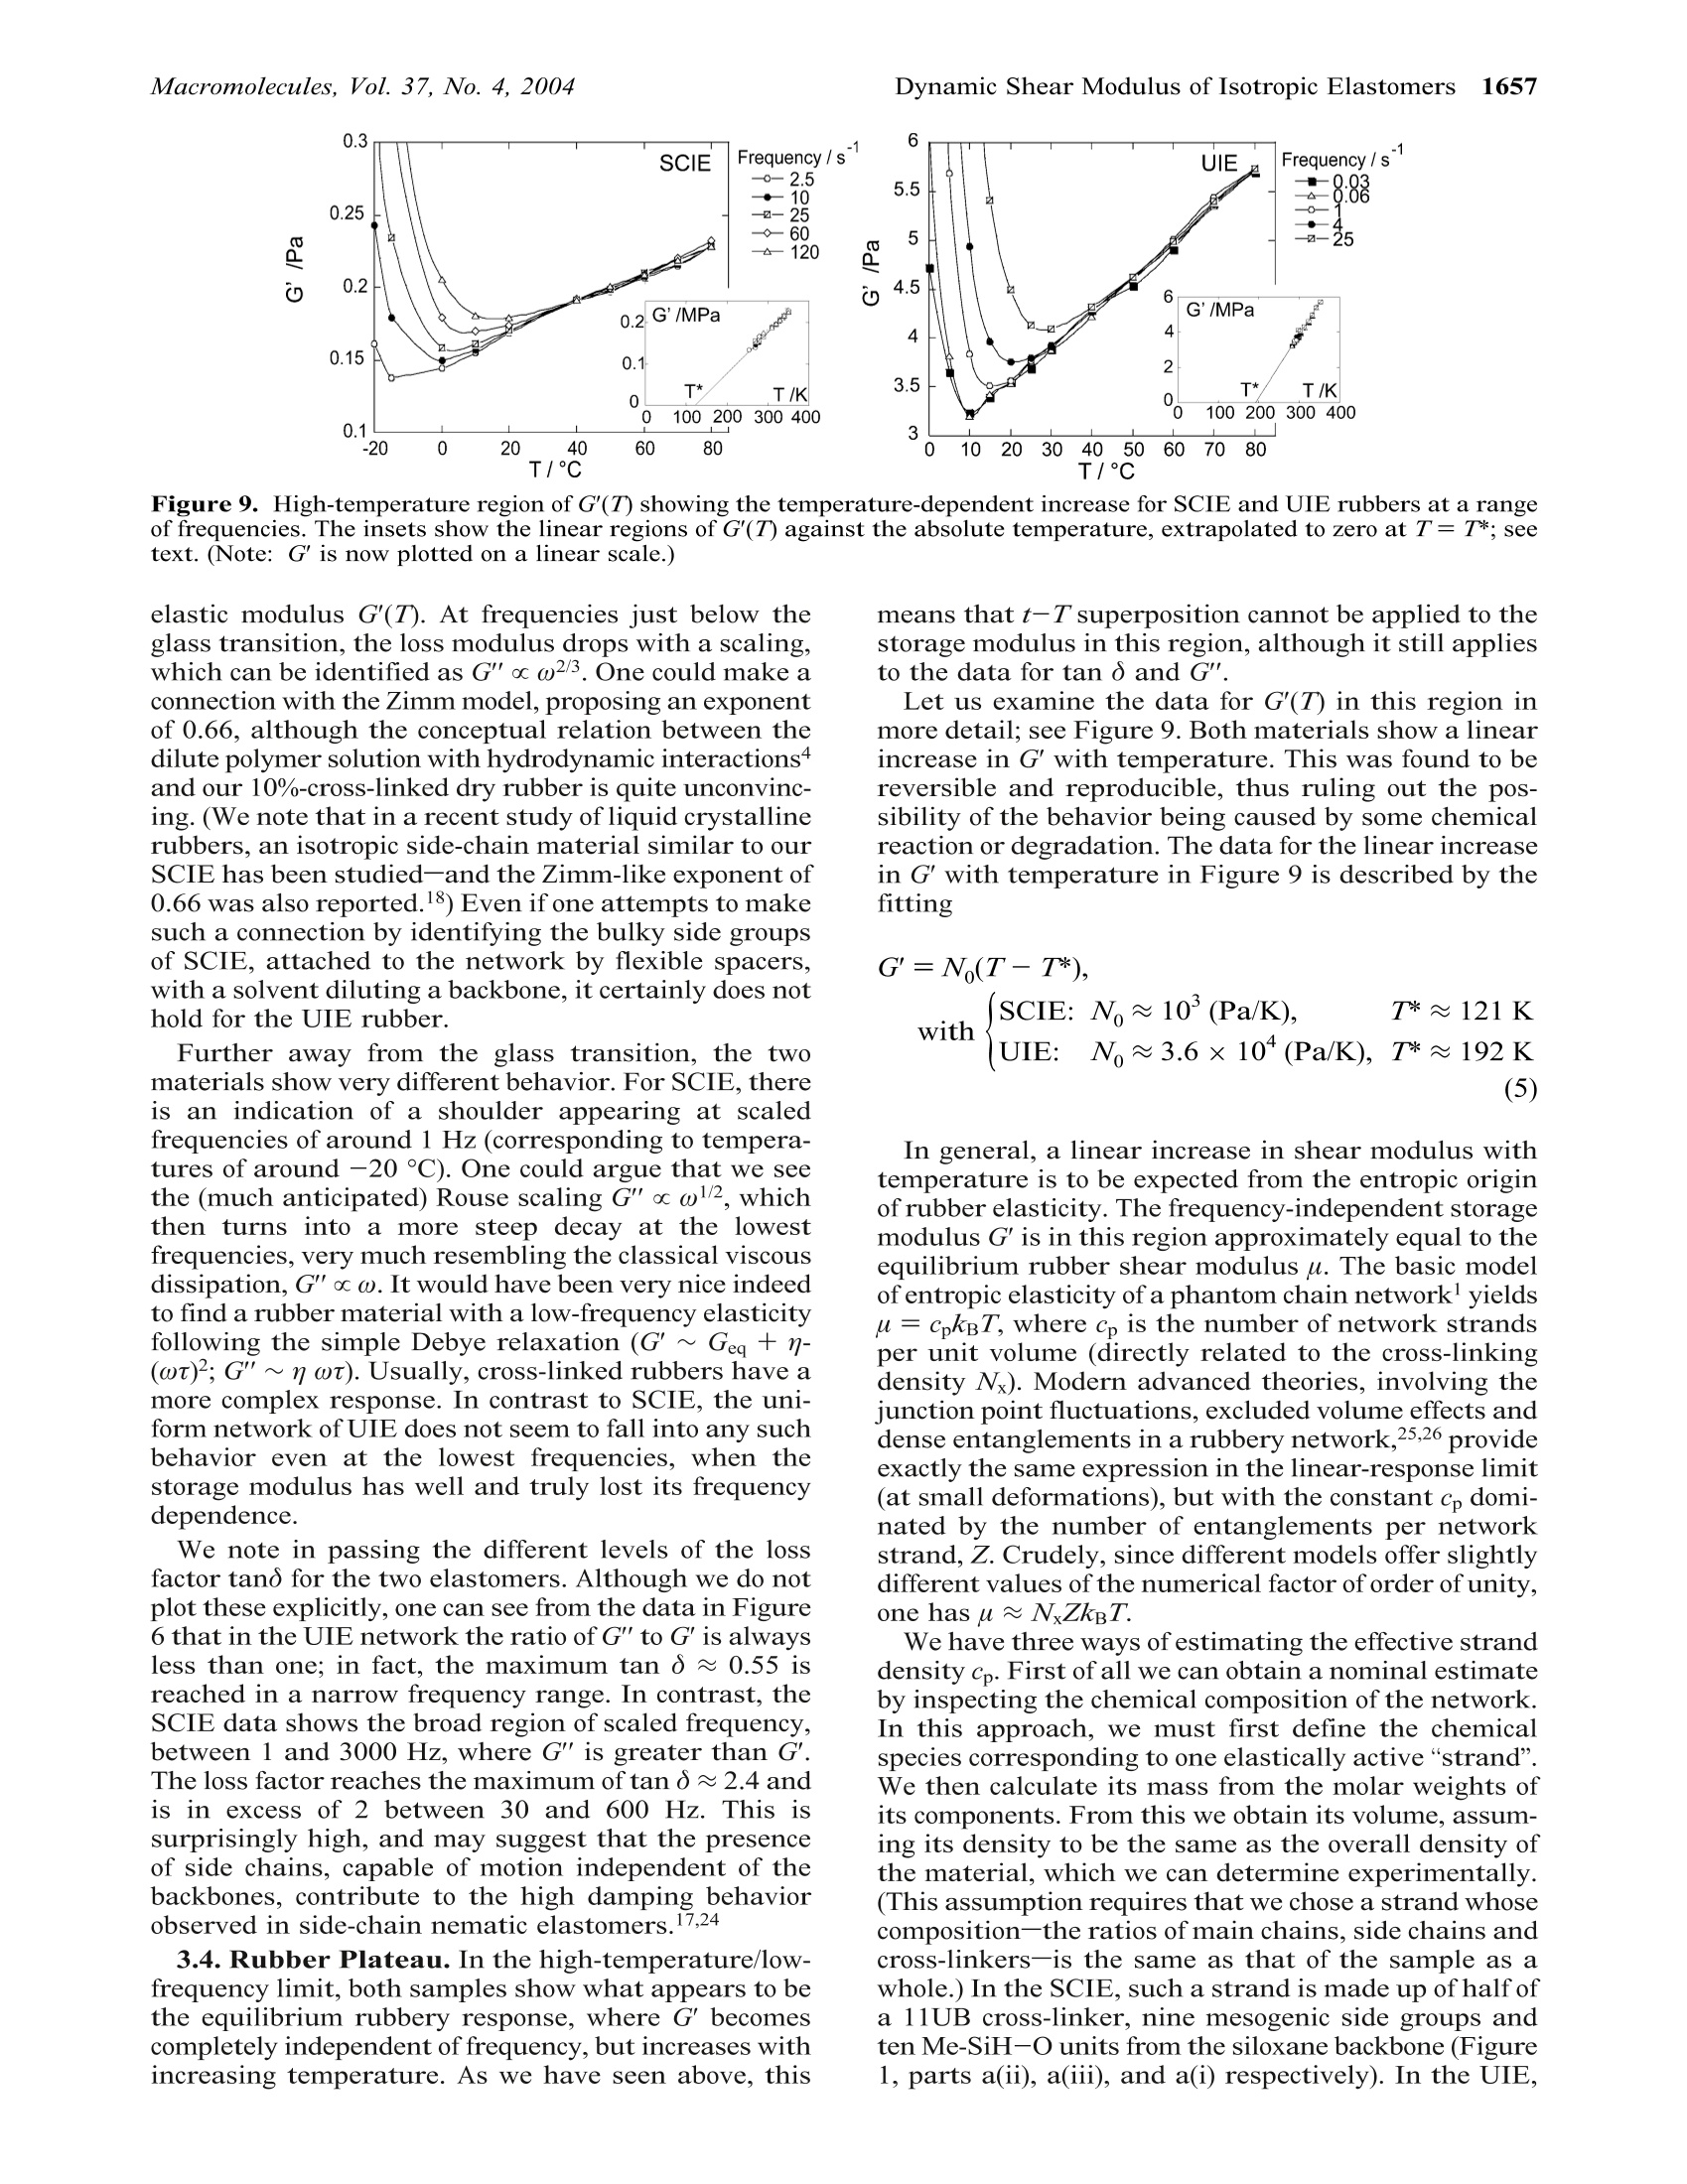
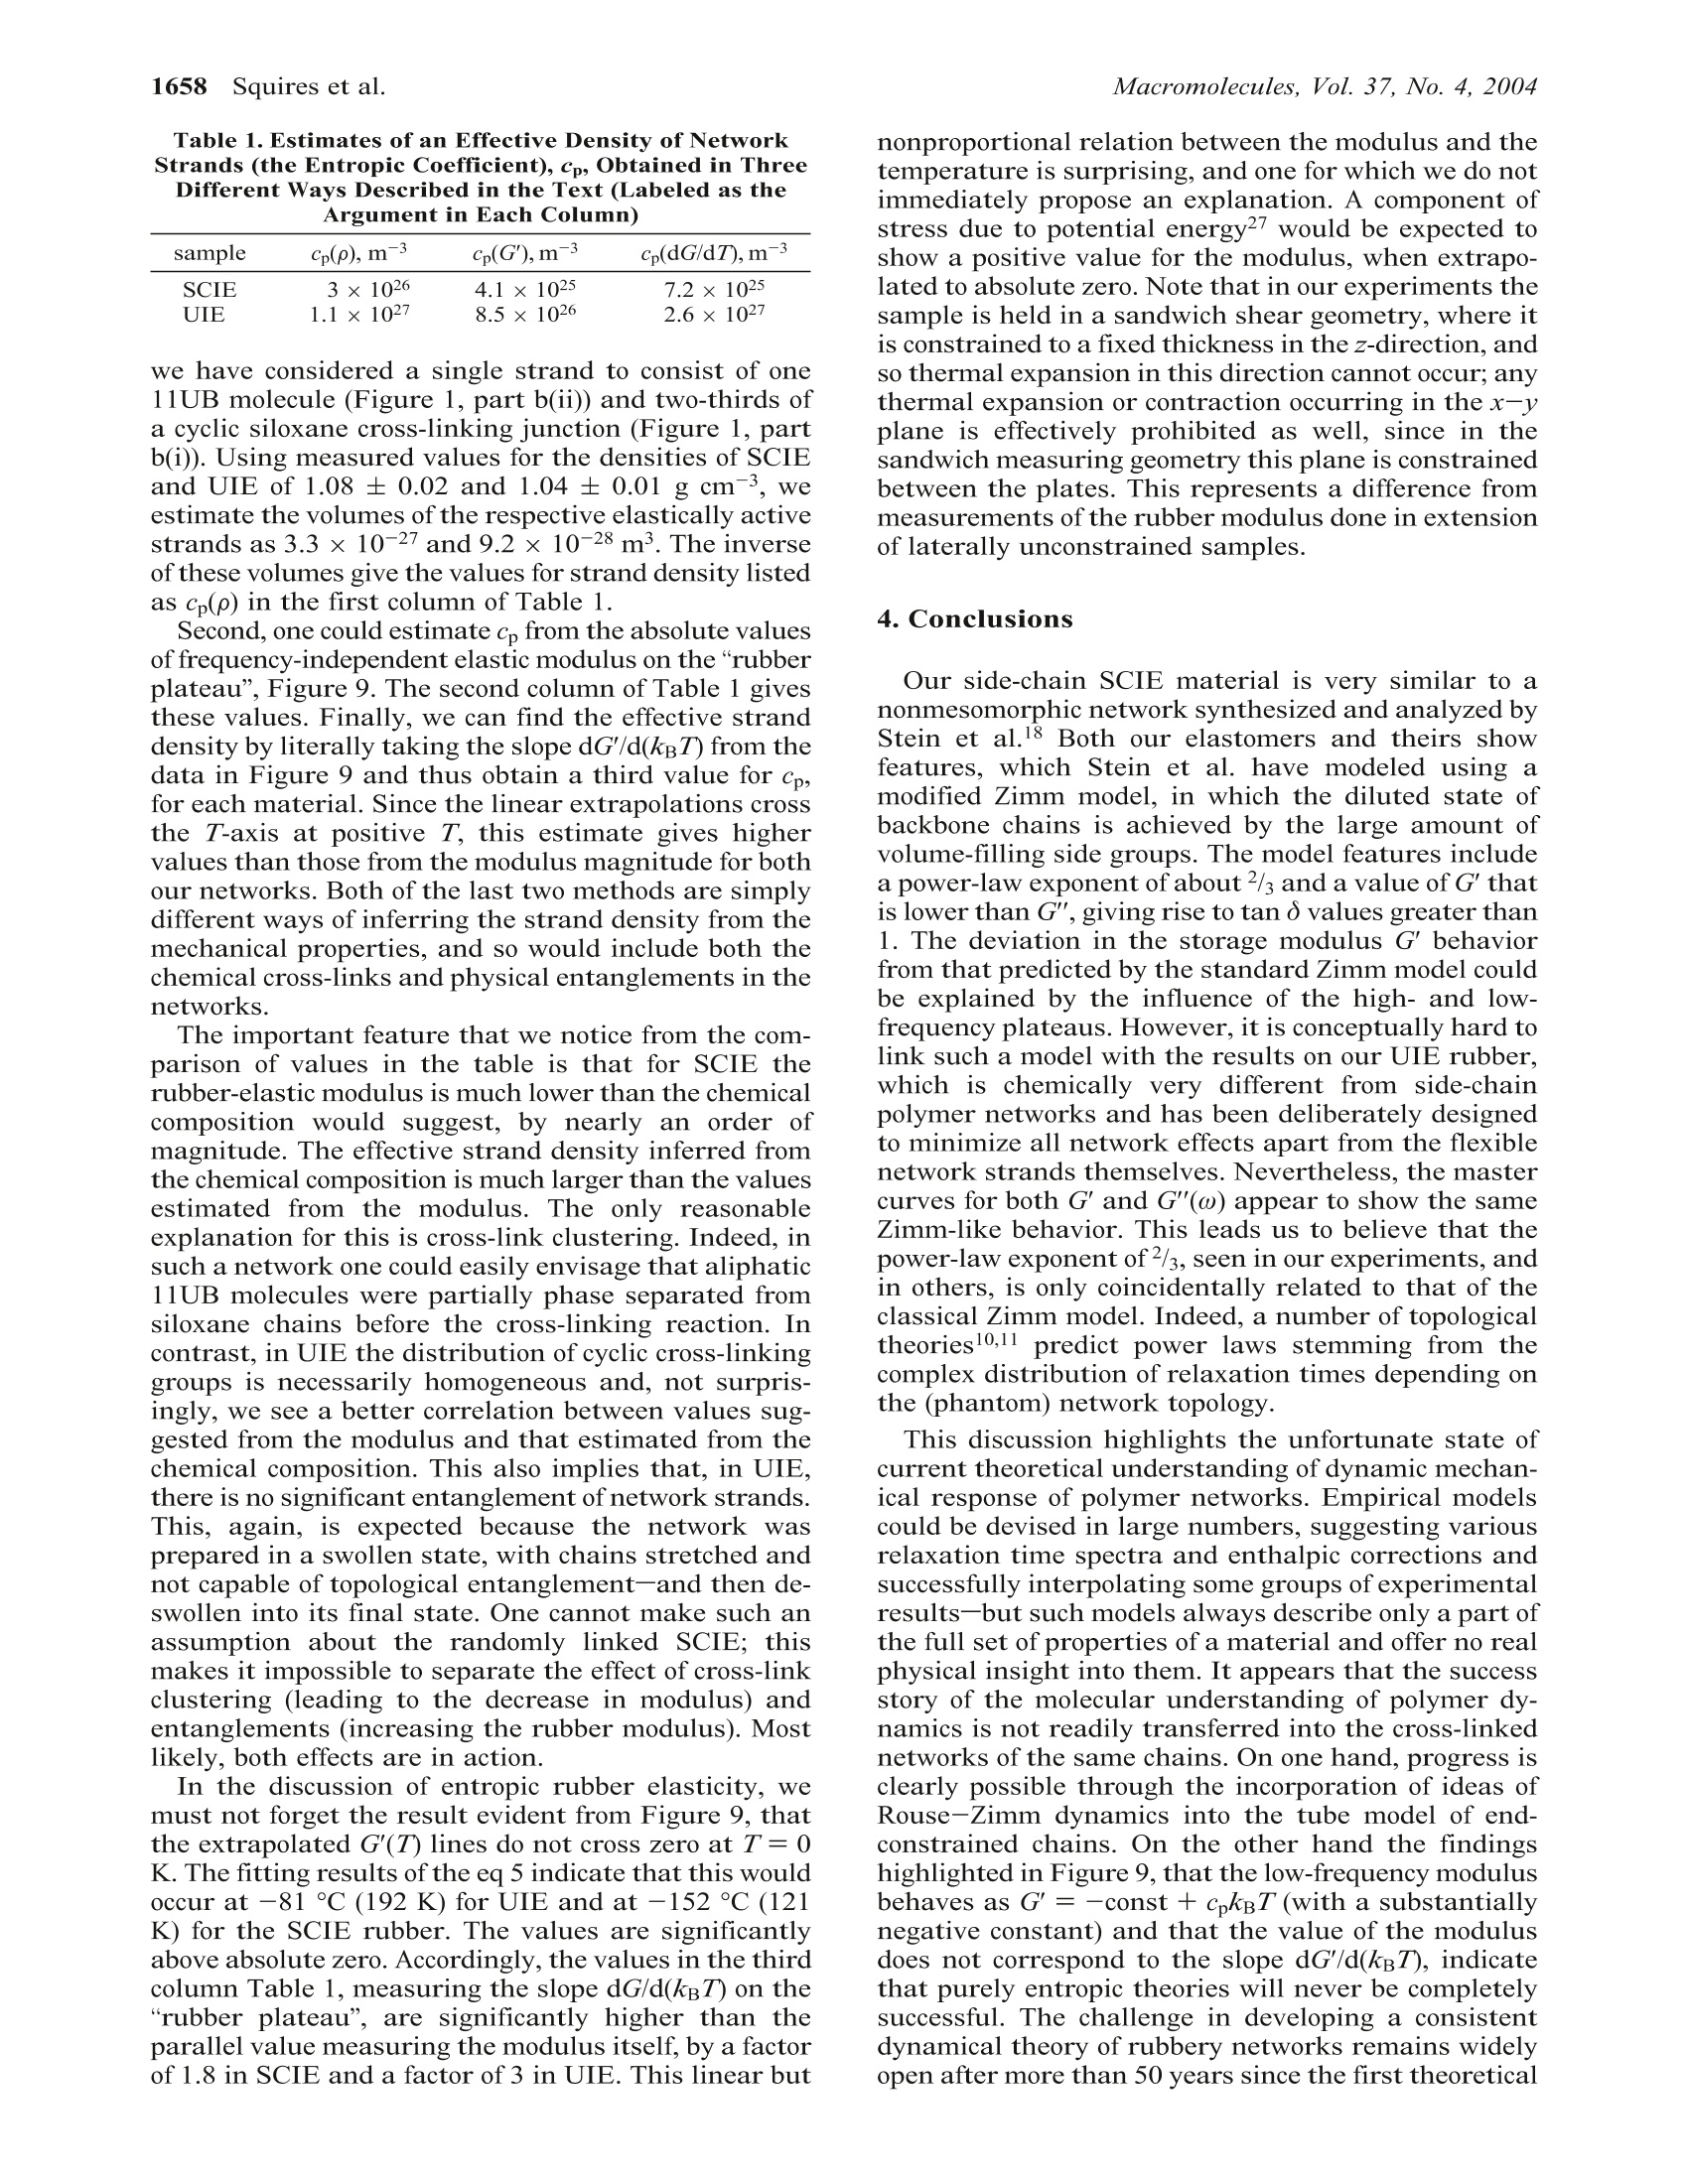
1652Macromolecules 2004, 37, 1652-1659 Dynamic Shear Modulus of Isotropic ElastomersMacromolecules, Vol. 37, No. 4, 20041653 10.1021/ma035060e CCC: $27.50 C 2004 American Chemical SocietyPublished on Web 01/27/2004 Dynamic Shear Modulus of Isotropic Elastomers A. M. Squires, A. R. Tajbakhsh, and E. M. Terentjev* Cavendish Laboratory, University of Cambridge, Madingley Road, Cambridge CB3 0HE, U.K.Received July 23, 2003; Revised Manuscript Received December 10, 2003 ABSTRACT: We have investigated the dynamic mechanical behavior of two cross-linked polymer networkswith very different topologies: one made of backbones randomly linked along their length; the otherwith fixed-length strands uniformly cross-linked at their ends. The samples were analyzed using oscillatoryshear, at very small strains corresponding to the linear regime. This was carried out at a range offrequencies, and at temperatures ranging from the glass plateau, through the glass transition, and wellinto the rubbery region. Through the glass transition, the data obeyed the time-temperature superpositionprinciple, and could be analyzed using WLF treatment. At higher temperatures, in the rubbery region,the storage modulus was found to deviate from this, taking a value that is independent of frequency.This value increased linearly with temperature, as expected for the entropic rubber elasticity, but withyWa substantial negative offset inconsistent with straightforward enthalpic effects. Conversely, the lossmodulus continued to follow time-temperature superposition, decreasing with increasing temperature,and showing a power-law dependence on frequency. 1.Introduction The thermodynamics of rubber elasticity has been thesubject of research from the 19th century onward.Theories relating the macroscopic mechanical propertiesto the entropy of the constituent chain molecules weredeveloped from early in the last century and are wellreviewed in ref 1. The classical equilibrium theory ofentropic rubber elasticity suggests that the stiffnessmodulus should simply be proportional to Nx, thedensity of cross-links (or entanglements, see below), andkBT, the Boltzmann temperature. Such descriptionswere assumed to represent the equilibrium (“long-time"or low-frequency) limit of the mechanical response,assuming that the polymer chains had sufficient timeto reach the thermodynamically preferred configuration.(In fact, more recent work? has questioned whether sucha “long-time”limit exists, or instead some aging pro-cesses occur in rubbers at all time scales.) At lower temperatures or shorter time scales, wherethe mechanical perturbation and measurement are nolonger infinitely slow as compared with the internalrearrangement of polymer chains through differentconformations, viscoelastic dynamic behavior is ob-served. The dynamic behavior of polymers has beenunderstood from theories which were initially developedto describe individual chains in solution3,4 and thenextended to concentrated solutions and polymer melts,including the development of reptation theory.5,6 Al-though the detailed dynamic predictions based on thetube model have enjoyed spectacular success over theyears, having been tested in a variety of systems, theparallel description of cross-linked networks has beenless clear. The entanglement constraints are expectedto be much more pronounced in a network, where thedisengagement and constraint release by reptation arenot available. Although the equilibrium (static) rubberelastic response of polymer networks has been success-fully calculated, using several approaches within thetube model,7,8 the question of whether the equilibriumis ever achieved in mechanical experiment presents anunresolved problem. This requires a consistent theoryof dynamic mechanical response over a range of fre-quencies, from the lower rubber plateau at ω 0 to the higher entangled plateau and then to the glassyregime at frequencies above the Rouse level. There is alarge body of theoretical literature on this subject, withmany advanced insights and predictions. In particular,the calculation of relaxation time spectra (usuallydenoted H(t) in this trade) of phantom chain networks,based on the topological theory of graphs, is welldeveloped.9-11 As for the real entangled networks, thelower-frequency regimes are described theoretically,but a unified model including the prominent dynamicglass transition has yet to be developed. Also, unlessspecial precautions are taken, it is often hard to ensurethat the network cross-linking is homogeneous and notclustered into dense regions and more weakly cross-linked (thus elastically active)regions; see,e.g. ref 13. Rubber technology heavily depends on an understand-ing of the response of this complex viscoelastic materialto small and large deformations.14 Despite our everydayexperience of highly stretchable elastic bands, an over-whelmingly majority of the practical applications ofrubbers explores their response to very small localstrains: from automobile tyres and antivibration sus-pensions to seals and noise insulators. There are twoways in which the mechanical response of rubbers canbe probed: by imposing an external strain (a specificcomponent of shear, e) and measuring the stress re-sponse, or by applying a force (stress, a) and detectingthe resulting deformation. When the external perturba-tion is small, one arrives at the linear-response consti-tutive relationships where T[...] denotes the Fourier transformation. Theunderlined expression is what one calls the dynamiccomplex modulus, which,accordingly,is defined as Note that, perhaps a little unfortunately, the definitionof dynamic shear modulus G*(w) (and similarly the dynamic compliance) is not a direct Fourier transformof the retarded relaxation modulus G(t -t'). By causality, the value of G(tt) fromthe current response. A direct consequence of this is theKramers-Kronig relations between the real and imagi-nary parts of the complex linear response coefficient.The components of dynamic modulus G*(ω) satisfy where the integrals are regarded as their principalvalues. The classical retarded linear constitutive rela-tionships between stress and strain have a simplemeaning if one considers two obvious limiting cases. Anideal Newtonian liquid is characterized by the linearrelation o(t)=ne(t), with n the viscosity, correspondingto G(t-t')=no(t-t). In Fourier space, according tothe definition above, we have G*(w) =i w n, a purelyimaginary modulus corresponding to G"= w n. Theviscous dissipation is directly related to the imaginarypart, the “loss modulus”G". Now consider an idealelastic solid: clearly o(t)= Geqe(t), with Geq the shearmodulus, corresponding to the constant value G(t -t)= Geq. As a result, in the frequency domain, G'= Geqqthe“storage modulus”, defining the amount of elasticenergy stored in the material. In describing the experimental data on polymericmaterials, important simplifications may be made bythe use of two empirical principles: the Boltzmannsuperposition principle and the time-temperatureequivalence.15 At very low temperatures (or short times/high frequencies), all polymer materials show glassybehavior. In this regime, the movement of chain seg-ments is too small for the cross-linking to have anyeffect; the monomers are effectively held in place by thekinetic barriers presented by surrounding“cages”. Astemperature is increased through the glass transitioninto the rubbery region, the polymer chains have morefreedom from the kinetic constraints and become in-creasingly constrained by the permanent cross-links.Some features of the dynamic mechanical propertieswhich are specific to cross-linked elastomers in the long-time rubbery regime have been observed and describedin terms of a number of models, for example, the"dangling end”hypothesis for long-term stress relax-ation.16 This paper presents work on two very different“model”elastomers, showing features of the small-straindynamic mechanical properties over a range of frequen-cies and temperatures. The motivation for this is 2-fold.First, as more progress is made on general theoreticaldescriptions which attempt to describe the whole rangeof behavior, from glassy to rubbery, this work adds tothe body of available experimental data which can beused to test trends predicted by different theoreticalmodels. Second, data on pure cross-linked networksserves as a point of reference for more complex elas-tomers, such as those containing fillers or those withinherent anisotropy caused by attached liquid crystal-line groups. The two elastomers under investigation are a side-chain isotropic elastomer (SCIE) and a uniform isotropic elastomer (UIE). The chemical structures of the twoelastomers and the techniques used in their preparationare described in more detail in the next section. TheSCIE consists of a polysiloxane backbone, with hydro-carbon side chains, cross-linked with difunctional hy-drocarbon cross-linkers. It was originally intended asan isotropic analogue of the nematic elastomer describedin ref 17 and is similar to the isotropic side-chainnetwork studied in ref 18. We estimate that approxi-mately 60% of this elastomer (by weight) consists of sidechains which do not participate in the cross-linkingnetwork but act as a filler, effectively diluting thebackbones. Furthermore, although the length of thecross-linker groups is fixed, their positions along thebackbone are random, so SCIE is a truly randomnetwork with possible free dangling ends and cross-linkclusters. In contrast, the UIE network consists of cyclicsiloxane junctions, each of which is connected to exactlyfour difunctional chains acting as network strands offixed length, similar to the concepts described in ref 19.It contains no side chains and was prepared with asmall excess of siloxane junctions, to minimize thenumbers of “dangling ends” not participating in thecross-linking network. As a result, the UIE network ismuch more uniform than that of SCIE. We should.however, point out that there is much room for variationin the ways in which the cross-linking junctions areconnected by the strands-for example,one can envisagevarious different larger cyclic structures consisting oftwo, three, four, or more connected junctions, so thenetwork topology is not completely uniform as the four-functionality of each junction would imply. Also, weshall see that since all internal space in the UIEmaterial is occupied by network chains, with no fillingor effective dilution, the entanglements become impor-tant in the elastic response. In these contrasting materials, we find a comfortinglyuniversal dynamic-mechanical response at low temper-atures, during and below the respective glass transi-tions. The time-temperature (t-T) superposition andthe WLF analysis work well and allow the constructionof master curves. At high temperatures, when thestorage modulus of both networks is expected to satu-rate on the flat rubber plateau, we find a differentbehavior. The universal (frequency independent) rise inthe modulus with temperature makes it impossible tocontinue the t-T superposition, and the slope of thisrise appears to be different from what entropy-basedrubber elasticity ideas would suggest. We discuss thesefindings and their implications at the end of this article. 2.Experimental Section 2.1. Sample Preparation. The component molecules usedin the synthesis of the two elastomers are shown in Figure 1.The difunctional compound 1,4-di(11-undeceneoxy)benzene(11UB) serves as a cross-linker in SCIE and acts as a networkstrand in UIE. It was prepared by the Williamson etherifica-tion2 of hydroquinone and 11-undecene bromide, followed bydistillation under reduced pressure (160C/0.8 Torr). TheSCIE side-group (3-buteneoxybenzene) was synthesized usingthe Mitsunobu procedure2l followed by distillation underreduced pressure (100°C/0.8 Torr). The cyclic siloxane junctionused in the preparation of UIE and the siloxane backbone forSCIE are both commercially available, and were obtained fromAldrich. The elastomer networks were prepared by hydrosilylationof reacting mixtures in toluene at 80°C for 1 h in the presenceof a commercially available platinic acid (COD) catalyst, from Figure 1. Chemical structures of the materials used describedin this work, and their resulting network topology. (a) Com-ponents of SCIE: siloxane backbone (i), 11UB cross-linker (ii),and 3-buteneoxybenzene side-group (iii). The molar proportionof 11UB to the side group is 1:18 (10% cross-linking density).(b) Components of UIE: cyclic siloxane cross-linking junction(i) and11UB strand (iii). This network is linked with a slightexcess of cyclic junctions (molar proportion 1:1.5 instead of 1:2suggested by ideal four-functional junctions) to ensure allstrands are linked and not freely dangling. T/°c Figure 2. DSC scans on heating of SCIE, curve a, and UIE,curve b. Both scans show the second cycle (which was identicalto subsequent cycles), obtained at a rate of 10 °C/min. The twoapparent glass transitions were the only thermal feature foreach material. Wacker Chemie. These conditions used were found to besufficient to allow the reaction, linking the Si-H bond of thesiloxane with the terminal vinyl group of 11UB or 3-bute-neoxybenzene, to proceed to completion. The toluene solventwas then removed by annealing the samples overnight at 100°C. 2.2.Thermal Analysis of Phases. Differential scanningcalorimetry (DSC) was performed on the two materials, toidentify their glass transition temperatures. The two charac-teristic DSC traces are shown in Figure 2. Both samples havea single glass transition with no other features over thetemperature range examined. The values for the glass transi-tion temperature Tg were estimated to be -41 and -6 °C forthe SCIE and UIE samples, respectively. Figure 2 also showsqualitatively that the glass transition occurs over a muchTIIF mate1broader temperature range in the UIE material. 2.3. Dynamic Mechanical Testing.Dynamic mechanicalmeasurements were performed on a VA4000 Viscoanalyzer,from Metravib Rds. A shear strain with an amplitude ofeo=0.002 was employed.Measurements at different amplitudesconfirmed that this was well within the linear response region.Each sample was analyzed over a range of temperatures fromthe glassy to the rubbery regions, and at each temperature, arange of frequencies between 1 and 200 Hz were employed.Further measurements at low frequencies down to 0.02 Hzwere also performed in order to access data for the rubberyregion, which could not be inferred assuming time-temper-ature superposition (see later discussions). Figure 3. (a) Tape mode, and (b)sandwich mode geometriesfor DMTA measurements. Samples are illustrated cross-hatched, for clarity, and typical sample dimensions are in-cluded. In each case a sinusoidal oscillation is imposed uponthe middle section, and its dynamic displacement x is recorded.The dynamic force F exerted on the end sections due to sampleshearing is also recorded, and the two parameters used todetermine the complex shear modulus G*. Two different experimental geometries were employed.These are referred to as “tape”and“sandwich”modes, andthe main features and typical sample dimensions are shownin Figure 3. The choice of geometry depended on the stiffnessof a sample over the temperature range employed in a givenexperiment. The tape geometry was used for stiffer samples,toward the glassy region, and was found to give reliable resultsfor shear moduli down to around 10° Pa, below which the forcesgenerated were too low to be measured with any degree ofconfidence. Conversely the sandwich geometry was employedfor less stiff samples, toward the rubbery region, and it givesreliable results for shear moduli up to around 107 Pa. Abovethis value, the frictional force between the metal and the rigidsample was insufficient to prevent slippage due to the highforces applied. Using these two geometries, it was possible to obtain dataover several decades of stiffness, from glassy to rubberybehavior. The two sets of results for the same elastomerobtained using different sample geometries were then com-bined by multiplying all of the storage and loss moduli datafrom one sample geometry by a single constant value, foundby comparing the data over the intermediate stiffness regionbetween 106 and 107 Pa where measurements could reliablybe taken using both geometries. (This corresponds simply toa vertical shift on the graphs we present in this paper,wherethe moduli are plotted on a log scale.) This scaling factor tookvalues between 0.6 and 1.1, and was assumed to reflect anypossible error in measurement of sample dimensions due, forexample, to clamping effects. The same constant could be usedto match up the data over all frequencies, for both G'and G",which gives confidence in the described procedure of matching.We note, however,that this represents a small but uncontrol-lable scaling error in the final actual size of the G'and G"values quoted. Nevertheless, the main features of this paperare the trends in G'and G"and in their ratio, rather thantheir actual values. 3.Results and Discussion 3.1. Temperature and Frequency Dependence.The variation of storage modulus G'with temperatureat several fixed frequencies, for both elastomer samples,is shown in Figure 4. Both materials show the same Figure 4. Storage moduli of SCIE and UIE samples as afunction of temperature, at several different frequencies. Eachcurve is constructed by the superposition of data measuredusing two different sample geometries-see section 2.3 fordetail. The high temperature (rubbery) regions of each plotare enhanced and analyzed in greater detail in Figure 9. general features, as one might expect, which may bedivided into three general regions. At low temperatures,both samples are in the glassy region, and they show astorage modulus which is only weakly dependent onboth frequency and temperature, taking a value of G'~ 108-10° Pa. Both samples then show frequency-dependent behavior through the glass transition, aregion which will be discussed in more detail throughoutthis paper. In this region, the magnitude of G' decreasesfrom glassy to rubbery values with increasing temper-ature, the point of this dynamic glass transition con-sistently shifting to higher temperatures as the fre-quency is increased. Finally, at high temperatures, inthe “rubbery”region, the behavior becomes independentof frequency, but increases with increasing temperature.The possible reasons for this and its experimentalsignificance will be discussed in more detail in the finalsection of this paper. Essentially the same data is shown in Figure 5, whichshows the variation in G' with frequency for bothsamples at different temperatures. The main features Figure 5. Storage moduli of SCIE and UIE materials as a functions of frequency, at different temperatures. Frequency/s shown in these graphs are the frequency-dependentincrease in the modulus through the glass transition,and the rubbery response, which is independent offrequency but now increases with increasing tempera-ture. The data through the glass transition may becombined to form a master curve as a single data set,as a function of frequency, by using the empirical time-temperature (t-T) superposition principle.15,23 Thiseffectively allows data sets taken at different temper-atures to be superposed by multiplying the actualfrequency by a temperature-dependent shift factor,a(T).In a plot where frequency is plotted on a logarithmicscale, as in Figure 5, this simply corresponds to shiftingeach data set to the left or right by an amountdetermined empirically, until the curves lie on a singlemaster curve. This method was used to produce theresults presented and discussed in the next section.However, an inspection of Figure 5 shows that thisapproach can only be applied through the glass transi-tion and will not be successful in the rubber plateauregion. 3.2. Construction of Master Curves. For eachsample, a set of shift factors a(T) were determinedempirically to achieve the best superposition of indi-vidual data sets for G'(w), the loss modulus G"(ω) andtheir ratio-the loss factor tan =G"/G’, by onlyhorizontal shifting along the frequency axis. Thesemaster curves, for each sample, are shown in Figure 6.The reference temperature, at which the shift factor isa(Tref) = 1, was chosen to be~Tg, the glass transitionfor each sample (the actual values used were Tref=-40and -5 C for the SCIE and UIE samples,respectively).The choice of reference temperature for the t-T super-position is rather arbitrary and many advantages couldbe found in making it a room temperature, thus ef-fectively predicting the values of corresponding moduliat different frequencies as if they were actually mea- Figure 7. WLF plots showing shift factors a(T), on logarith-mic scale, with fits of WLF eq 4, solid lines. sured without any temperature change. However, herewe follow the original proposition of Williams, Landel,and Ferry (WLF)15 to choose the glass transition as theonly characteristic temperature for the amorphouspolymer material. At high temperatures, where the storage modulusshows an increase with temperature that is independentof frequency, the t-T superposition principle cannotsucceed. It is clearly not possible to superpose parallelhorizontal data sets simply by shifting them to the leftor right along the log-frequency axis. In fact, theunderlying spirit behind the master curve G'(w) is aprediction of the response at all different frequencies,as if it were measured at a constant temperature T=Tref (which, ofcourse, is technically impossible over sucha great range of frequencies). Such a measurementwould have given a continuously lowering G' at lowerfrequencies, with a debatable question of whether thefinal equilibrium rubber plateau is ever achievable. Incontrast, the G'curves in Figure 6 show a distinctupward step in the modulus at higher temperature,which through t-T superposition would correspond tothe low-frequency regime. Despite this problem with G'data at high temperatures, the t-T superpositionprinciple may still be successfully applied to the lossmodulus G", which continues its power-law decay wellinto the rubbery region. The shift factors a(T) are represented in Figure 7. Thet-T superposition of both samples can be described forthe most part by a single curve, given by the empirical WLF relationship15 Some deviations from WLF behavior may be seen at lowtemperatures, but we could consider them as minor. Thevalues for parameters Ci and C2 were fitted to 9.8±0.7 and 47±6, respectively, for the SCIE material, and10.82 ±0.05 and 32.5±0.3 for the UIE rubber, ignoringthe first two data points. Typical values for theseparameters are quoted as C1=14-18 and C2=30-70K.23 Our values for C are therefore a little lower thanone might expect, but certainly in the general agreementwith the classics of t-T superposition. It is importantto emphasize that the same factors were used tosuccessfully superpose the separate data sets for G', G"and their ratio, the loss factor tan o. 3.3. Features of Master Curves. The G'curves inFigure 6 both have a sigmoidal form, representing thetransition from glassy to rubbery behavior, as we wouldexpect. In the case of the UIE sample, we could identifya region during this transition, which is locally astraight line on the graph, at the turning point. Thiscorresponds to a“pseudo-power law”behavior, and wecan determine a pseudo-power exponent from the slopeof the graph at this point, with a value of approximately0.3. The G'master curve for the SCIE shows at leasttwo different power law regimes through the glasstransition. The steepest slope occurs at a scaled fre-quency of around 1000 Hz, and corresponds to a pseudo-power law exponent of around 1. At lower frequencies,below 100 Hz, the graph approximates to power-lawbehavior with a lower exponent of around 0.5. Thesteeper slope of G'variation with frequency seen in theSCIE material may well reflect the same underlyingphenomenon as we have seen in the thermal signatureof the glass transition, in Figure2. In contrast, the UIErubber had a much broader, diffused thermal glasstransition, which is also a feature of the a-relaxationin the UIE master curve. Figure 8 gives a more detailed analysis of power lawsinvolved. The loss modulus G"is chosen for it, since ithas more readily identifiably glass transition frequency,represented as a peak of so-called o-relaxation, and alsocontinues to decrease at low frequencies, unaffected bythe unclear (see the discussion below) issues of rubber- Figure 8. Slopes of characteristic power laws for loss moduli G"(w), for SCIE and UIE networks. Despite a much greater regularityof strands in the UIE rubber, its response shows a very diffuse glass transition and a nondistinct power law oc ω23 down to thehg1lowest frequency. In contrast, the SCIE network has a very clear glass transition, the identifiable Rouse regime and turns to theclassical viscous response G"oc ω at ω→0. Figure 9. High-temperature region ofG'(T) showing the temperature-dependent increase for SCIE and UIE rubbers at a rangeof frequencies. The insets show the linear regions of G'(T) against the absolute temperature, extrapolated to zero at T=T*; seetext. (Note: G'is now plotted on a linear scale.) elastic modulus G'(T). At frequencies just below theglass transition, the loss modulus drops with a scaling,which can be identified as G"’oc ω2/3.One could make aconnection with the Zimm model, proposing an exponentof 0.66, although the conceptual relation between thedilute polymer solution with hydrodynamic interactionsand our 10%-cross-linked dry rubber is quite unconvinc-ing. (We note that in a recent study of liquid crystallinerubbers, an isotropic side-chain material similar to ourSCIE has been studied-and the Zimm-like exponent of0.66 was also reported.18) Even if one attempts to makesuch a connection by identifying the bulky side groupsof SCIE, attached to the network by flexible spacers,with a solvent diluting a backbone, it certainly does nothold for the UIE rubber. Further away from the glass transition, the twomaterials show very different behavior. For SCIE, thereis an indication of a shoulder appearing at scaledfrequencies of around 1 Hz (corresponding to tempera-tures of around -20°C). One could argue that we seethe (much anticipated) Rouse scaling G"o ω12, whichthen turns into a more steep decay at the lowestfrequencies, very much resembling the classical viscousdissipation, G"oc ω. It would have been very nice indeedto find a rubber material with a low-frequency elasticityfollowing the simple Debye relaxation (G’~Geq + n-(wt)2; G"~nωt). Usually, cross-linked rubbers have amore complex response. In contrast to SCIE, the uni-form network of UIE does not seem to fall into any suchbehavior even at the lowest frequencies, when thestorage modulus has well and truly lost its frequencydependence. We note in passing the different levels of the lossfactor tano for the two elastomers. Although we do notplot these explicitly, one can see from the data in Figure6 that in the UIE network the ratio of G" to G'is alwaysless than one; in fact, the maximum tan ~ 0.55 isreached in a narrow frequency range. In contrast, theSCIE data shows the broad region of scaled frequency,between 1 and 3000 Hz, where G" is greater than G'.The loss factor reaches the maximum of tan ≈2.4 andis in excess of 2 between 30 and 600 Hz. This issurprisingly high, and may suggest that the presenceof side chains, capable of motion independent of thebackbones, contribute to the high damping behaviorobserved in side-chain nematic elastomers.17,24 3.4. Rubber Plateau. In the high-temperature/low-frequency limit, both samples show what appears to bethe equilibrium rubbery response, where G' becomescompletely independent of frequency, but increases withincreasing temperature. As we have seen above, this means that t-T superposition cannot be applied to thestorage modulus in this region, although it still appliesto the data for tan 8 and G"'. Let us examine the data for G'(T) in this region inmore detail; see Figure 9. Both materials show a linearincrease in G'with temperature. This was found to bereversible and reproducible, thus ruling out the pos-sibility of the behavior being caused by some chemicalreaction or degradation. The data for the linear increasein G'with temperature in Figure 9 is described by thefitting In general, a linear increase in shear modulus withtemperature is to be expected from the entropic originof rubber elasticity. The frequency-independent storagemodulus G'is in this region approximately equal to theequilibrium rubber shear modulus u. The basic modelof entropic elasticity of a phantom chain network yieldsu=cpkBT, where cp is the number of network strandsper unit volume (directly related to the cross-linkingdensity Nx). Modern advanced theories, involving thejunction point fluctuations, excluded volume effects anddense entanglements in a rubbery network,25,26 provideexactly the same expression in the linear-response limit(at small deformations), but with the constant c, domi-nated by the number of entanglements per networkstrand, Z. Crudely, since different models offer slightlydifferent values of the numerical factor of order of unity,one has u~NZkBT. We have three ways ofestimating the effective stranddensity cp. First of all we can obtain a nominal estimateby inspecting the chemical composition of the network.In this approach, we must first define the chemicalspecies corresponding to one elastically active“strand".We then calculate its mass from the molar weights ofits components. From this we obtain its volume, assum-ing its density to be the same as the overall density ofthe material, which we can determine experimentally.(This assumption requires that we chose a strand whosecomposition-the ratios of main chains, side chains andcross-linkers-is the same as that of the sample as awhole.) In the SCIE, such a strand is made up of half ofa 11UB cross-linker, nine mesogenic side groups andten Me-SiH-O units from the siloxane backbone (Figure1,parts a(ii), a(iii), and a(i) respectively). In the UIE, Table 1. Estimates of an Effective Density of NetworkStrands (the Entropic Coefficient), cp, Obtained in ThreeDifferent Ways Described in the Text (Labeled as theArgument in Each Column) sample cp(p),m cp(G),m cp(dG/dT),m SCIE 3×1026 4.1×1025 7.2×1025 UIE 1.1×1027 8.5×1026 2.6×1027 we have considered a single strand to consist of one11UB molecule (Figure 1, part b(ii)) and two-thirds ofa cyclic siloxane cross-linking junction (Figure 1, partb(i)). Using measured values for the densities of SCIEand UIE of 1.08 ± 0.02 and 1.04 ±0.01 g cm-3, weestimate the volumes of the respective elastically activestrands as 3.3x 10⁻²⁷ and 9.2x10⁻²⁸ m3. The inverseof these volumes give the values for strand density listedas cp(p) in the first column of Table 1. Second, one could estimate cp from the absolute valuesof frequency-independent elastic modulus on the"rubberplateau”, Figure 9. The second column of Table 1 givesthese values. Finally, we can find the effective stranddensity by literally taking the slope dG'/d(kgT) from thedata in Figure 9 and thus obtain a third value for cp,for each material. Since the linear extrapolations crossthe T-axis at positive T, this estimate gives highervalues than those from the modulus magnitude for bothour networks. Both of the last two methods are simplydifferent ways of inferring the strand density from themechanical properties, and so would include both thechemical cross-links and physical entanglements in thenetworks. The important feature that we notice from the com-parison of values in the table is that for SCIE therubber-elastic modulus is much lower than the chemicalcomposition would suggest, by nearly an order ofmagnitude. The effective strand density inferred fromthe chemical composition is much larger than the valuesestimated from the modulus. The only reasonableexplanation for this is cross-link clustering. Indeed, insuch a network one could easily envisage that aliphatic11UB molecules were partially phase separated fromsiloxane chains before the cross-linking reaction. Incontrast, in UIE the distribution of cyclic cross-linkinggroups is necessarily homogeneous and, not surpris-ingly, we see a better correlation between values sug-gested from the modulus and that estimated from thechemical composition. This also implies that, in UIE,there is no significant entanglement of network strands.This, again, is expected because the network wasprepared in a swollen state, with chains stretched andnot capable of topological entanglement-and then de-swollen into its final state. One cannot make such anassumption about the randomly linked SCIE; thismakes it impossible to separate the effect of cross-linkclustering (leading to the decrease in modulus) andentanglements (increasing the rubber modulus). Mostlikely, both effects are in action. In the discussion of entropic rubber elasticity, wemust not forget the result evident from Figure 9, thatthe extrapolated G'(T) lines do not cross zero at T=0K. The fitting results of the eq 5 indicate that this wouldoccur at-81℃ (192K) for UIE and at -152 ℃ (121K) for the SCIE rubber. The values are significantlyabove absolute zero. Accordingly, the values in the thirdcolumn Table 1, measuring the slope dG/d(kBT) on the"rubber plateau”, are significantly higher than theparallel value measuring the modulus itself, by a factorof 1.8 in SCIE and a factor of 3 in UIE. This linear but nonproportional relation between the modulus and thetemperature is surprising, and one for which we do notimmediately propose an explanation. A component ofstress due to potential energy27 would be expected toshow a positive value for the modulus, when extrapo-lated to absolute zero. Note that in our experiments thesample is held in a sandwich shear geometry, where itis constrained to a fixed thickness in the z-direction, andso thermal expansion in this direction cannot occur; anythermall( expansion or contraction occurring in the x-yplane is effectively prohibited as well, since in thesandwich measuring geometry this plane is constrainedbetween the plates. This represents a difference frommeasurements of the rubber modulus done in extensionof laterally unconstrained samples. 4. Conclusions Our side-chain SCIE material is very similar to anonmesomorphic network synthesized and analyzed byStein et a1.18 Both our elastomers and theirs showfeatures, which Stein et al. have modeled using amodified Zimm model, in which the diluted state ofbackbone chains is achieved by the large amount ofvolume-filling side groups. The model features includea power-law exponent of about 2/3 and a value ofG'thatis lower than G", giving rise to tan o values greater than1. The deviation in the storage modulus G'behaviorfrom that predicted by the standard Zimm model couldbe explained by the influence of the high- and low-frequency plateaus. However, it is conceptually hard tolink such a model with the results on our UIE rubber,which is chemically very different from side-chainpolymer networks and has been deliberately designedto minimize all network effects apart from the flexiblenetwork strands themselves. Nevertheless, the mastercurves for both G'and G"(w) appear to show the sameZimm-like behavior. This leads us to believe that thepower-law exponent of 2/3, seen in our experiments, andin others, is only coincidentally related to that of theclassical Zimm model. Indeed,a number oftopologicaltheories10,1p1redict power laws stemming from thecomplex distribution of relaxation times depending onthe (phantom) network topology. This discussion highlights the unfortunate state ofcurrent theoretical understanding of dynamic mechan-ical response of polymer networks. Empirical modelscould be devised in large numbers, suggesting variousrelaxation time spectra and enthalpic corrections andsuccessfully interpolating some groups of experimentalresults-but such models always describe only a part ofthe full set of properties of a material and offer no realphysical insight into them. It appears that the successstory of the molecular understanding of polymer dy-namics is not readily transferred into the cross-linkednetworks of the same chains. On one hand, progress isclearly possible through the incorporation of ideas ofRouse-Zimm dynamics into the tube model of end-constrained chains. On the other hand the findingshighlighted in Figure 9, that the low-frequency modulusbehaves as G'= -const + cpkBT (with a substantiallynegative constant) and that the value of the modulusdoes not correspond to the slope dG'/d(kBT), indicatethat purely entropic theories will never be completelysuccessful. The challenge in developing a consistentdynamical theory of rubbery networks remains widelyopen after more than 50 years since the first theoretical Macromolecules, Vol. 37, No. 4, 2004 efforts by Flory28.29 and classical experiments by Ferryet a1.30 and others. References and Notes ( (1) T reloar, L. R. G. The Physics ofRubber Elasticity, 3 rd e d.; Clarendon Press: O xford, England, 1975. ) ( (2) Clarke, S. M .; E lias, F.; Terentjev, E.M. E ur. Phys.J.E 2 000, 2,335. ) ( (3) ) Rouse, P. E. J. Chem. Phys . 1953 , 21,1272. ) ( (4 ) ) Z Zimm, B. H.J. Chem. Phys. 1 956, 24,269. ) ( (5) d 9 e Gennes, P.-G. J. Chem. Phys.1971, 5 5 ,5 7 2. ) ( (6) Edwards, S. F. J.Chem. Phys. 1971, 55,572. ) ( (7) ) E E dwards, S. F.; Vilgis, T. A . Rep . Prog. Phys . 1988,51,243. ) ( (8 M ) ergell, B .; Everaers, R. Macromolecules 2 001, 3 4, 5675. ) ( (9)Graessley, W. W. M acromolecules 1980, 13, 372. ) ( (10) Kloczkowski, A.; M ark, J. E.; F risch, H. L . Macromolecules 1990,23,3481. ) ( ( 11 ) B lumen, A.; Jurjiu, A .; Koslowski, T. Macromol. Symp. 2003,191,141. ) ( (12) Edwards, S. F.; Takano, H.; Terentjev, E.M. J. Chem. Phys. 2000,113,5531. ) ( (13) Schimmel, K. H.; Heinrich, G. C olloid Polym. Sci.1991,269,1003. ) ( (14) Roberts, A. D. Natural Rubber S cience a nd Technology;Clarendon P ress: Oxford,England, 1988. ) ( ( 1 5) F erry, J. D . V iscoelastic Properties of Polymers, 2 nd e d .; Wiley: New York, 1 970. ) ( (16) Curro, J. G.; Pincus, P. M acromolecules 1983, 16 , 559. ) ( ( 1 7) C larke, S. M .; H otta, A .; T ajbakhsh, A. R.; T erentjev,E . M . Phys. Rev. E. 2002, 65,021804. ) ( (18 ) ) Stein, P.; Assfalg , N. ; Finkelmann, H .; Mart i noty, P. E ur. Phys. J. E 2001,4,255. ) ( (19) Mark, J. E. Adv. Polym.Sci. 1982, 44, 1. ) ( (20) B rown, W. H . ; F o ote, C. F. Organic Chemistry, 2nd e d .; Sounders College Publishing: 1998. ) ( (21) Mitsunobu, O. Synthesis 1981, 1, 1 . ) ( (22) A pfel , M. A .; F inkelmann, H.; J a nini, G. M.; Laub, R. J.; L uhmann, B. H.; Price, A.; Roberts, W. L.; Shaw, T.J.;Smith,C. A. Anal. Chem. 1 985, 57, 651. ) ( (23) Strobl, G. R. The Physics ofPolymers, 2nd ed.; Springer,NewYork. 1997. ) ( (24) C ( l a rke, S. M .; Tajbakhsh, A. R.; Terentjev,E. M . ; R e millat,R.; Tomlinson, G. R.; H ouse, J. R. J. Appl. P hys. 2001,89, 6530. ) ( (25) Ball, R. C.;Doi, M.; Edwards,S. F.; Warner,M. Polymer1981, 22.1019, ) ( (26) H iggs, P . G .; B all, R. C. Europhys. Lett. 1 989, 8,357. ) ( (27) S S hen, M . C.; M c Quarrie, D. A.; Ja c kson, J. L. J. Appl. Phys. 1967,38,791. ) ( (28) F lory, P. J. Principles ofPolymer Chemistry; Cornell Univer-sity Press: I thaca, NY, 1953. ) ( (29) Erman, B.; M ark, J. E. Structure and Properties ofRubberlike Networks; Clarendon P ress: Oxford, England, 1997. ) ( (30) F erry,J . D . ; Grandine, L. D.; F itzgerald,E.R.J. Appl. Phys. 1953,24,911. ) ( MA035060E )
确定
还剩6页未读,是否继续阅读?

仪尊科技有限公司为您提供《各向同性弹性体材料中动态剪切模量检测方案(动态热机械)》,该方案主要用于其他中动态剪切模量检测,参考标准--,《各向同性弹性体材料中动态剪切模量检测方案(动态热机械)》用到的仪器有动态热机械分析仪
推荐专场
相关方案
更多