此前文献表明绝大多数生物中脂肪与水分之间存在比较大的D/H的分馏。这种分馏归结为同位素对脂肪生物合成的影响。本文我们报导了4种细菌(phylum Proteobacteria)的脂肪与水分之间的D/H分馏 ,结果表明单一生物之中波动可以达到500‰ 。这种变动不可能归因于脂肪生物合成,因为这些途径中没有明显的变化,也不能归因于培养基的D/H比率。更重要的是,脂肪/水的D/H随着新陈代谢而系统地变化:化学自养生长(几乎达到-200到-400‰)、光合自养生长的(-150到-250‰)、非自养生物,采用糖做培养基的生物(0到-150‰),以及非自养生物,采用TCA循环(-50到-200‰) 。我们猜测脂肪的D/H比率很大程度上是由生物合成的NADPH来控制,而不是脂肪生物合成途径本身来决定的。我们的结果表明,不同的代谢途径产生NADPH—并间接影响脂肪的同位素组成。如果是这样,脂肪的δD值可能成为连接脂肪和能量代谢的重要生物化学循环工具,并可通过固碳途径中13C提供了更多的补充信息。
方案详情

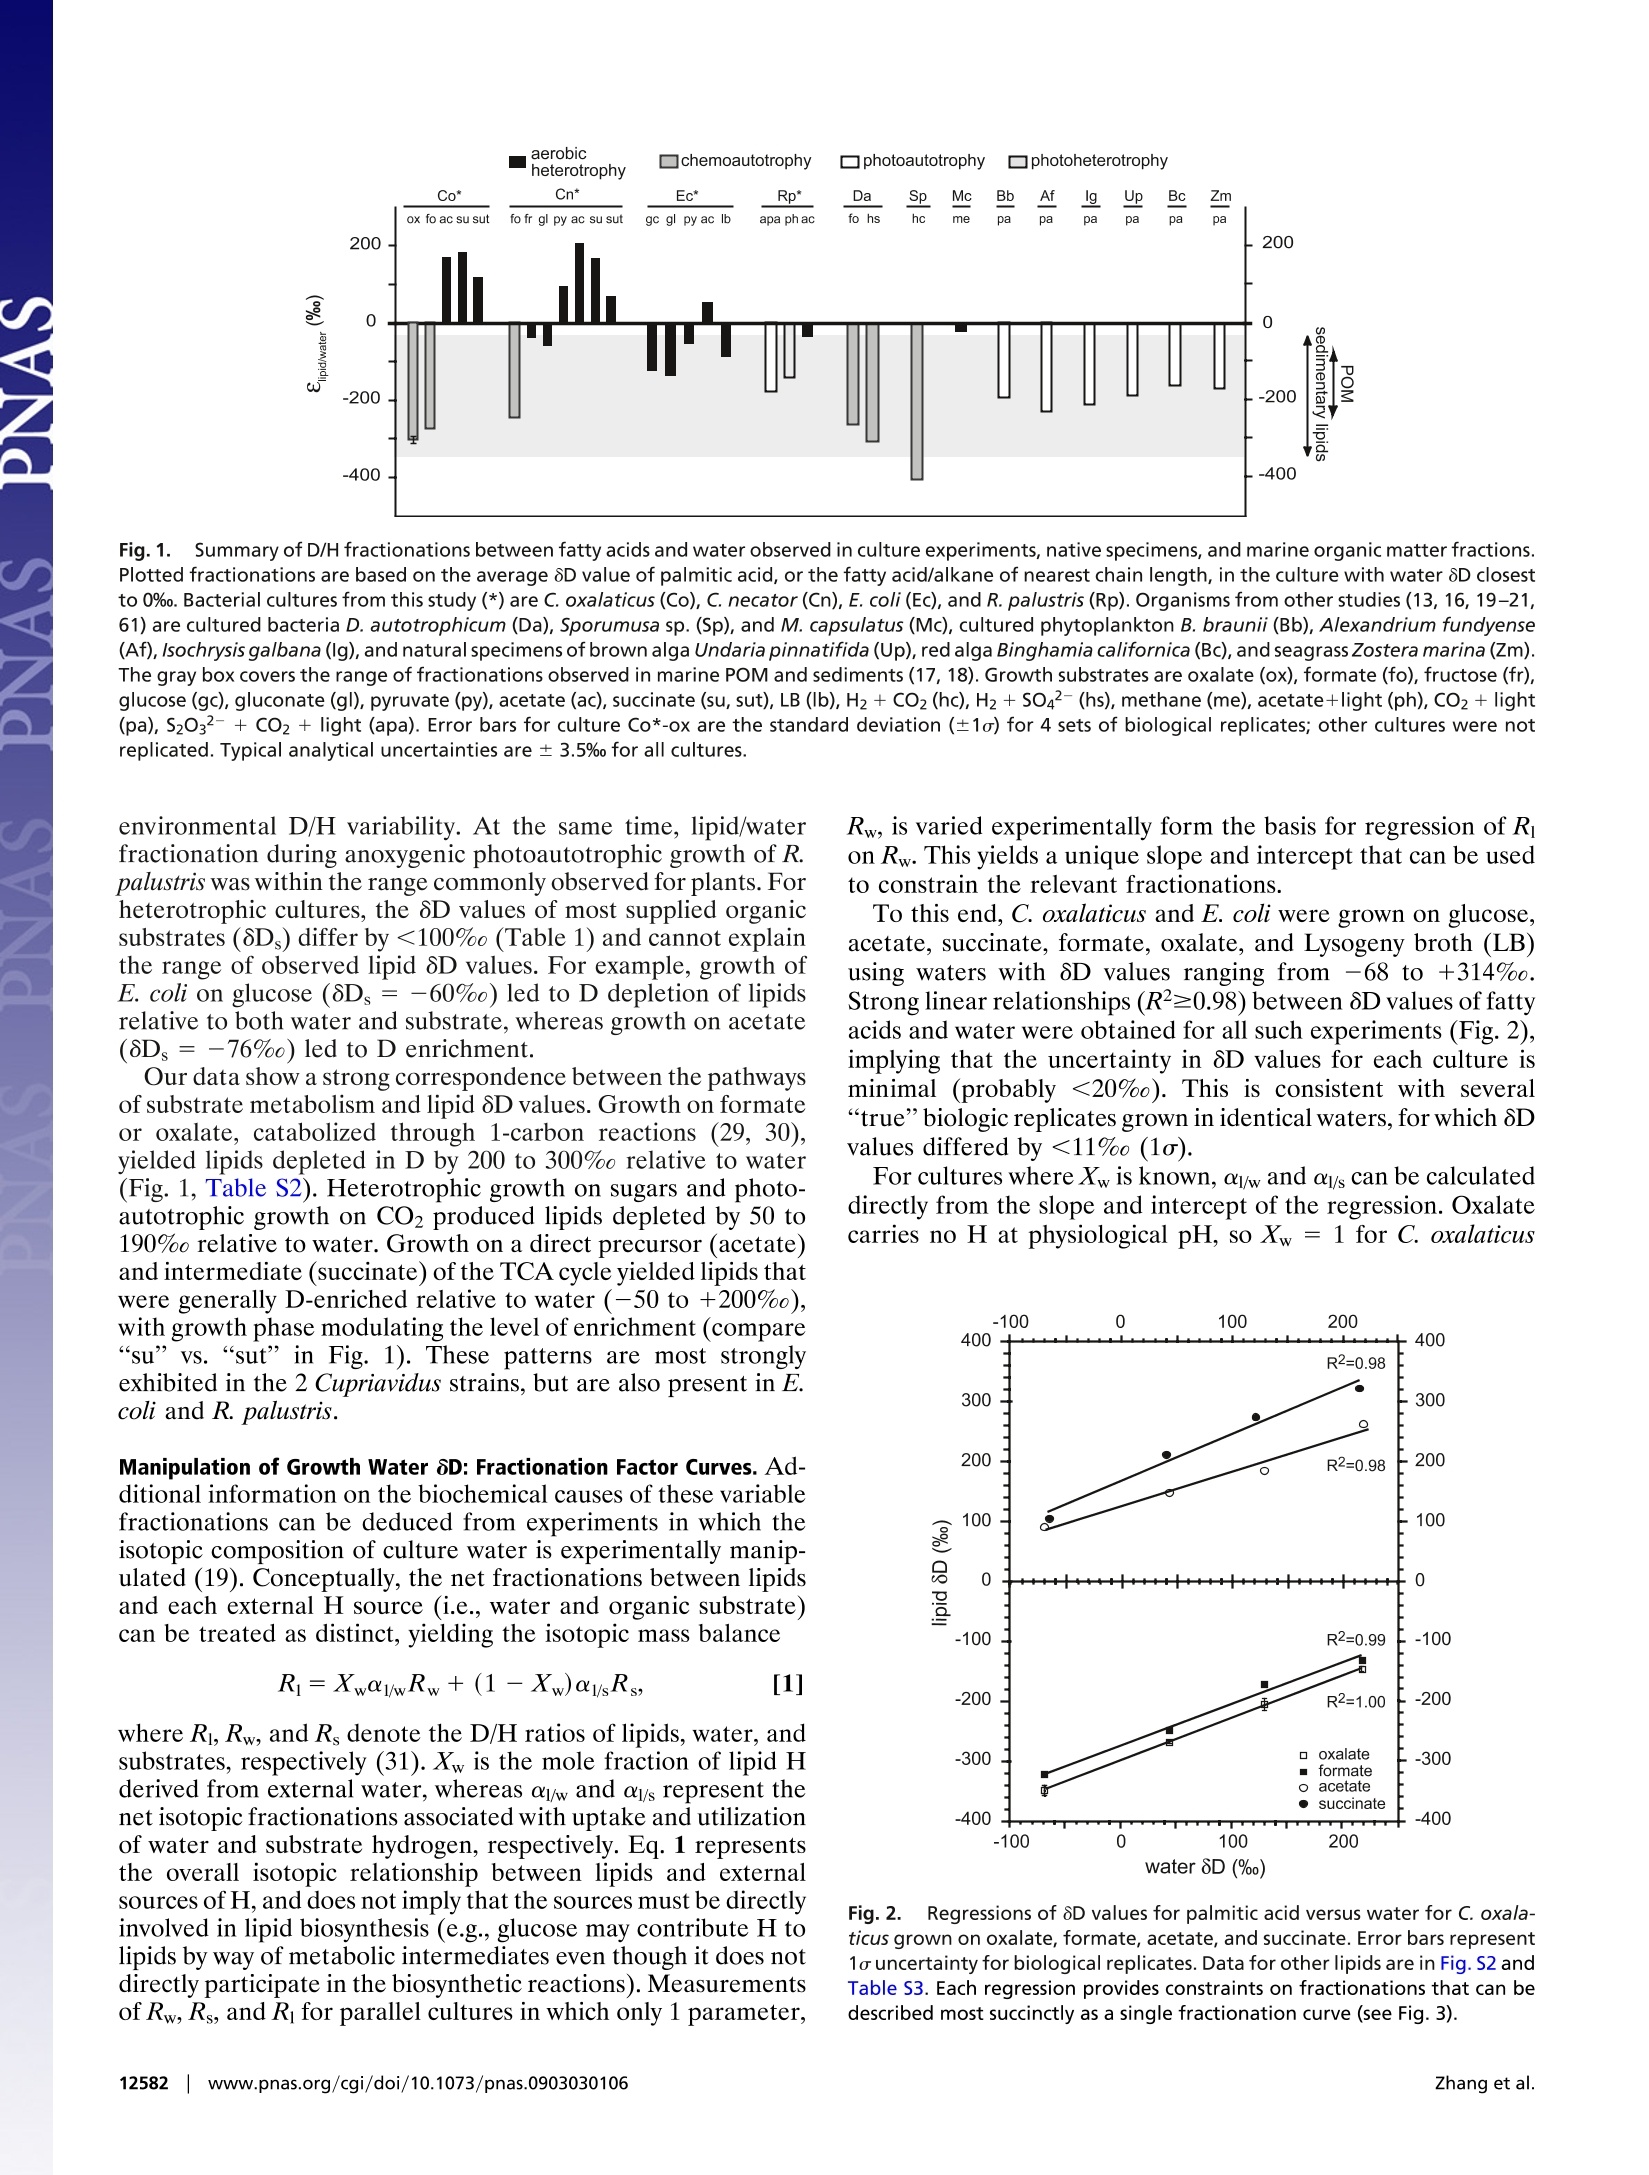
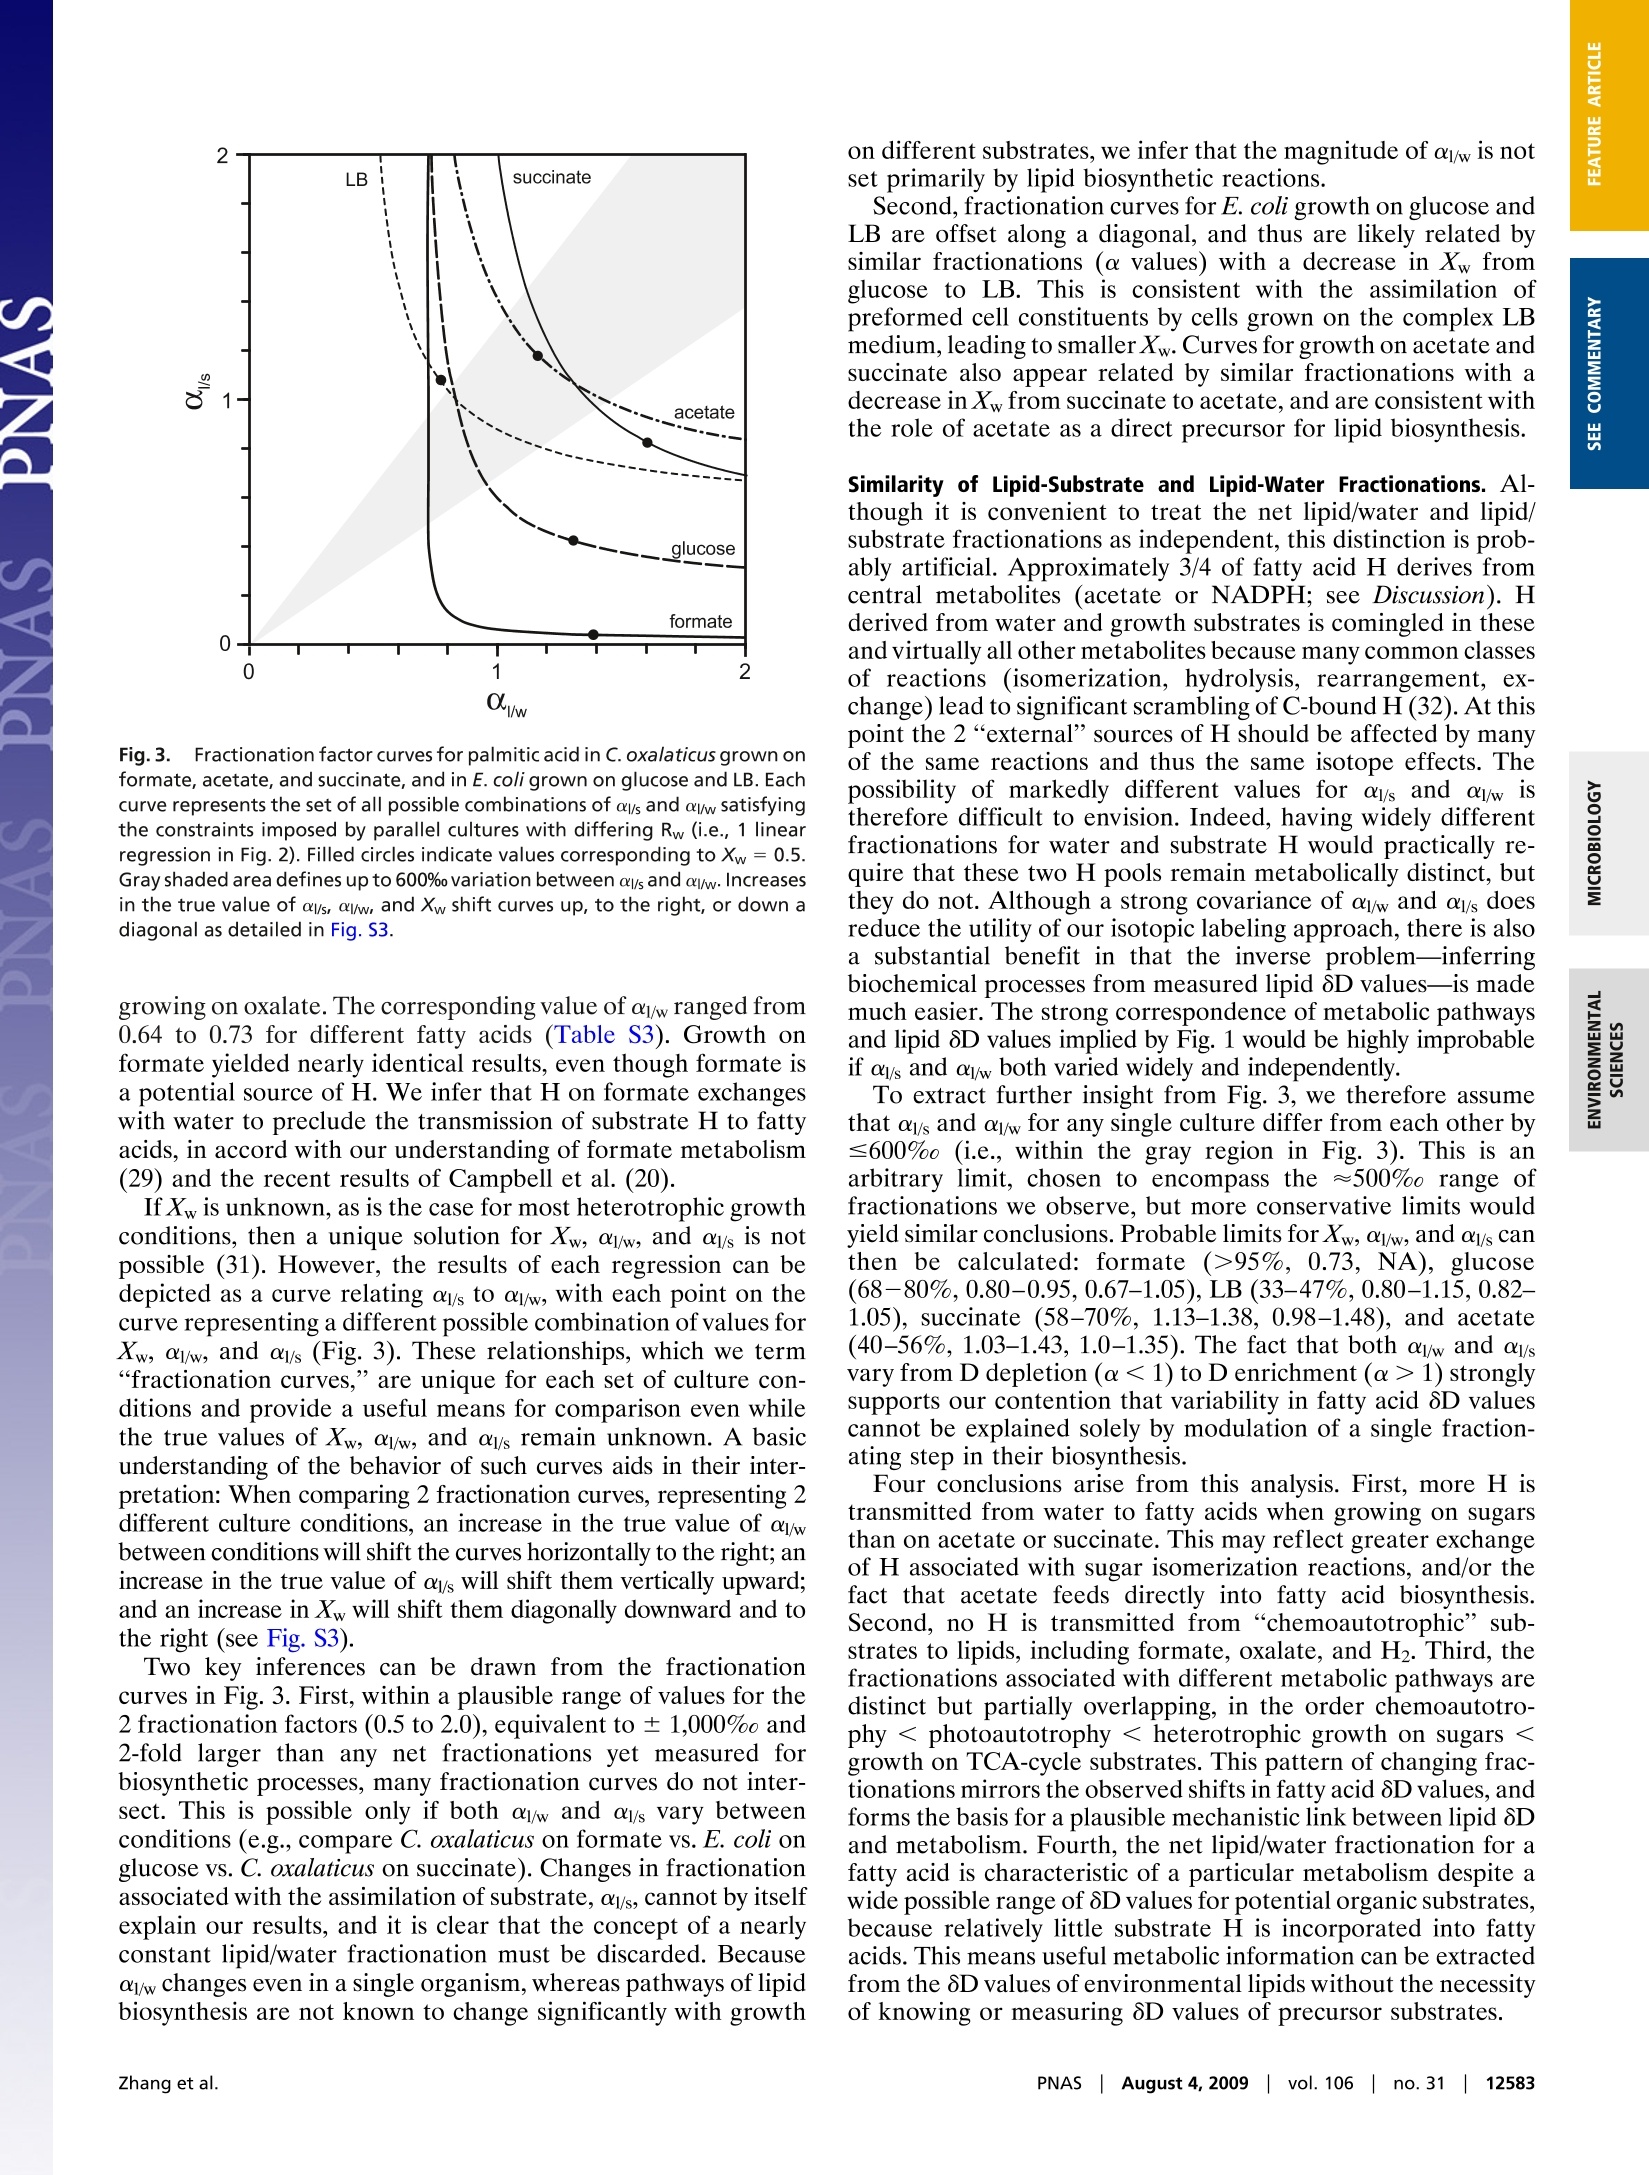
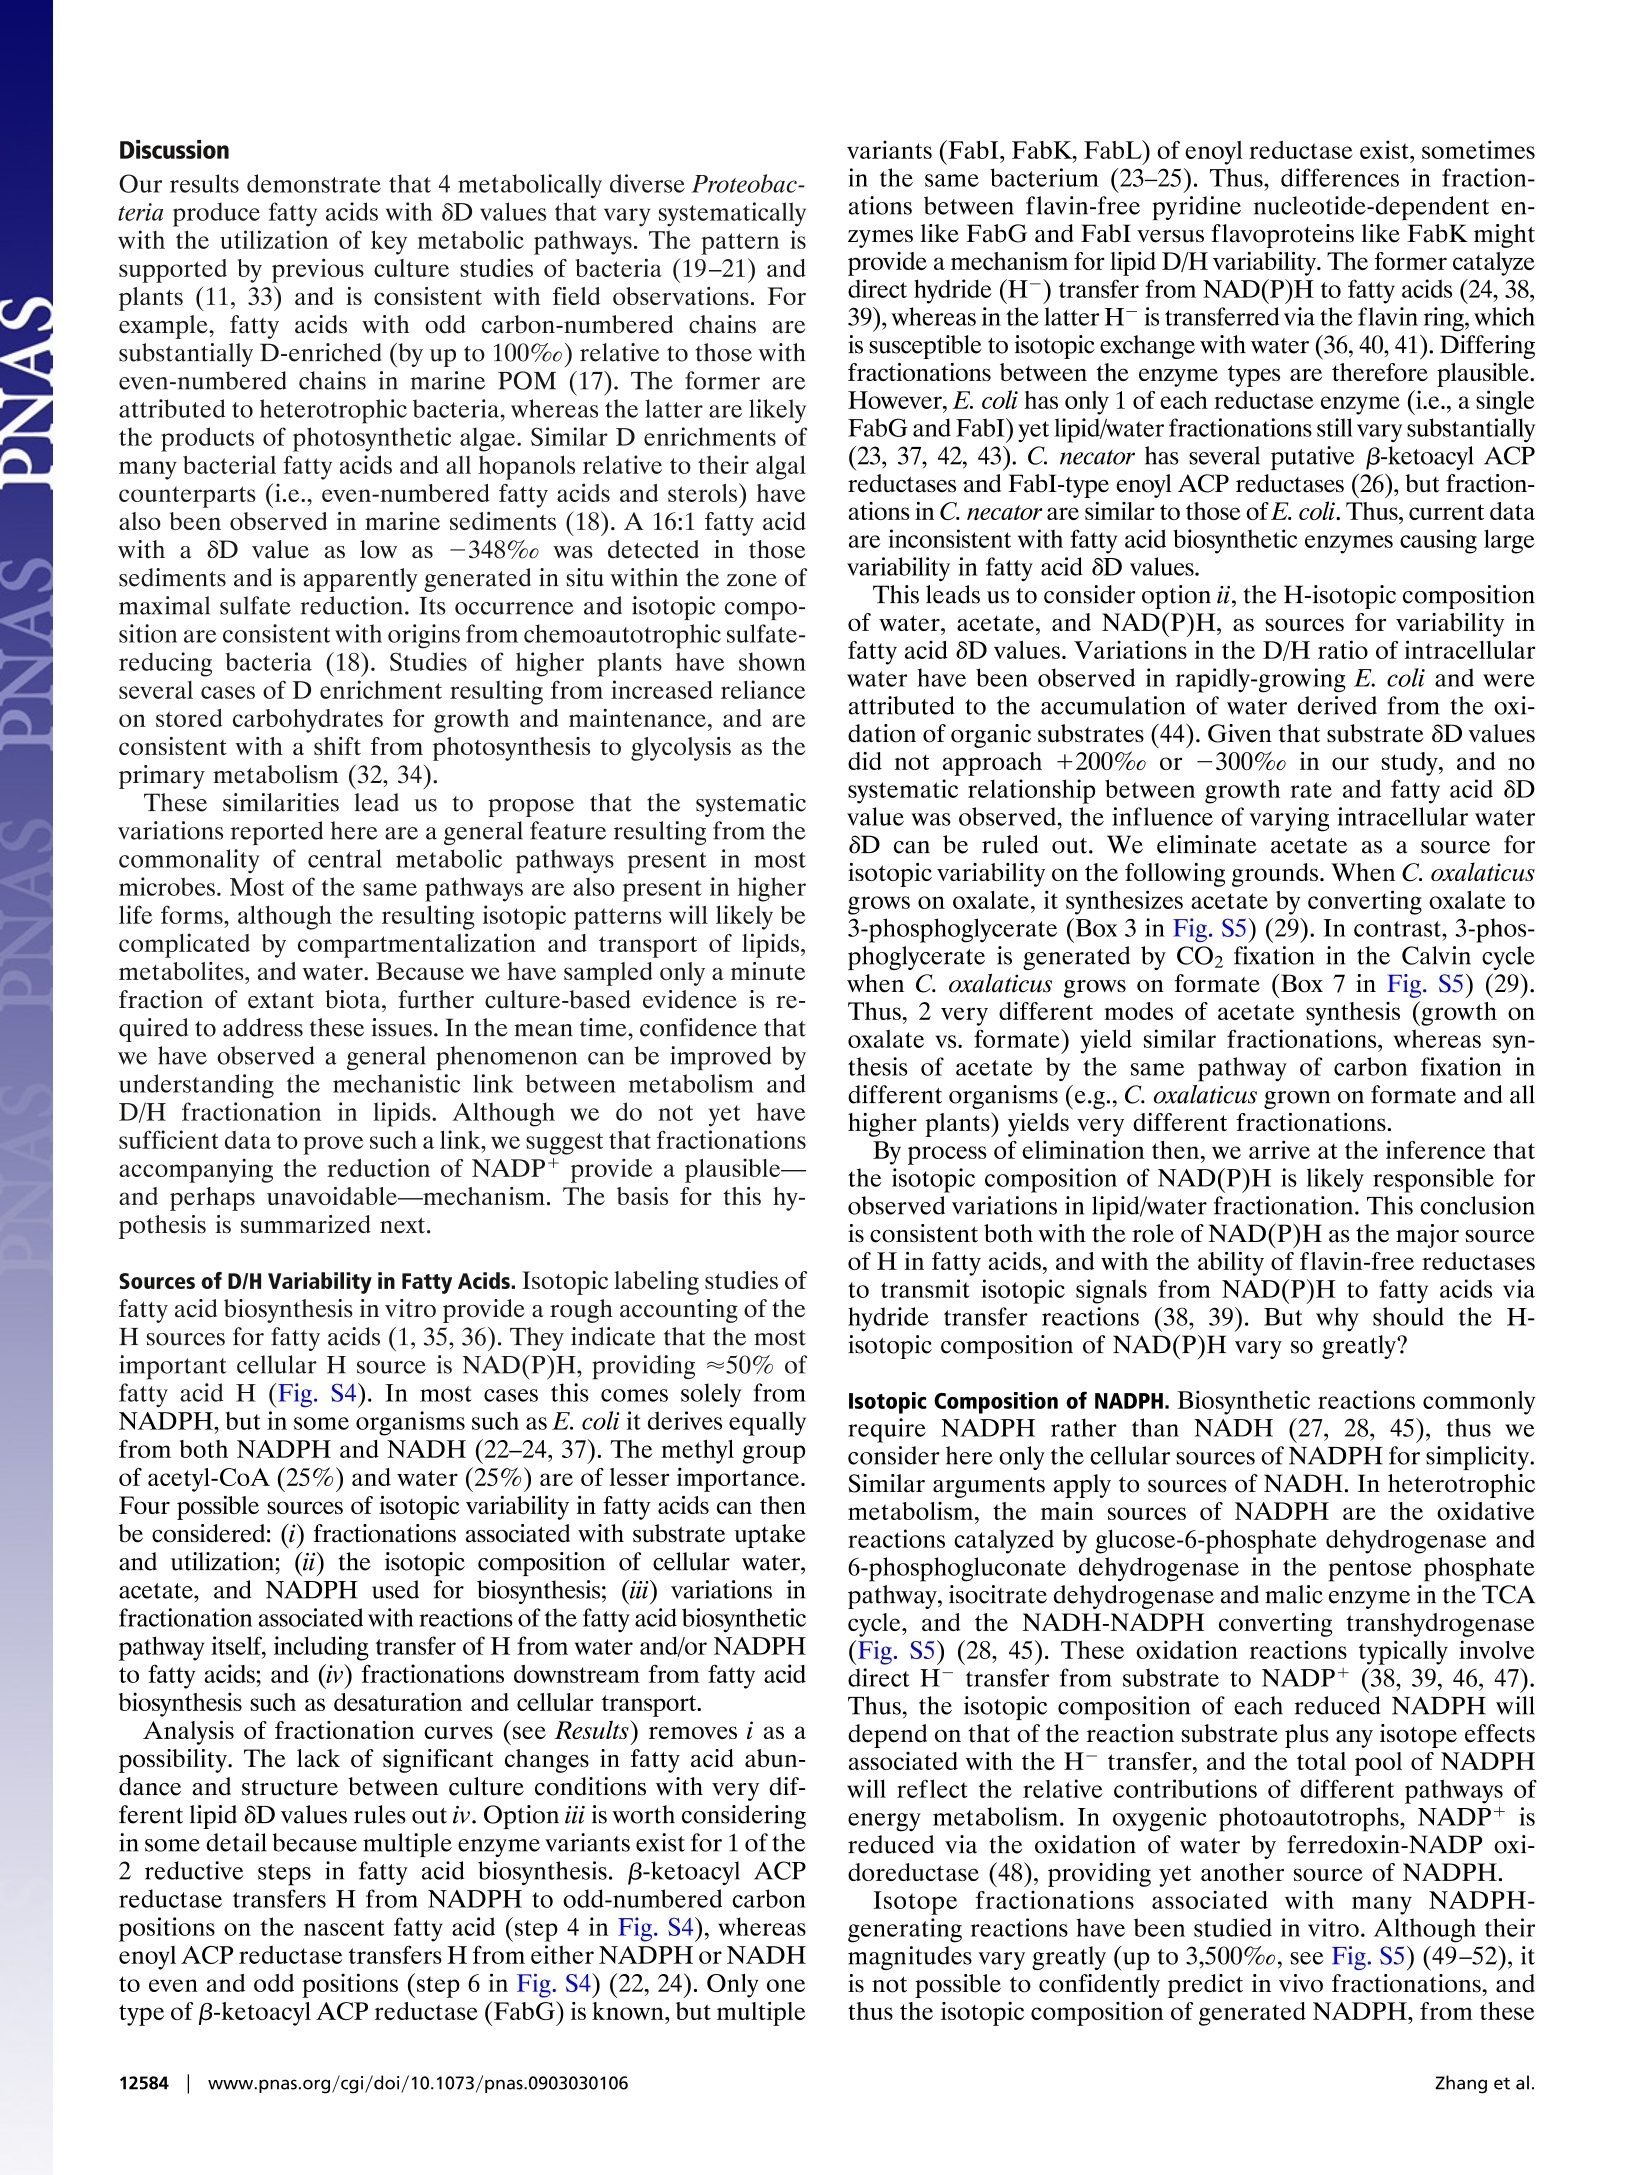
Large D/H variations in bacterial lipids reflect centralmetabolic pathways Xinning Zhang, Aimee L. Gillespie, and Alex L. Sessionsa,b,1 aEnvironmental Science and Engineering Program and bDivision of Geological and Planetary Sciences, California Institute of Technology,Pasadena, CA 91125 This Feature Article is part of a series identified by the Editorial Board as reporting findings of exceptional significance. Edited by John M. Hayes,Woods Hole Oceanographic Institution, Woods Hole, MA, and approved May 29, 2009 (received for review March 19, 2009) Large hydrogen-isotopic (D/H) fractionations between lipids andgrowth water have been observed in most organisms studied todate. These fractionations are generally attributed to isotopeeffects in the biosynthesis of lipids, and are frequently assumed tobe approximately constant for the purpose of reconstructing cli-matic variables. Here, we report D/H fractionations between lipidsand water in 4 cultured members of the phylum Proteobacteria,and show that they can vary by up to 500% in a single organism.The variation cannot be attributed to lipid biosynthesis as there isno significant change in these pathways between cultures,nor canit be attributed to changing substrate D/H ratios. More impor-tantly, lipid/water D/H fractionations vary systematically withmetabolism: chemoautotrophic growth (approximately-200 to-400%), photoautotrophic growth (-150 to -250%), heterotro-phic growth on sugars (0 to-150%), and heterotrophic growth onTCA-cycle precursors and intermediates (-50 to +200%) all yielddifferent fractionations. We hypothesize that the D/H ratios oflipids are controlled largely by those of NADPH used for biosynthesis,rather than by isotope effects within the lipid biosynthetic pathwayitself. Our results suggest that different central metabolic pathwaysyield NADPH-and indirectly lipids-with characteristic isotopic com-positions. If so, lipid 6D values could become an important biogeo-chemical tool for linking lipids to energy metabolism, and would yieldinformation that is highly complementary to that provided by 13Cabout pathways of carbon fixation. fatty acidsfractionation|metabolism|hydrogen isotopes Th'hee hydrogen-isotopic composition (2H/H or D/H ratio,commonly expressed as a 8D value) of lipids is beingexplored by scientists with diverse interests, including the originsof natural products (1, 2), biogeochemical cycles (3), petroleumsystems (4), and paleoclimate (5-7). Because the D/H ratios oflipids are generally conserved over ~10-year time scales (8),they are a potentially useful tracer of biogeochemical pathwaysand processes in the environment. Most research to date hasfocused on higher plants, in which environmental water is thesole source of external hydrogen and consequently providesprimary control over the D/H ratio of biosynthesized lipids(9).Although 8D values for plant lipids and environmental water aregenerally well correlated, they are also substantially offset fromeach other. The biochemical basis for this lipid/water fraction-ation is not well understood. It is generally assumed to arise froma combination of isotope effects during photosynthesis and thebiosynthesis of lipids (9-12), and is often treated as approxi-mately constant to reconstruct isotopic compositions of envi-ronmental water as a paleoclimate proxy. There is, however, mounting evidence that the net D/Hfractionation between lipids and water can vary by up to 150%in plants, even in the same organism (12-16). Modest fraction-ations associated with fatty acid elongation and desaturationhave been documented (2,14, 15) but are unlikely to account forall of the observed variability. Recent surveys of lipids in marineenvironments have hinted at even greater variability in isotopic compositions. Jones et al. (17) measured fatty acids extractedfrom coastal marine particulate organic matter (POM) andfound 8D values ranging from -73 to -237%0. Measurementsof lipids from marine sediments have extended this range from-32 to -348%0 for lipids with n-alkyl skeletons and -148 to-469%o for those with isoprenoid skeletons (18). Because thelipids measured by both studies likely derive from marineorganisms inhabiting seawater of essentially constant 8D value(~0%0), such differences cannot be due to varying environmen-tal water. Rather, they must relate to more fundamental differ-ences in metabolism. Culture studies, although limited in number, support theoccurrence of highly variable D/H fractionations. Hydrocarbonsproduced by the green alga Botryococcus braunii were depletedin D relative to growth water by 197 to 358%0 (16). Fatty acidsfrom the aerobic methanotroph Methylococcus capsulatus (19)were depleted by 20 to 70%o, whereas those in the sulfate-reducing chemoautotroph Desulfobacterium autotrophicum weredepleted by 190 to 360%0 (20). The most strongly fractionatingorganism reported to date is an H2+ CO2 using acetogen,Sporomusa sp. DSM 58, which produced fatty acids with deple-tions in D of nearly 400%o (21). Some of this reported variability can be ascribed to systematicdifferences between lipids with n-alkyl versus isoprenoid skele-tons. Isoprenoid lipids are typically D depleted relative to n-alkyllipids by 100%0 or more, a pattern now widely confirmed in bothculture (13, 16, 19) and environmental samples (12, 18). How-ever, significant variability within single classes of lipids (e.g.,fatty acids) cannot be explained because the chemical mecha-nisms of lipid biosynthesis are strongly conserved across mostbacterial and eukaryotic phyla (22-25). Thus, many importantquestions linger. Do D/H fractionations associated with differentmetabolic lifestyles (i.e.,photoautotrophy, chemoautotrophy, orheterotrophy) systematically differ? Do they differ in bacteriaversus eukaryotes? Perhaps most fundamentally, how and whydo biosynthetic processes fractionate hydrogen isotopes at themolecular level and lead to lipids with such diverse isotopiccompositions? These questions lie at the heart of our ability touse and interpret lipid 8D values from all types of environmentalsamples. To explore such issues, we measured lipid D/H frac-tionations in 4 metabolically versatile bacteria grown underphotoautotrophic, photoheterotrophic, chemoautotrophic, andheterotrophic conditions on a range of carbon sources metab-olized by different pathways of central metabolism. ( Author contributions: X.Z. and A.L.S. designed research; X.Z., A.L.G., and A.L.S. performed research; X.Z. analyzed d ata;a n d X.Z. and A.L.S. wrote the pa p er. ) ( The authors declare no conflict of in t erest. ) ( This article i s a PNAS Direct Submission. ) ( See Commentary on page 12565. ) ( 1 To whom correspondence should be a dd r essed. E-m a il: als@gps.calte c h.ed u . ) C. oxalaticus oxalate — -68.6to +218.3 0.29 Co1-I,II,III,IV oxalate 二 -68.6 to +218.3 0.28 Co2-I,II,III,IV tormate 972 -68.6 to+218.3 0.33 Co3-I,II,III,IV acetate -76 -68.6 to +218.3 0.50 Co4-I,II,III,IV succinate -97 -64.3 to +214.1 0.60 Co5-I,II,III,IV succinate -97 +41.1 to +214.1 NA Co6-II,III,IV C. necator tormate 972 -68.3 0.17 Cn1-1 tructose -22 -65.5 0.34 Cn2-1 gluconate NA -68.1 0.36 Cn3-1 pyruvate -12 -64.4 0.61 Cn4-I acetate -76 -68.5 0.35 Cn5-1 succinate -97 -68.6 0.48 Cn6-1 succinate -97 -68.6 NA Cn7-1I E. coli glucose -60 -61.9 0.64 Ec1-1 gluconate NA -62.2 0.57 Ec2-1 pyruvate -12 -68.1 0.37 Ec3-1 acetate -76 -62.4 0.31 Ec4-1 glucose -60 -60.0 to +314.0 0.66 Ec5-I,II,III,IV LB NA -60.0 to +152.0 NA Ec6-I,ll,III R. palustris acetate NA -53.6 0.10 Rp1-I acetate, light NA -53.6 0.068 Rp2-I CO2, light — -53.6 0.015 Rp3-I *8D of non-exchangeable C-bound H in the growth substrate (see SI Methods for calculation details). Uncertain-ties are likely<20%. - indicates a substrate with no H, NA, not available.t8D of culture medium before inoculation. Average analytical uncertainty (1o) is 0.7%o. Range refers to the spanof values covered by 4 replicate cultures, each differing by=100%o.*1o was ≤0.04 for n ≥2 cultures in experiments Co1-Co5. sMultiple numbers indicate parallel cultures grown in medium with different 8Dw values. Cultures Co6-lI,III,lV andCn7-I were harvested in stationary phase, all others were harvested in exponential phase. OD values at harvest arein Fig. S1. Results Cultures and Fatty Acids. Four species of bacteria, chosen toprovide a sampling of metabolic diversity, were grown in batchculture on varying substrates (Table 1, see SI Methods fordetails). Cupriavidus oxalaticus str. OX1 and C. necator str. H16are facultative chemoautotrophic B-Proteobacteria commonlyfound in soil and freshwater environments (26), and were grownas aerobic heterotrophs and chemoautotrophs. The model or-ganism Escherichia coli K-12 str. MG1655, an obligate hetero-trophic y-Proteobacterium, was grown aerobically. The purplenon-sulfur anoxygenic phototroph Rhodopseudomonas palustrisstr. TIE-1 is an a-Proteobacterium and was grown under anaer-obic photoautotrophic, anaerobic photoheterotrophic, and aer-obic heterotrophic conditions. Organic substrates were chosenbased on their catabolic relationship to the different pathways ofcentral metabolism. They include those that feed into glycolysis(glucose, fructose, gluconate, pyruvate), the tricarboxylic acid(TCA) cycle (acetate, succinate), and chemoautotrophic* me-tabolism [formate, oxalate (27-29)]. Most cultures were harvested during exponential growth (Fig.S1). Fatty acids were solvent-extracted, derivatized as methylesters, and quantified by gas chromatography/mass spectrometry ( *Growth on ox a late is classically regarded a s h e terotrophic, not chemoautotrophic, me-tabolism. H owever,conservation of energy during growth is similar to that on formate inthat 1 -carbon reactions form the basis f o r generation of re d ucing power, analogous to " true " chemoautotrophy (e.g., growth on H2 + C O 2 ) (29, 30) . Hence we refe r here togrowth on f o rmate and ox a late as ch e moautotrophic for the purpose of d e scribing h ydrogen, rather than carbon, m etabolism. ) (GC/MS; Table S1). The most abundant fatty acids in C.oxalaticus and C. necator were palmitic (16:0), palmitoleic (16:1),and oleic (18:1) acids. An additional fatty acid, cyclopropyl-heptadecanoic acid (cyc-17), was abundant in E. coli. R. palustrisproduced significant amounts of 18:1, 18:0 (stearic acid), and16:0 fatty acids. Relative abundances of fatty acids varied by<35% between cultures of each bacterial species, with nosystematic relationship between growth substrate and fatty acidabundance (Table S1). Values of 8D for individual fatty acids varied widely betweencultures (-362 to +331%0), but typically by less than ≈30%between different fatty acids from the same culture (Table S2).For simplicity we report and discuss the 8D values for palmiticacid as representative of each culture, both because it waspresent in every organism and because it was generally the mostabundant fatty acid. Growth on Different Substrates Leads to Varying Fractionation Be-tween Lipids and Water. Fig. 1 summarizes current and previousculture data and shows that the net D/H fractionations betweenlipids and culture water vary in all analyzed strains. The 2Cupriavidus strains, which have the most metabolically versatilecarbon metabolisms, exhibited the largest variability (up to500%0). This is the largest range of isotopic fractionations yetrecorded for any individual organism, and includes instances ofboth D enrichment and D depletion relative to water. Theobserved range of fractionations is substantially larger than hasbeen previously observed in environmental samples, and-ifexpressed in nature—would have the potential to explain all such aerobic Fig.1.Summary of D/H fractionations between fatty acids and water observed in culture experiments, native specimens, and marine organic matter fractions.Plotted fractionations are based on the average 8D value of palmitic acid, or the fatty acid/alkane of nearest chain length, in the culture with water 8D closestto 0%o. Bacterial cultures from this study (*) are C. oxalaticus (Co), C. necator (Cn), E. coli(Ec), and R. palustris (Rp). Organisms from other studies (13, 16, 19-21,61) are cultured bacteria D. autotrophicum (Da), Sporumusa sp. (Sp),and M. capsulatus (Mc), cultured phytoplankton B. braunii (Bb), Alexandrium fundyense(Af), Isochrysis galbana (Ig), and natural specimens of brown alga Undariapinnatifida (Up), red alga Binghamia californica (Bc), and seagrass Zostera marina (Zm).The gray box covers the range of fractionations observed in marine POM and sediments (17, 18). Growth substrates are oxalate (ox), formate (fo), fructose (fr),glucose (gc), gluconate (gl), pyruvate(py), acetate (ac), succinate (su, sut), LB(Ib), H2+ CO2 (hc), H2+SO4-(hs), methane (me), acetate+light (ph), CO2 +light(pa), S203?-+ CO2 +light (apa). Error bars for culture Co*-ox are the standard deviation (±1o) for 4 sets of biological replicates; other cultures were notreplicated. Typical analytical uncertainties are ± 3.5% for all cultures. environmental D/H variability. At the same time, lipid/waterfractionation during anoxygenic photoautotrophic growth of R.palustris was within the range commonly observed for plants. Forheterotrophic cultures, the 8D values of most supplied organicsubstrates (8Ds) differ by <100% (Table 1) and cannot explainthe range of observed lipid 8D values. For example, growth ofE. coli on glucose (8Ds=-60%0) led to D depletion of lipidsrelative to both water and substrate, whereas growth on acetate(8Ds=-76%0) led to D enrichment. Manipulation of Growth Water 8D: Fractionation Factor Curves. Ad-ditional information on the biochemical causes of these variablefractionations can be deduced from experiments in which theisotopic composition of culture water is experimentally manip-ulated (19). Conceptually, the net fractionations between lipidsand each external H source (i.e., water and organic substrate)can be treated as distinct, yielding the isotopic mass balance where Ri, Rw, and R, denote the D/H ratios of lipids, water, andsubstrates, respectively (31). Xw is the mole fraction of lipid Hderived from external water, whereas oj/w and oy/s represent thenet isotopic fractionations associated with uptake and utilizationof water and substrate hydrogen, respectively.Eq. 1 representsthe overall isotopic relationship between lipids and externalsources of H, and does not imply that the sources must be directlyinvolved in lipid biosynthesis (e.g., glucose may contribute H tolipids by way of metabolic intermediates even though it does notdirectly participate in the biosynthetic reactions).Measurementsof Rw, Rs, and Ri for parallel cultures in which only 1 parameter, Rw, is varied experimentally form the basis for regression of Ron Rw. This yields a unique slope and intercept that can be usedto constrain the relevant fractionations. To this end, C. oxalaticus and E. coli were grown on glucose,acetate, succinate, formate, oxalate, and Lysogeny broth (LB)using waters with 8D values ranging from -68 to +314%0.Strong linear relationships (R2=0.98) between 8D values of fattyacids and water were obtained for all such experiments (Fig. 2),implying that the uncertainty in 8D values for each culture isminimal (probably <20%0). This is consistent with several“true”biologic replicates grown in identical waters, for which 8Dvalues differed by<11%(1o). For cultures where Xw is known, olw and ol/s can be calculateddirectly from the slope and intercept of the regression. Oxalatecarries no H at physiological pH, so Xw =1 for C. oxalaticus Fig. 2. Regressions of 8D values for palmitic acid versus water for C. oxala-ticus grown on oxalate, formate, acetate, and succinate. Error bars represent1o uncertainty for biological replicates. Data for other lipids are in Fig. S2 andTable S3. Each regression provides constraints on fractionations that can bedescribed most succinctly as a single fractionation curve (see Fig. 3). Fig.3. Fractionation factor curves for palmitic acid in C. oxalaticus grown onformate, acetate, and succinate, and in E. coli grown on glucose and LB. Eachcurve represents the set of all possible combinations of al/s and ol/w satisfyingthe constraints imposed by parallel cultures with differing Rw (i.e., 1 linearregression in Fig.2). Filled circles indicate values corresponding to Xw=0.5.Gray shaded area defines up to 600%o variation between al/s and ol/w. Increasesin the true value of ol/s, al/w, and Xw shift curves up, to the right, or down adiagonal as detailed in Fig. S3. growing on oxalate. The corresponding value of ol/w ranged from0.64 to 0.73 for different fatty acids (Table S3). Growth onformate yielded nearly identical results, even though formate isa potential source of H. We infer that H on formate exchangeswith water to preclude the transmission of substrate H to fattyacids, in accord with our understanding of formate metabolism(29) and the recent results of Campbell et al. (20). Two key inferences can be drawn from the fractionationcurves in Fig. 3. First, within a plausible range of values for the2 fractionation factors (0.5 to 2.0), equivalent to ±1,000% and2-fold larger than any net fractionations yet measured forbiosynthetic processes,many fractionation curves do not inter-sect. This is possible only if both olw and als vary betweenconditions (e.g., compare C. oxalaticus on formate vs. E. coli onglucose vs. C. oxalaticus on succinate). Changes in fractionationassociated with the assimilation of substrate, als, cannot by itselfexplain our results, and it is clear that the concept of a nearlyconstant lipid/water fractionation must be discarded. Becauseolw changes even in a single organism, whereas pathways of lipidbiosynthesis are not known to change significantly with growth on different substrates, we infer that the magnitude of olw is notset primarily by lipid biosynthetic reactions. Second, fractionation curves for E. coli growth on glucose andLB are offset along a diagonal, and thus are likely related bysimilar fractionations (a values) with a decrease in Xw fromglucose to LB. This is consistent with the assimilation ofpreformed cell constituents by cells grown on the complex LBmedium, leading to smaller Xw. Curves for growth on acetate andsuccinate also appear related by similar fractionations with adecrease in Xw from succinate to acetate, and are consistent withthe role of acetate as a direct precursor for lipid biosynthesis. Similarity of Lipid-Substrate and Lipid-Water Fractionations. Al-though it is convenient to treat the net lipid/water and lipid/substrate fractionations as independent, this distinction is prob-ably artificial. Approximately 3/4 of fatty acid H derives fromcentral metabolites (acetate or NADPH; see Discussion). Hderived from water and growth substrates is comingled in theseand virtually all other metabolites because many common classesof reactions (isomerization, hydrolysis, rearrangement, ex-change) lead to significant scrambling of C-bound H (32). At thispoint the 2“external”sources of H should be affected by manyof the same reactions and thus the same isotope effects. Thepossibility of markedly different values for al/s and ol/w istherefore difficult to envision. Indeed, having widely differentfractionations for water and substrate H would practically re-quire that these two H pools remain metabolically distinct, butthey do not. Although a strong covariance of alw and als doesreduce the utility of our isotopic labeling approach, there is alsoa substantial benefit in that the inverse problem-inferringbiochemical processes from measured lipid 8D values-is mademuch easier. The strong correspondence of metabolic pathwaysand lipid 8D values implied by Fig. 1 would be highly improbableif als and ow both varied widely and independently. To extract further insight from Fig. 3, we therefore assumethat al/s and olw for any single culture differ from each other by≤600%o (i.e., within the gray region in Fig. 3). This is anarbitrary limit, chosen to encompass the ~500%o range offractionations we observe, but more conservative limits wouldyield similar conclusions. Probable limits for Xw, al/w, and ols canthen be calculated: formate (>95%, 0.73, NA), glucose(68-80%,0.80-0.95, 0.67-1.05), LB (33-47%,0.80-1.15, 0.82-1.05), succinate (58-70%, 1.13-1.38, 0.98-1.48), and acetate(40-56%, 1.03-1.43, 1.0-1.35). The fact that both ol/w and oisvary from D depletion (α<1) to D enrichment (α>1) stronglysupports our contention that variability in fatty acid 8D valuescannot be explained solely by modulation of a single fraction-ating step in their biosynthesis. Four conclusions arise from this analysis. First, more H istransmitted from water to fatty acids when growing on sugarsthan on acetate or succinate. This may reflect greater exchangeof H associated with sugar isomerization reactions, and/or thefact that acetate feeds directly into fatty acid biosynthesis.Second, no H is transmitted from “chemoautotrophic”sub-strates to lipids, including formate, oxalate, and H2. Third, thefractionations associated with different metabolic pathways aredistinct but partially overlapping, in the order chemoautotro-phy < photoautotrophy< heterotrophic growth on sugars
确定


还剩5页未读,是否继续阅读?
北京理加联合科技有限公司为您提供《生物中脂肪与水分检测方案(同位素质谱仪)》,该方案主要用于尿液中脂肪与水分检测,参考标准--,《生物中脂肪与水分检测方案(同位素质谱仪)》用到的仪器有L2140-i 同位素与气体浓度分析仪
推荐专场
相关方案
更多

