


方案详情
文
磷酸铁锂是商业锂电池中一种常用的正材料。虽然磷酸铁与锂离子相互作用经过一相变终变成纯的磷酸铁锂是已知的,但是充放电过程中的磷酸铁锂去锂离子的具体工作机制还是存在争议的。
I. T.Lucas等人利用Neaspec公司的纳米傅里叶变换红外光谱技术(nano-FTIR)对磷酸铁锂在锂电池的充放电过程中的相位分布进行了具体的研究。根据对不同充放电阶段的正材料红外吸收光谱的研究,实验结果直接证明,充放电的中间过程部分脱锂的正材料同时存在磷酸铁锂与磷酸铁两种相位。通过建立三维层析成像的模型建立与分析,由磷酸铁组成的外壳包围由磷酸铁锂组成的核心的“外壳-核心结构”模型适合解释该实验所得结果。分析表明在脱锂的过程中,核心部分的磷酸铁锂慢慢的变小直至终消失。
方案详情

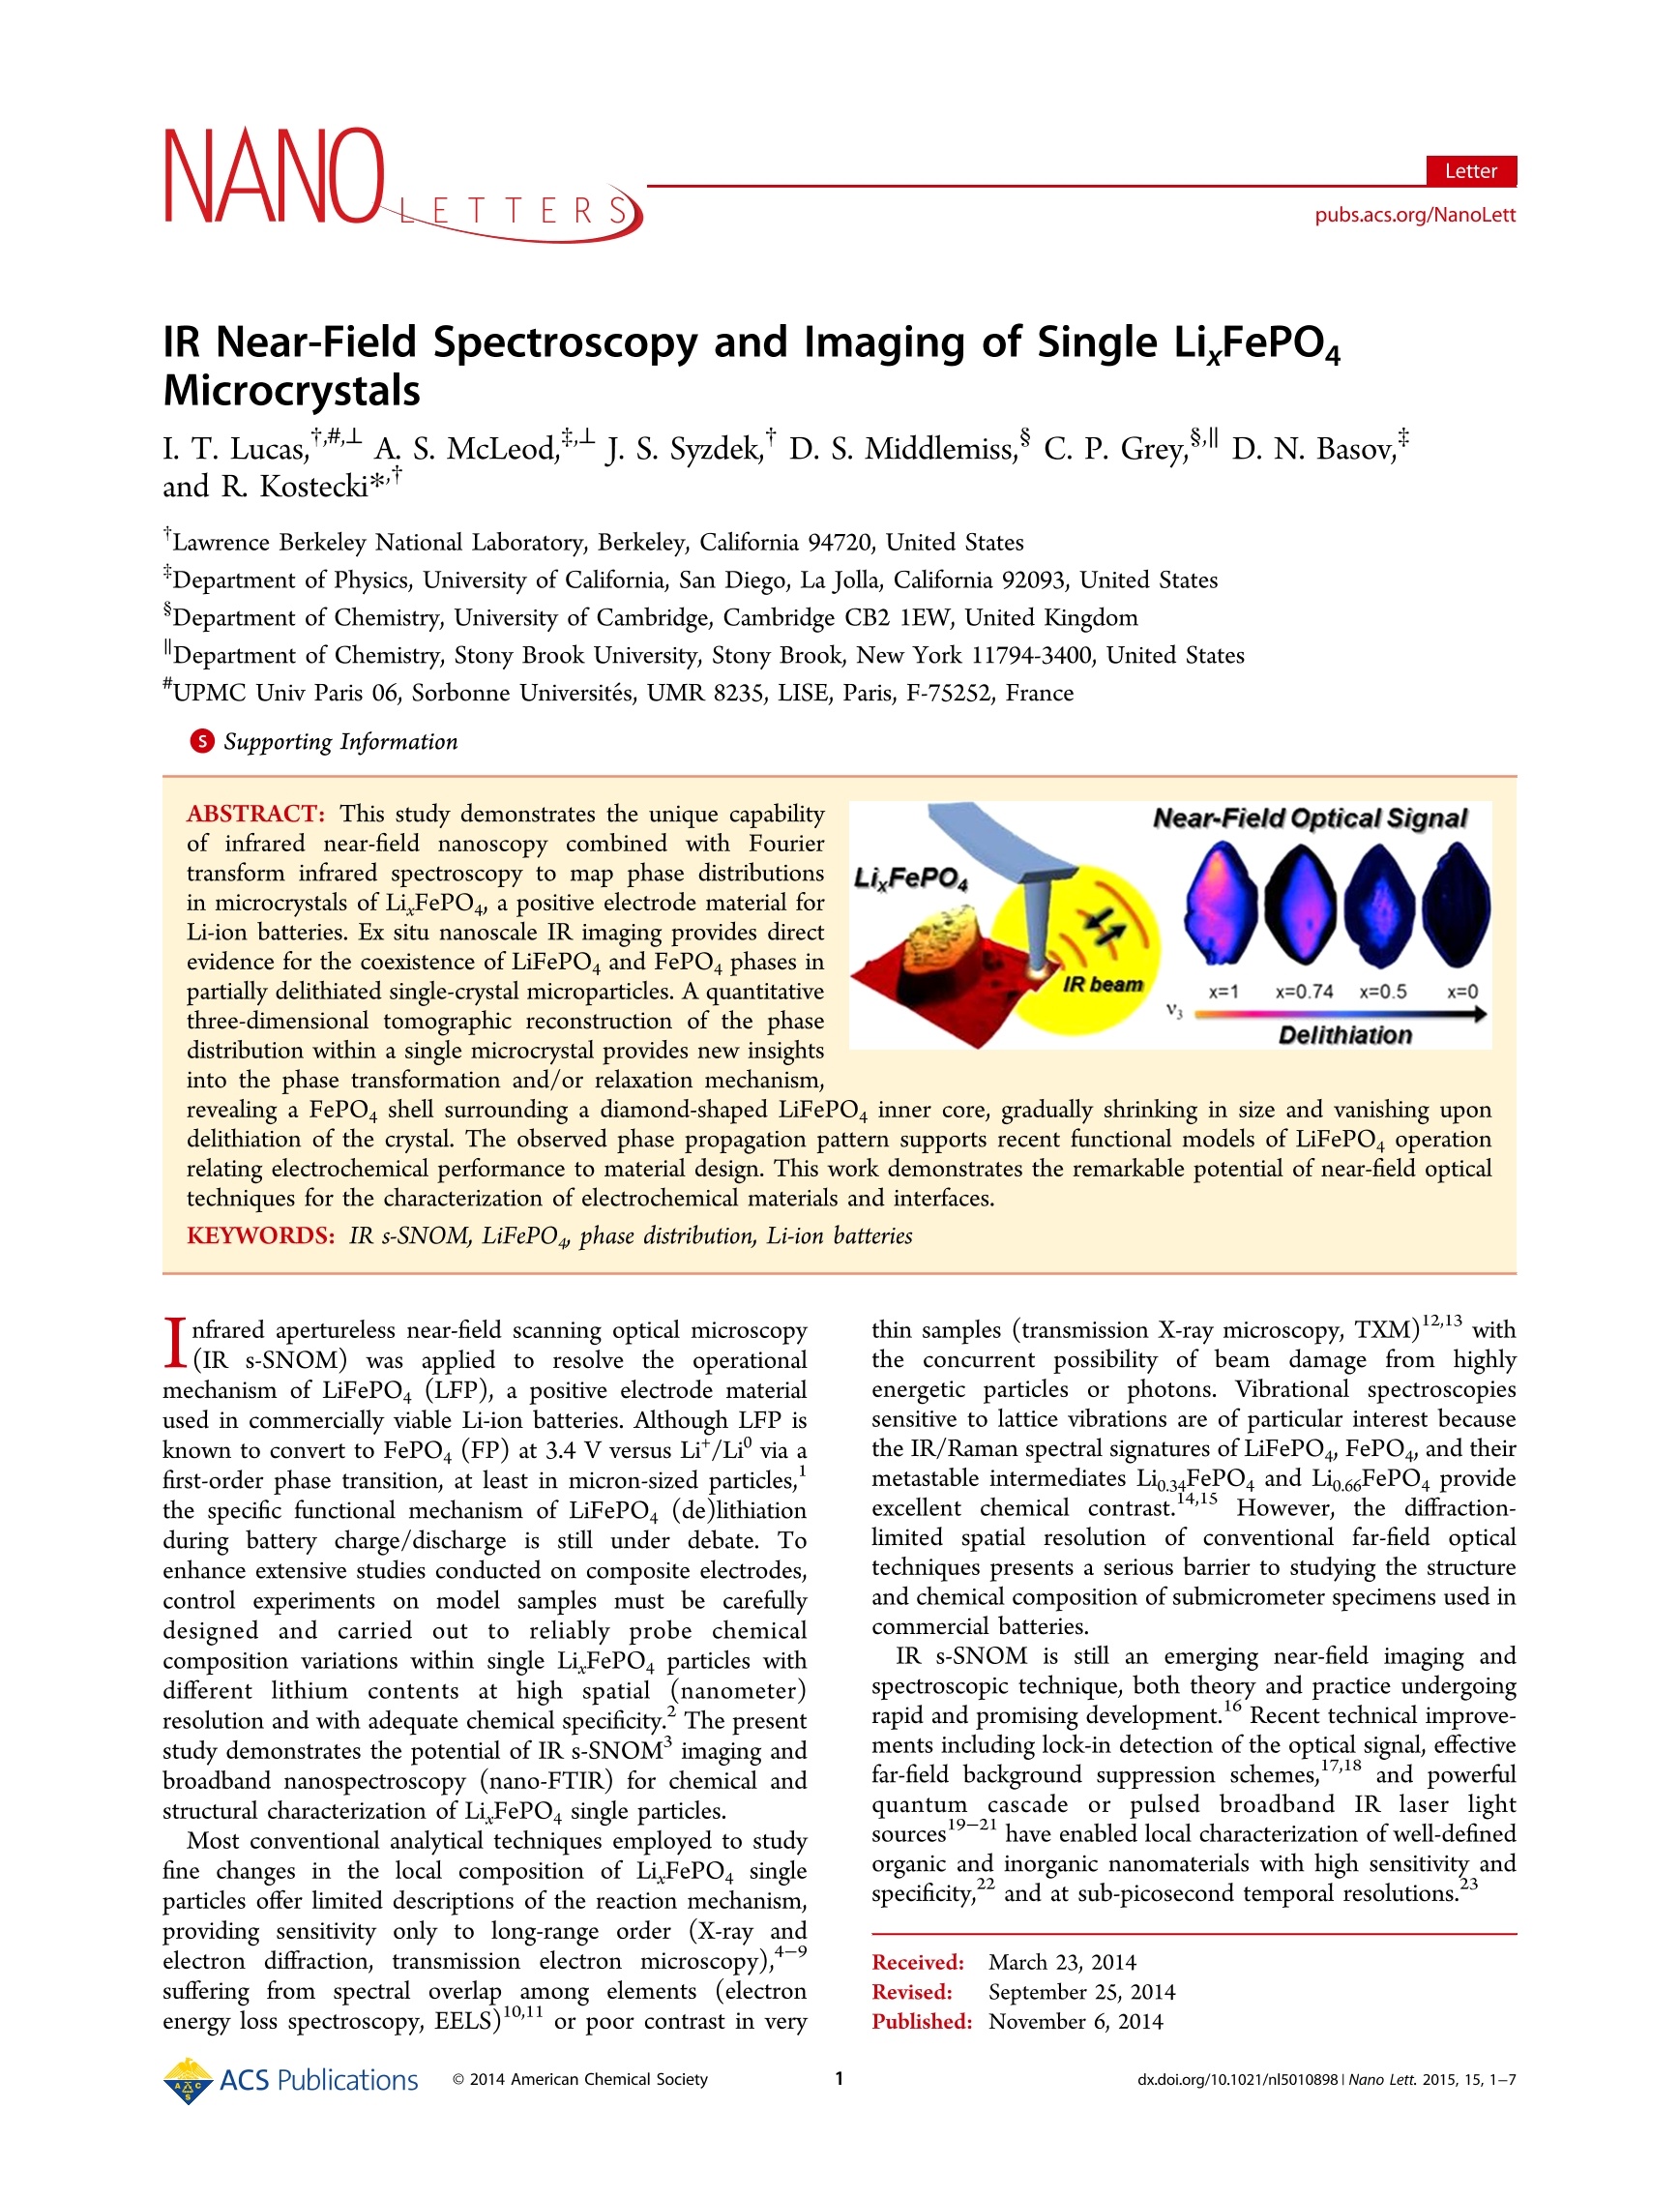
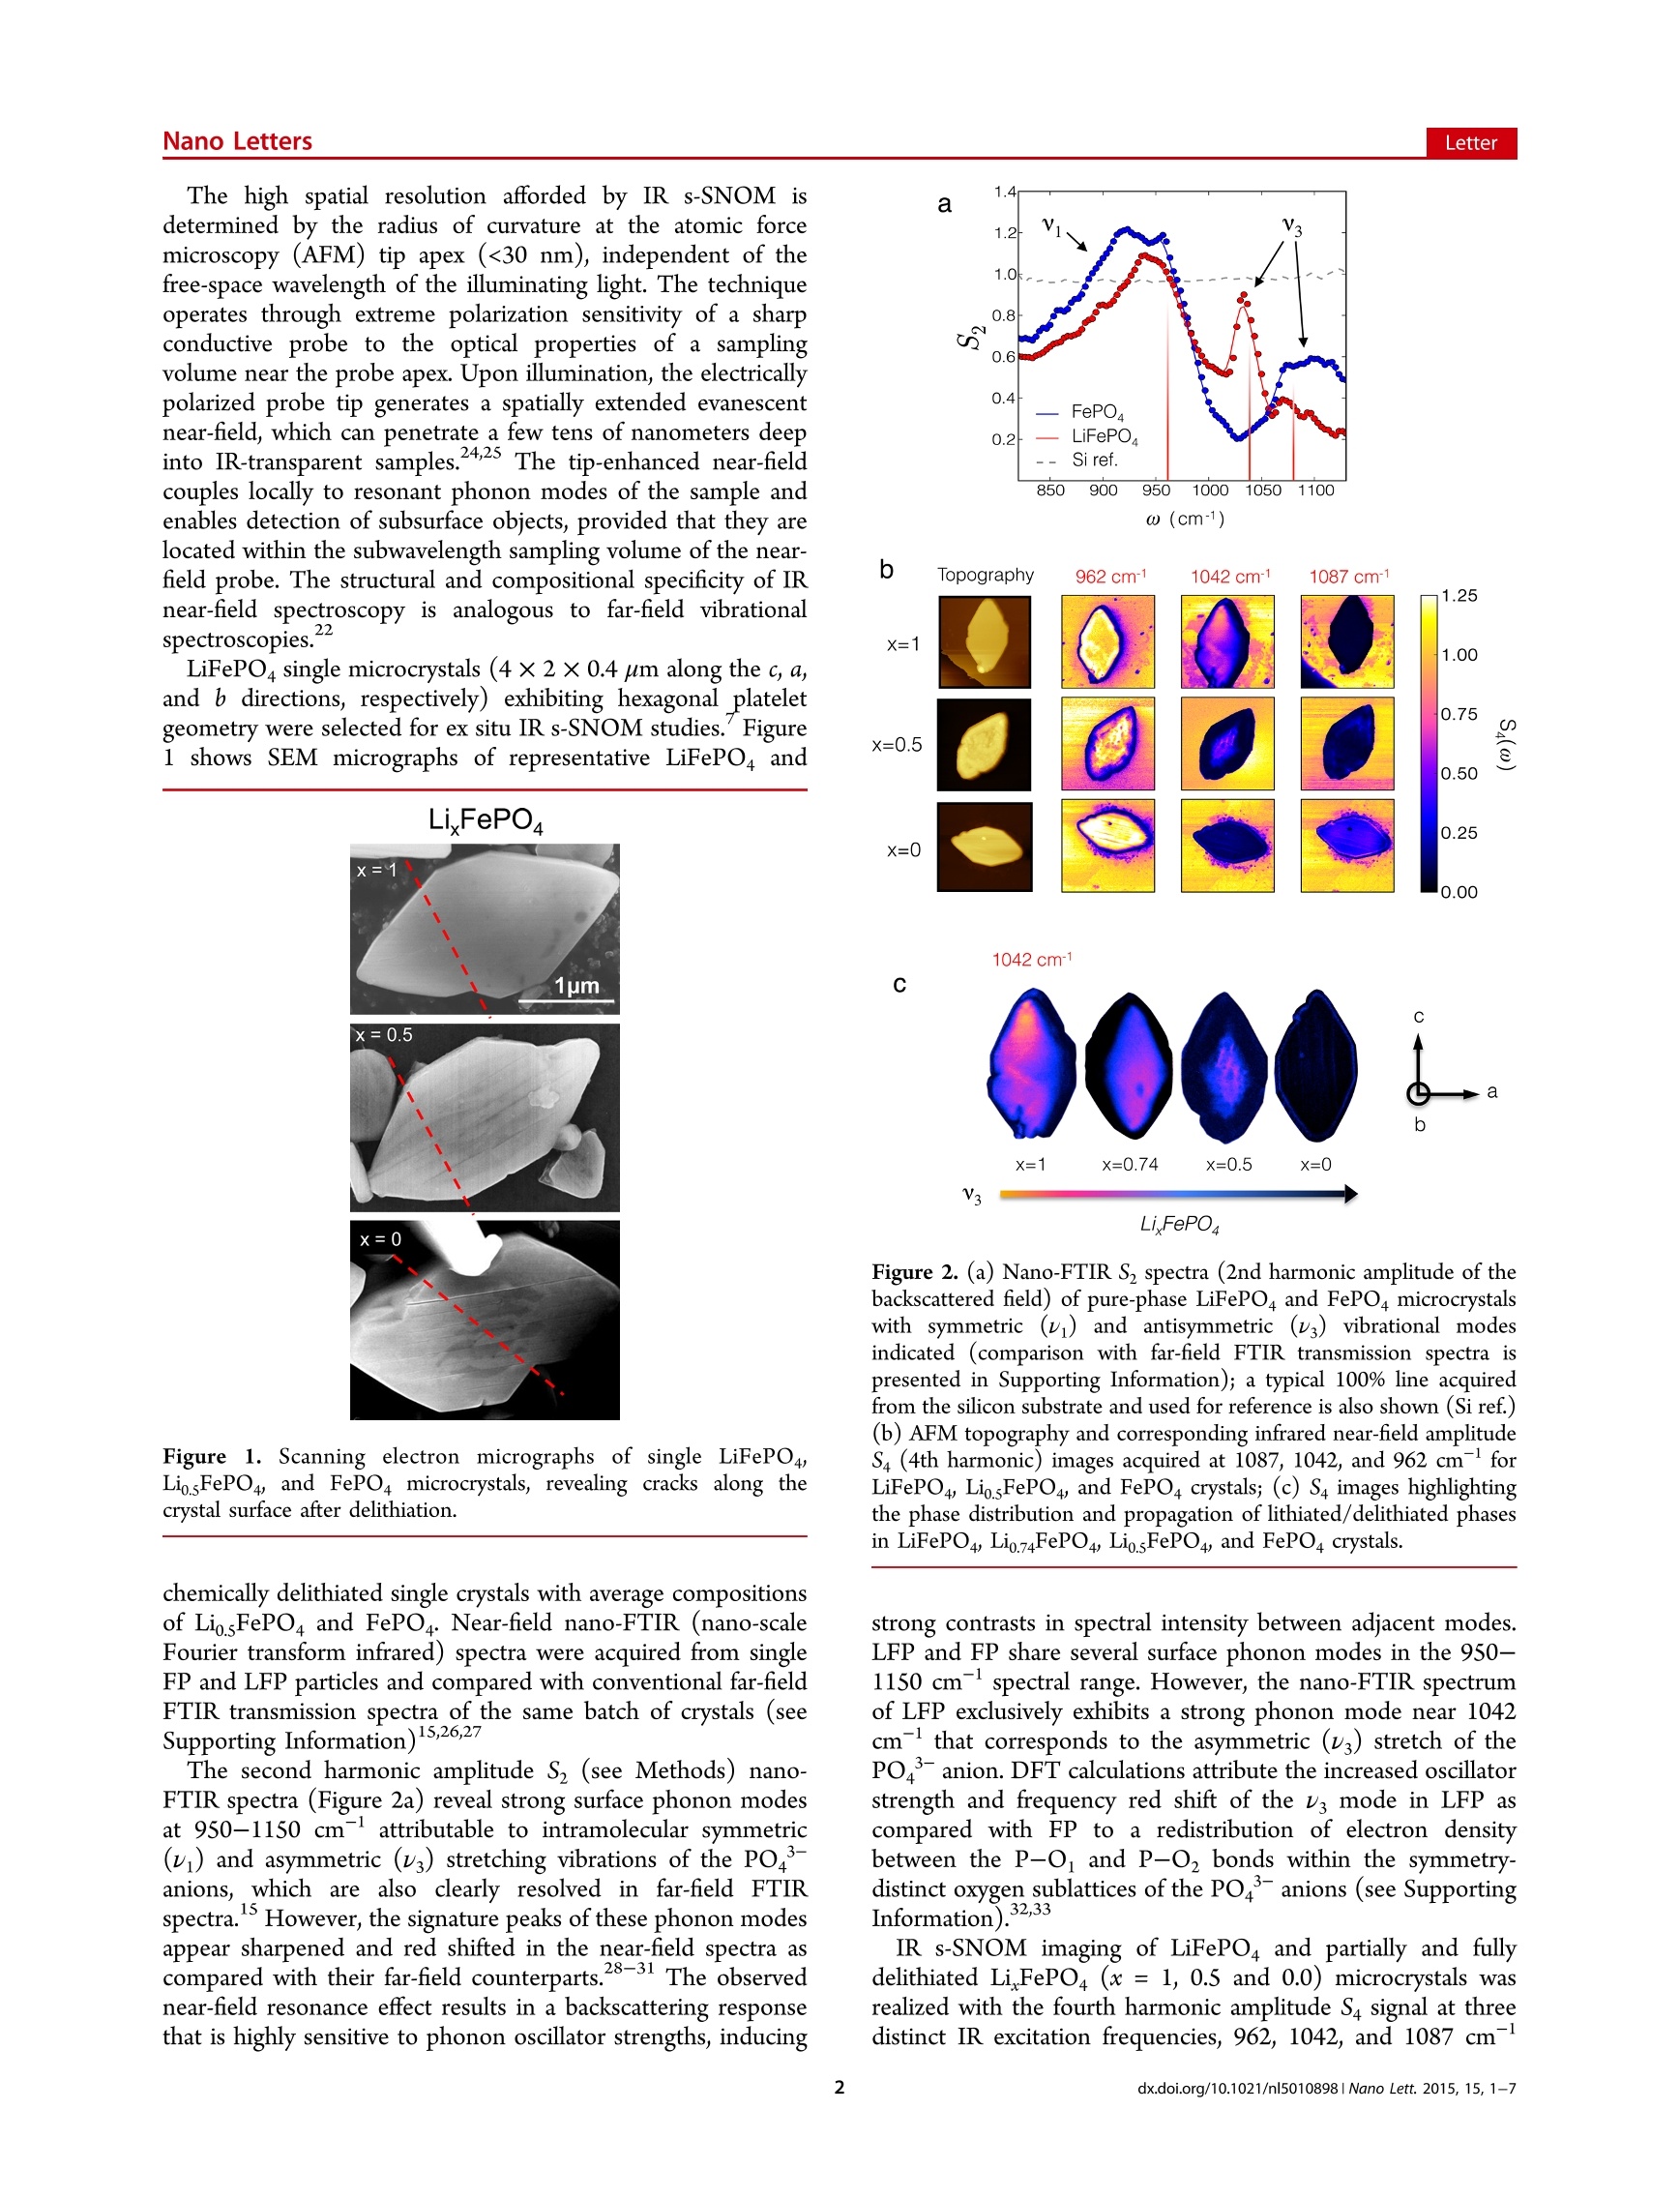
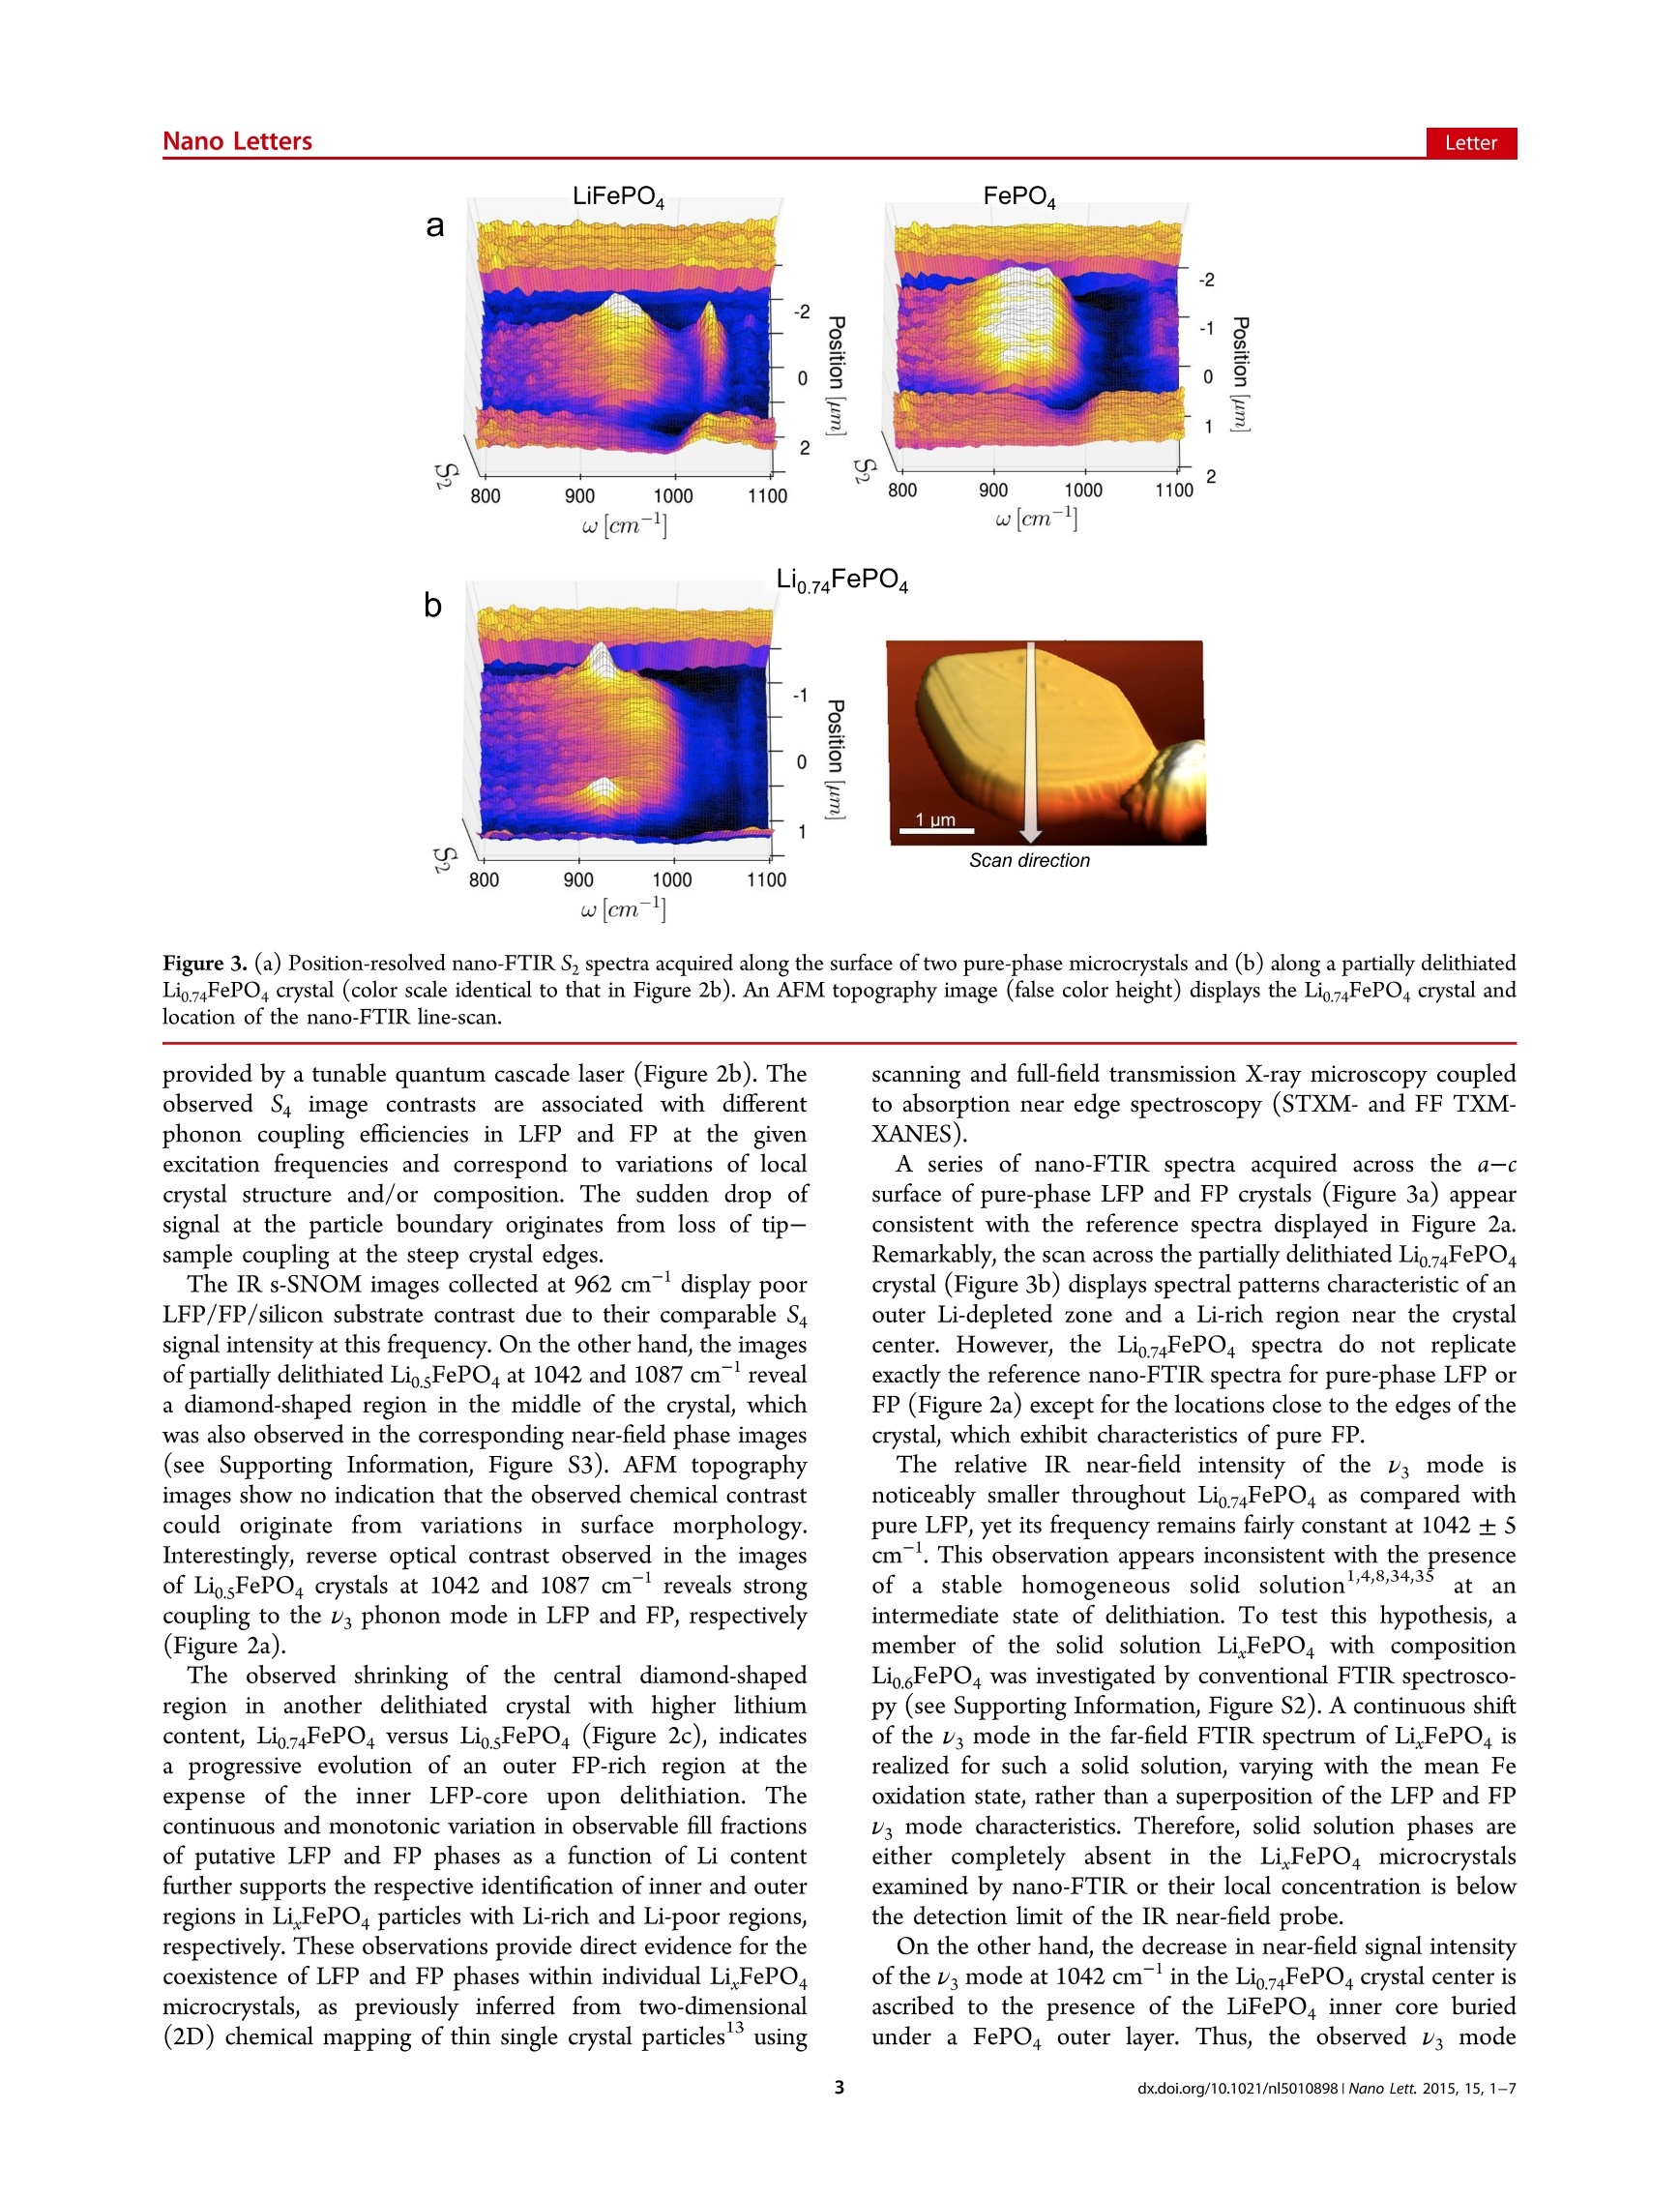
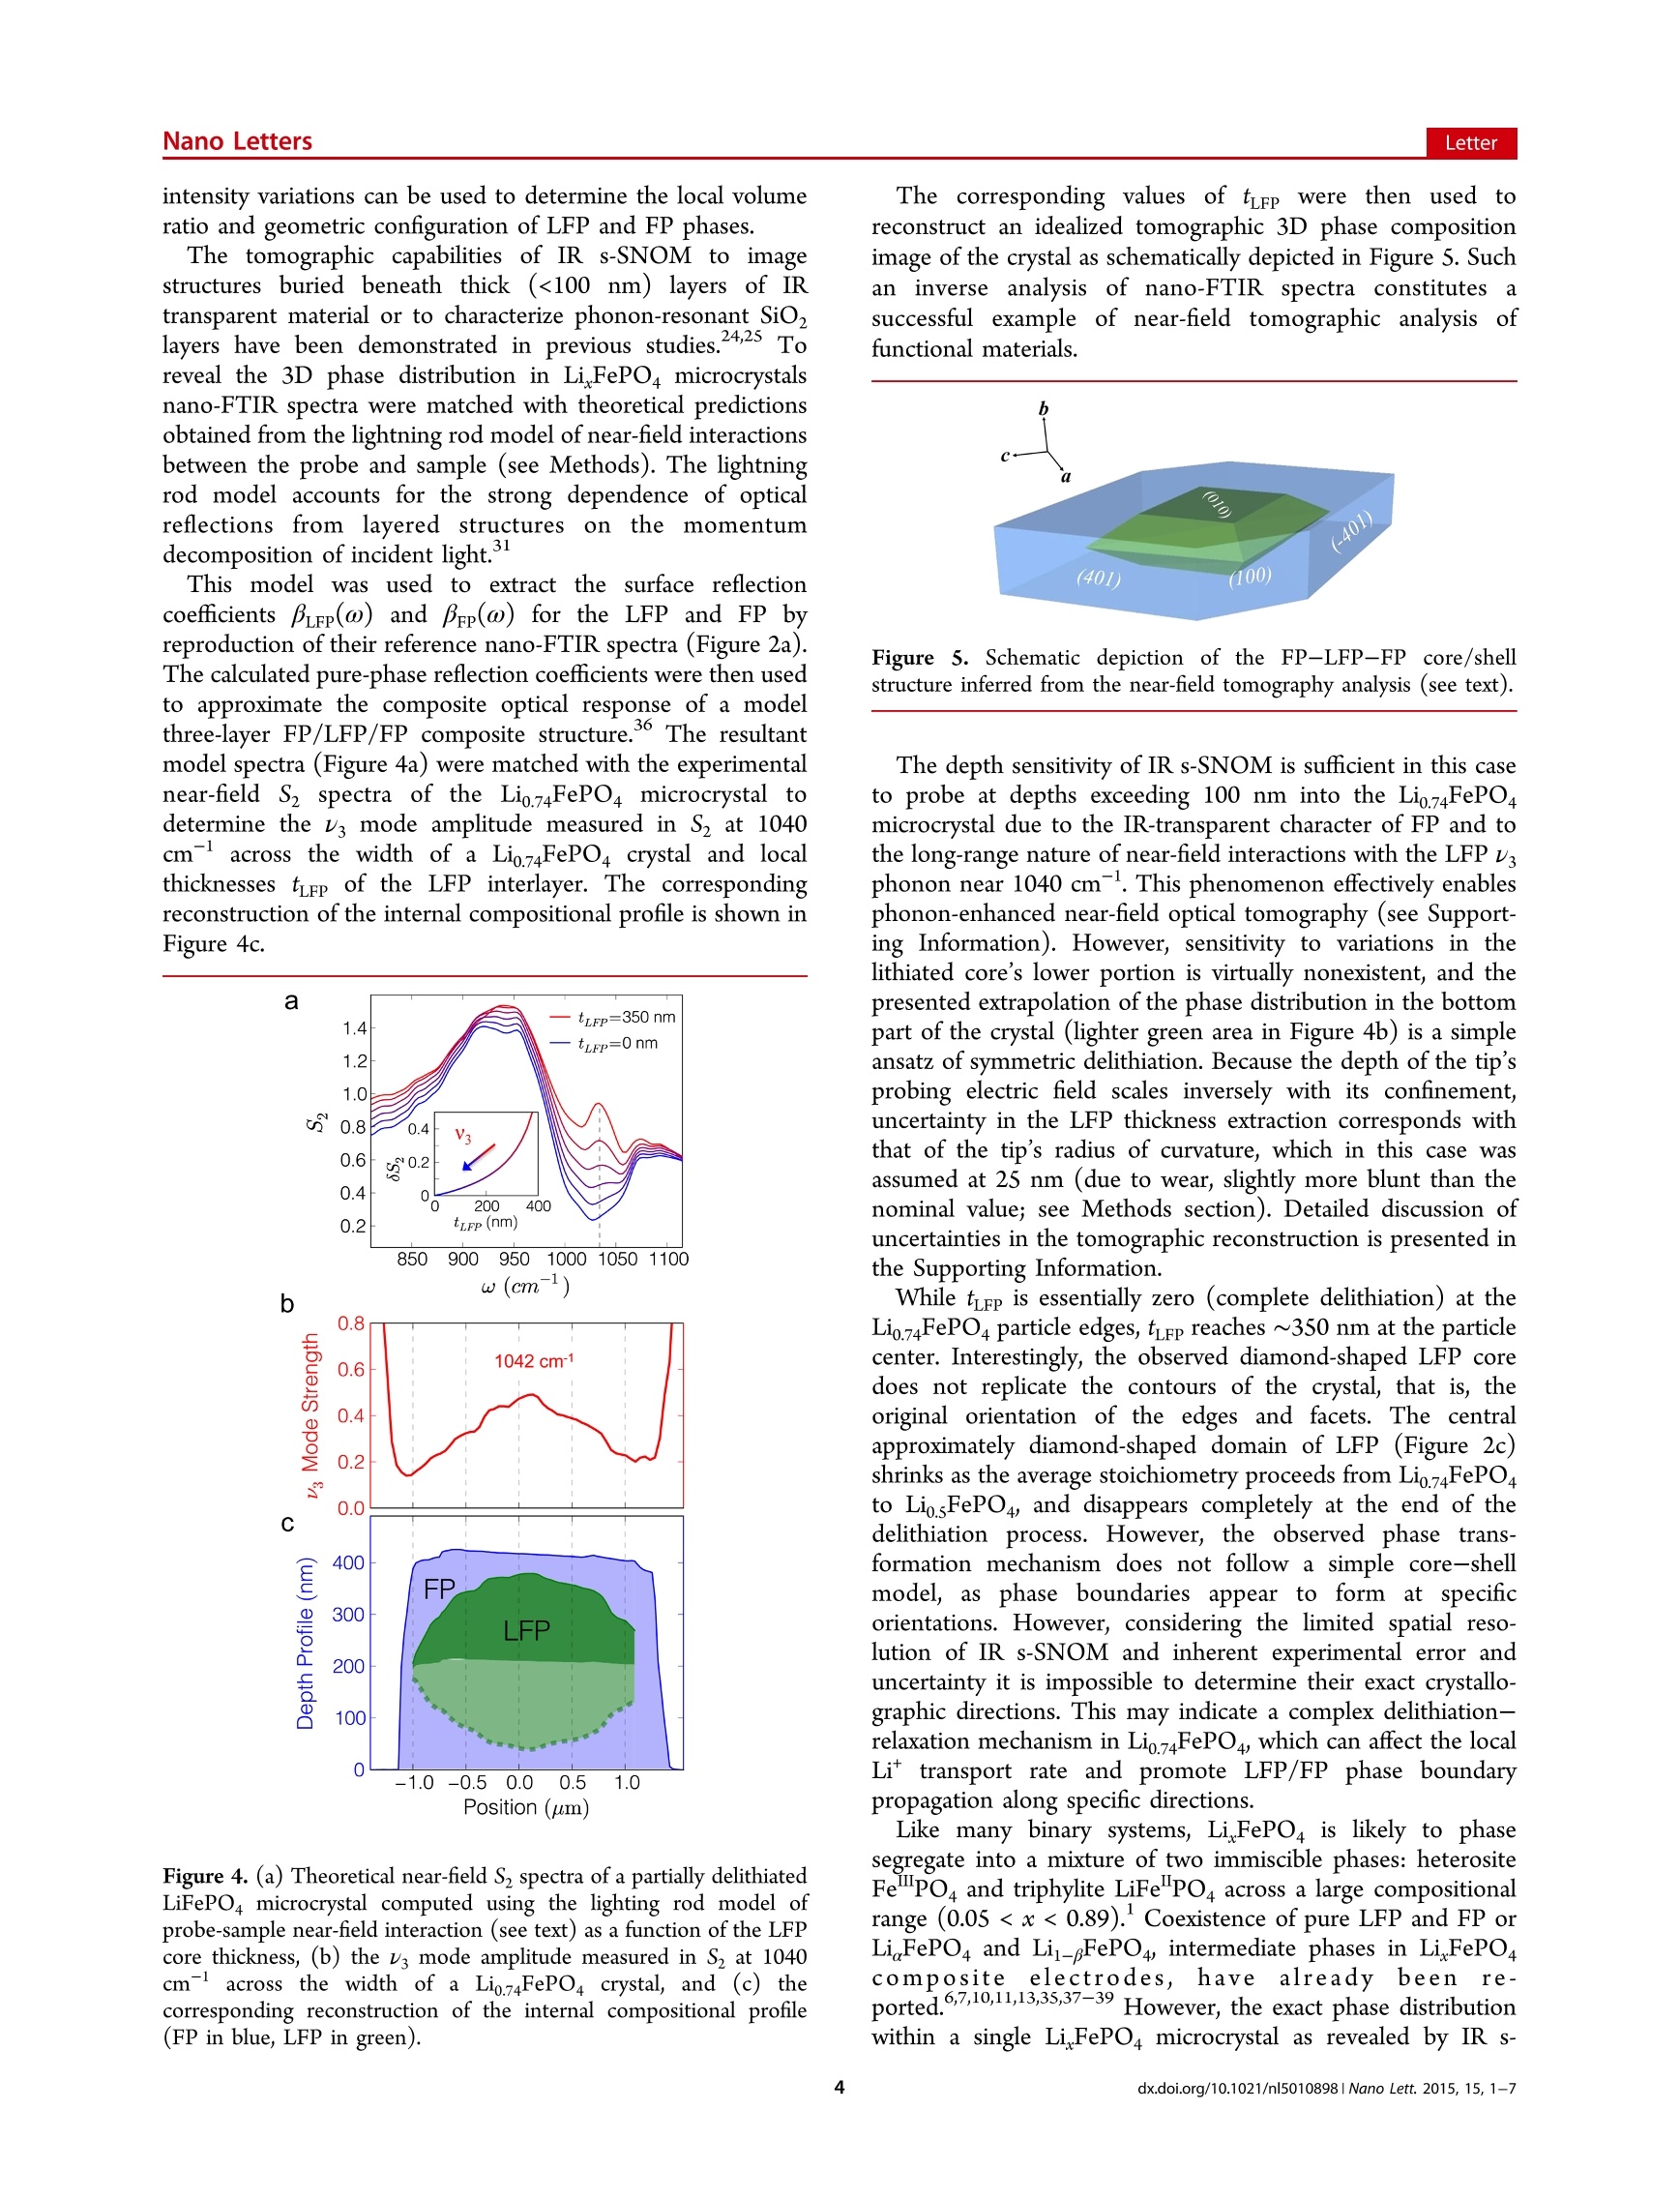
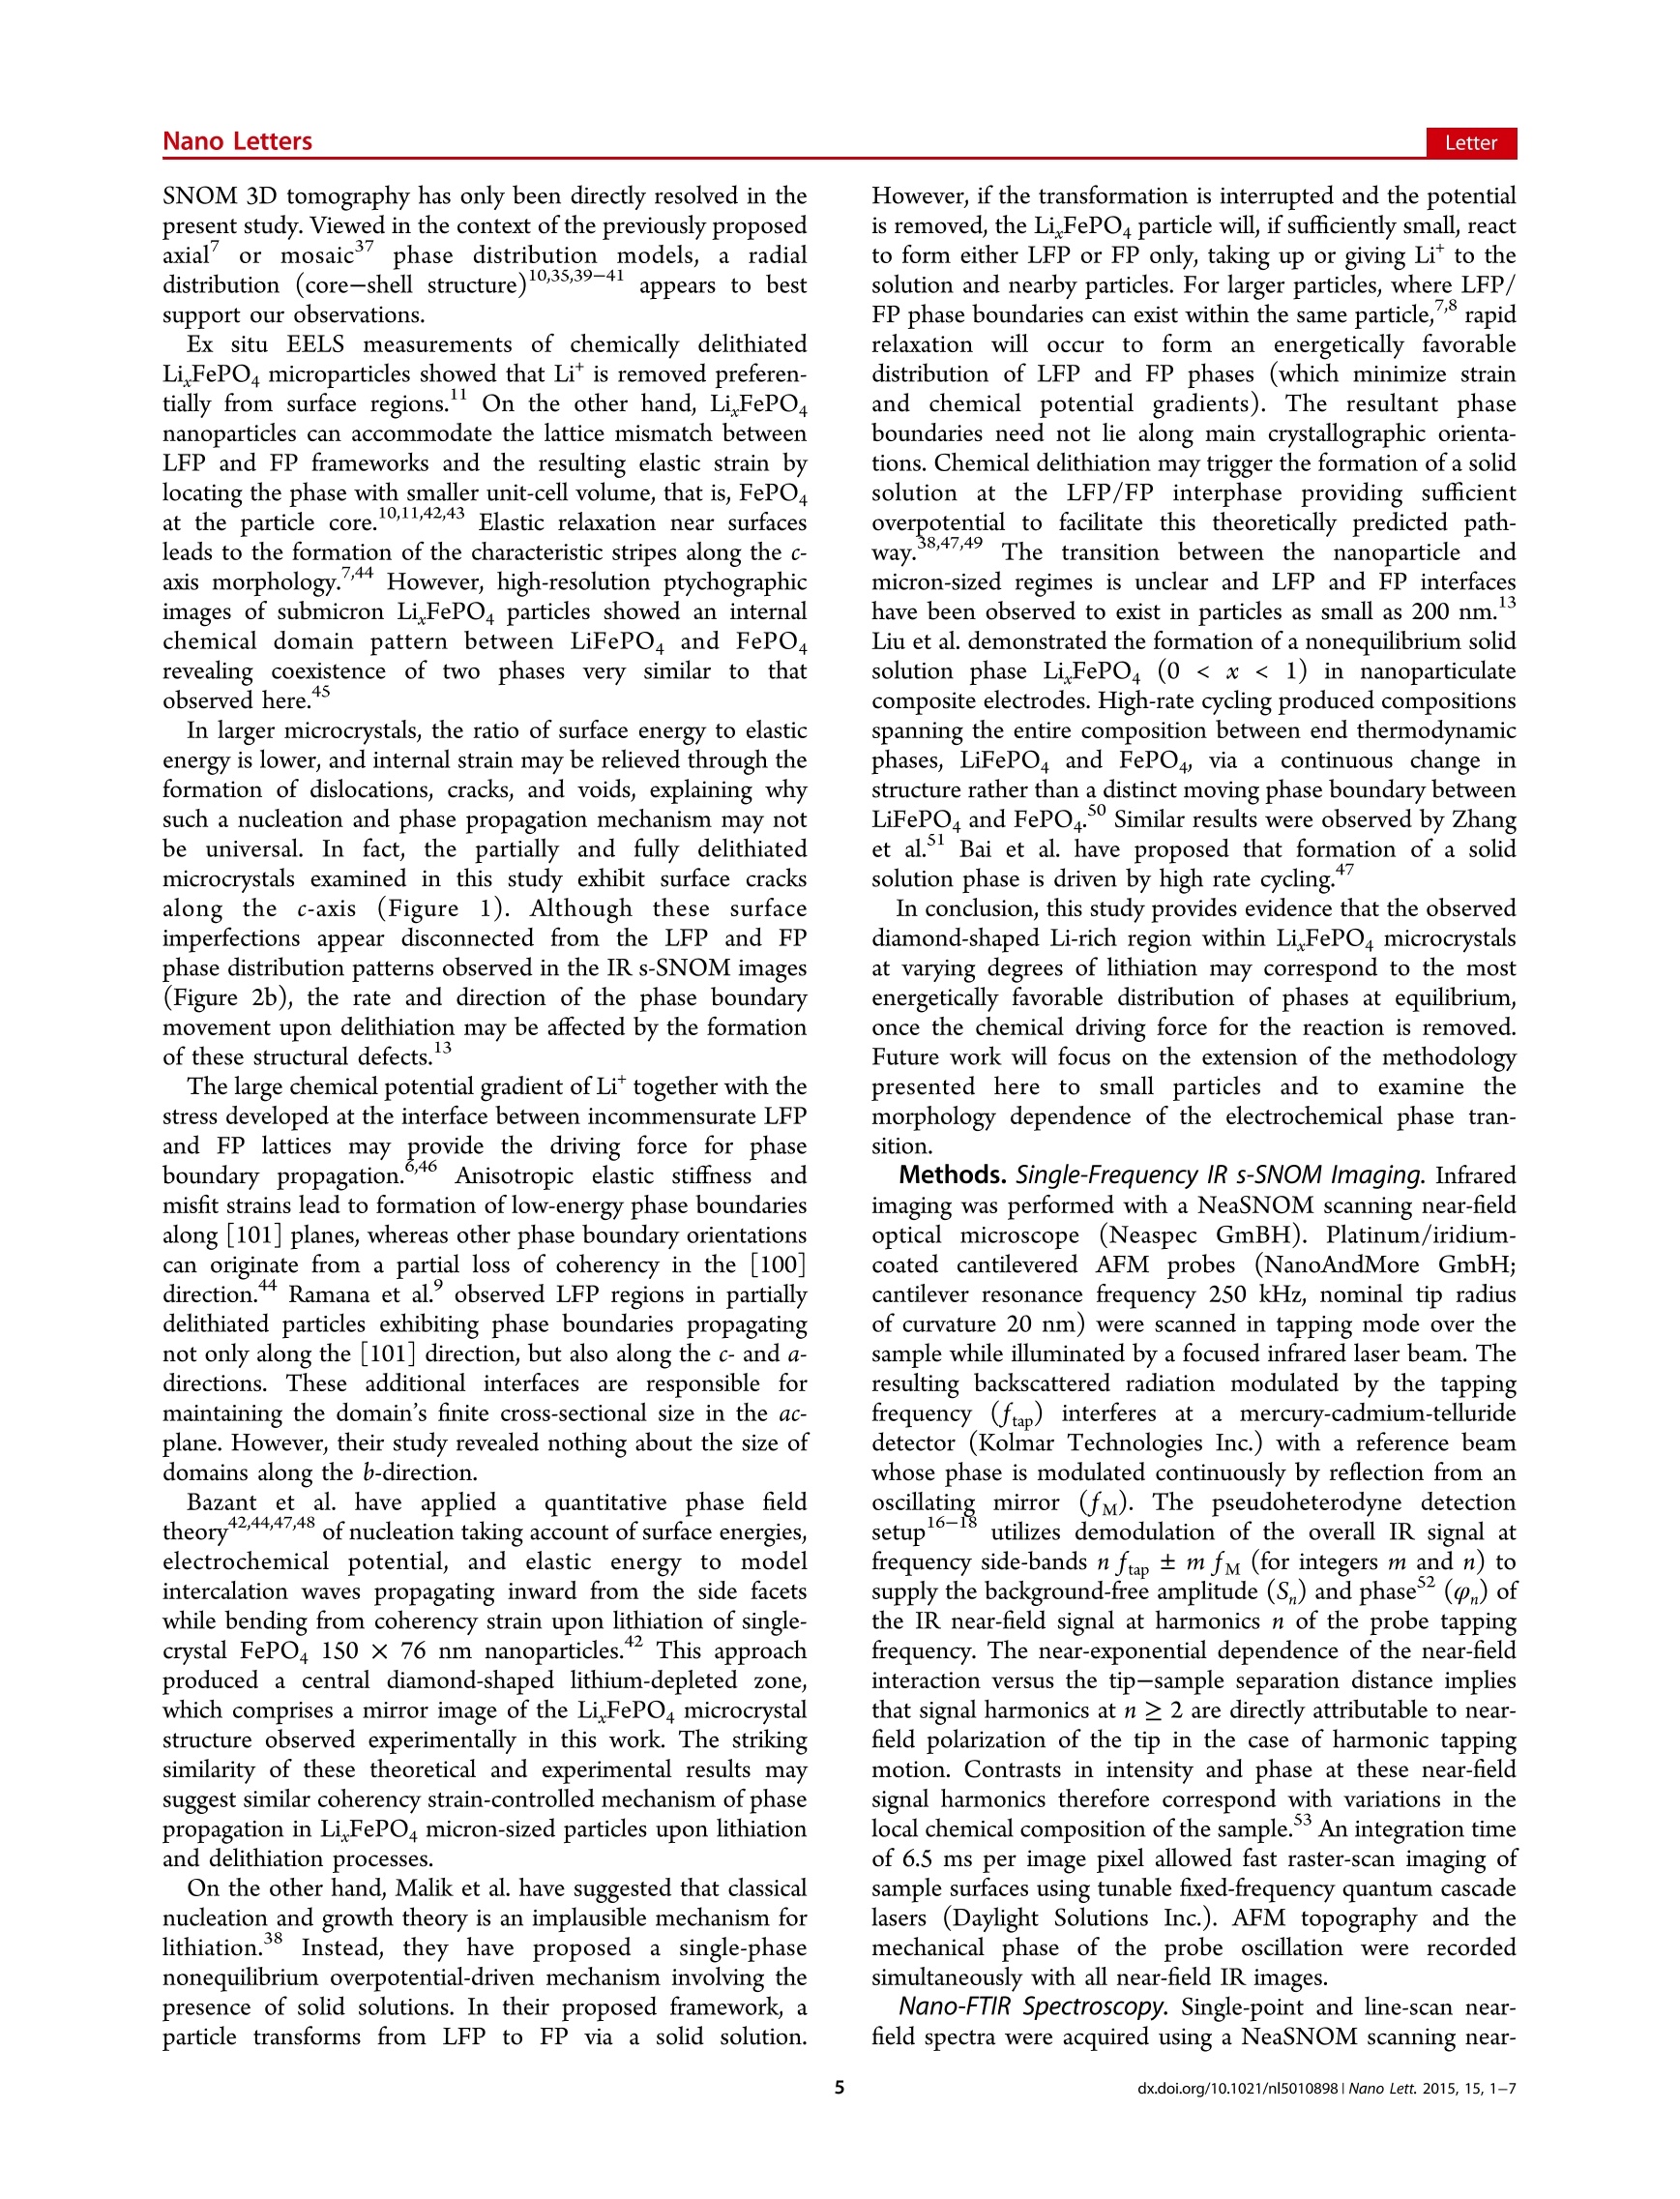
NANO.LETTERSLetterpubs.acs.org/NanoLett Nano LettersLetter IR Near-Field Spectroscopy and Imaging of Single LixFePO4Microcrystals I. T. Lucas, #,1 A. S. McLeod,J. S. Syzdek, D. S. Middlemiss, C. P. Grey,slD. N. Basov,and R. Kostecki* 'Lawrence Berkeley National Laboratory, Berkeley, California 94720, United States *Department of Physics, University of California, San Diego, La Jolla, California 92093, United States SDepartment of Chemistry, University of Cambridge, Cambridge CB2 1EW, United Kingdom "Department of Chemistry, Stony Brook University, Stony Brook, New York 11794-3400, United States "UPMC Univ Paris 06, Sorbonne Universites, UMR 8235, LISE, Paris, F-75252, France Supporting Information ABSTRACT: This study demonstrates the unique capabilityof infrared near-field nanoscopy combined with Fouriertransform infrared spectroscopy to map phase distributionsin microcrystals ofLi FePO4, a positive electrode material forLi-ion batteries. Ex situ nanoscale IR imaging provides directevidence for the coexistence of LiFePO4 and FePO4 phases inpartially delithiated single-crystal microparticles. A quantitativethree-dimensional tomographic reconstruction of the phasedistribution within a single microcrystal provides new insights into the phase transformation and/or relaxation mechanism, revealing a FePO shell surrounding a diamond-shaped LiFePO inner core, gradually shrinking in size and vanishing upondelithiation of the crystal. The observed phase propagation pattern supports recent functional models of LiFePO4 operationrelating electrochemical performance to material design. This work demonstrates the remarkable potential of near-field opticaltechniques for the characterization of electrochemical materials and interfaces. KEYWORDS: IR s-SNOM, LiFePOy phase distribution, Li-ion batteries nfrared apertureless near-field scanning optical microscopy(IR s-SNOM) was applied to resolve the operationalmechanism of LiFePO4 (LFP), a positive electrode materialused in commercially viable Li-ion batteries. Although LFP isknown to convert to FePO4 (FP) at 3.4 V versus Li*/Li via afirst-order phase transition, at least in micron-sized particles,the specific functional mechanism of LiFePO4 (de)lithiationduring battery charge/discharge is still under debate. Toenhance extensive studies conducted on composite electrodes,control experiments on model samples must be carefullydesigned and carriedout to reliably probe chemicalcomposition variations within single Li FePO4 particles withdifferent lithium contents at high spatiall (nanometer)resolution and with adequate chemical specificity. The presentstudy demonstrates the potential of IR s-SNOM’imaging andbroadband nanospectroscopy (nano-FTIR) for chemical andstructural characterization of Li FePO single particles. Most conventional analytical techniques employed to studyfine changes in the local composition of LiFePO4 singleparticles offer limited descriptions of the reaction mechanism,providing sensitivity only to long-range order (X-ray andelectron diffraction, transmission electron mic-9roscopy),-suffering from spectral overlap among elements (electronenergy loss spectroscopy, EELS)10,11 or poor contrast in very thin samples (transmission X-ray microscopy, TXM)1213 withthe concurrent possibility of beam damage from highlyenergetic particles or photons. Vibrational spectroscopiessensitive to lattice vibrations are of particular interest becausethe IR/Raman spectral signatures of LiFePO4, FePO4,and theirmetastable intermediates Lio.34FePO4 and Lio.66FePO4 provideexcellent chemical contrast.14,15’ However, the diffraction-limited spatial resolution of conventionalffar-field opticaltechniques presents a serious barrier to studying the structureand chemical composition of submicrometer specimens used incommercial batteries. IR s-SNOM is still an emerging near-field imaging andspectroscopic technique, both theory and practice undergoingrapid and promising development.Recent technical improve-ments including lock-in detection of the optical signal, effective17,far-field background suppression schemes,17.18 and powerfulquantum cascade or pulsed broadband IR laser lightsources19-21 have enabled local characterization of well-definedorganic and inorganic nanomaterials with high sensitivity andspecificity, and at sub-picosecond temporal resolutions.23 ( R ec e ived: M arch 23, 2014 ) ( Revised: S eptember 25, 2014 ) ( P ubli s hed : N ovember 6, 2014 ) The high spatial resolution afforded by IR s-SNOM isdetermined by the radius of curvature at the atomic forcemicroscopy (AFM) tip apex (<30 nm), independent of thefree-space wavelength of the illuminating light. The techniqueoperates through extreme polarization sensitivity of a sharpconductive probe to the optical properties of a samplingvolume near the probe apex. Upon illumination, the electricallypolarized probe tip generates a spatially extended evanescentnear-field, which can penetrate a few tens of nanometers deepinto IR-transparent samples.24,25 The tip-enhanced near-fieldcouples locally to resonant phonon modes of the sample andenables detection of subsurface objects, provided that they arelocated within the subwavelength sampling volume of the near-field probe. The structural and compositional specificity of IRnear-field spectroscopy is analogous to far-field vibrationalspectroscopies.2 LiFePO4 single microcrystals (4×2×0.4 um along the c, a,and b directions, respectively) exhibiting hexagonal plateletgeometry were selected for ex situ IR s-SNOM studies. Figure1 shows SEM micrographs of representative LiFePO and Figure 1. Scanning electron micrographs of single LiFePO4,LiosFePO4, and FePO4 microcrystals, revealing cracks along thecrystal surface after delithiation. chemically delithiated single crystals with average compositionsof LisFePO4 and FePO4. Near-field nano-FTIR (nano-scaleFourier transform infrared) spectra were acquired from singleFP and LFP particles and compared with conventional far-fieldFTIR transmission spectra of the same batch of crystals (seeSupporting Information)1S,26,2 The second harmonic amplitude S. (see Methods) nano-FTIR spectra (Figure 2a) reveal strong surface phonon modesat 950-1150 cm- attributable to intramolecular symmetric(u) and asymmetric (u3) stretching vibrations of the PO4anions, which are also clearly resolved in far-field FTIRspectra.However, the signature peaks of these phonon modesappear sharpened and red shifted in the near-field spectra ascompared with their far-field counterparts.28-31 The observednear-field resonance effect results in a backscattering responsethat is highly sensitive to phonon oscillator strengths, inducing 1.4 a 1.2 v. 1.0 0.8 0.6 0.4 FePO, 9.2 LiFePO _ Si ref. 850 900 950 1000 10501100 ω (cm-) Topography 1042 cm- LiFePO4 Figure 2. (a) Nano-FTIR Sz spectra (2nd harmonic amplitude of thebackscattered field) of pure-phase LiFePO and FePO4 microcrystalswith symmetric (vi) and antisymmetric (v3) vibrational modesindicated (comparison with far-field FTIR transmission spectra ispresented in Supporting Information); a typical 100% line acquiredfrom the silicon substrate and used for reference is also shown (Si ref.)(b) AFM topography and corresponding infrared near-field amplitudeS4 (4th harmonic) images acquired at 1087, 1042, and 962 cmforLiFePO4, LiosFePO4, and FePO4 crystals; (c) S4 images highlightingthe phase distribution and propagation of lithiated/delithiated phasesin LiFePO4, Lio.74FePO4, LiosFePO4, and FePO4 crystals. strong contrasts in spectral intensity between adjacent modes.LFP and FP share several surface phonon modes in the 950-1150 cmspectral range. However, the nano-FTIR spectrumof LFP exclusively exhibits a strong phonon mode near 1042cm- that corresponds to the asymmetric (v3) stretch of thePO-anion. DFT calculations attribute the increased oscillatorstrength and frequency red shift of the us mode in LFP ascompared with FP to a redistribution of electron densitybetween the P-Oi and P-Oz bonds within the symmetry-distinct oxygen sublattices of the PO4 anions (see SupportingInformation).32,33 IR s-SNOM imaging of LiFePO4 and partially and fullydelithiated LiFePO4 (x=1, 0.5 and 0.0) microcrystals wasrealized with the fourth harmonic amplitude S4 signal at threedistinct IR excitation frequencies, 962, 1042, and 1087 cm Figure 3. (a) Position-resolved nano-FTIR Sz spectra acquired along the surface of two pure-phase microcrystals and (b) along a partially delithiatedLio.74FePO4 crystal (color scale identical to that in Figure 2b). An AFM topography image (false color height) displays the Lio.74FePO4 crystal andlocation of the nano-FTIR line-scan. provided by a tunable quantum cascade laser (Figure 2b). Theobserved S4 image contrasts are associated with differentphonon coupling efficiencies in LFP and FP at the givenexcitation frequencies and correspond to variations of localcrystal structure and/or composition. The sudden drop ofsignal at the particle boundary originates from loss of tip-sample coupling at the steep crystal edges. The IR s-SNOM images collected at 962cmdisplay poorLFP/FP/silicon substrate contrast due to their comparable Sasignal intensity at this frequency. On the other hand, the imagesof partially delithiated LiosFePO4 at 1042 and 1087 cmreveala diamond-shaped region in the middle of the crystal, whichwas also observed in the corresponding near-field phase images(see Supporting Information, Figure S3). AFM topographyimages show no indication that the observed chemical contrastcould originate from variations in surface morphology.Interestingly, reverse optical contrast observed in the imagesof Lio.sFePO4 crystals at 1042 and 1087 cm-1reveals strongcoupling to the us phonon mode in LFP and FP, respectively(Figure 2a). The observed shrinking of the central diamond-shapedregion in another delithiated crystal with higher lithiumcontent, Lio.74FePO4 versus LisFePO4 (Figure 2c), indicatesa progressive evolution of an outer FP-rich region at theexpense of the inner LFP-core upon delithiation. Thecontinuous and monotonic variation in observable fill fractionsof putative LFP and FP phases as a function of Li contentfurther supports the respective identification of inner and outerregions in LiFePO4 particles with Li-rich and Li-poor regions,respectively. These observations provide direct evidence for thecoexistence of LFP and FP phases within individual Li FePOmicrocrystals, as previously inferred from two-dimensional(2D) chemical mapping of thin single crystal particlesusing scanning and full-field transmission X-ray microscopy coupledto absorption near edge spectroscopy (STXM- and FF TXM-XANES). A series of nano-FTIR spectra acquired across the a-csurface of pure-phase LFP and FP crystals (Figure 3a) appearconsistent with the reference spectra displayed in Figure 2a.Remarkably, the scan across the partially delithiated Lio.74FePO4crystal (Figure 3b) displays spectral patterns characteristic of anouter Li-depleted zone and a Li-rich region near the crystalcenter. However, the Li0.74FePO4 spectra do not replicateexactly the reference nano-FTIR spectra for pure-phase LFP orFP (Figure 2a) except for the locations close to the edges of thecrystal, which exhibit characteristics of pure FP. The relative IR near-field intensity of the us mode isnoticeably smaller throughout Lio.74FePO4 as compared withpure LFP, yet its frequency remains fairly constant at 1042±5cm. This observation appears inconsistent with the presenceof a stable homogeneous solid solution,4,8,34,3Sat anintermediate state of delithiation. To test this hypothesis, amember of the solid solution LiFePO4 with compositionLio.6FePO4 was investigated by conventional FTIR spectrosco-py (see Supporting Information, Figure S2). A continuous shiftof the V3 mode in the far-field FTIR spectrum of Li FePO4 isrealized for such a solid solution, varying with the mean Feoxidation state, rather than a superposition of the LFP and FPus mode characteristics. Therefore, solid solution phases areeither completely absent in the Li FePO4 microcrystalsexamined by nano-FTIR or their local concentration is belowthe detection limit of the IR near-field probe. On the other hand, the decrease in near-field signal intensityof the l mode at 1042 cmin the Lio.74FePO4 crystal center isascribed to the presence of the LiFePO4 inner core buriedunder a FePO4 outer layer. Thus, the observed u3 mode intensity variations can be used to determine the local volumeratio and geometric configuration of LFP and FP phases. The tomographic capabilities of IR s-SNOM to imagestructures buried beneath thick (<100 nm) layers of IRtransparent material or to characterize phonon-resonant SiO,layers have been demonstrated in previous studies.24,25 Toreveal the 3D phase distribution in Li FePO4 microcrystalsnano-FTIR spectra were matched with theoretical predictionsobtained from the lightning rod model of near-field interactionsbetween the probe and sample (see Methods). The lightningrod model accounts for the strong dependence of opticalreflections from layered structures on the momentumdecomposition of incident light.31 This model was used to extract the surface reflectioncoefficients BLrp(ω) and prp(ω) for the LFP and FP byreproduction of their reference nano-FTIR spectra (Figure 2a).The calculated pure-phase reflection coefficients were then usedto approximate the composite optical response of a modelthree-layer FP/LFP/FP composite structure.6 The resultantmodel spectra (Figure 4a) were matched with the experimentalnear-field S spectra of the Lio.74FePO4 microcrystal todetermine the us mode amplitude measured in Sz at 1040cm- across the width of a Lio.74FePO4 crystal and localthicknesses tp of the LFP interlayer. The correspondingreconstruction of the internal compositional profile is shown inFigure 4c. Figure 4. (a) Theoretical near-field S, spectra of a partially delithiatedLiFePO4 microcrystal computed using the lighting rod model ofprobe-sample near-field interaction (see text) as a function of the LFPcore thickness, (b) the Us mode amplitude measured in S, at 1040cm across the width of a Lio74FePO crystal, and (c) thecorresponding reconstruction of the internal compositional profile(FP in blue, LFP in green). The corresponding values of tup were then usedi toreconstruct an idealized tomographic 3D phase compositionimage of the crystal as schematically depicted in Figure 5. Suchaninverse analysis of nano-FTIR spectra constitutes asuccessful example of near-field tomographic analysiss offunctional materials. Figure 5. Schematic depiction of the FP-LFP-FP core/shellstructure inferred from the near-field tomography analysis (seetext). The depth sensitivity of IR s-SNOM is sufficient in this caseto probe at depths exceeding 100 nm into the Lio.74FePOmicrocrystal due to the IR-transparent character of FP and tothe long-range nature of near-field interactions with the LFPusphonon near 1040 cm. This phenomenon effectively enablesphonon-enhanced near-field optical tomography (see Support-ing Information). However, sensitivity to variations in thelithiated core’s lower portion is virtually nonexistent, and thepresented extrapolation of the phase distribution in the bottompart of the crystal (lighter green area in Figure 4b) is a simpleansatz of symmetric delithiation. Because the depth of the tip’sprobing electric field scales inversely with its confinement,uncertainty in the LFP thickness extraction corresponds withthat of the tip’s radius of curvature, which in this case wasassumed at 25 nm (due to wear, slightly more blunt than thenominal value; see Methods section). Detailed discussion ofuncertainties in the tomographic reconstruction is presented inthe Supporting Information. While turp is essentially zero (complete delithiation) at theLio.74FePO4 particle edges, turp reaches ~350 nm at the particlecenter. Interestingly, the observed diamond-shaped LFP coredoes not replicate the contours of the crystal, that is, theoriginal orientation of the edges and facets. The centralapproximately diamond-shaped domain of LFP (Figure 2c)shrinks as the average stoichiometry proceeds from Lio.74FePO4to Lio.sFePO4, and disappears completely at the end of thedelithiation process. However, the observed phase trans-formation mechanism does not follow a simple core-shellmodel, as phase boundaries appear to form at specificorientations. However, considering the limited spatial reso-lution of IR s-SNOM and inherent experimental error anduncertainty it is impossible to determine their exact crystallo-graphic directions. This may indicate a complex delithiation-relaxation mechanism in Lio.74FePO4, which can affect the localLit transport rate and promote LFP/FP phase boundarypropagation along specific directions. Like many binary systems, Li FePO4 is likely to phasesegregate into a mixture of two immiscible phases: heterositeFe PO4 and triphylite LiFe"PO4 across a large compositionalrange (0.05参考文献:IR Near-Field Spectroscopy and Imaging of Single LixFePO4 MicrocrystalsI. T. Lucas, A. S. McLeod, J. S. Syzdek, D. S. Middlemiss, C. P. Grey, D. N. Basov, and R. KosteckiNano Letters 2015 15 (1), 1-7DOI: 10.1021/nl5010898
确定
还剩5页未读,是否继续阅读?

产品配置单

QUANTUM量子科学仪器贸易(北京)有限公司为您提供《磷酸铁锂材料中充放电过程的相位分布检测方案(红外光谱仪)》,该方案主要用于锂电池中充放电过程的相位分布检测,参考标准--,《磷酸铁锂材料中充放电过程的相位分布检测方案(红外光谱仪)》用到的仪器有德国Neaspec纳米傅里叶红外光谱仪nano-FTIR
推荐专场

相关方案
更多
该厂商其他方案
更多