


In general, Raman allows the in situ characterization of microbatteries through an observation window. This will enable correlations between battery performance and molecular/crystallinity changes. In addition, the capabilities of current Raman microscopes,
which include
fast mapping and high throughput to follow the rapid ion diffusion and migration.
high spatial resolution to discriminate down to ~1µm volumes in the transparent electrolyte.
will make characterization of microbatteries quite feasible with a Raman microscope.
方案详情

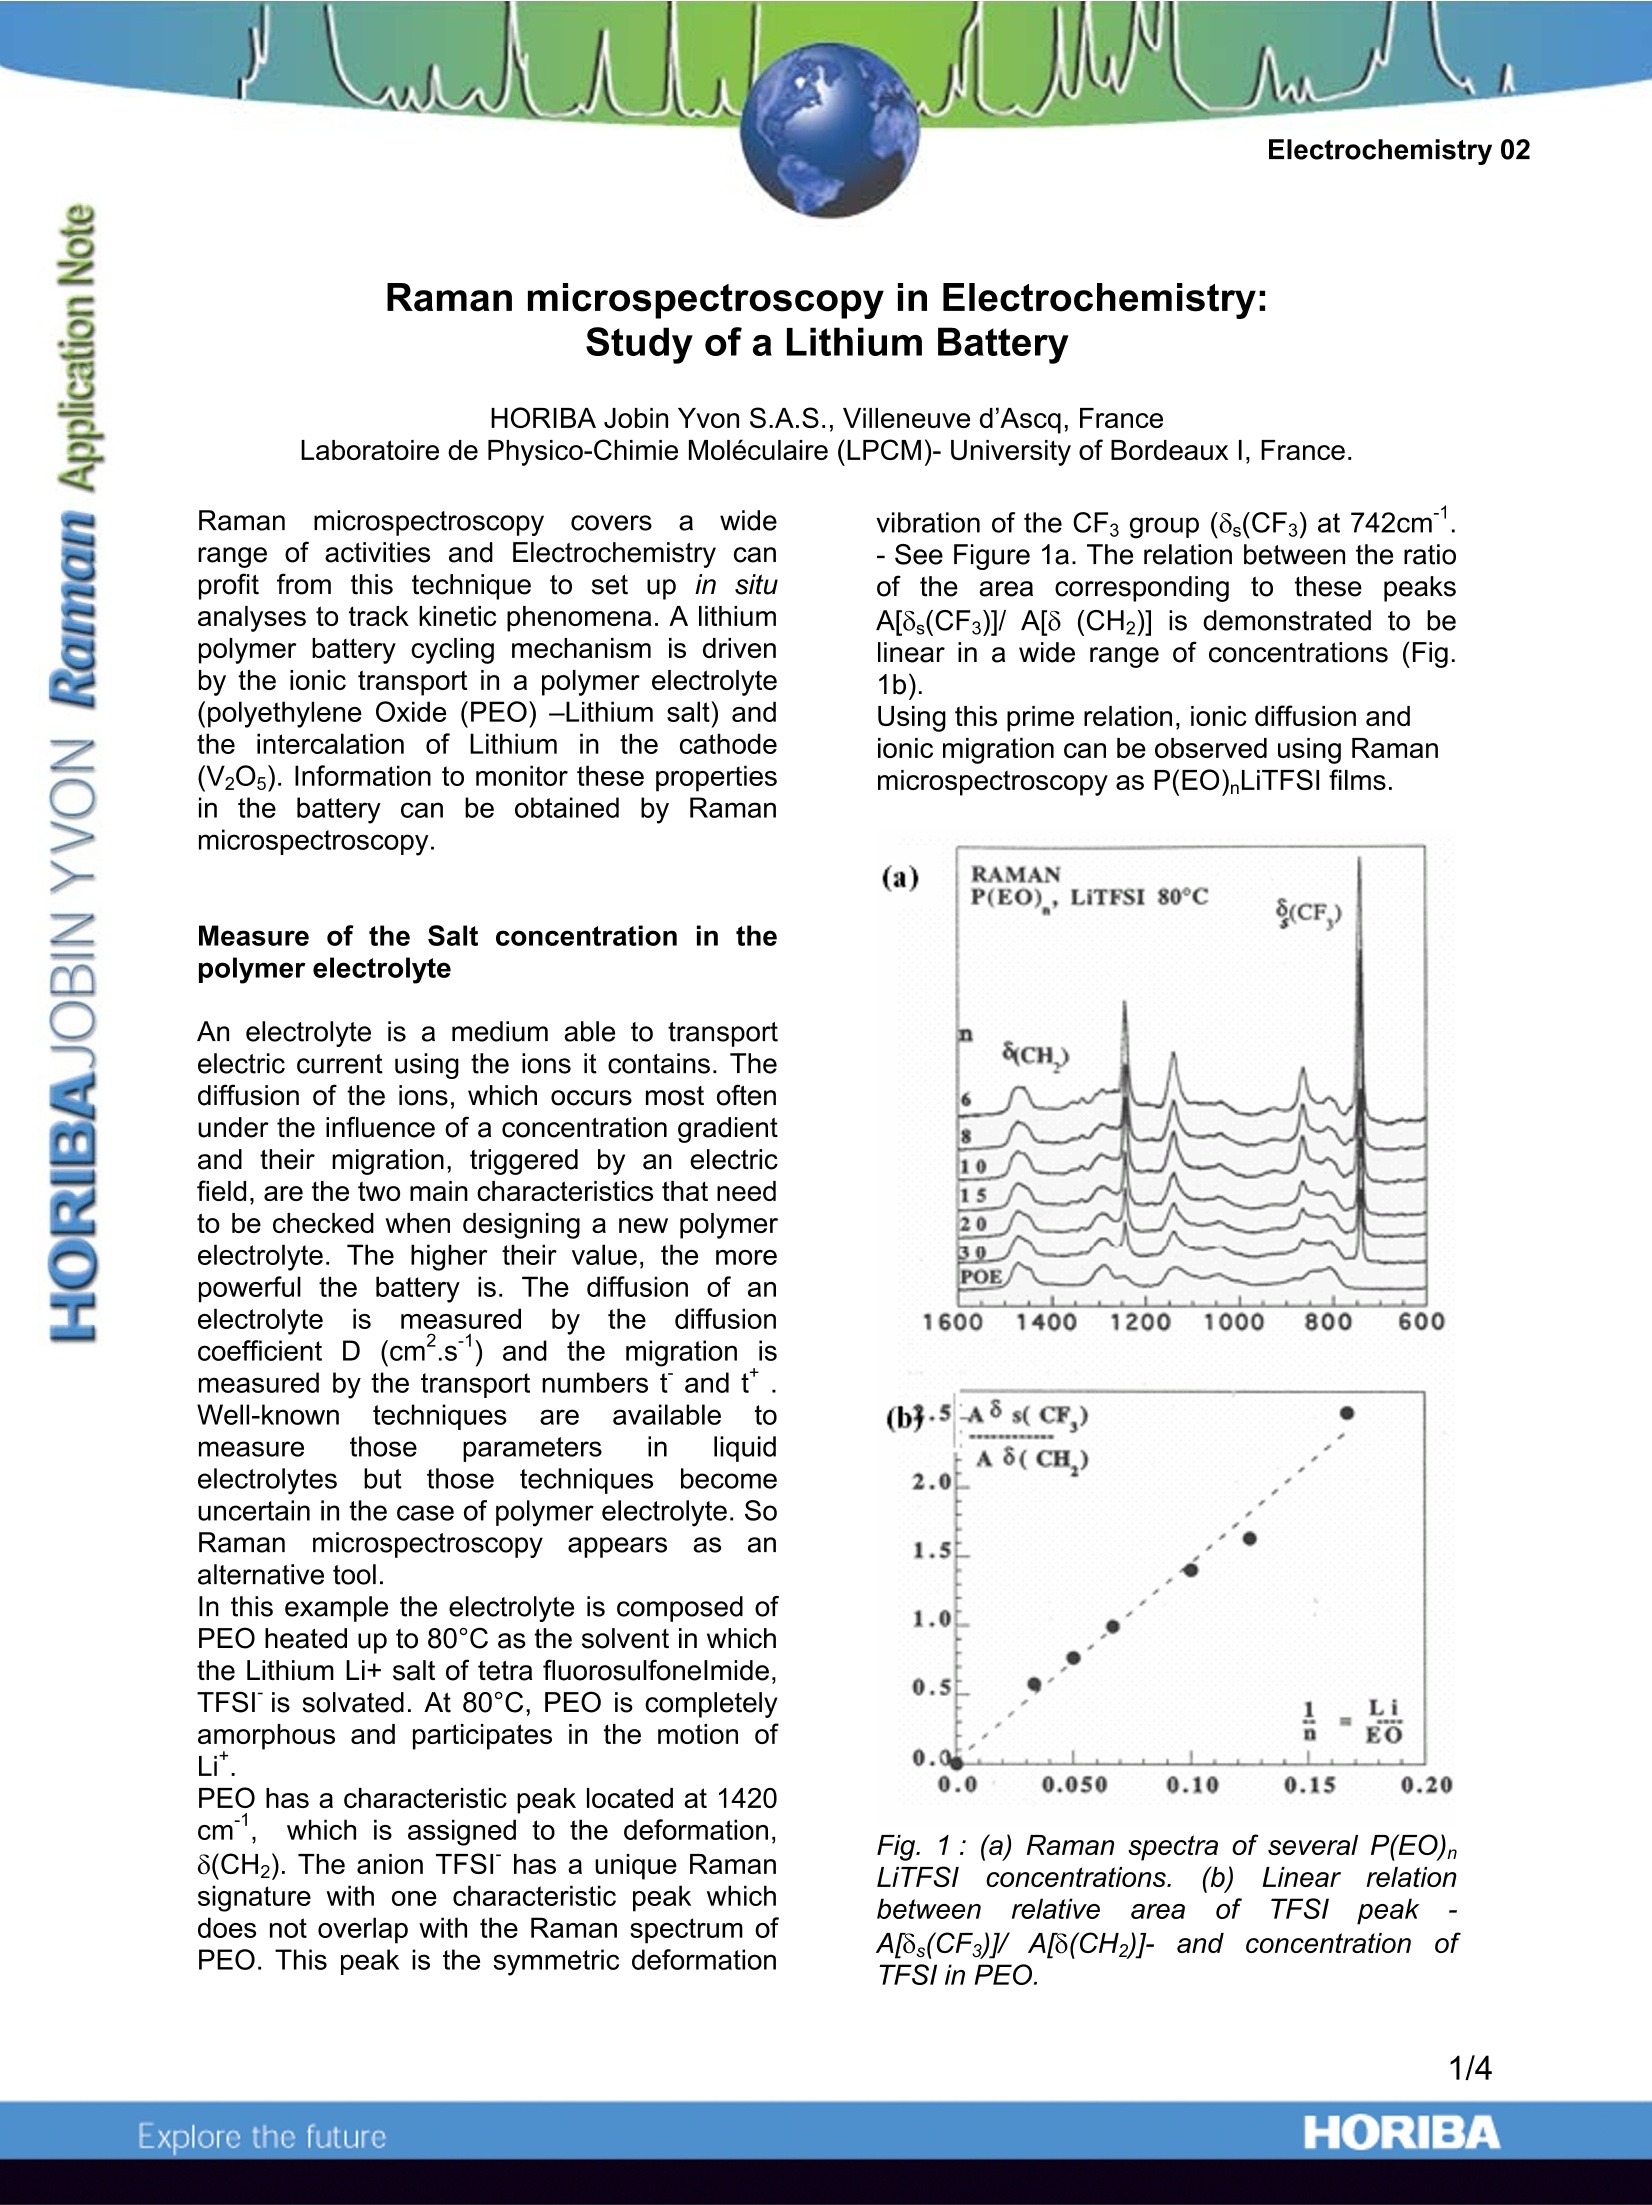
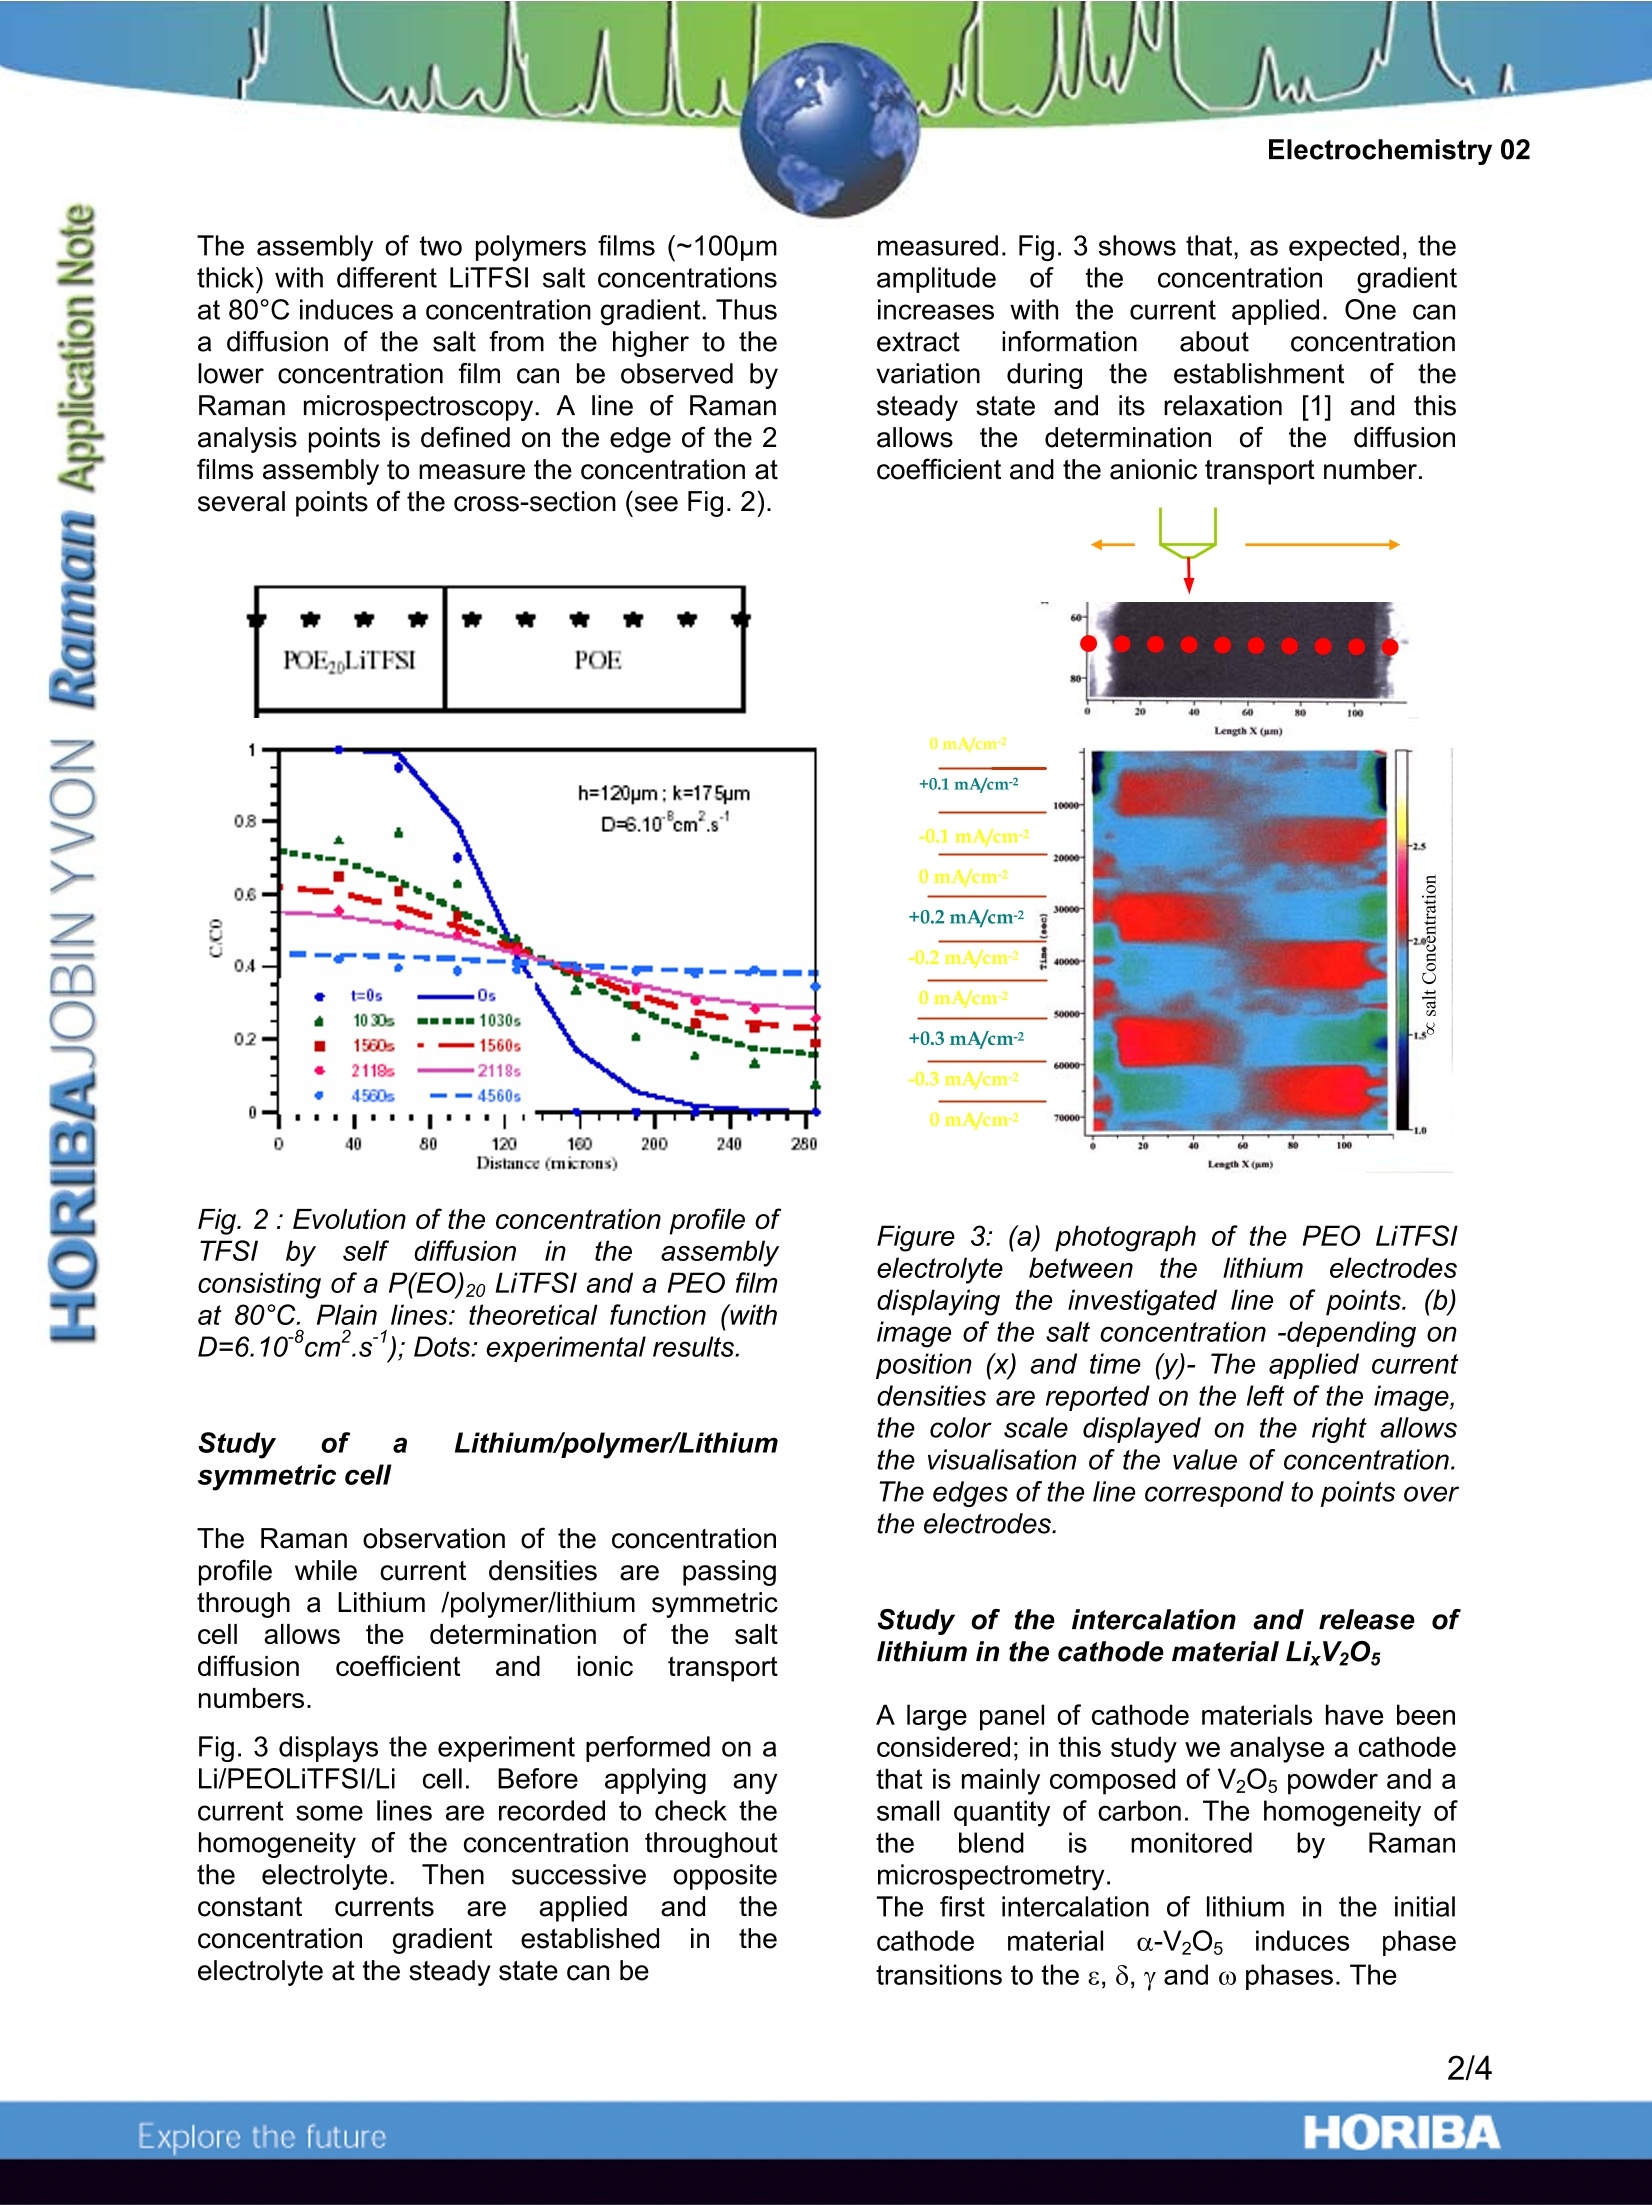
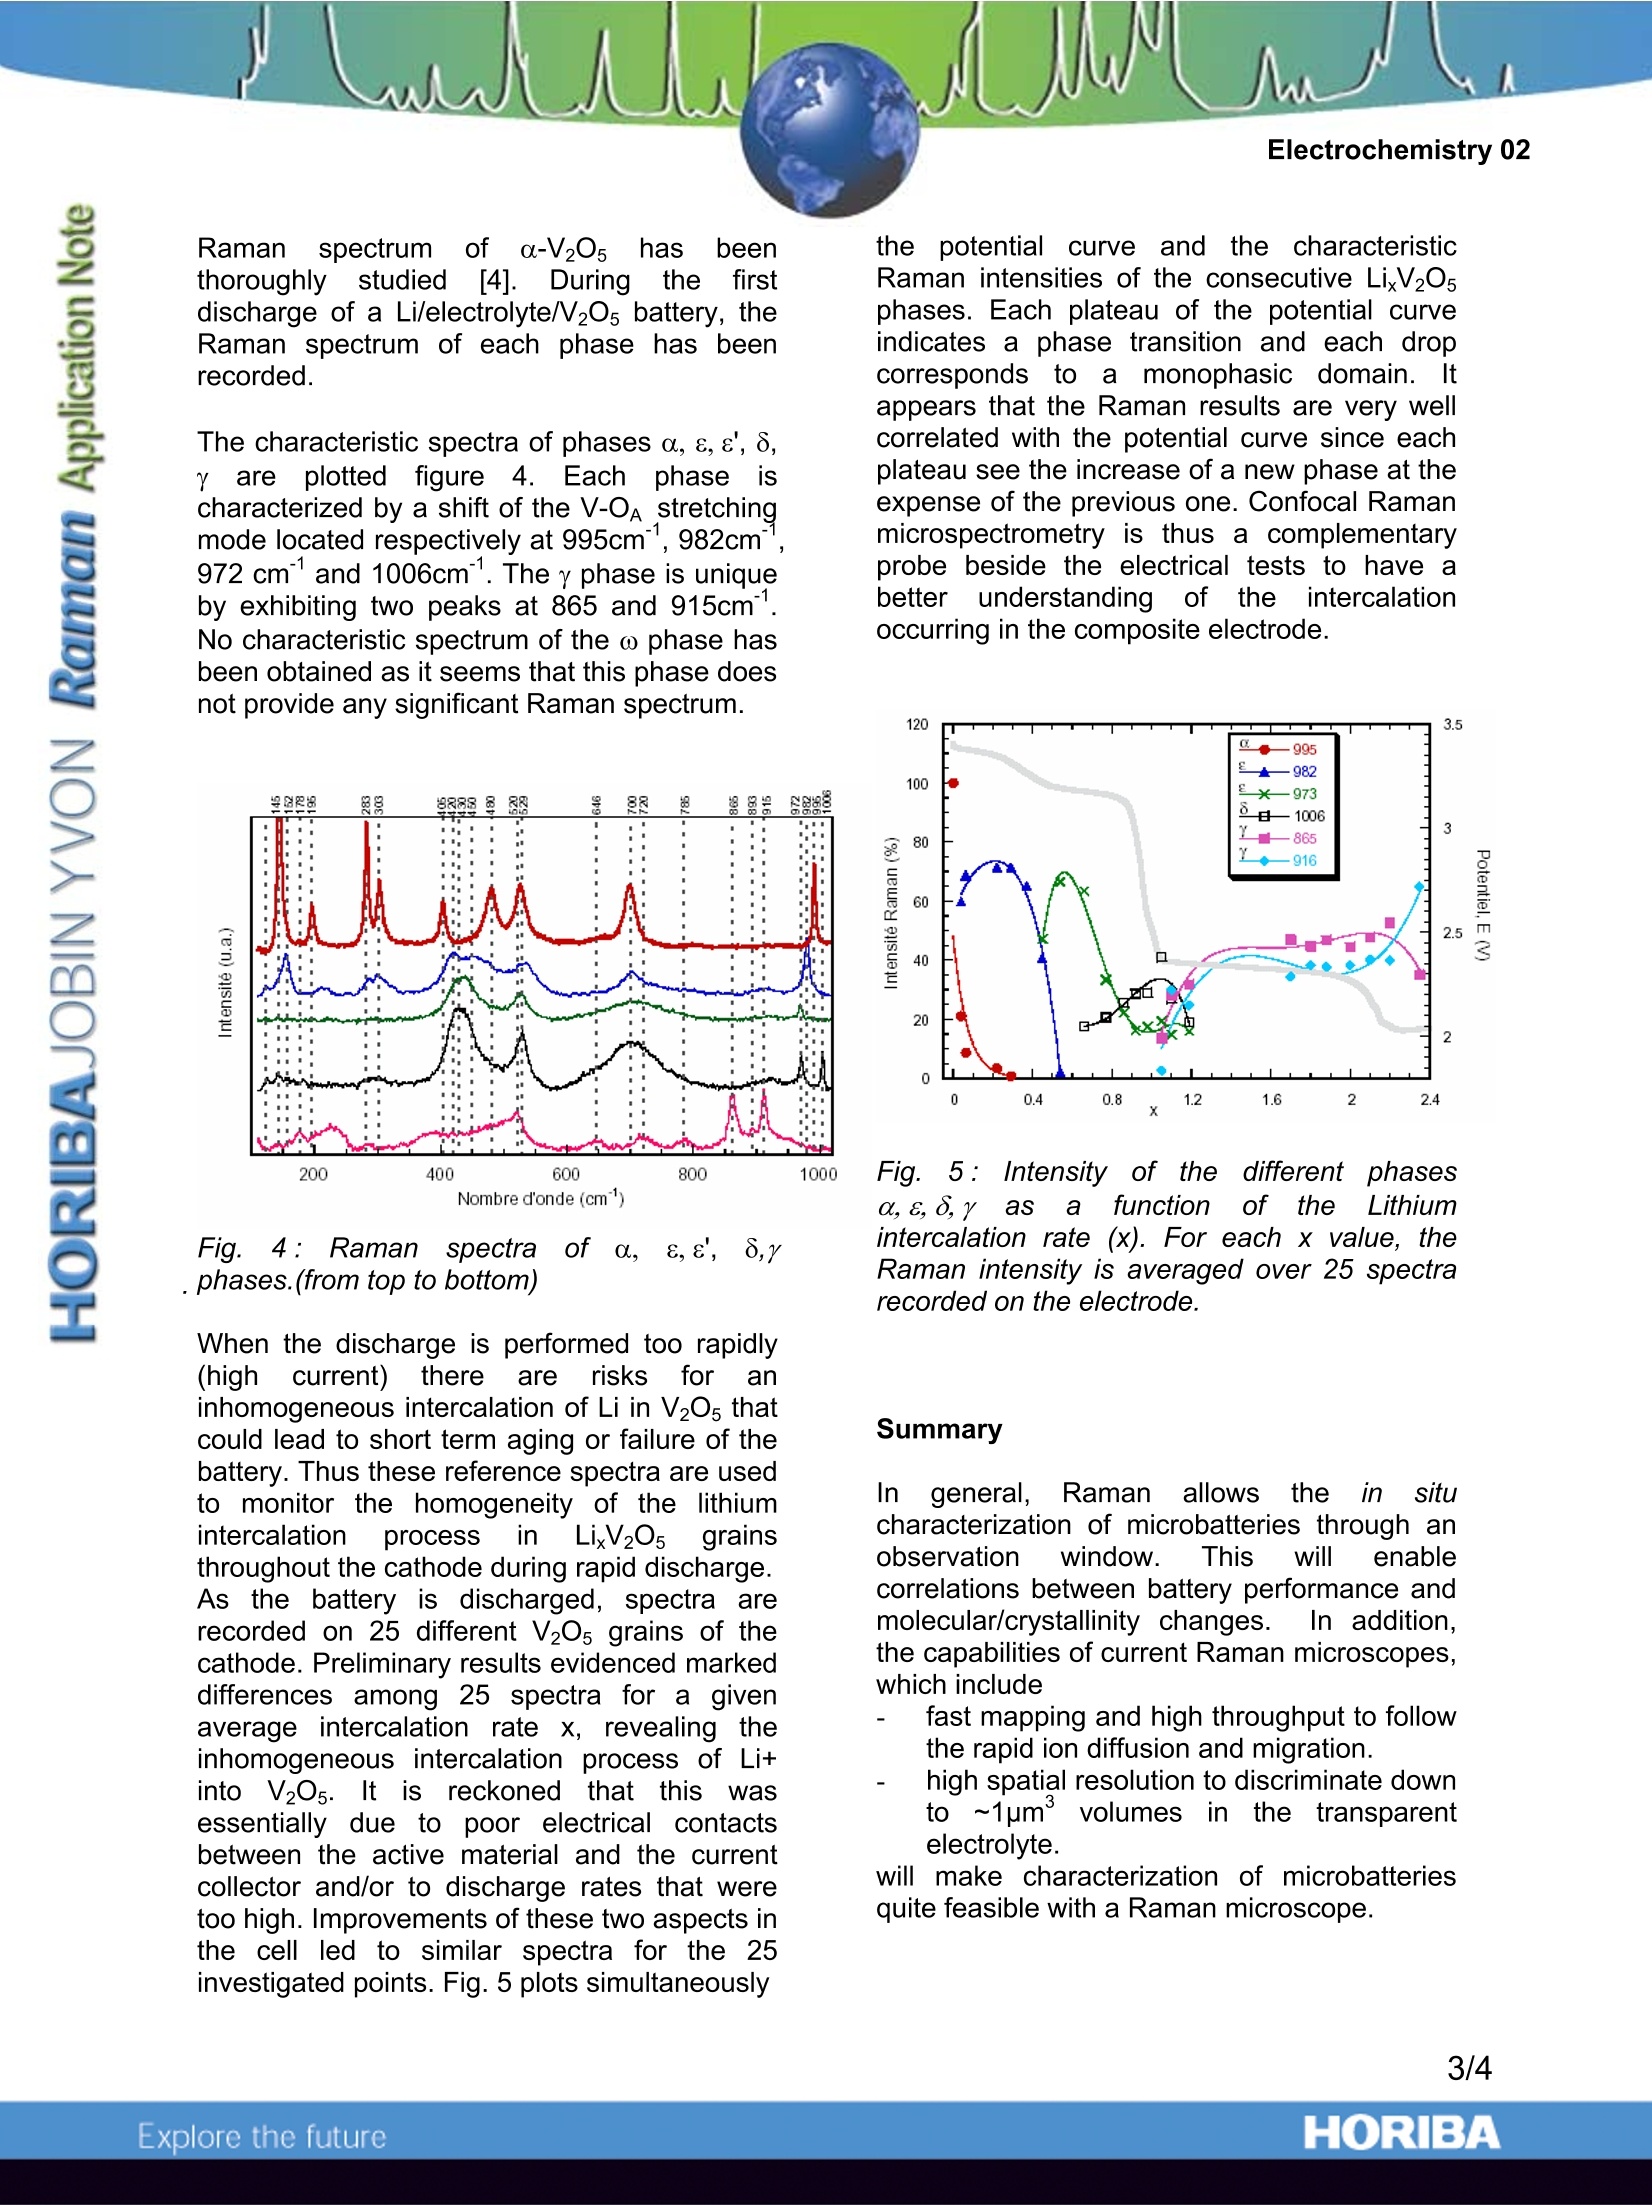
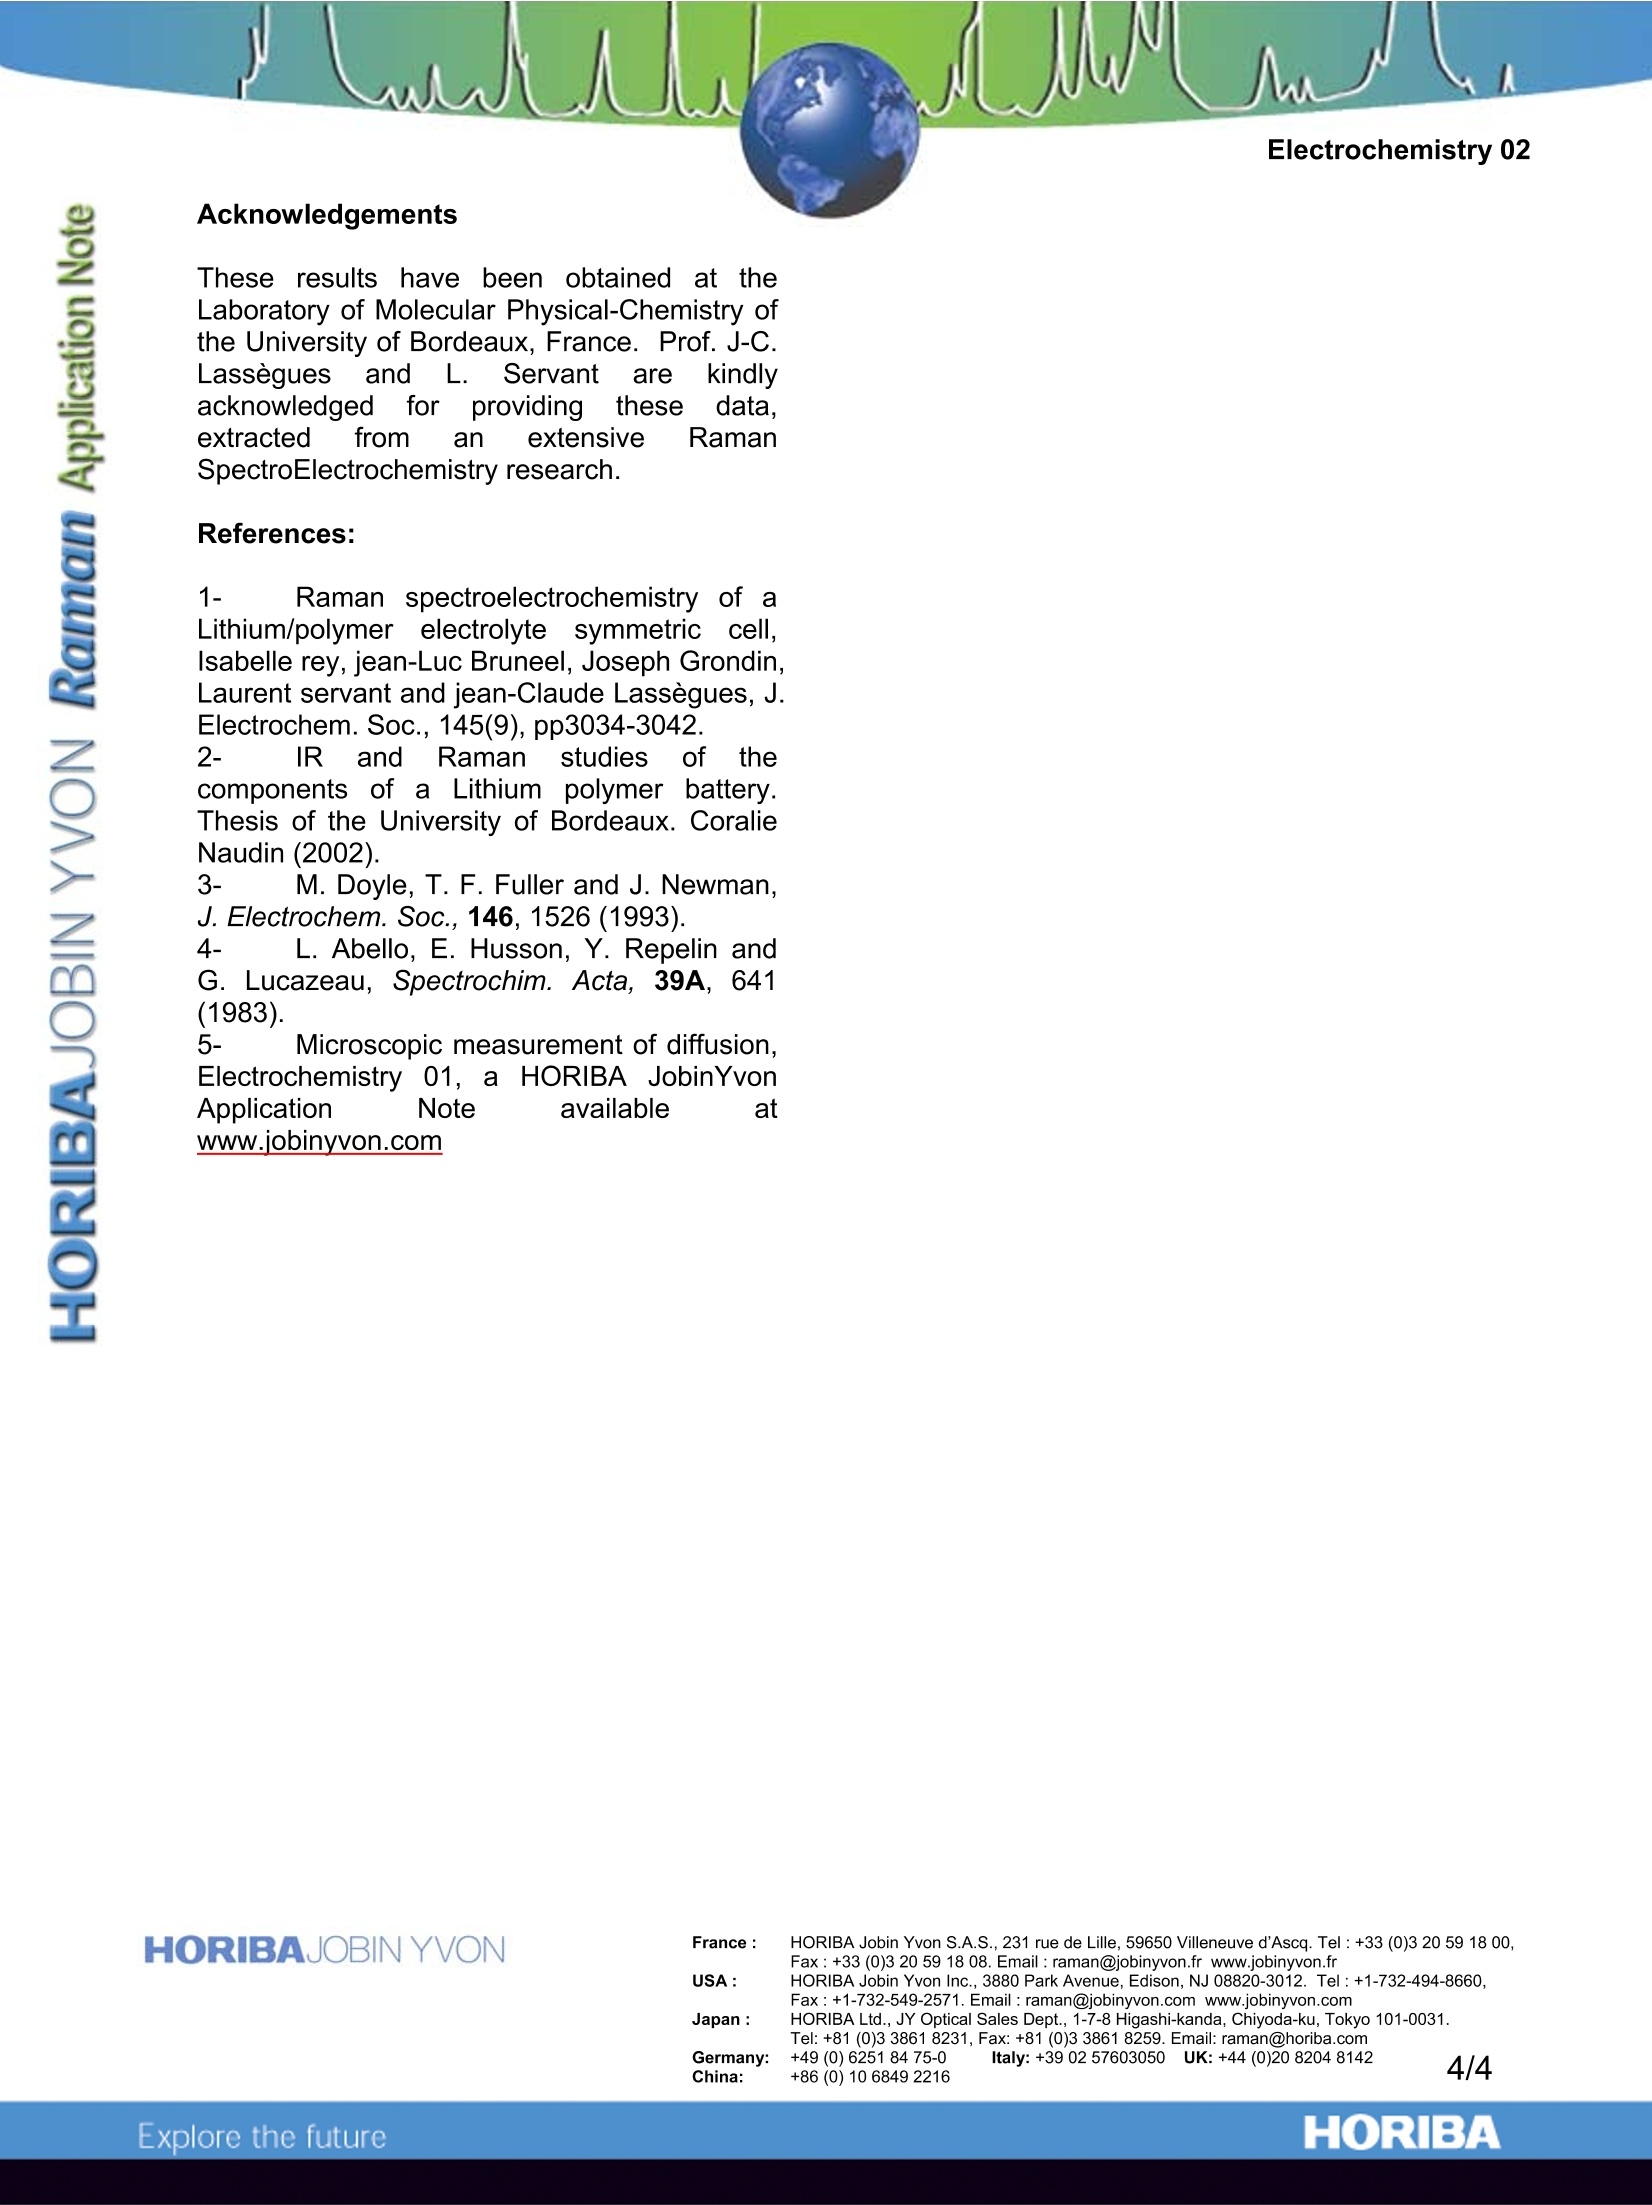
Electrochemistry 02 Raman microspectroscopy in Electrochemistry:Study of a Lithium Battery HORIBA Jobin Yvon S.A.S., Villeneuve d'Ascq, France Laboratoire de Physico-Chimie Moleculaire (LPCM)-University of Bordeauxl, France. Raman microspectroscopy coversa widerange of activities and Electrochemistry canprofit from this technique to set up in situanalyses to track kinetic phenomena. A lithiumpolymer battery cycling mechanism is drivenby the ionic transport in a polymer electrolyte(polyethylene Oxide (PEO) -Lithium salt) andthe intercalation of Lithium in the cathode(V20s). Information to monitor these propertiesin the battery can be obtained by Ramanmicrospectroscopy. Measure of the Salt concentration in thepolymer electrolyte An electrolyte is a medium able to transportelectric current using the ions it contains. Thediffusion of the ions, which occurs most oftenunder the influence of a concentration gradientand their migration, triggered by an electricfield, are the two main characteristics that needto be checked when designing a new polymerelectrolyte. The higher their value, the morepowerful the battery is. The diffusion of anelectrolyteismeasured tthe diffusionby icoefficient D (cm.s) and the migration ismeasured by the transport numbers t and t*.Well-knowntechniques areavailabletomeasure those parameters in liquidelectrolytes butthose techniques becomeuncertain in the case of polymer electrolyte. SoRaman microspectroscopyappearsas analternative tool. In this example the electrolyte is composed ofPEO heated up to 80℃ as the solvent in whichthe Lithium Li+ salt of tetra fluorosulfonelmide,TFSI is solvated. At 80°℃, PEO is completelyamorphous and participates in the motion ofper PEO has a characteristic peak located at 1420cm", which is assigned to the deformation,8(CH2). The anion TFSI has a unique Ramansignature with one characteristic peak whichdoes not overlap with the Raman spectrum ofPEO. This peak is the symmetric deformation vibration of the CF3 group (8s(CF3) at 742cm.- See Figure 1a. The relation between the ratioof the area corresponding to these peaksA[8,(CF3)]/ A[8 (CH2)] is demonstrated to belinear in a wide range of concentrations (Fig.1b). Using this prime relation, ionic diffusion andionic migration can be observed using Ramanmicrospectroscopy as P(EO)LiTFSI films. (a) Fig.1: (a) Raman spectra of several P(EO)nLiTFSI concentrations..((b) Linear relationbetween? relativeareaoffTFSI peakA[8s(CF3)]/A[8(CH2)]-and concentration1 ofTFSI in PEO. The assembly of two polymers films (~100pmthick) with different LiTFSI salt concentrationsat 80°C induces a concentration gradient. Thusa diffusion of the salt from the higher to thelower concentration film can be observed byRaman microspectroscopy. A line of Ramananalysis points is defined on the edge of the 2films assembly to measure the concentration atseveral points of the cross-section (see Fig.2). 宵 w POELiTFSI POE Fig. 2:Evolution of the concentration profile ofTFSIby self diffusionintheassemblyconsisting of a P(EO)20 LiTFSI and a PEO filmat 80℃. Plain lines: theoretical function (withD=6.10cm .s); Dots: experimental results. Study oof a Lithium/polymer/Lithiumsymmetric cell The Raman observation of the concentrationprofile while current densities are passingthrough a Lithium /polymer/lithium symmetriccell allowsthe determination of tthe saltdiffusion coefficientand ionictitransportnumbers. Fig. 3 displays the experiment performed on aLi/PEOLiTFSI/Li cell. Before applying anycurrent some lines are recorded to check thehomogeneity of the concentration throughoutthe electrolyte. Then successive oppositeconstantcurrentssareappliedand theconcentration1 gradientestablished in theelectrolyte at the steady state can be measured. Fig. 3 shows that, as expected, theamplitudeof tthee concentrationi gradientincreases with the current applied. One canextractinformation l about concentrationvariation during the establishment of ithesteady state and its relaxation [1] and thisallowsstthe determination of thediffusioncoefficient and the anionic transport number. Figure 3:(a) photograph of the PEO LiTFSIelectrolyteebetweenthellithium electrodesdisplaying the investigated line of points. (b)image of the salt concentration -depending onposition (x) and time (y)- The applied currentdensities are reported on the left of the image,the color scale displayed on the right allowsthe visualisation of the value of concentration.The edges of the line correspond to points overthe electrodes. Study of the intercalation and release oflithium in the cathode material LixV20s A large panel of cathode materials have beenconsidered; in this study we analyse a cathodethat is mainly composed of V20s powder and asmall quantity of carbon. The homogeneity oftheeblendi:is monitored by Ramanmicrospectrometry. The first intercalation of lithium in the initialcathodematerialia-V205 induces phasetransitions to the s, 8, yand ω phases. The Ramanspectru1m of a-V05ha beenthoroughlystudied[4]. Duringthefirstdischarge of a Li/electrolyte/V20s battery, theRaman spectrum of each phase has beenrecorded. The characteristic spectra of phases a, 8,8, 8,areplottedfigure44..Eachhphaseeischaracterized by a shift of the V-OA stretchingmode located respectively at 995cm, 982cm",972 cmand 1006cm1. The y phase is uniqueby exhibiting two peaks at 865 and 915cm'.No characteristic spectrum of the ω phase hasbeen obtained as it seems that this phase doesnot provide any significant Raman spectrum. Figl..4:RamannSspectraa0off0. 8,8, 8,y, phases.(from top to bottom) When the discharge is performed too rapidly(high current) there are risksforaninhomogeneous intercalation of Li in V205 thatcould lead to short term aging or failure of thebattery. Thus these reference spectra are usedto monitor the homogeneity of the lithiumintercalation process in LixV205: grainsthroughout the cathode during rapid discharge.As the battery is discharged, spectra arerecorded on 25 different V20s grains of thecathode. Preliminary results evidenced markeddifferences among 25 spectra for a givenaverage intercalation rate x, revealing theinhomogeneous intercalation process of Li+into V205. It is reckoned that thiswasessentially due to poor electrical contactsbetween the active material and the currentcollector and/or to discharge rates that weretoo high. Improvements of these two aspects inthe cell led to similar spectra for the 25investigated points. Fig. 5 plots simultaneously the potential curveandj the characteristicRaman intensities of the consecutive LixV205phases. Each plateau of the potential curveindicates a phase transition and each dropcorresponds: to amonophasic domain. Itappears that the Raman results are very wellcorrelated with the potential curve since eachplateau see the increase of a new phase at theexpense of the previous one. Confocal Ramanmicrospectrometry is thus a complementaryprobe beside the electrical tests to have abetter understanding of theintercalationoccurring in the composite electrode. Fig. 5: Intensity of the differentphasesa,8,8,y as afunctionof theLithiumintercalation rate (x). For each x value, theRaman intensity is averaged over 25 spectrarecorded on the electrode. Summary Ingeneral, Raman allowsttheein situcharacterization of microbatteries through anobservation window. This willllenablecorrelations between battery performance andmolecular/crystallinity changes.In addition,the capabilities of current Raman microscopes,which include fast mapping and high throughput to followthe rapid ion diffusion and migration. high spatial resolution to discriminate downto ~1um°3volumes jin the transparentelectrolyte. will make characterization of microbatteriesquite feasible with a Raman microscope. These results have been obtainedat theLaboratory of Molecular Physical-Chemistry ofthe University of Bordeaux, France. Prof. J-C.Lasseguessand .Servant are kindlyacknowledged forproviding thesedata.extracted from extensive RamanSpectroElectrochemistry research. References: ( 1- Raman s p ectroelectrochemistry of aLithium/polymer electrolyte : symmetric cell, Isabelle rey, jean-Luc Bruneel, Joseph Grondin,Laurent servant and jean-Claude Lassegues, J. Electrochem. Soc., 145(9), pp3034-3042. ) ( 2- IR and Raman s tudie s of t the components o f a L i thium polymer battery.Thesis o f the University of Bordeaux. CoralieNaudin (2002). ) ( 3- M. Doyle, T. F. Fuller and J. Newman,J. Electrochem. Soc., 146, 1526 ( 1993). ) ( 4- L. Abello, E. Husson, Y . R epelin andG. L ucazeau, Spectrochim. A cta, 39A, 641 (1983). ) ( 5- Microscopic m easurement of diffusion,Electrochemistry 0 1, a l HORIBA J obinYvon Application Note available at www.jobinyv o n.com ) ORIBAExplore the future ORIBAExplore the future In general, Raman allows the in situ characterization of microbatteries through an observation window. This will enable correlations between battery performance and molecular/crystallinity changes. In addition, the capabilities of current Raman microscopes,which includefast mapping and high throughput to follow the rapid ion diffusion and migration.high spatial resolution to discriminate down to ~1µm volumes in the transparent electrolyte.will make characterization of microbatteries quite feasible with a Raman microscope.
确定
还剩2页未读,是否继续阅读?

HORIBA(中国)为您提供《锂电池中化学组成、反应监控检测方案(激光拉曼光谱)》,该方案主要用于锂电池中化学组成、反应监控检测,参考标准--,《锂电池中化学组成、反应监控检测方案(激光拉曼光谱)》用到的仪器有
相关方案
更多
该厂商其他方案
更多