


方案详情
文
It has been shown that the analyte rhodamine 6G can be successfully measured and identified within single living cells using surface enhanced Raman microscopy. Principal components analysis for covariant features in the spectra allowed the identification of rhodamine 6G despite extensive spectral overlap from the cellular matrix.
方案详情

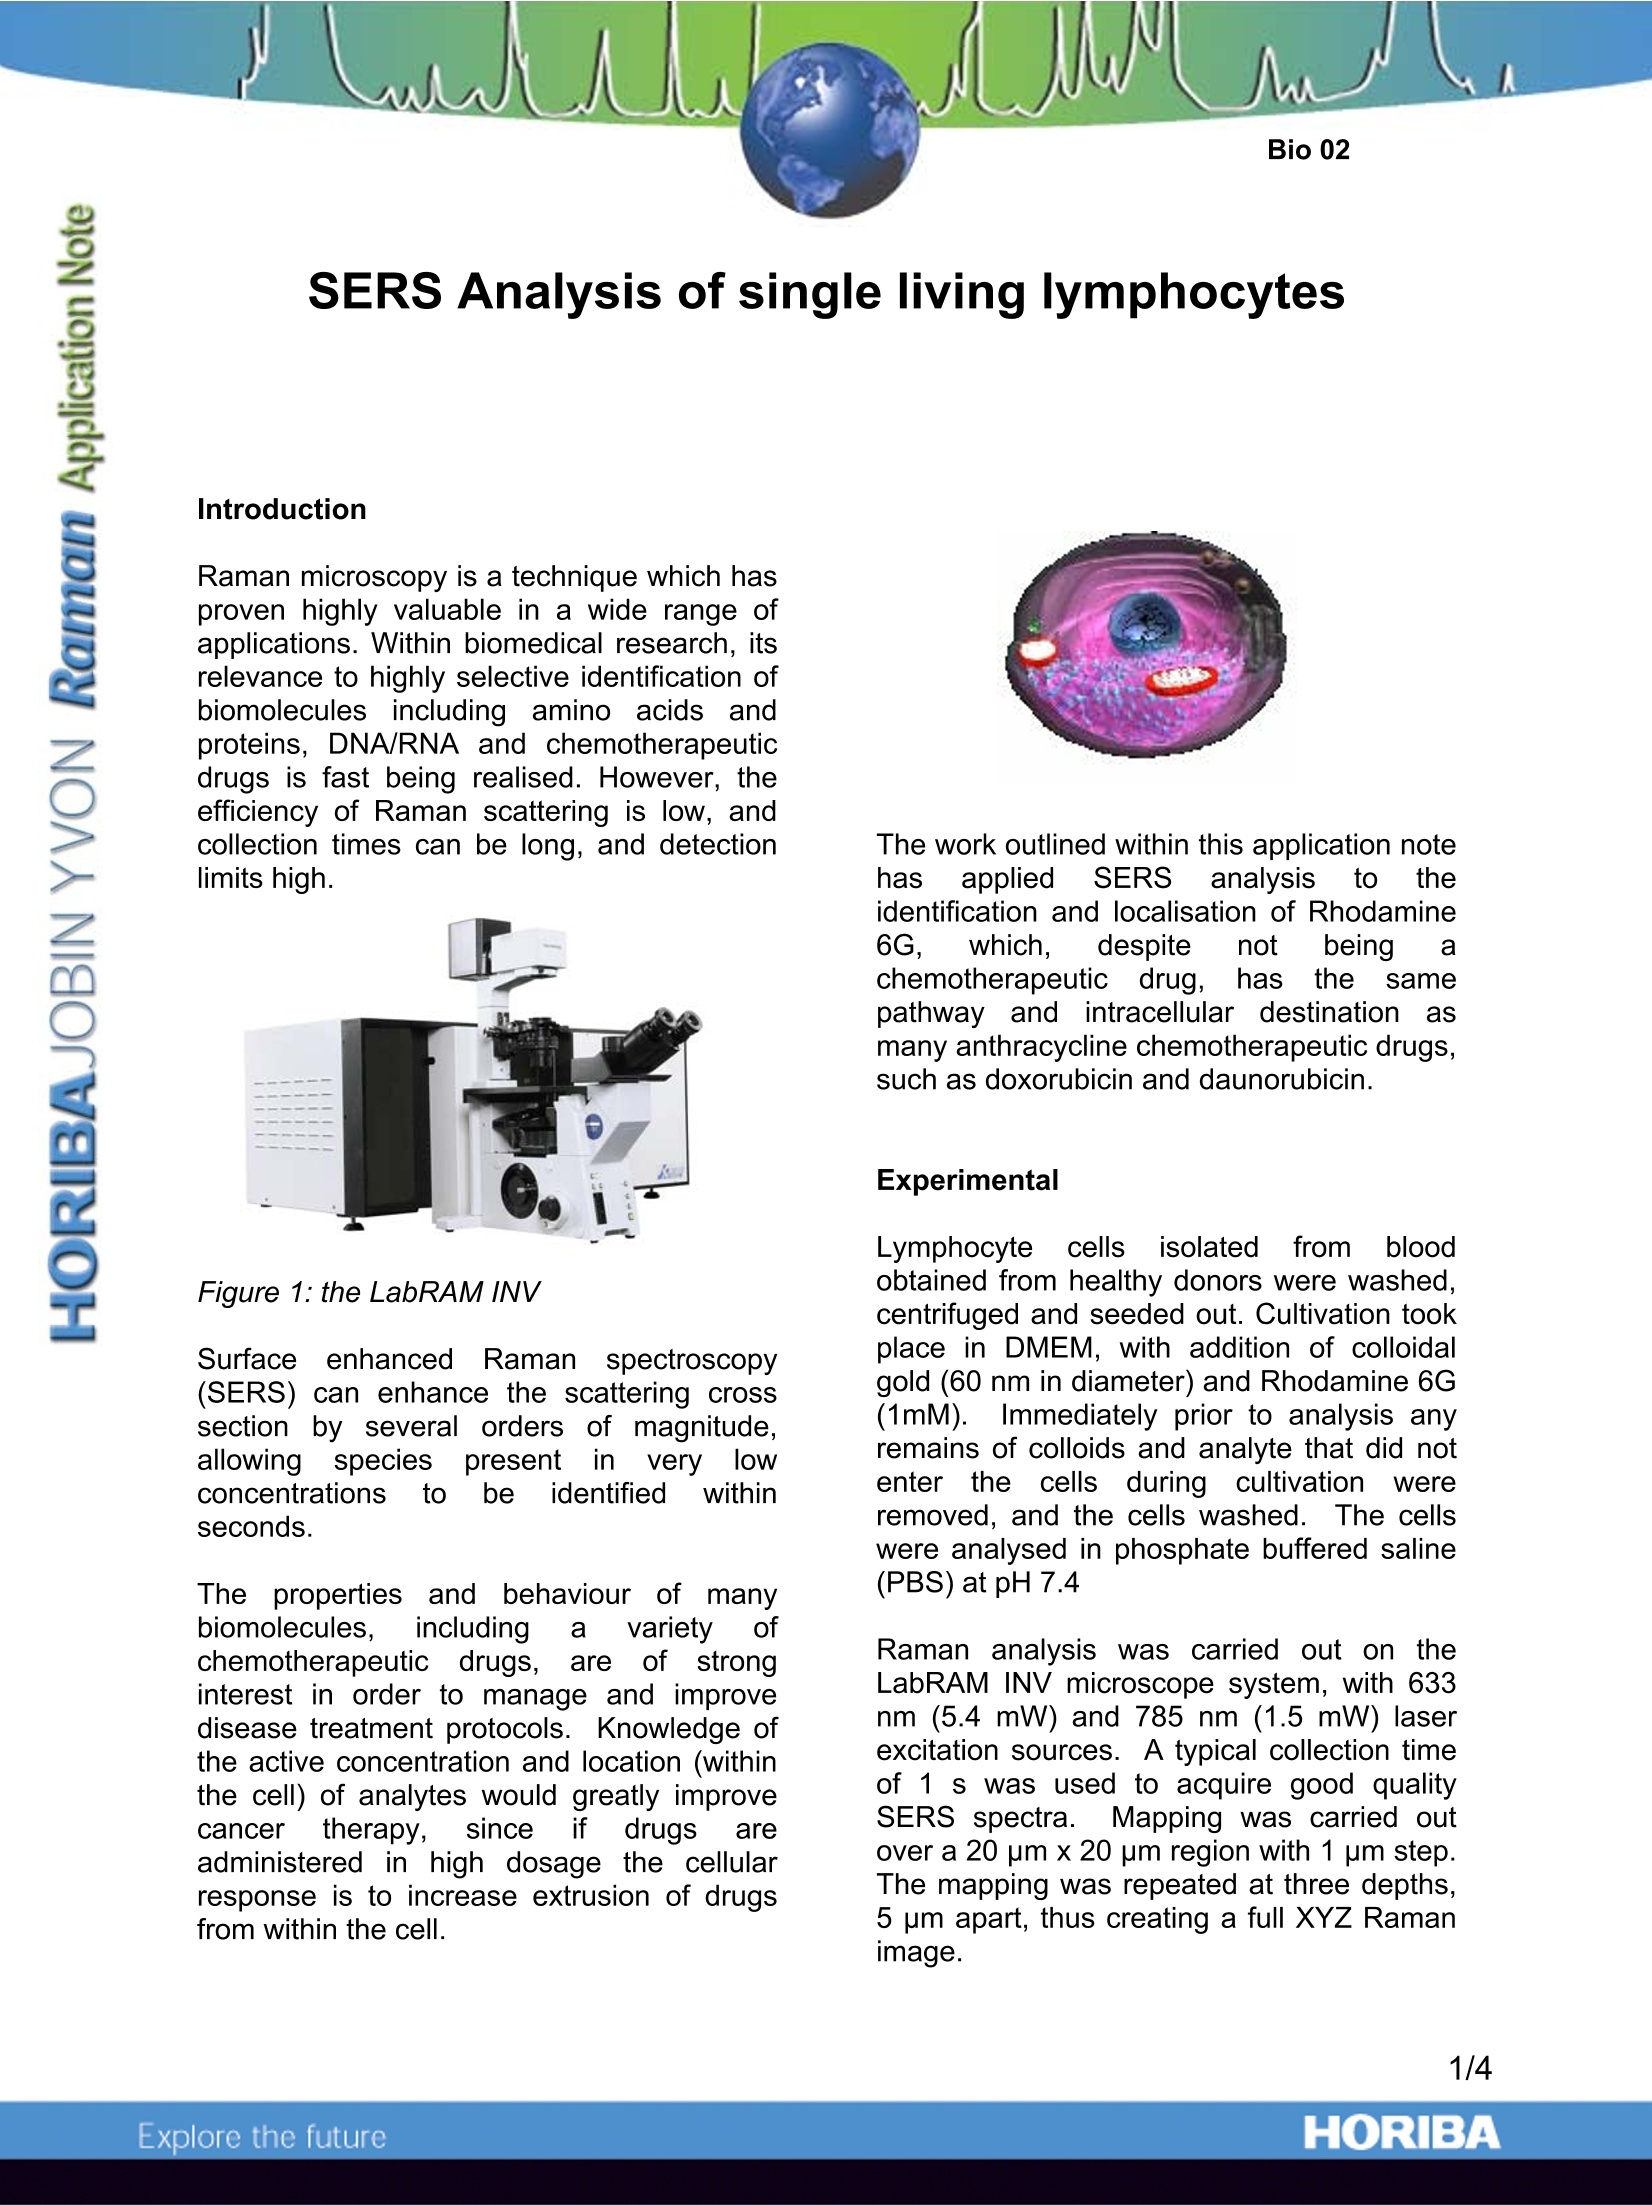
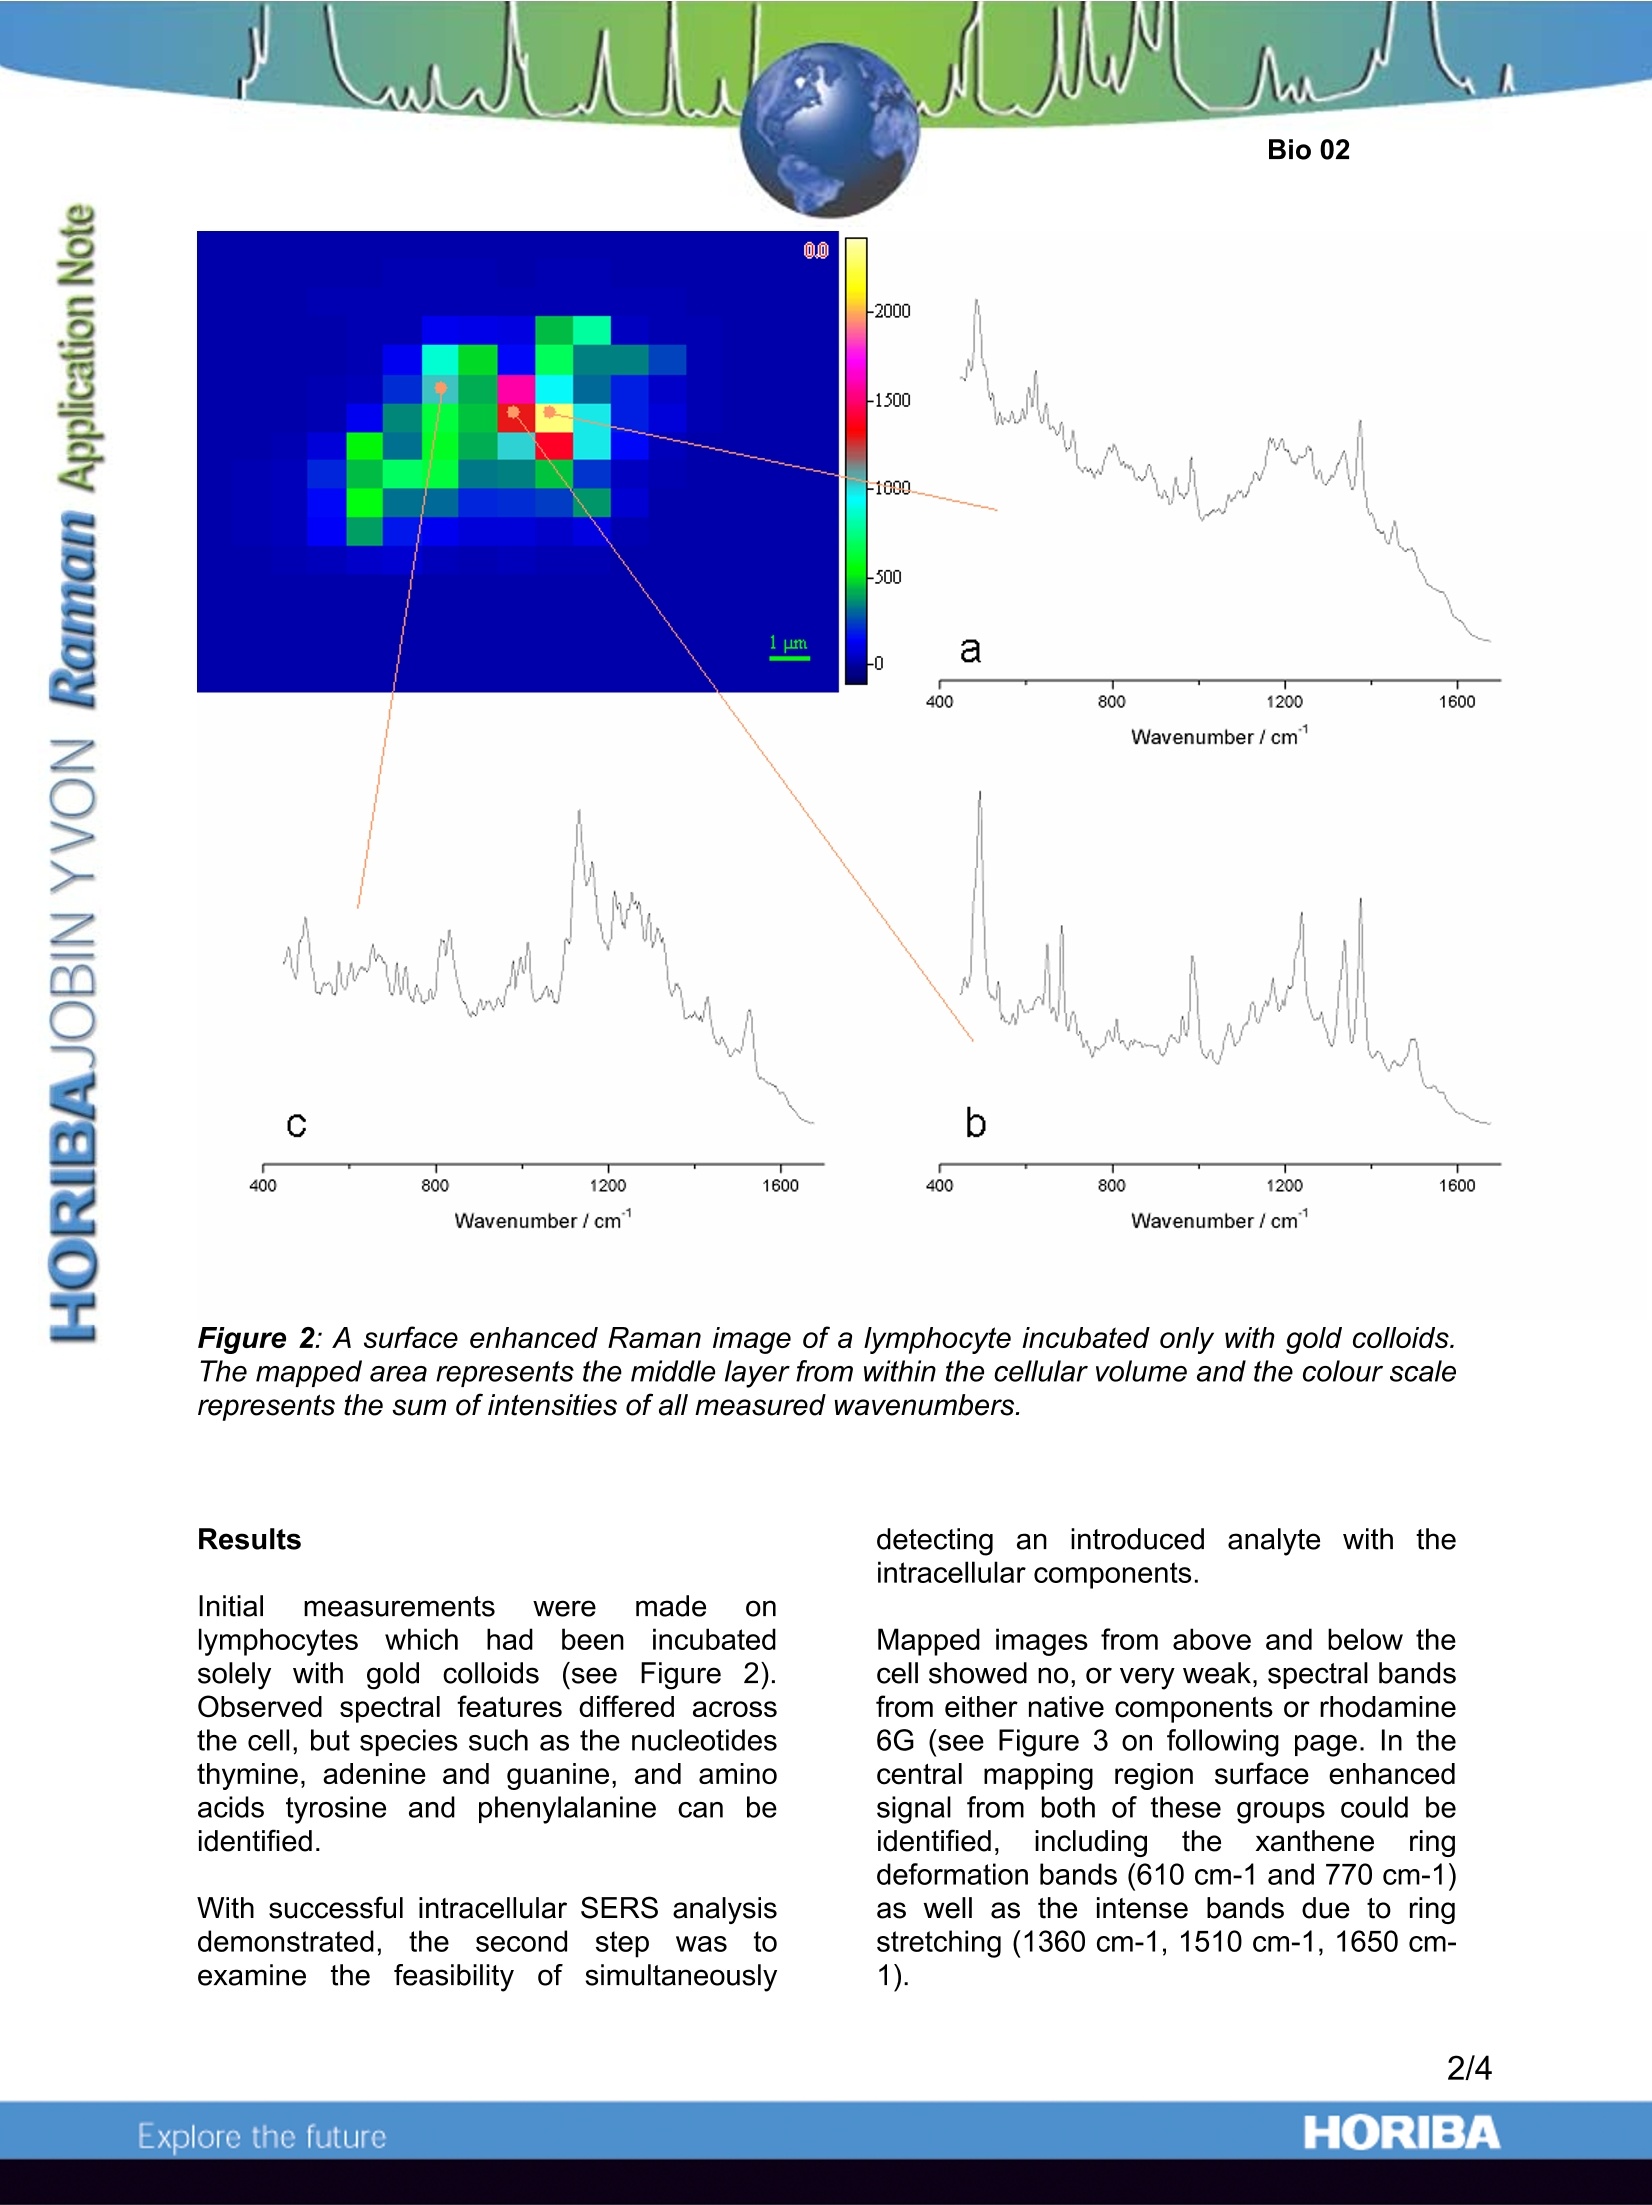
SERS Analysis of single living lymphocytes Introduction Raman microscopy is a technique which hasproven highly valuable in a wide range ofapplications. Within biomedical research, itsrelevance to highly selective identification ofbiomoleculesincluding amino acids; andproteins, DNA/RNA and chemotherapeuticdrugs is fast being realised. However, theefficiency of Raman scattering is low, andcollection times can be long, and detectionlimits high. Figure 1: the LabRAM INV Surface enhanced Ramanspectroscopy(SERS) can enhance the scattering crosssection by several orders of magnitude,allowing species present in very IlCowconcentrations be identified withinseconds. The properties and behaviour of manybiomolecules, including a variety ofchemotherapeutic drugsareof s,tronginterest in order to manage and improvedisease treatment protocols. Knowledge ofthe active concentration and location (withinthe cell) of analytes would greatly improvecancer therapy,, since ift(drugsareadministered in high dosage the cellularresponse is to increase extrusion of drugsfrom within the cell. The work outlined within this application notehasapplied SERSs analysisto theidentification and localisation of Rhodamine6G,\which.despite not being achemotherapeutic drug,, has the ssiamepathway and intracellular destinationnasmany anthracycline chemotherapeutic drugs,such as doxorubicin and daunorubicin. Experimental Lymphocyte cellsisolated from bloodobtained from healthy donors were washed,centrifuged and seeded out. Cultivation tookplace in DMEM, with addition of colloidalgold (60 nm in diameter) and Rhodamine 6G(1mM). Immediately prior to analysis anyremains of colloids and analyte that did notenter the cells during cultivationn wereremoved, and the cells washed. The cellswere analysed in phosphate buffered saline(PBS)at pH 7.4 Raman analysis was carried out on theLabRAM INV microscope system, with 633nm (5.4 mW) and 785 nm (1.5 mW) laserexcitation sources..A tynical sollaation timeof 1 s was used to acquire good qualitySERS spectra. Mapping was carried outover a 20 pm x20 um region with 1 um step.The mapping was repeated at three depths,5 pm apart, thus creating a full XYZ Ramanimage. 人 Figure 2: A surface enhanced Raman image of a lymphocyte incubated only with gold colloids.The mapped area represents the middle layer from within the cellular volume and the colour scalerepresents the sum of intensities of all measured wavenumbers. Results Initial measurements werenmade onlymphocyteswhich hadbeenincubatedsolely with gold colloids(see Figure 2).Observed spectral features differed acrossthe cell, but species such as the nucleotidesthymine, adenine and guanine, and aminoacids tyrosine and phenylalanine can beidentified. With successful intracellular SERS analysisdemonstrated, the second stepwas ttoexamine the feasibility of simultaneously detecting an introducedanalyte with11theintracellular components. Mapped images from above and below thecell showed no, or very weak, spectral bandsfrom either native components or rhodamine6G (see Figure 3 on following page. In thecentral mapping region surface enhancedsignal from both of these groups could beidentified, including thexanthene ringdeformation bands (610 cm-1 and 770 cm-1)as well as the intense bands due to ringstretching (1360 cm-1, 1510 cm-1, 1650 cm-1). Figure 3: Surface enhanced Raman spectra from three different layers, 5 pm apart, of alymphocyte incubated with both rhodamine 6G and colloids, where the middle layer was withinthe cell. The image to the right is the intensity map of the intracellular layer. A spectrum from thisimage contains Raman bands from rhodamine 6G (●), and contribution from intracellularcomponents (▲) Multivariate analysis of the results from anumber of mapping experiments allowed thesignal of rhodamine 6G to be extracted fromthe image spectra. Principal ComponentsAnalysis (PCA) made it possible to separatecovariant features (for example, Ramanspectra of different compounds). Two:principal components were calculated, whichtogether explained over 90% of the totalvariation. The first principal component(pc1) contained a mean variation in the dataset.,whilst the second componentt(pc2)expressed the variation of the rhodamine 6Gcontent in the cell. A score plot (see Figure 4) showed thatspectra could be divided into three classes,corresponding1to rhodamine 6G andintracellular components (class 1)andintracellular componentsonly (class3).Class 2, in the middle of the score plot,contained spectra without any spectral bandinformation. 1] Figure 4: AA,score plot of the first twoprincipal components of the PCA modelbased on the mapped lymphocyte in Figure2. Class 1- rhodamine 6G and intracellularcomponents, class 2 no0spectralinformation,class33- only iintracellularcomponents. The loading vector of pc2 contains spectralfeatures of rhodamine 6G over the wholespectral range (see Figure 5a). A referencespectrum of rhodamine 6G (Figure 5b) isinserted for comparison, \withthe mainspectral features marked. Intracellular contributions were found in laterprincipal components, which can be viewedsimultaneously when looking at the residualsafter two principal components. Within theresiduals, spectral contributions from DNAand nucleotides are clearly visible.Importantly, there is no contribution fromrhodamine 6G, suggesting that multivariatequantification of the analyte may be feasibleusing just the second principal component. Figure 5: The loading vector of the secondprincipal component (a) of the PCA model. Areference spectrum of rhodamine 6G (b) isincluded for comparison Conclusions lt hassbeen1shown that the analyterhodamine 6G can be successfullymeasured and identified within single livingcellsgusing surface enhanced Ramanmicroscopy. Principal components analysisfor covariant features in the spectra allowedthe identification of rhodamine 6G despiteextensive spectral overlap from the cellularmatrix. Acknowledgements Charlotte Eliasson, Anders Loren, JohansEngelbrektsson, MatsJosefson.,、JonasAbrahamsson and Katarina Abrahamssonare kindly thanked for allowing use of datafrom their research for this application note.In addition, Charlotte Eliasson is furtherthanked for helpful discussions concerningthe preparation of the note. Key Reference Charlotte Eliasson, Anders Loren, JohansEngelbrektsson, MatsJosefson. JonasAbrahamsson and Katarina Abrahamsson,Surface-Enhanced Raman Scatteringlmaging of Single Living Lymphocytes withMultivariate Evaluation, Spectrochimica ActaParttA: Molecular and BiomolecularSpectroscopy,2005,61,755-760 ( France : HORIBA Jobin Yv o n S.A.S., 23 1 rue de Lille, 59650 Villeneuve d'Ascq. T e l:+33(0)320 59 1800 , Fax: +33 (0)3 20 59 18 08. E mail : raman@jobinyvon.fr www.jobinyvon.fr HORIBA Jobin Yvon Inc., 3880 Park Avenue, Edison,NJ 08820-3012. T el:+1-732-494-8660, ) ( USA: Fax:+1-732-549-2571.Email : raman@jobinyvon.com www.jobinyvon.comJapan : HORIBA Ltd., JY Optical Sales D e pt., 1-7-8 Higashi-kanda, Chiyoda-ku, T o kyo 101-0031. ) Tel:+81 (0)3 3861 8231, Fax: +81 (0)3 3861 8259. Email: raman@horiba.com Germany: +49(0)62518475-0 Italy: +39 02 5760305Q0 YKi +44 (Q)20 8204 8142 China: +86 (0)10 6849 2216 ORIBAExplore the future It has been shown that the analyte rhodamine 6G can be successfully measured and identified within single living cells using surface enhanced Raman microscopy. Principal components analysis for covariant features in the spectra allowed the identification of rhodamine 6G despite extensive spectral overlap from the cellular matrix.
确定


还剩2页未读,是否继续阅读?

产品配置单
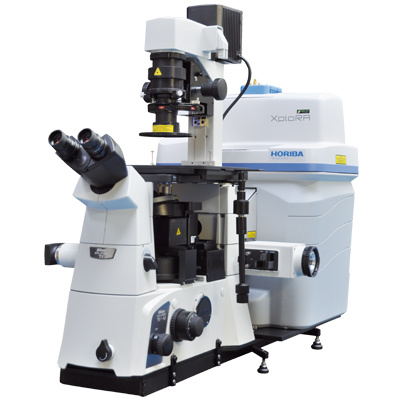
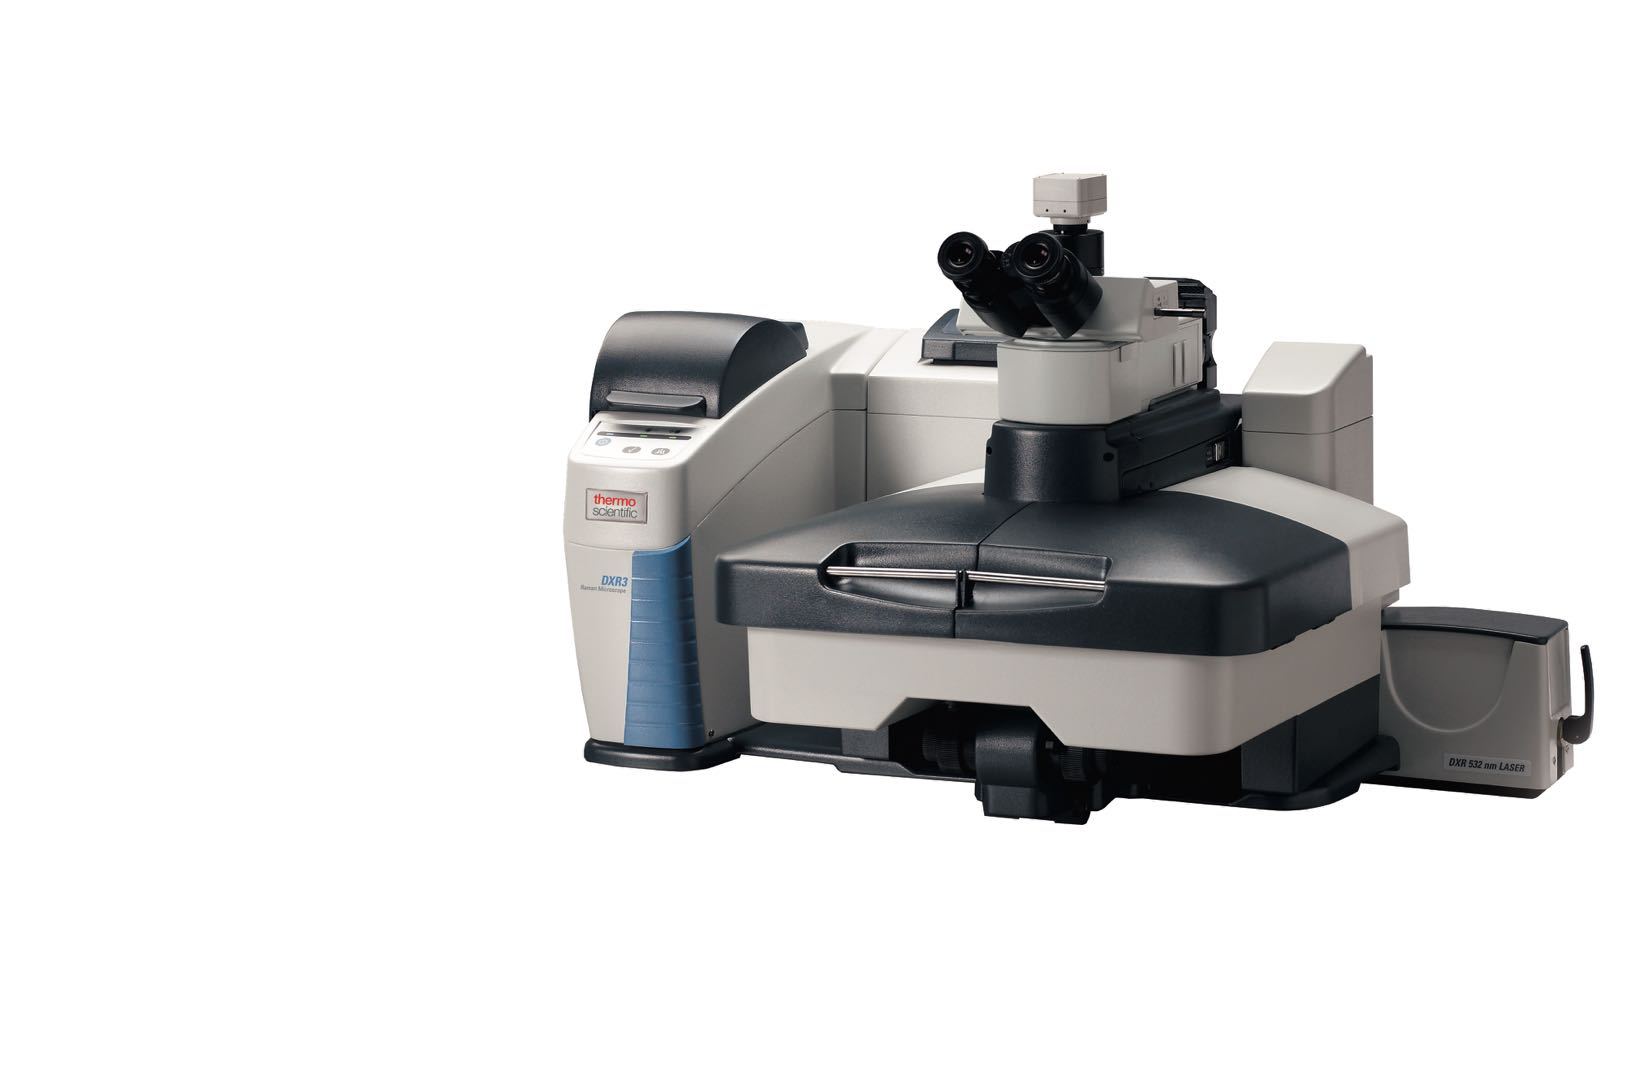
HORIBA(中国)为您提供《活体单淋巴细胞中化学组成分析检测方案(激光拉曼光谱)》,该方案主要用于其他中化学组成分析检测,参考标准--,《活体单淋巴细胞中化学组成分析检测方案(激光拉曼光谱)》用到的仪器有HORIBA XploRA INV多功能拉曼及成像光谱仪
推荐专场


相关方案
更多
该厂商其他方案
更多