


方案详情
文
Polarized light striking a fluorescent molecule results in polarized fluorescence. This polarized emission gradually returns to unpolarized fluorescence depending on rotational diffusion and other factors. Anisotropy is directly related to the polarization, and is the ratio of the polarized-light component to the total light intensity. With optional polarizers installed in a spectrofluorometer, we define light intensities: IVV is with excitation and emission polarizers mounted vertically;
方案详情

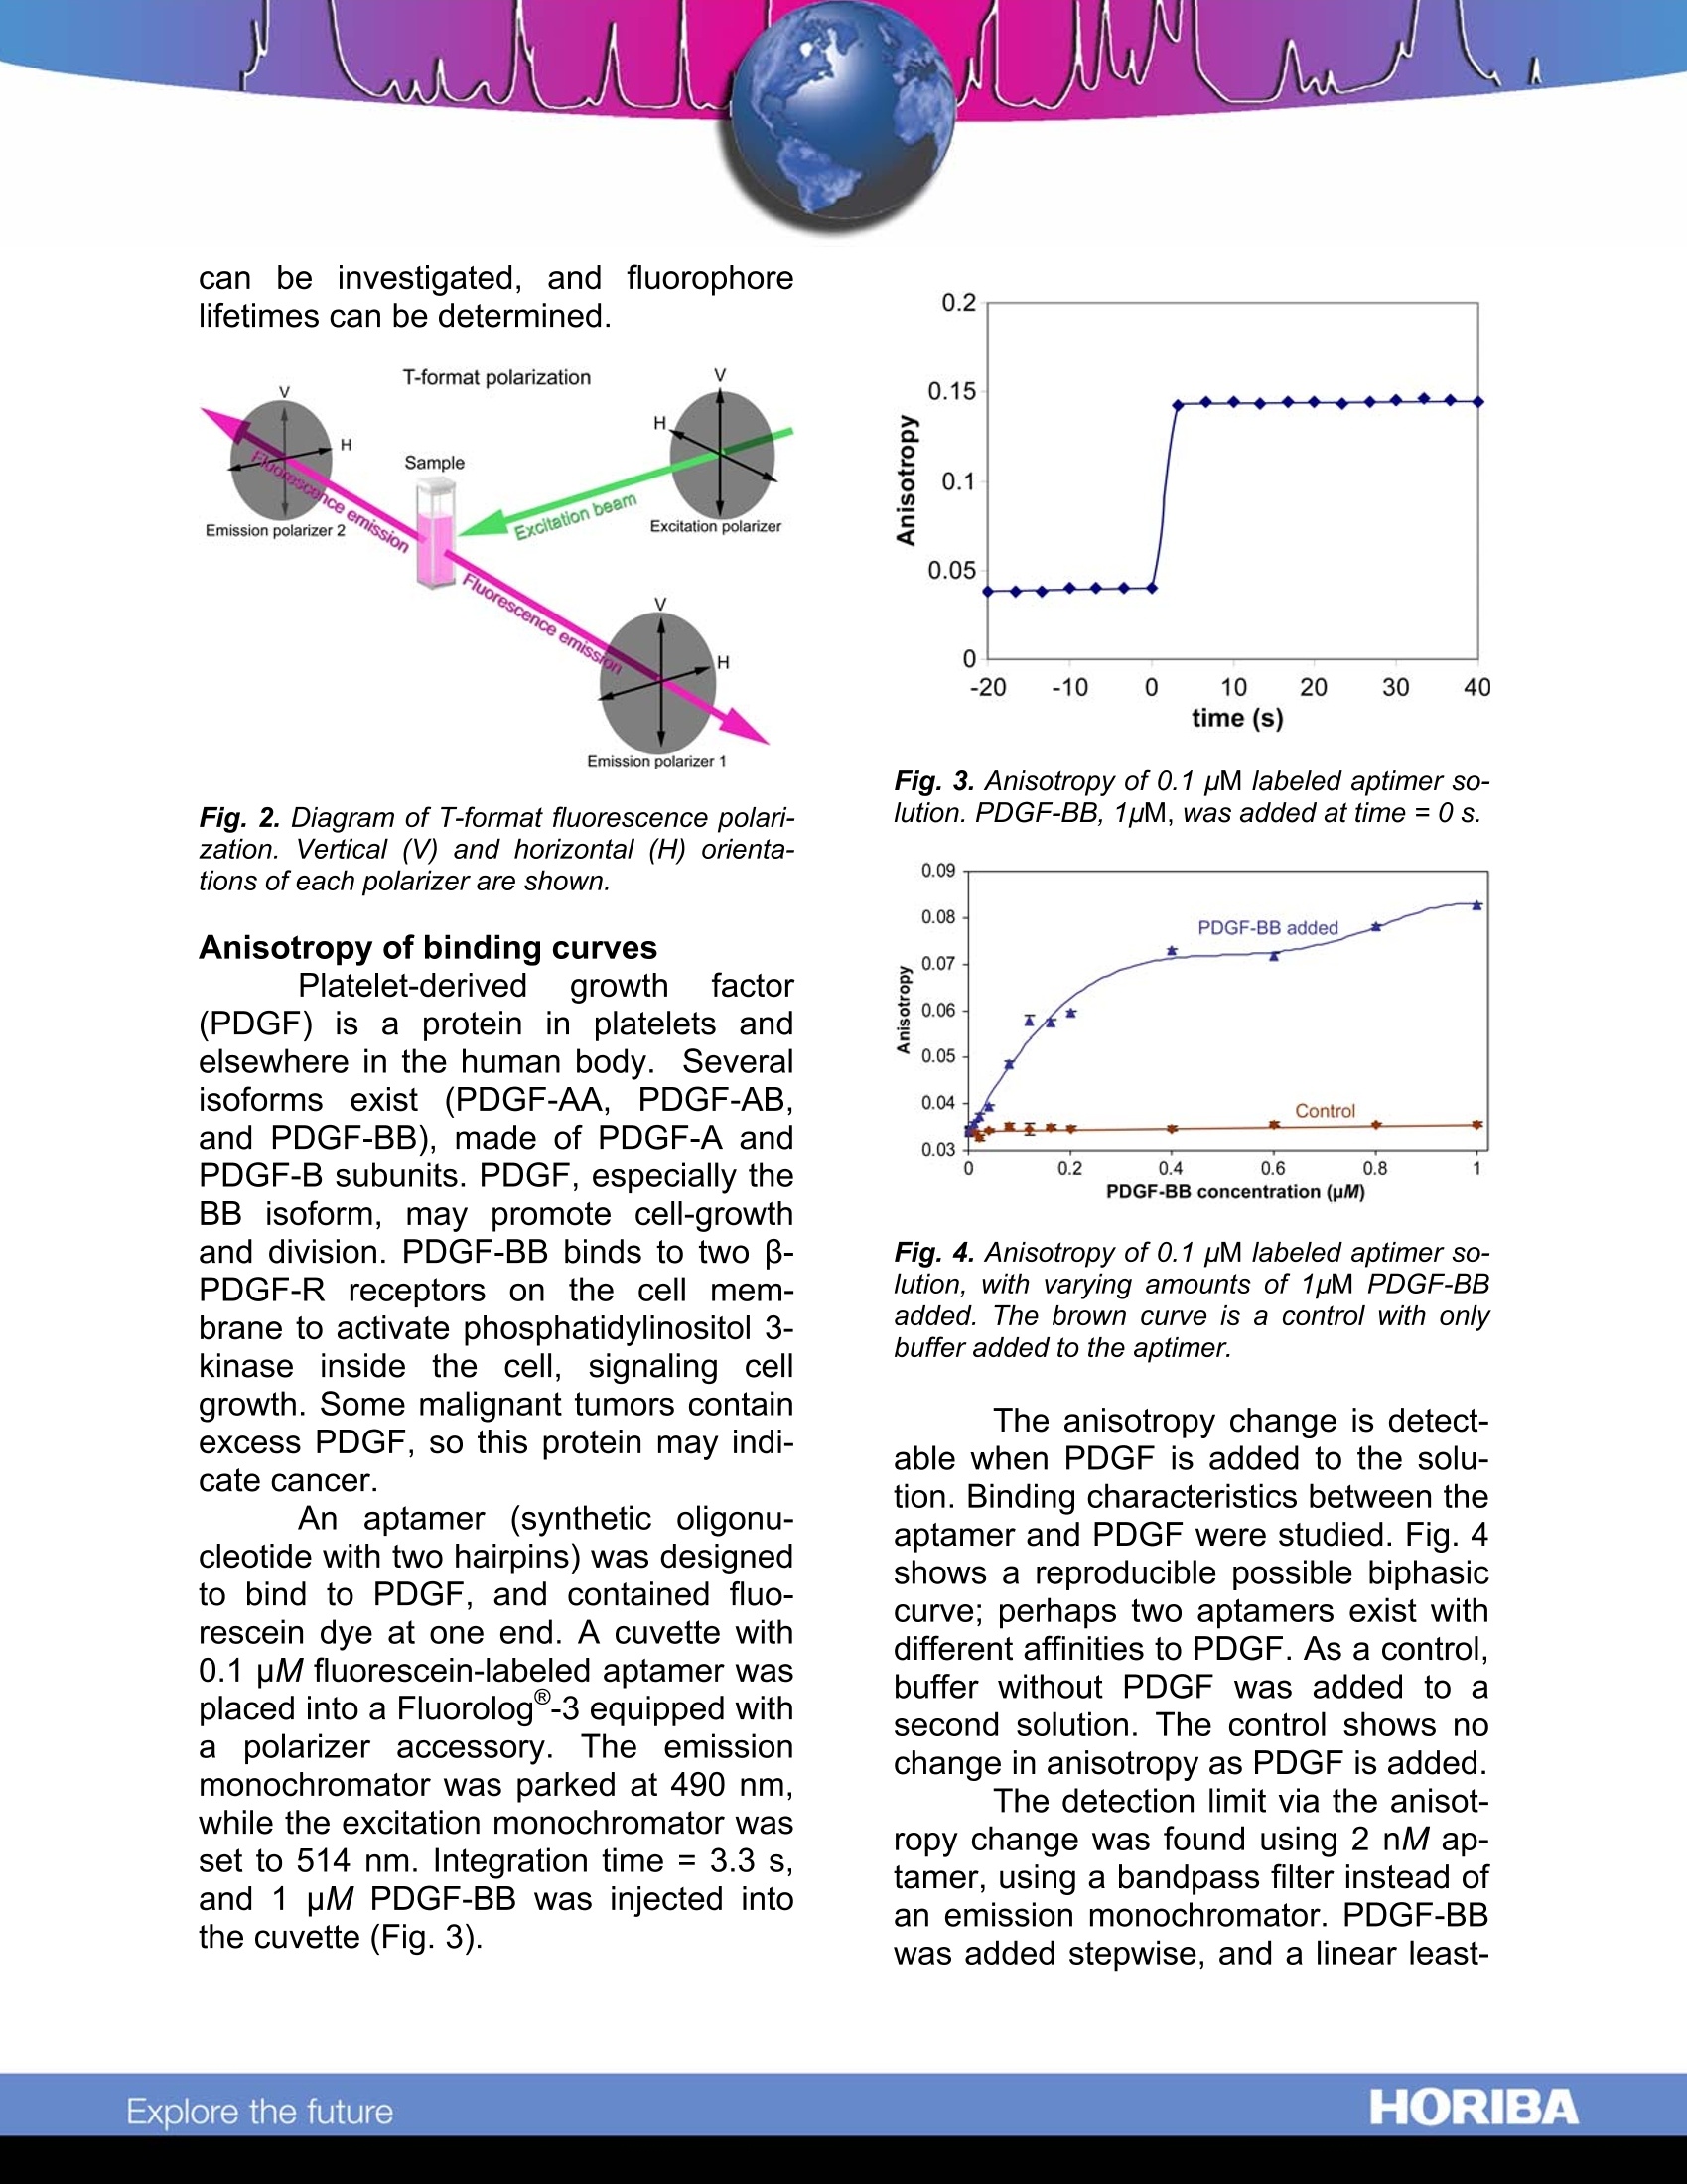
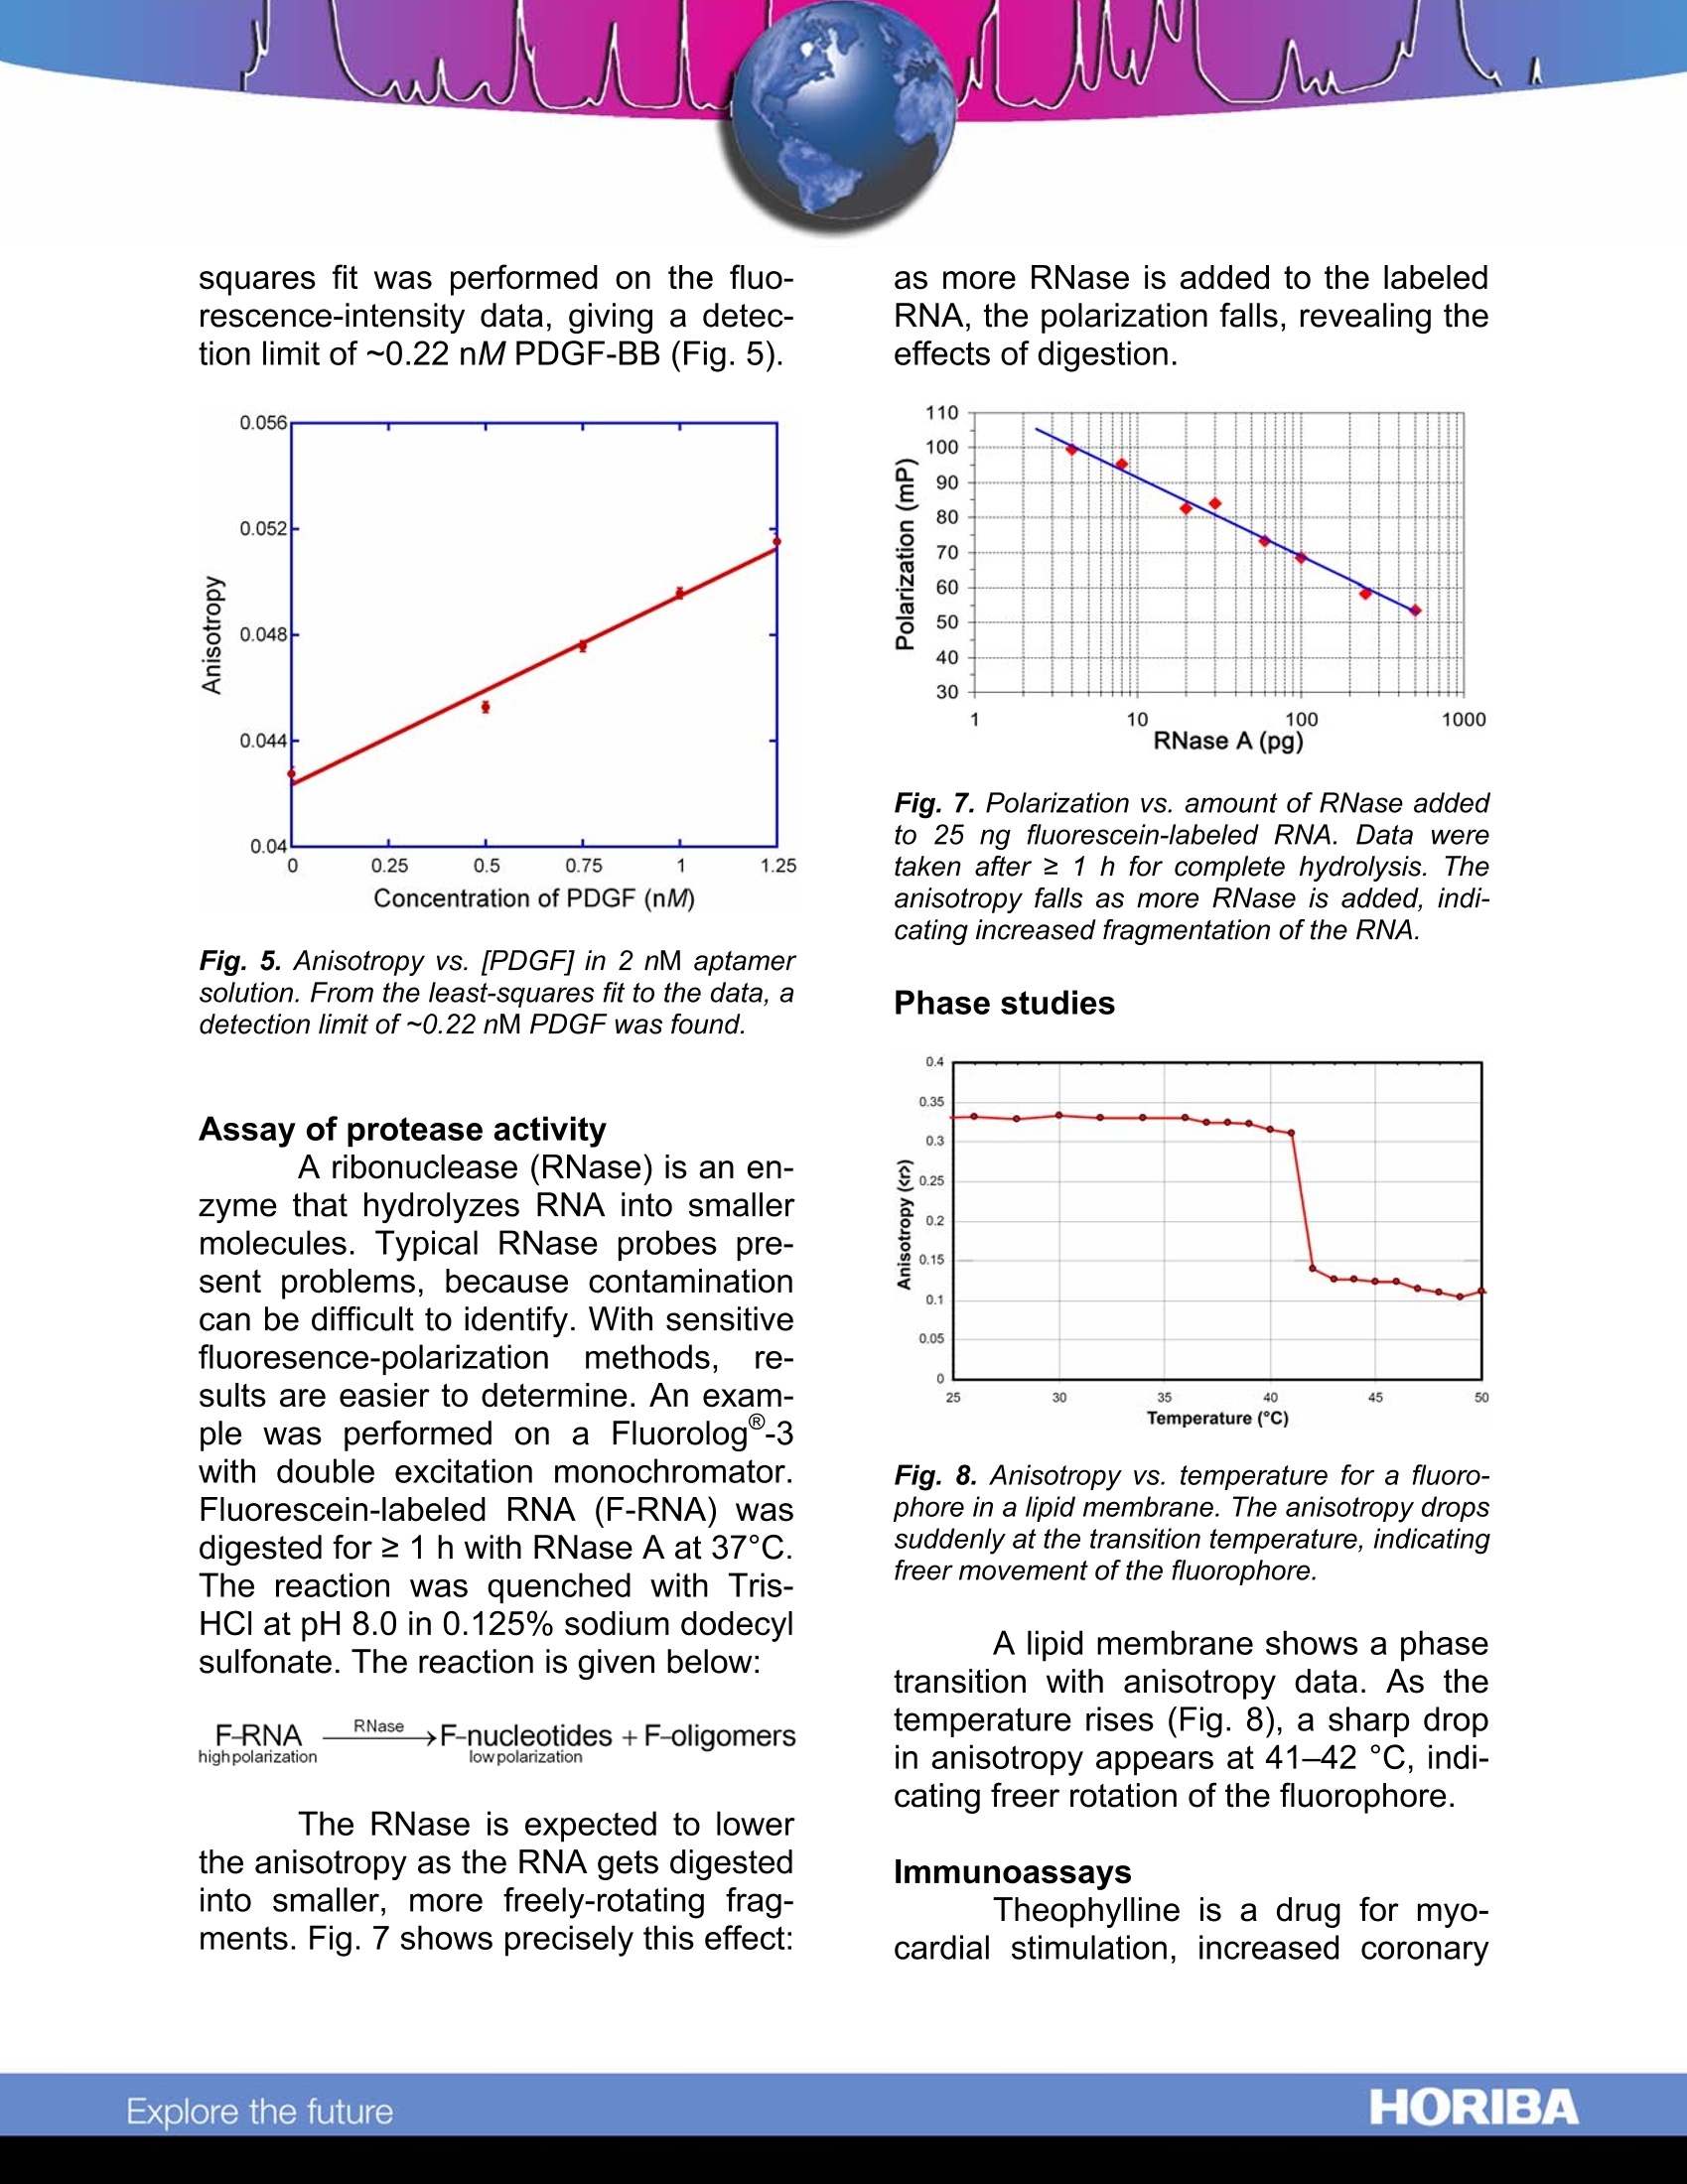
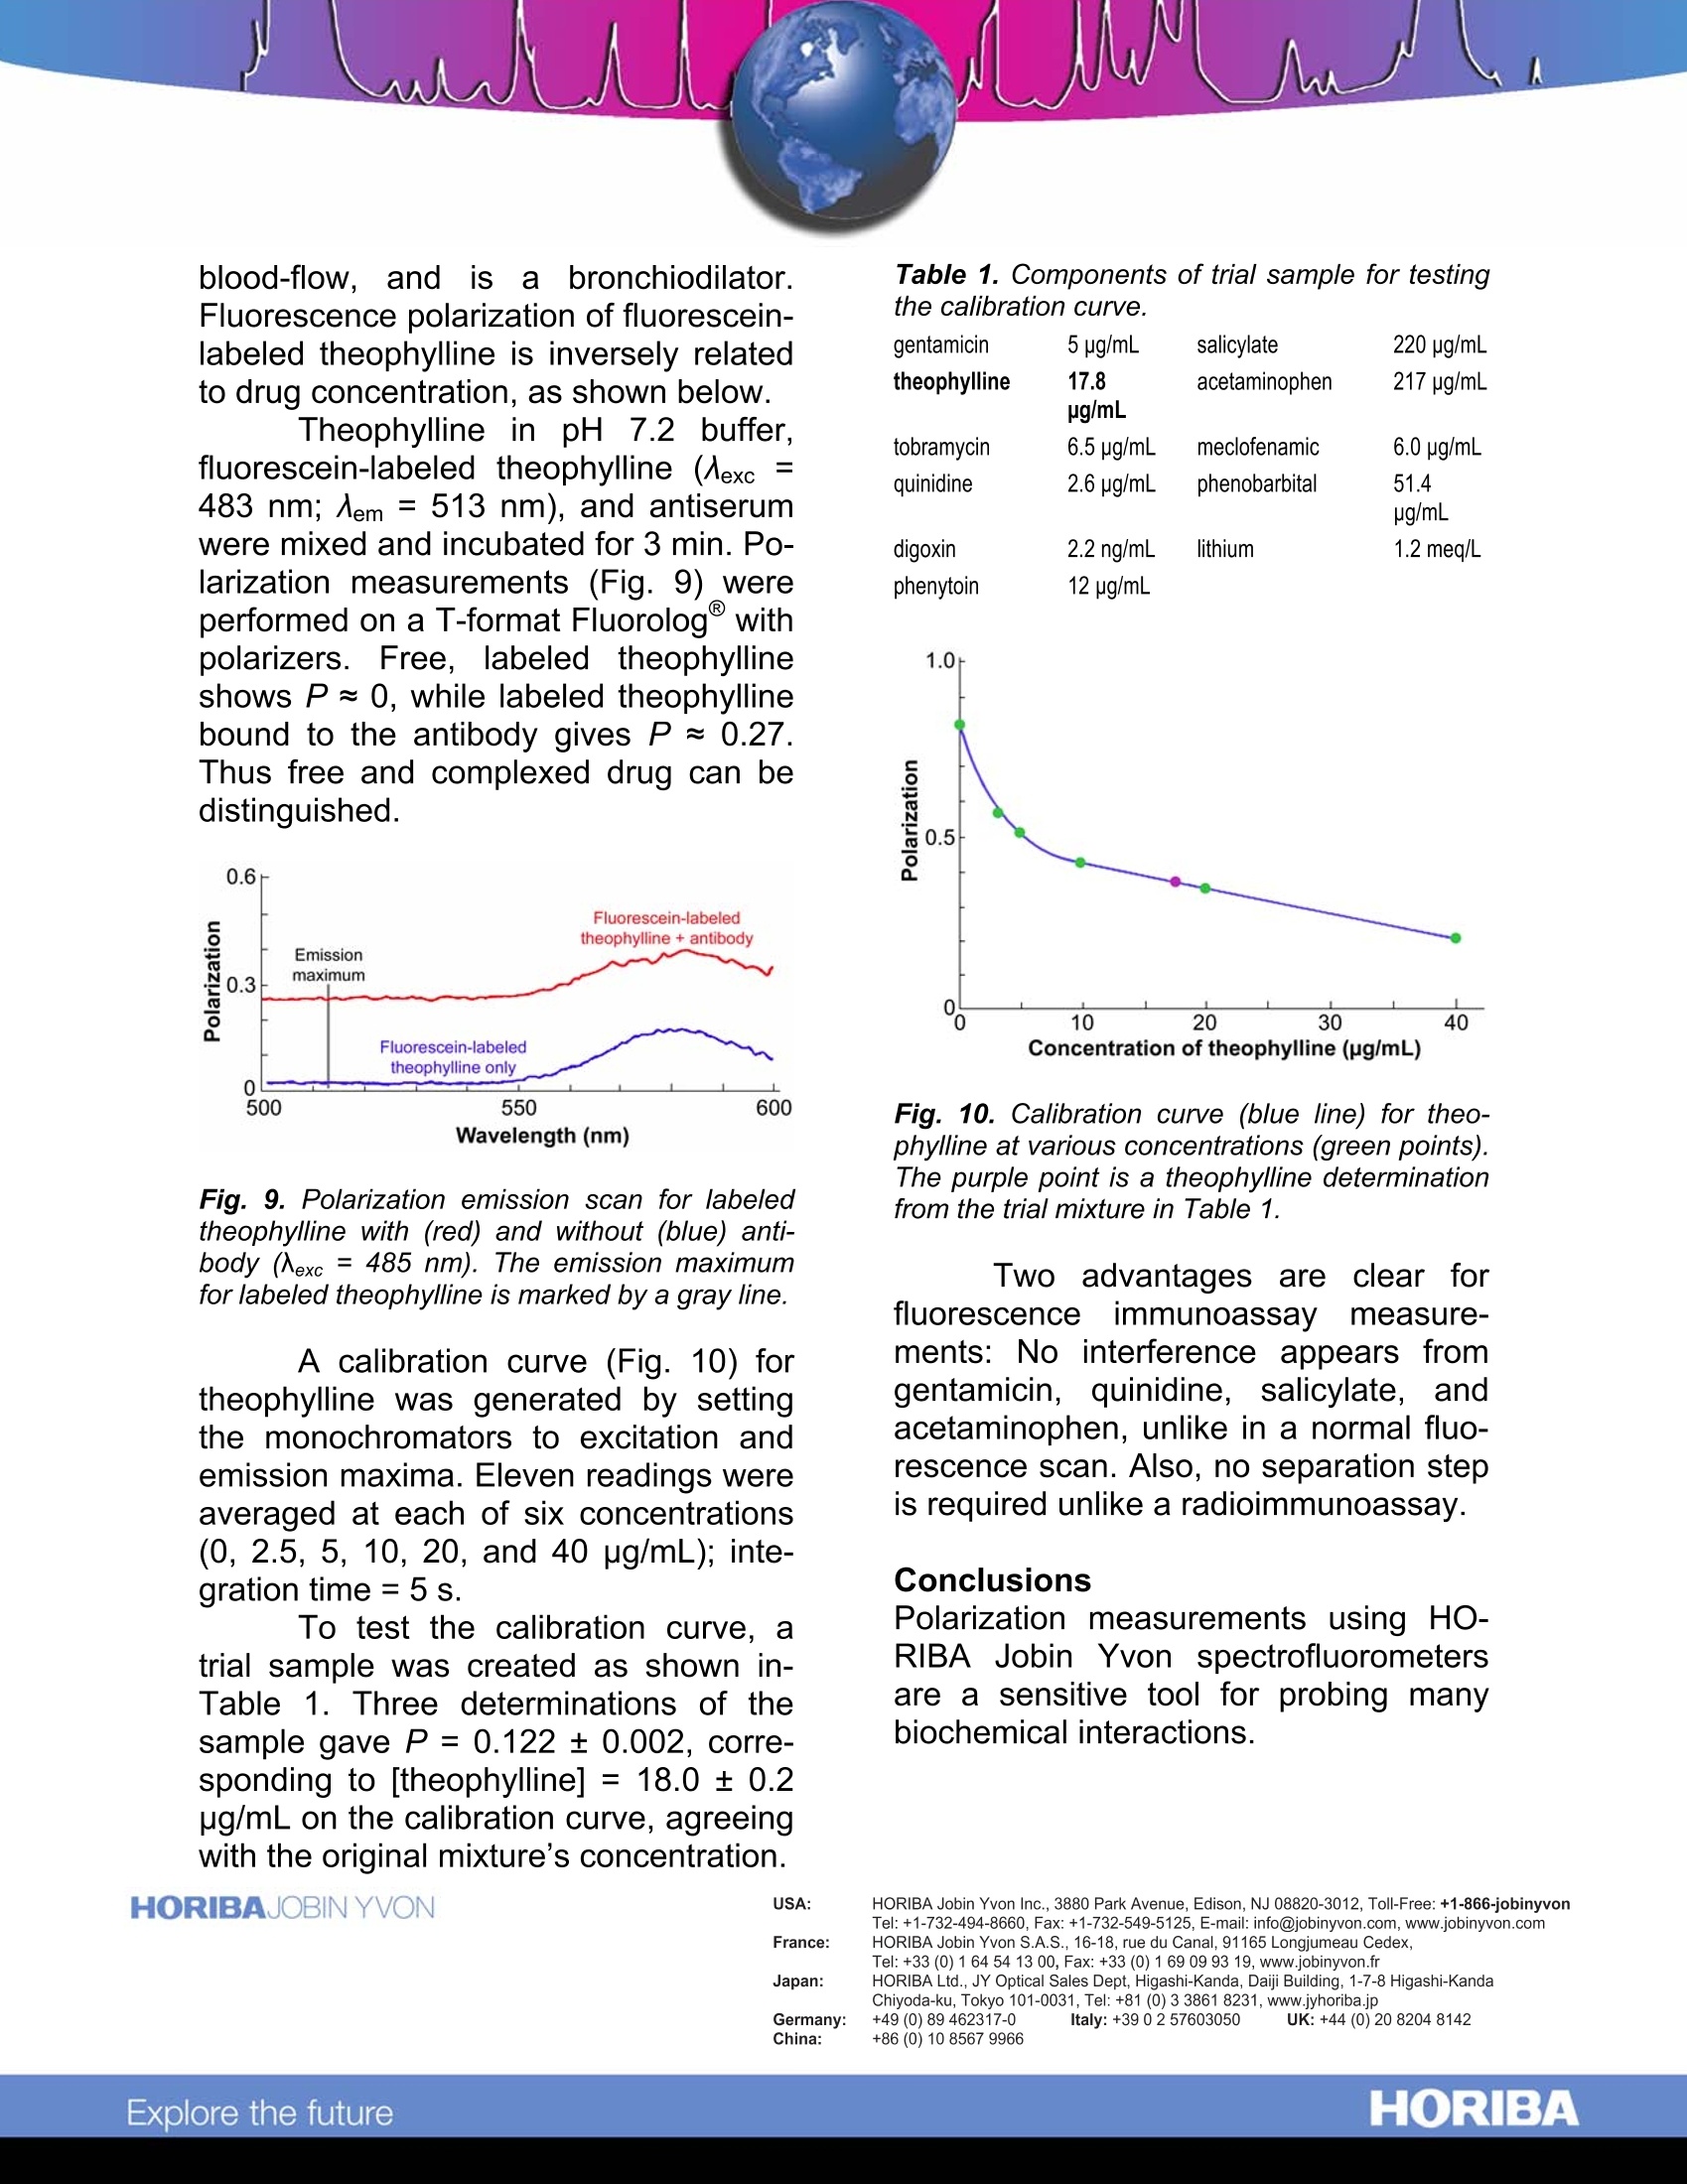
Fluorescence Anisotropy Studies Introduction Polarized light striking a fluores-cent molecule results in polarized fluo-rescence..This polarizedEemissiongradually returns to unpolarized fluores-cence depending on rotational diffusionand other factors. Anisotropy is directlyrelated to the polarization, and is the ra-tio of the polarized-light component tothe total light intensity. With optional po-larizers installed in a spectrofluorometer,we define light intensities: lv is with ex-citation and emission polarizersmounted vertically; lHH is for excitationand emission polarizers mounted hori-zontally. lHv uses an excitation polarizerhorizontal and the emission polarizervertical; Iv requires the excitation polar-izer vertical and emission polarizer hori-zontal. The basic setup, called“L-format," is shown in Fig. 1. Fig. 1. Diagram of L-format fluorescence polari-zation. Vertical (V) and horizontal (H) orienta-tions of each polarizer are shown. where G, the“G factor,”is Four intensity measurements,, corre-sponding to permutations of both polar-izers’orientations, are needed to deter-mine or P. Both Fluorolog@and FluoroMaxspectrofluorometers with a polarizer ac-cessory can do L-format polarizationmeasurements. The Fluorolog@s modu-lar design, however,.introducesun-equalled flexibility with optional“T-format”polarization. The T-format usestwo emission polarizers, speeding updata-acquisition via simultaneous verti-cal and horizontal polarizer emissionneasurements. A diagram of the T.format method is shown in Fig. 2. Anisotropy provides informationon molecular size and shape, and localviscosities of a fluorophore's environ-ment, as well as offering insight intochanges in molecular sizes of polymersand other macromolecules.Protein-ligand interactions and binding assays ( ' Joseph R. Lackowicz, Principles of Fluores-cence Spectroscopy,3 ed., N ew Y o rk,Springer,2006, pp. 353-354, 361-364. ) can be investigated, and fluorophorelifetimes can be determined. Fig. 2. Diagram of T-format fluorescence polari-zation. Vertical (V) and horizontal (H) orienta-tions of each polarizer are shown. Anisotropy of binding curves Platelet-derivedgrowth factor(PDGF) is a protein in platelets andelsewhere in the human body. Severalisoforms exist (PDGF-AA, PDGF-AB,and PDGF-BB), made of PDGF-A andPDGF-B subunits. PDGF, especially theBB isoform, may promote cell-growthand division. PDGF-BB binds to two B-PDGF-R receptors on the cell mem-brane to activate phosphatidylinositol 3-kinase inside the cell, signaling cellgrowth. Some malignant tumors contain1all(excess PDGF, so this protein may indi-cate cancer. An aptamer (synthetic oligonu-cleotide with two hairpins) was designedto bind to PDGF, and contained fluo-rescein dye at one end. A cuvette with0.1 pM fluorescein-labeled aptamer wasplaced into a Fluorolog@-3 equipped withapolarizer accessory. The emissionmonochromator was parked at 490 nm,while the excitation monochromator wasset to 514 nm. Integration time = 3.3 s,and 1 pM PDGF-BB was injected intothe cuvette (Fig.3). Fig. 3. Anisotropy of 0.1 pM labeled aptimer so-lution. PDGF-BB, 1pM, was added at time=0 s. Fig. 4.Anisotropy of 0.1 pM labeled aptimer so-lution, with varying amounts of 1pM PDGF-BBadded. The brown curve is a control with onlybuffer added to the aptimer. The anisotropy change is detect-able when PDGF is added to the solu-tion. Binding characteristics between theaptamer and PDGF were studied. Fig. 4shows a reproducible possible biphasiccurve; perhaps two aptamers exist withdifferent affinities to PDGF.As a control,buffer without PDGF was added to asecond solution. The control shows nochange in anisotropy as PDGF is added. The detection limit via the anisot-ropy change was found using 2 nM ap-tamer, using a bandpass filter instead ofan emission monochromator. PDGF-BBwas added stepwise, and a linear least- squares fit was performed on the fluo-rescence-intensity data, giving a detec-tion limit of ~0.22 nM PDGF-BB (Fig.5). Fig. 5. Anisotropy vs. [PDGF] in 2 nM aptamersolution. From the least-squares fit to the data, adetection limit of ~0.22 nM PDGF was found. Assay of protease activity A ribonuclease (RNase) is an en-zyme that hydrolyzes RNA into smallermolecules. Typical RNase probes pre-sent problems, because contaminationcan be difficult to identify. With sensitivefluoresence-polarization methods, re-sults are easier to determine. An exam-ple was performed on a Fluorolog@-3with double excitation monochromator.Fluorescein-labeled RNA (F-RNA) wasdigested for ≥ 1 h with RNase A at 37°C.The reaction was quenched with Tris-HCl at pH 8.0 in 0.125% sodium dodecylsulfonate. The reaction is given below: F-RNA RNase→F-nucleotides +F-oligomershighpolarization lowpolanzation The RNase is expected to lowerthe anisotropy as the RNA gets digestedinto smaller, more freely-rotating frag-ments. Fig. 7shows precisely this effect: as more RNase is added to the labeledRNA, the polarization falls, revealing theeffects of digestion. Fig. 7. Polarization vs. amount of RNase addedto 25 ng fluorescein-labeled RNA. Data weretaken after≥ 1 h for complete hydrolysis. Theanisotropy falls as more RNase is added, indi-cating increased fragmentation of the RNA. Phase studies Fig. 8. Anisotropy vs. temperature for a fluoro-phore in a lipid membrane. The anisotropy dropssuddenly at the transition temperature, indicatingfreer movement of the fluorophore. A lipid membrane shows a phasetransition with anisotropy data. As thetemperature rises (Fig. 8), a sharp dropin anisotropy appears at 41-42°C, indi-cating freer rotation of the fluorophore. immunoassays Theophylline is a drug for myo-cardial stimulation, increased coronary blood-flow, andl is; ai bronchiodilator.Fluorescence polarization of fluorescein-labeled theophylline is inversely relatedto drug concentration, as shown below. Theophylline in pH 7.2 buffer,fluorescein-labeled theophylline (Aexc =483 nm; Aem = 513 nm), and antiserumwere mixed and incubated for 3 min. Po-larization measurements (Fig. 9) wereperformed on a T-format Fluorolog withpolarizers. Free, labeled theophyllineshows P~ 0, while labeled theophyllinebound to the antibody gives P~0.27.Thus free and complexed drug can bedistinguished. Fig. 9. Polarization emission scan for labeledtheophylline with (red) and without (blue) anti-body (Nexc = 485 nm). The emission maximumfor labeled theophylline is marked by a gray line. A calibration curve (Fig. 10) fortheophylline was generated by settingthe monochromators to excitation andemission maxima.Eleven readings wereaveraged at each of six concentrations(0,2.5, 5, 10,20, and 40 pg/mL); inte-aration time =5 s. To test the calibration curve, atrial sample was created as shown in-Table 1. Three determinations of thesample gave P = 0.122±0.002, corre-sponding to [theophylline]=18.0±0.2ug/mL on the calibration curve, agreeingwith the original mixture's concentration. Table 1. Components of trial sample for testingthe calibration curve. 5 ug/mL salicylate 220 pg/mL 17.8 acetaminophen 217 pg/mL ug/mL 6.5 pg/mL meclofenamic 6.0 pg/mL 2.6 pg/mL phenobarbital 51.4 ug/mL 2.2 ng/mL lithium 1.2 meq/L Fig. 10. Calibration curve (blue line) for theo-phylline at various concentrations (green points).The purple point is a theophylline determinationfrom the trial mixture in Table 1. Two advantages are clear forfluorescence immunoassayyrmeasure-ments: No interference appears fromgentamicin, quinidine, salicylate:,, andacetaminophen, unlike in a normal fluo-rescence scan. Also, no separation stepis required unlike a radioimmunoassay. Conclusions Polarization measurements using HO-RIBA Jobin Yvon spectrofluorometersare a sensitive tool for probing manybiochemical interactions. Copyright C HORIBA Jobin Yvon; version .HORIBAExplore the future HORIBAExplore the future
确定

还剩2页未读,是否继续阅读?

产品配置单
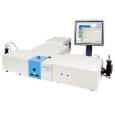
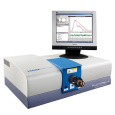
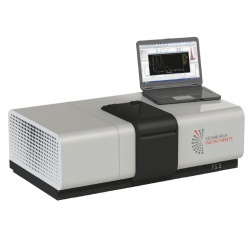
HORIBA(中国)为您提供《Fluorescence Anisotropy Studies》,该方案主要用于其他中--检测,参考标准--,《Fluorescence Anisotropy Studies》用到的仪器有HORIBA Fluorolog®-3科研级荧光光谱仪、HORIBA高灵敏一体式FluoroMax-4荧光光谱仪
推荐专场
相关方案
更多
该厂商其他方案
更多