


方案详情
文
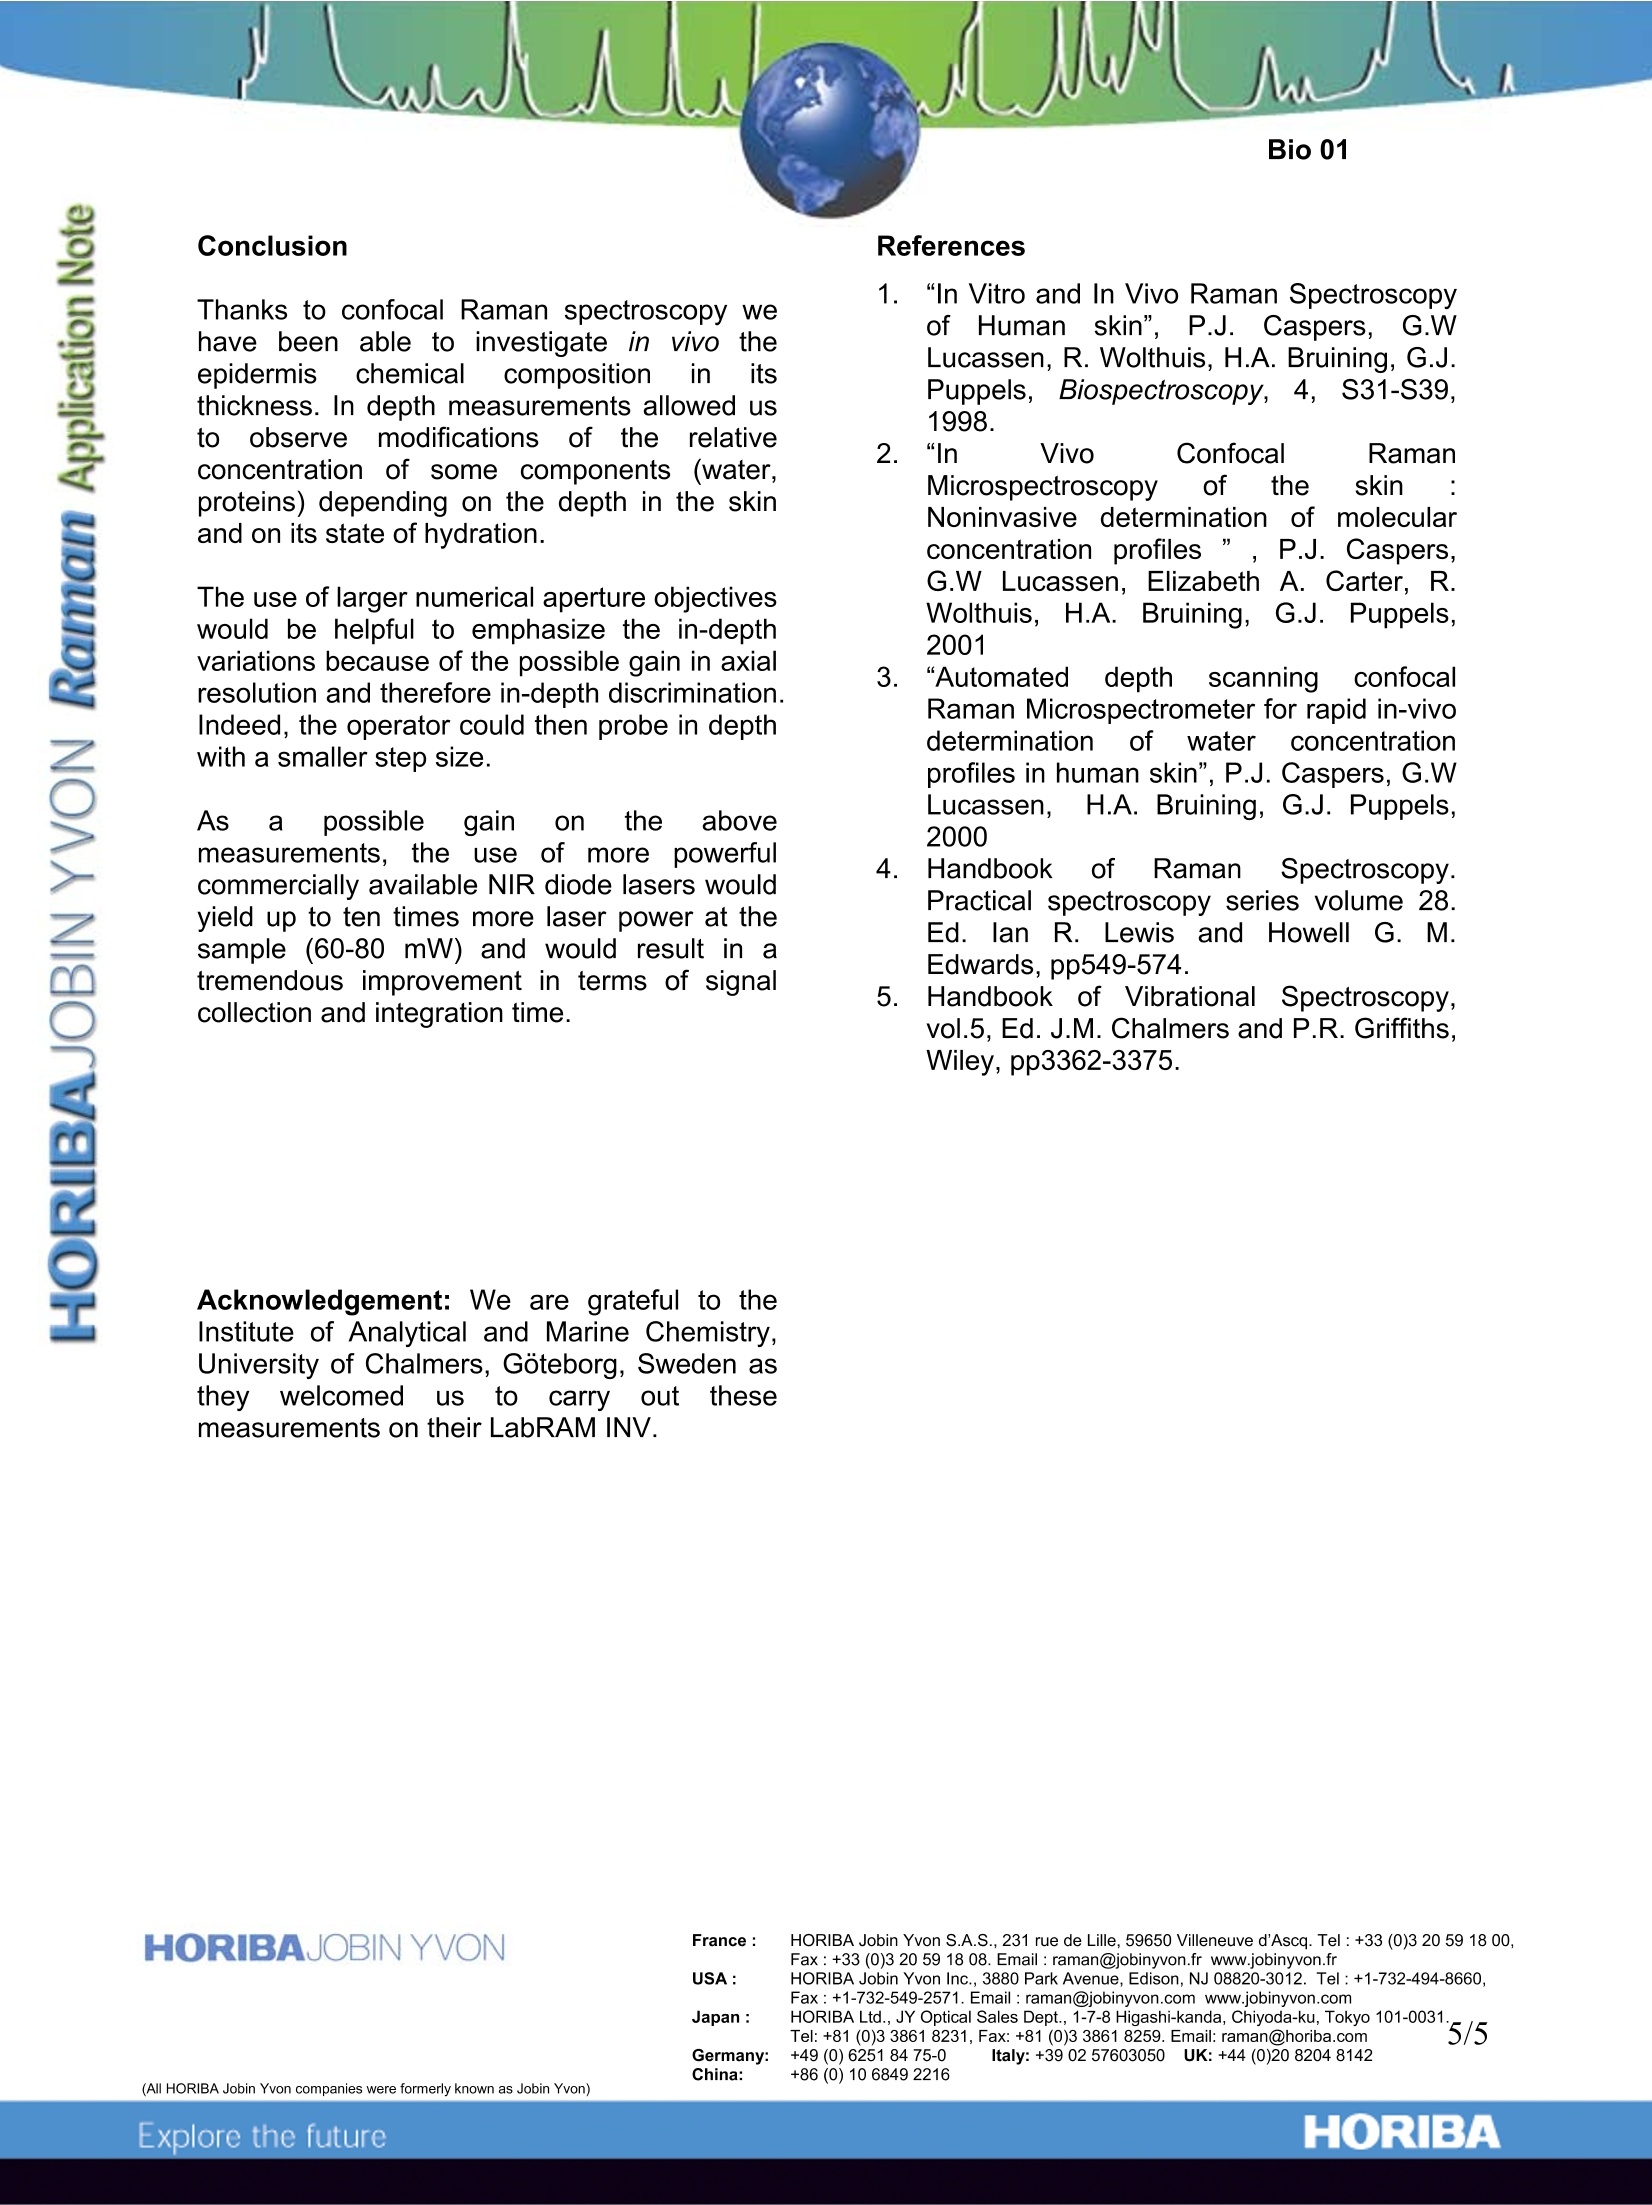
Thanks to confocal Raman spectroscopy we have been able to investigate in vivo the epidermis chemical composition in its thickness. In depth measurements allowed us to observe modifications of the relative concentration of some components (water, proteins) depending on the depth in the skin and on its state of hydration.
The use of larger numerical aperture objectives would be helpful to emphasize the in-depth variations because of the possible gain in axial resolution and therefore in-depth discrimination. Indeed, the operator could then probe in depth with a smaller step size.
As a possible gain on the above measurements, the use of more powerful commercially available NIR diode lasers would yield up to ten times more laser power at the sample (60-80 mW) and would result in a tremendous improvement in terms of signal collection and integration time.
?
方案详情

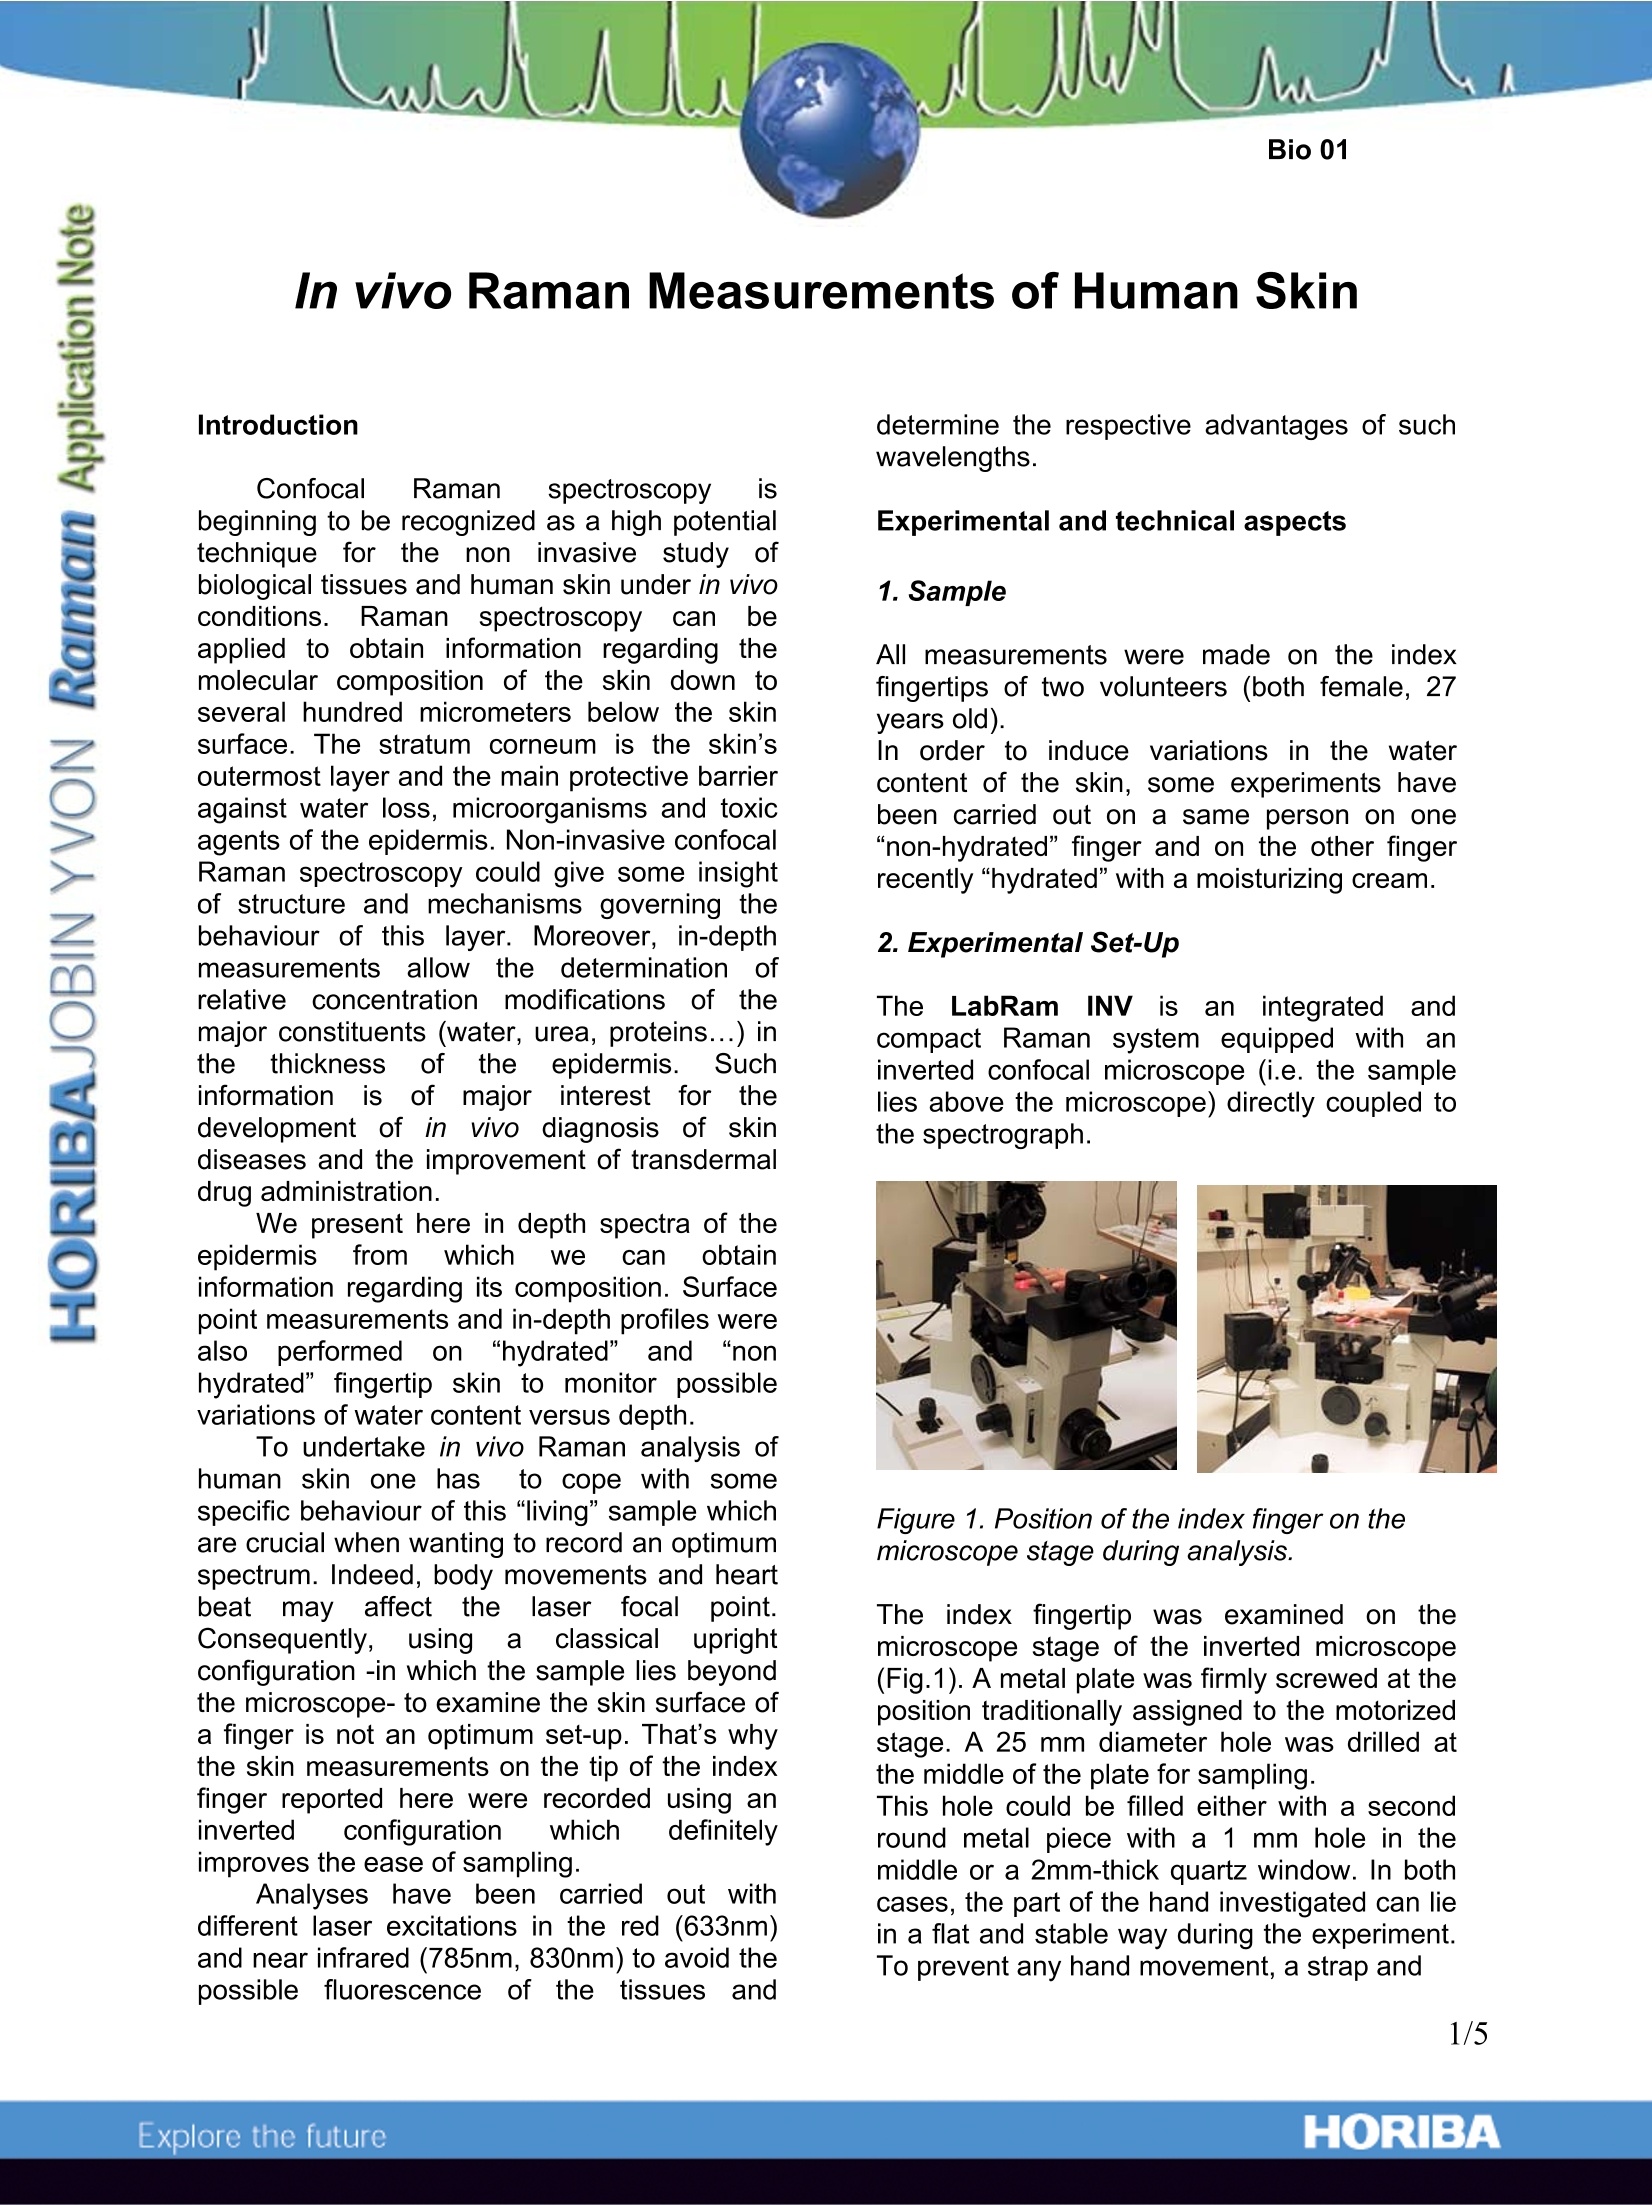
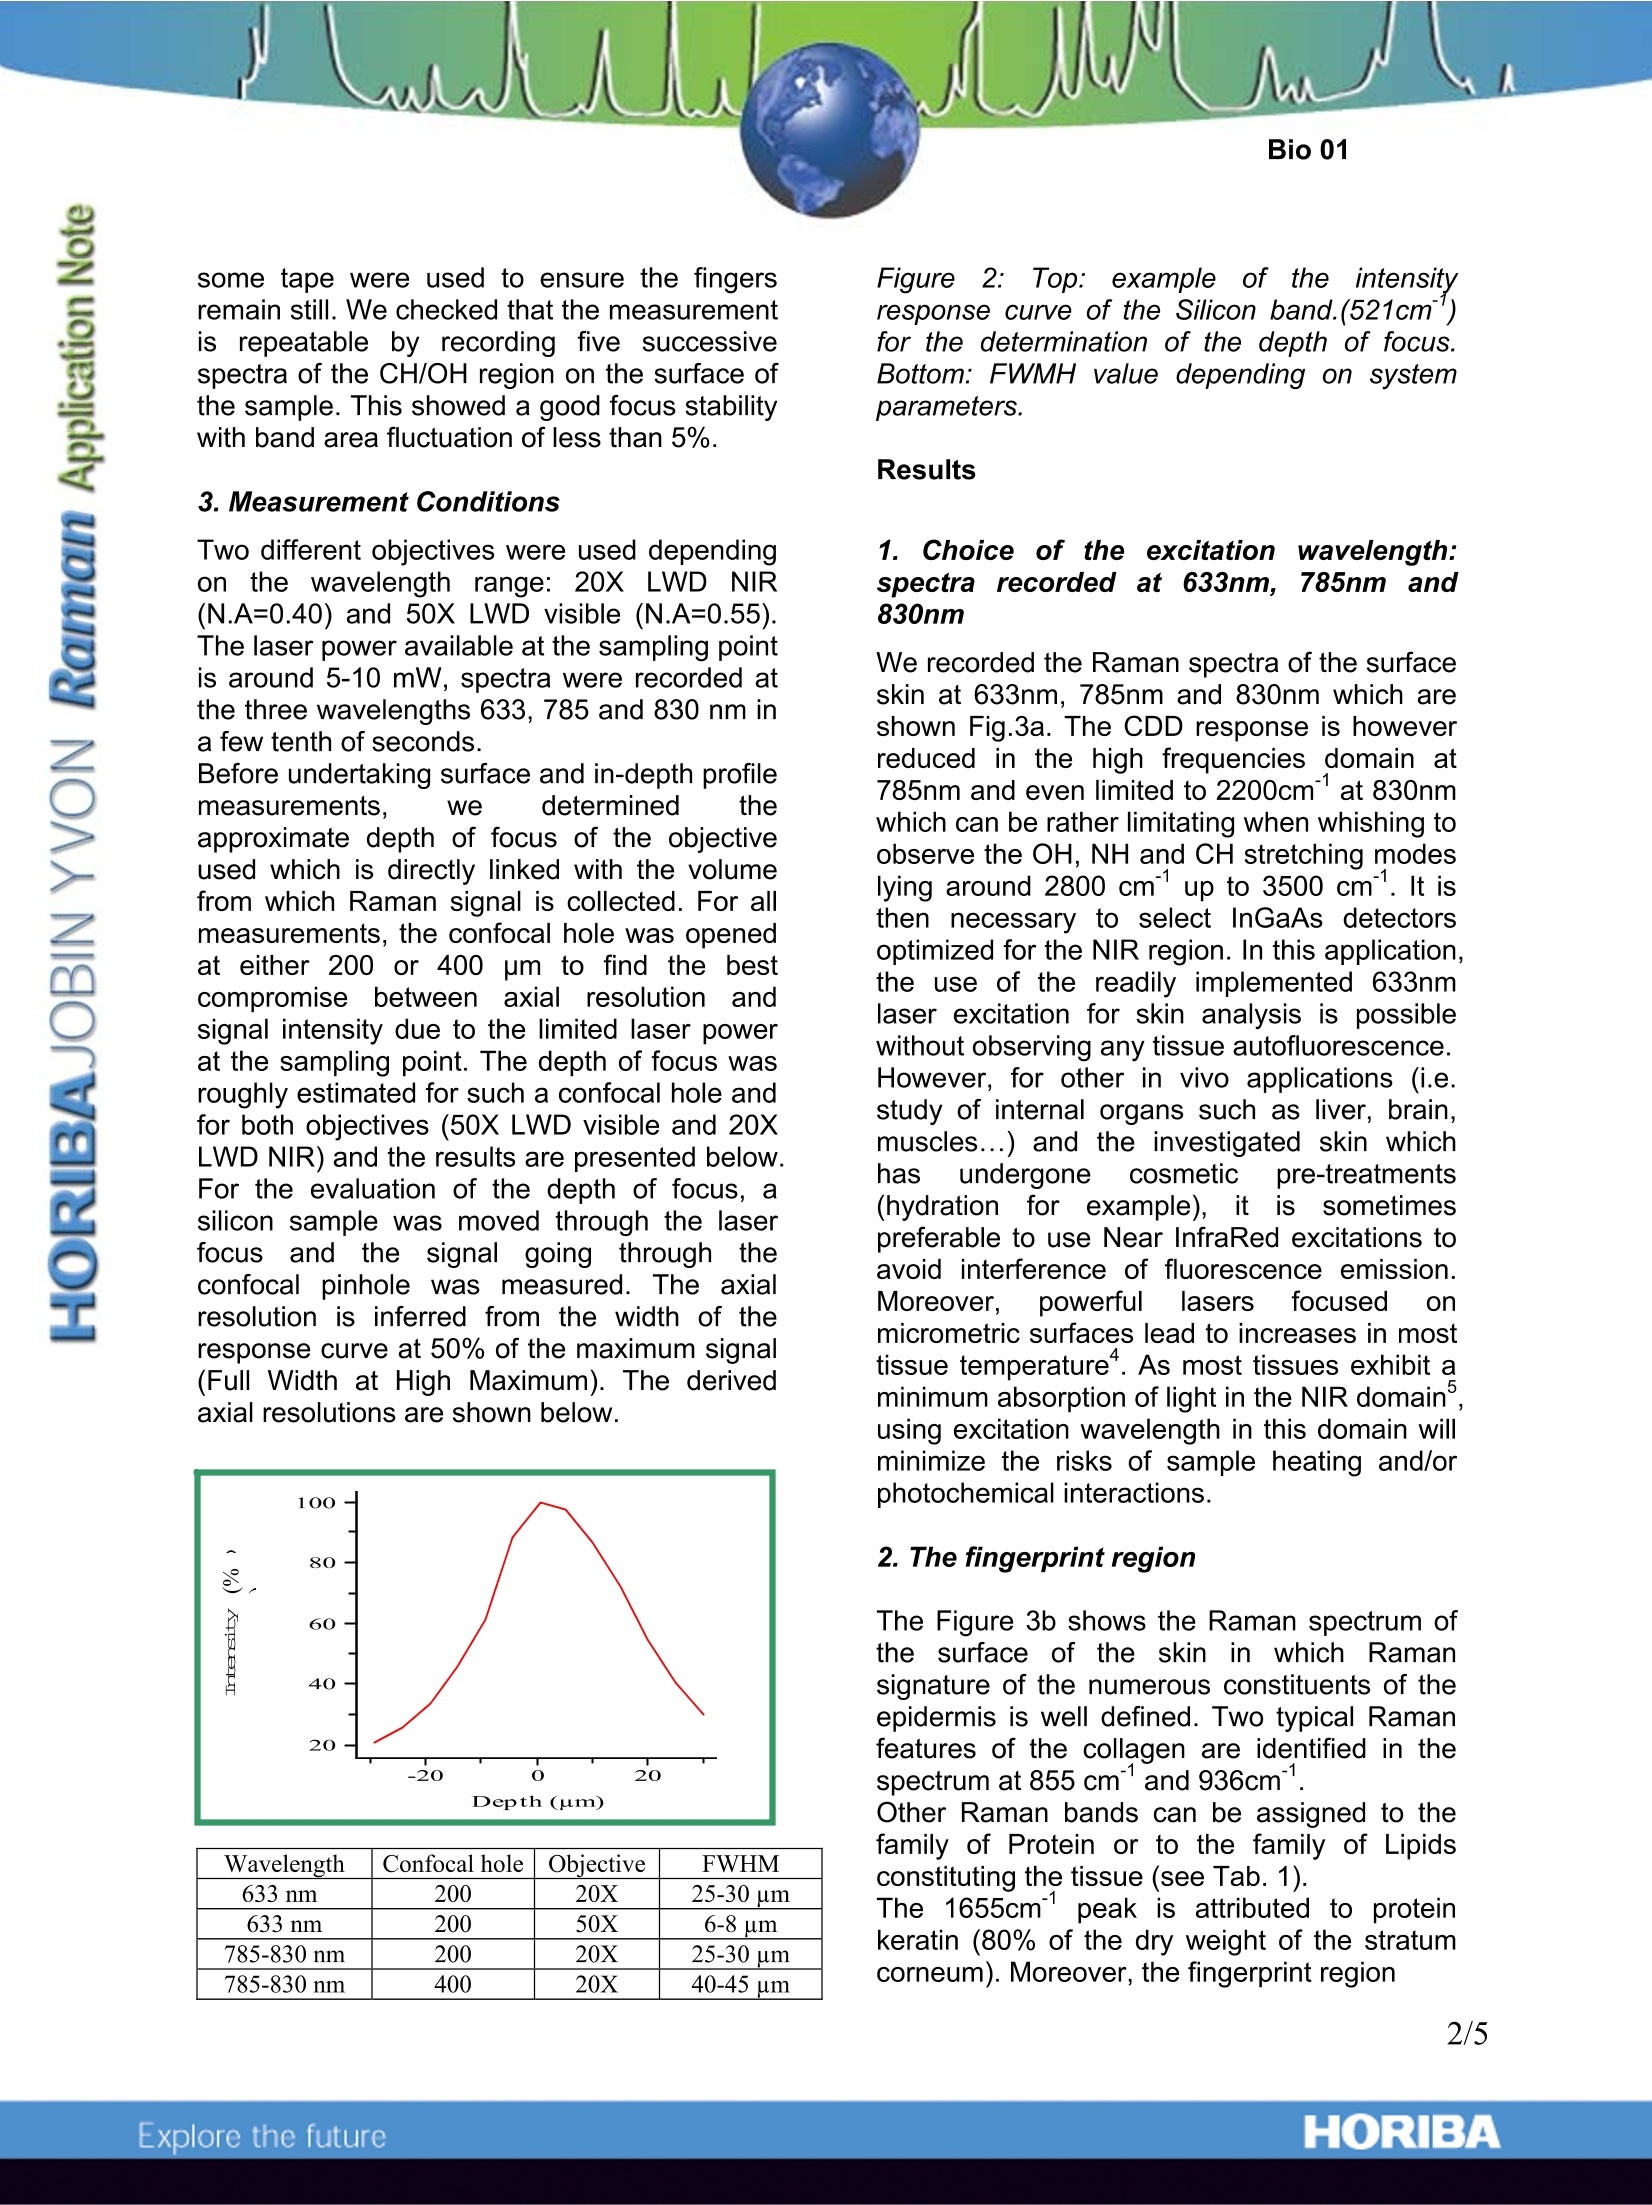
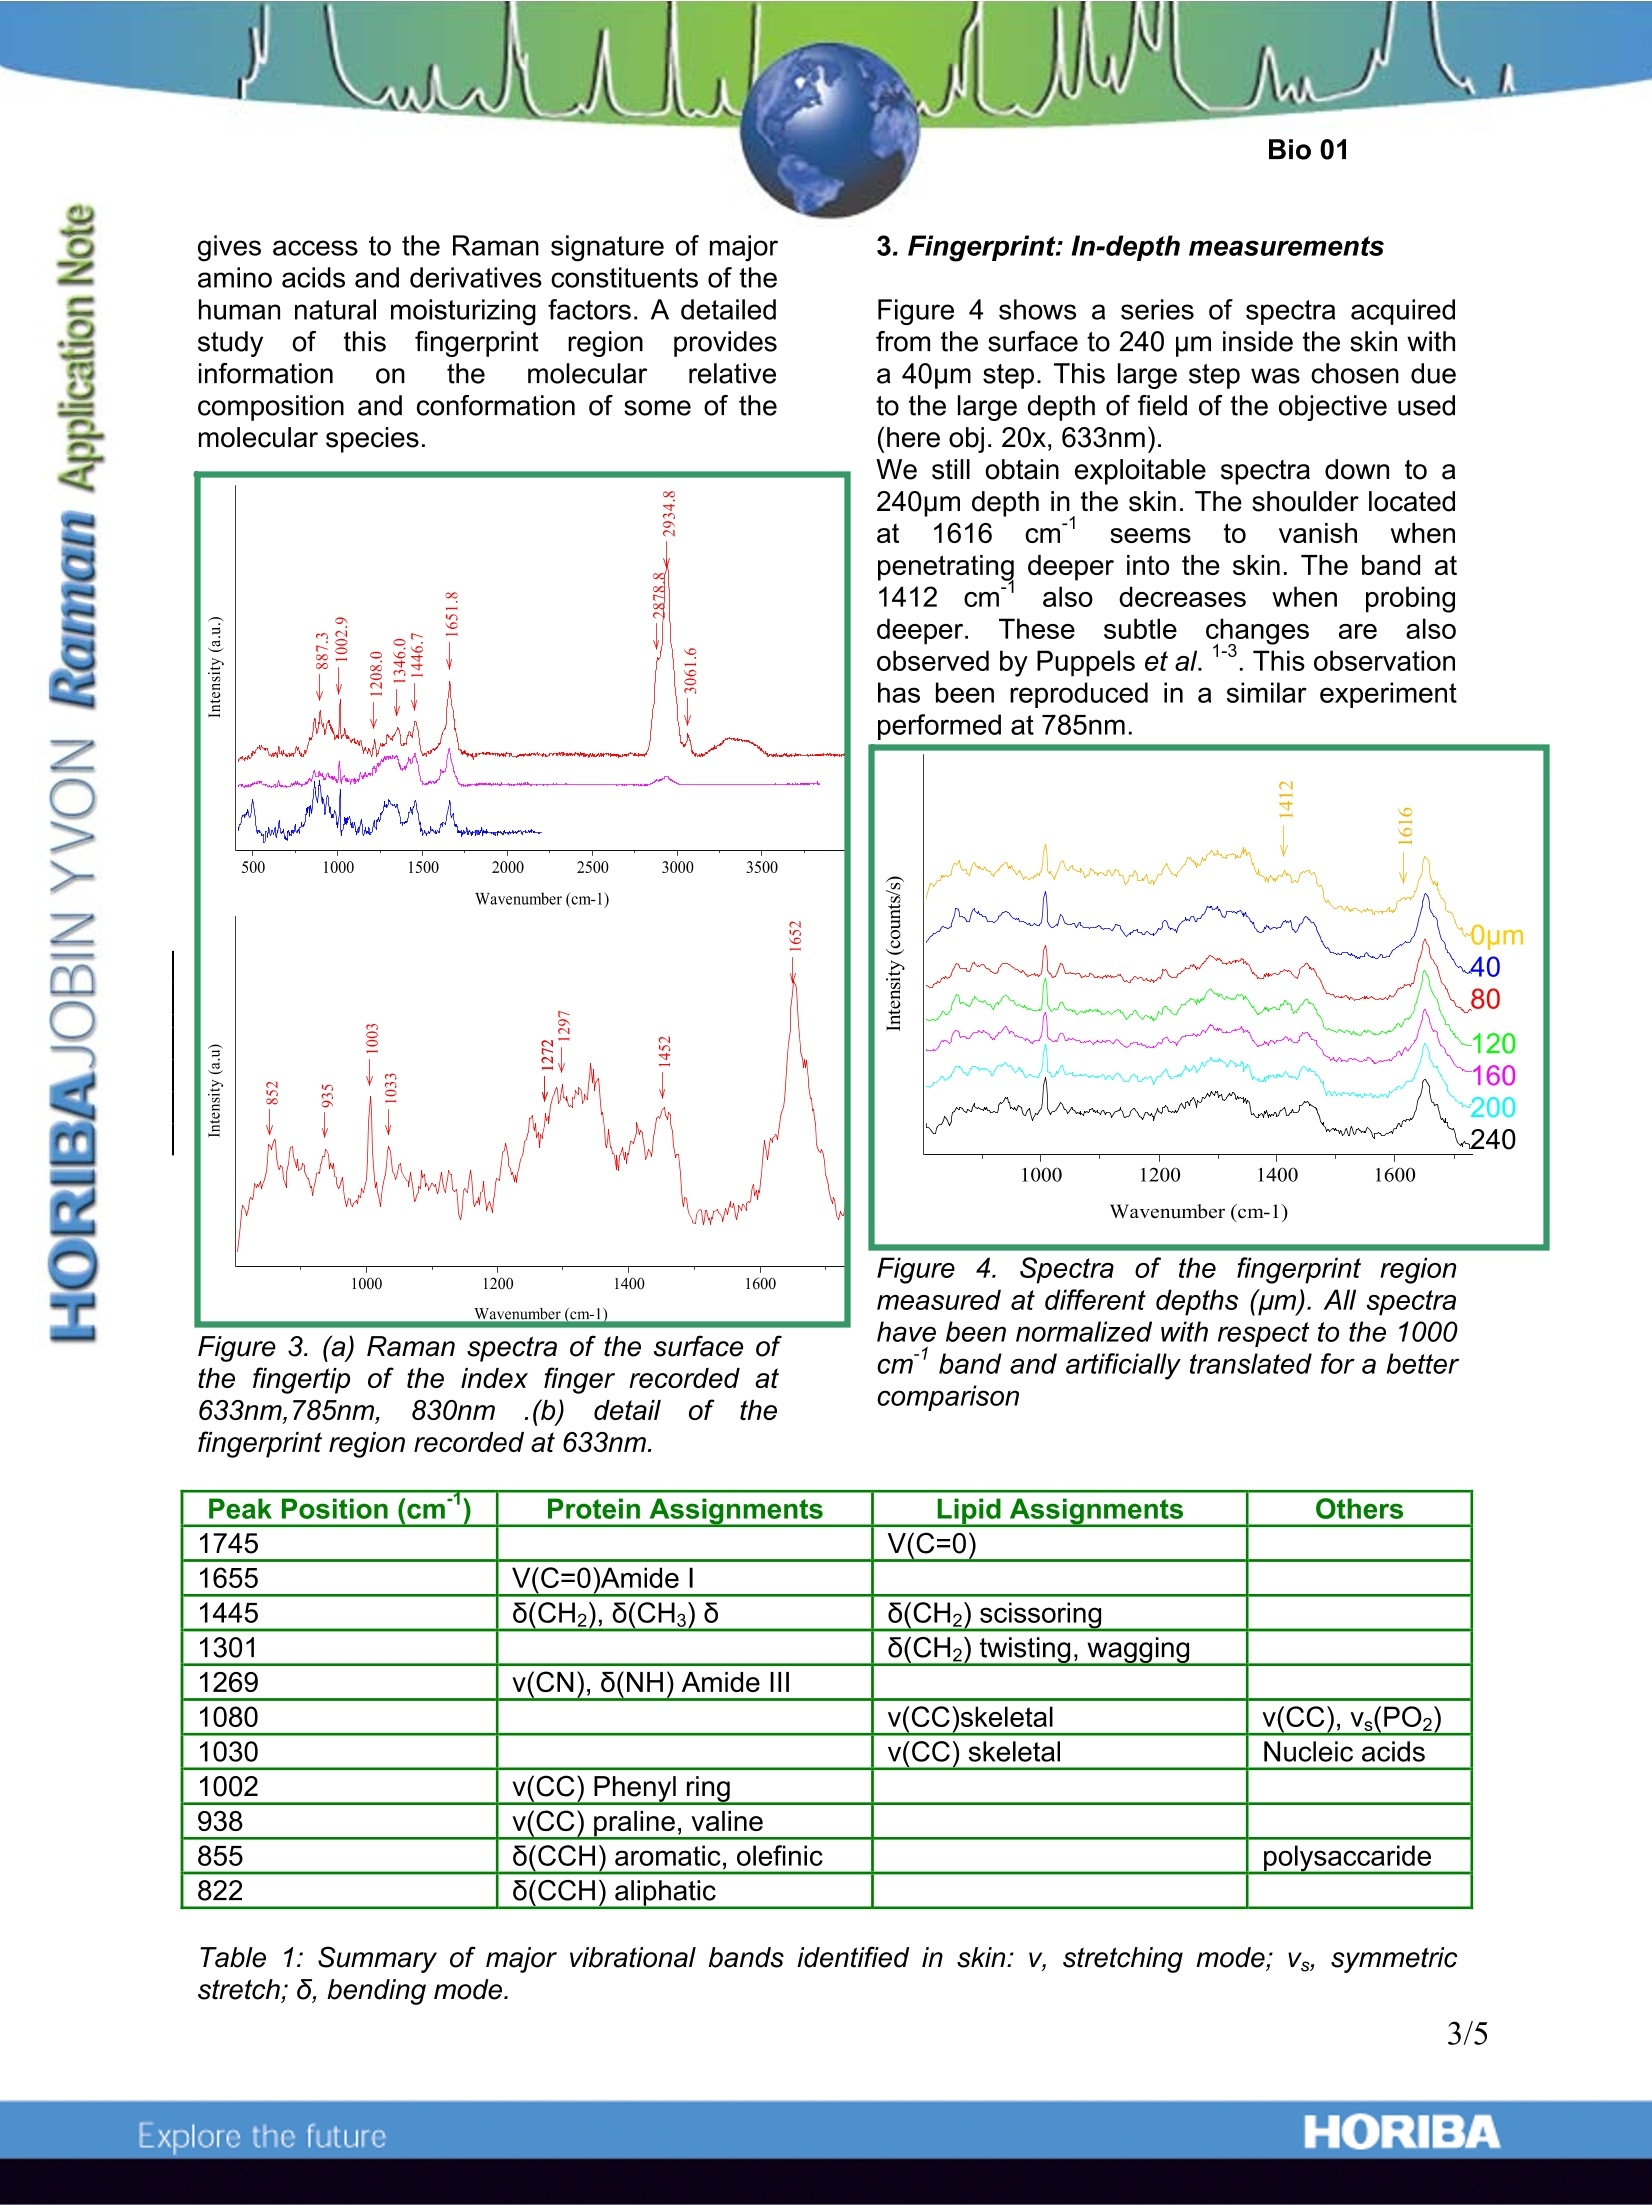
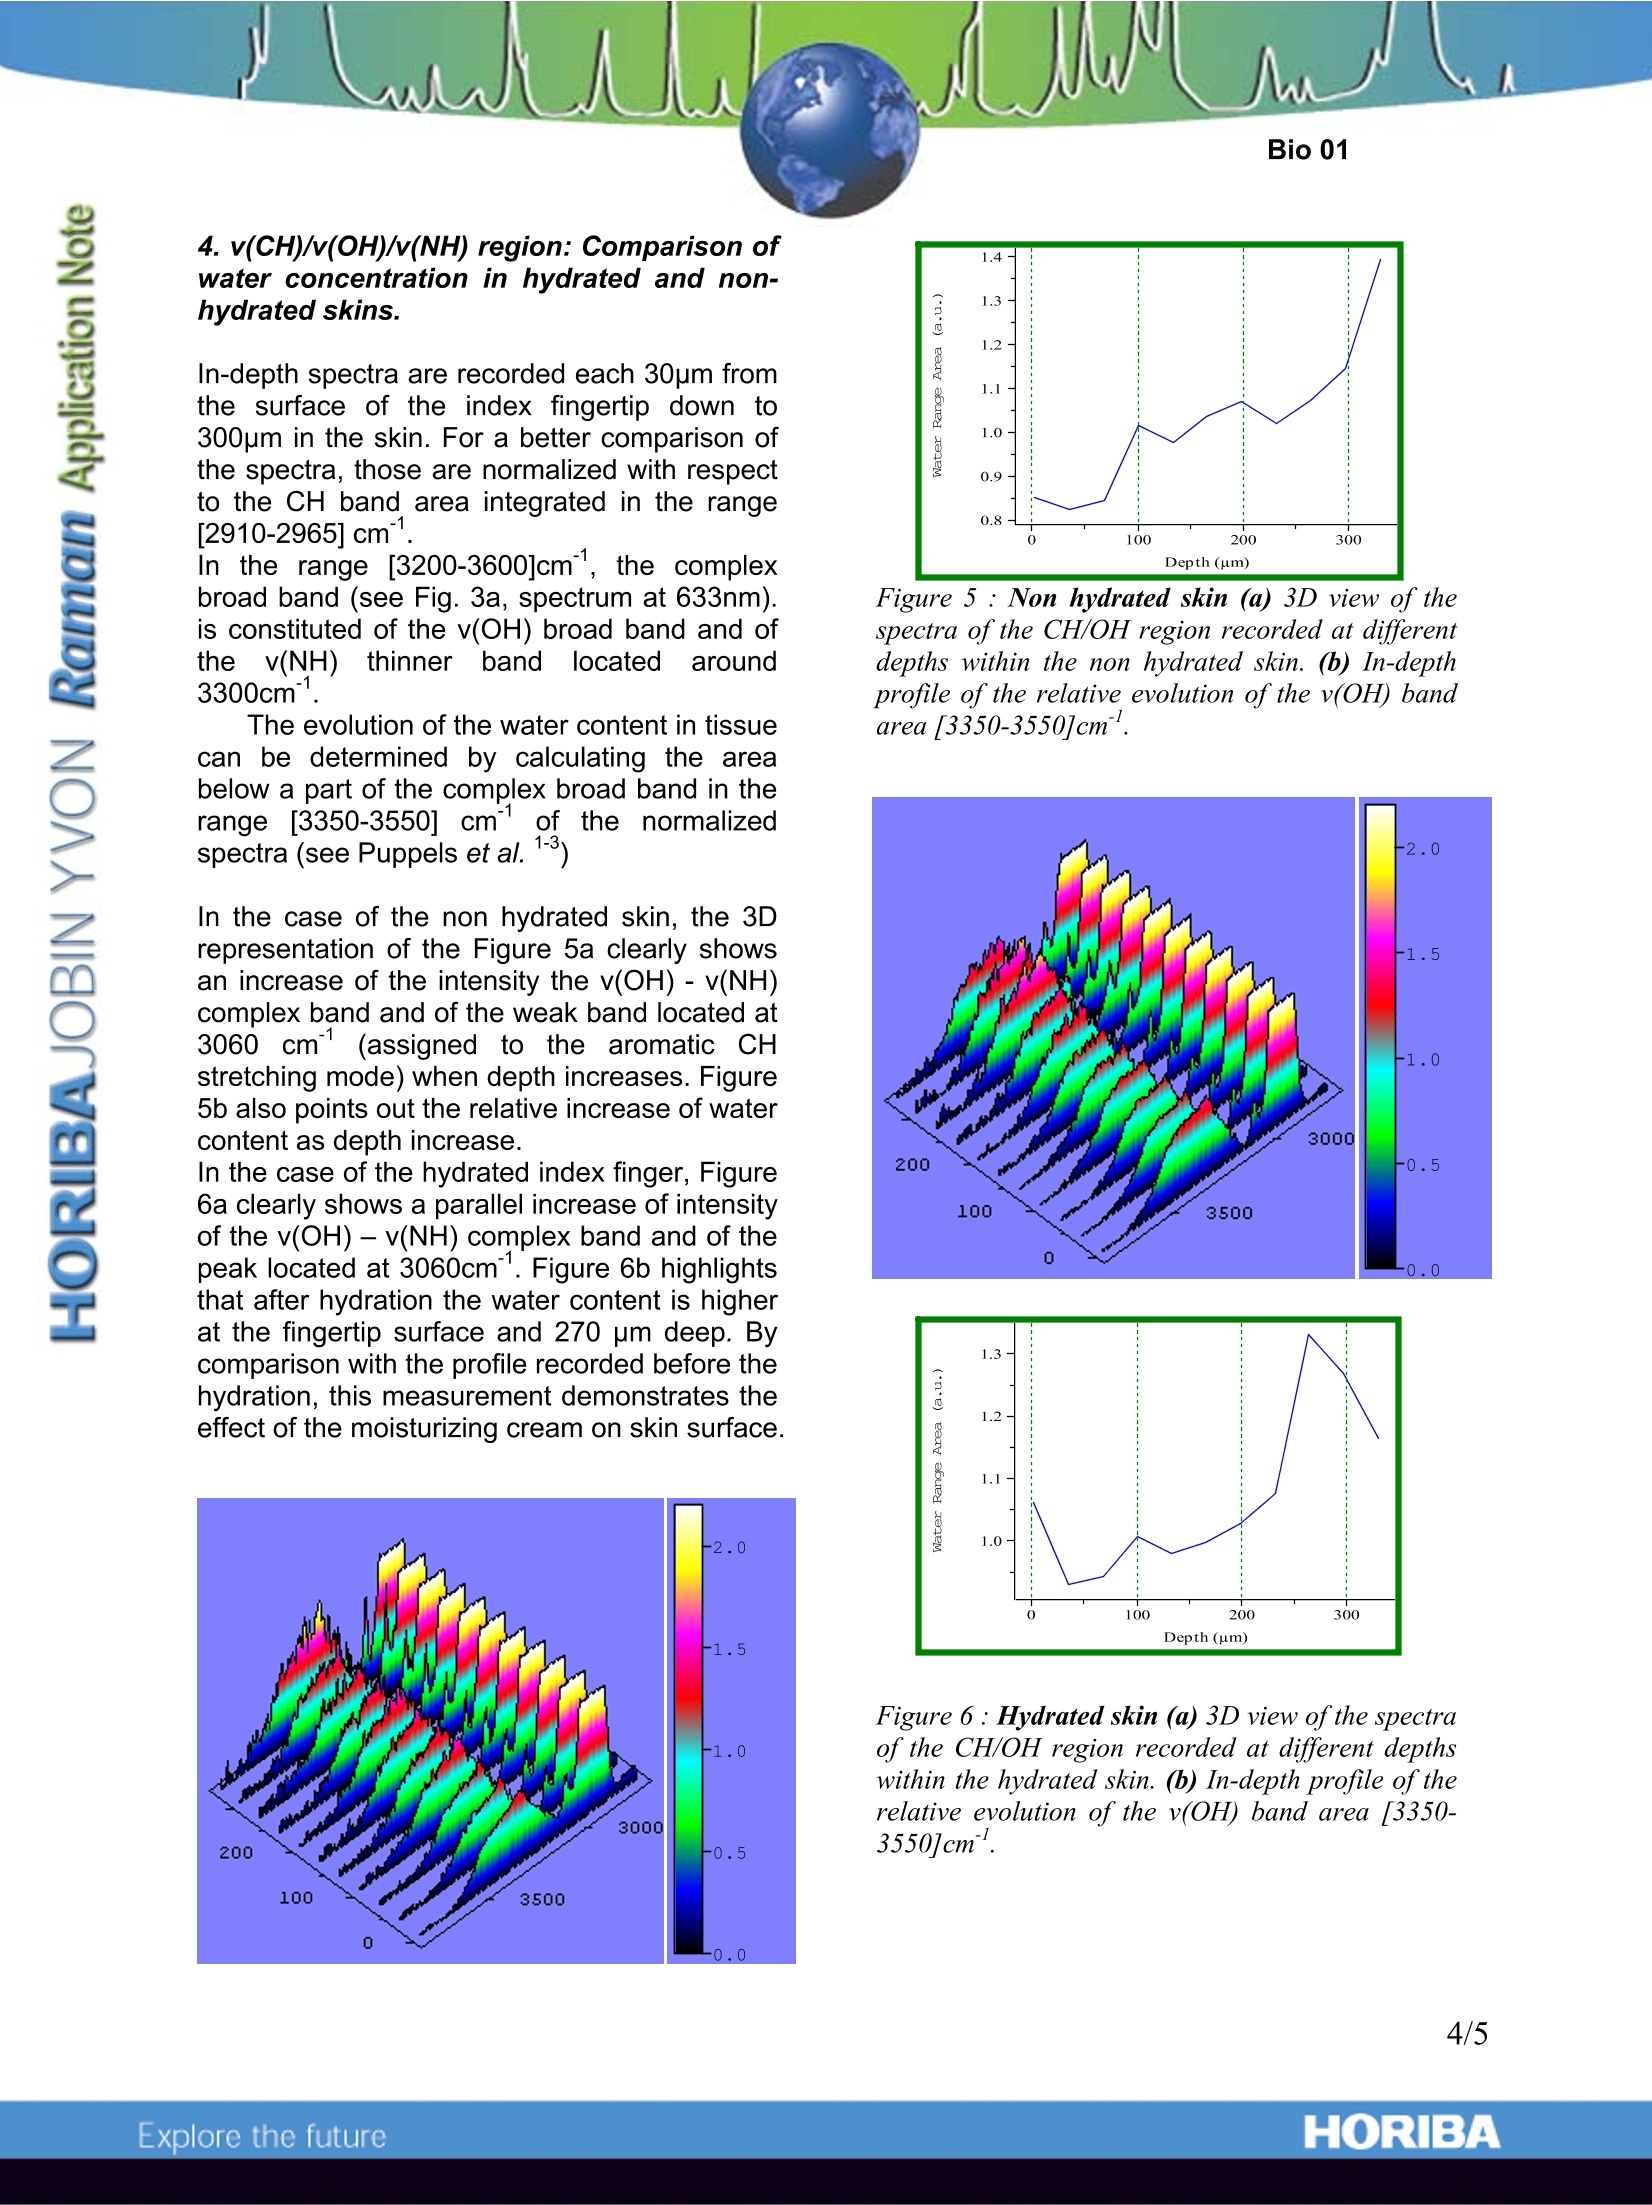
In vivo Raman Measurements of Human Skin Introduction Confocal Raman spectroscopy isbeginning to be recognized as a high potentialtechnique for the noninvasive study ofbiological tissues and human skin under in vivoconditions. Raman spectroscopy can beapplied to obtain information regarding themolecular composition of the skin down toseveral hundred micrometers below the skinsurface. The stratum corneum is the skin'soutermost layer and the main protective barrieragainst water loss, microorganisms and toxicagents of the epidermis. Non-invasive confocalRaman spectroscopy could give some insightof structure and mechanisms governing thebehaviour of this layer. Moreover, in-depthmeasurements allow the determination ofrelative concentrationmodifications of themajor constituents (water, urea, proteins...) inthethickness of the epidermis.5.Suchinformation iscof majorinterestfor tlthedevelopment of in1 vivo diagnosis of skindiseases and the improvement of transdermaldrug administration. We present here in depth spectra of theepidermisfromwhich we canobtaininformation regarding its composition. Surfacepoint measurements and in-depth profiles werealso performed on“hydrated” and “nonhydrated” fingertip skin to monitor possiblevariations of water content versus depth. To undertake in vivo Raman analysis ofhuman skin one has to cope with somespecific behaviour of this “living”sample whichare crucial when wanting to record an optimumspectrum. Indeed, body movements and heartbeatmayyaffectt thelaser ffocal 【point.Consequently, using a classicalaltuprightconfiguration -in which the sample lies beyondthe microscope- to examine the skin surface ofa finger is not an optimum set-up. That’s whythe skin measurements on the tip of the indexfinger reported here were recorded using aninverted configuration which definitelyimproves the ease of sampling. Analyses have been carried out withdifferent laser excitations in the red (633nm)and near infrared (785nm,830nm) to avoid thepossibleeftluorescenceofthe tissues and determine the respective advantages of suchwavelengths. Experimental and technical aspects 1. Sample All measurements were made on the indexfingertips of two volunteers (both female, 27years old). In order to induce variations in the watercontent of the skin, some experiments havebeen carried out on a same person on one"non-hydrated”finger and on the other fingerrecently “hydrated” with a moisturizing cream. 2. Experimental Set-Up TheLabRamnINV lis anintegratedaandcompact Raman system equipped with aninverted confocal microscope (i.e. the samplelies above the microscope) directly coupled tothe spectrograph. Figure 1. Position of the index finger on themicroscope stage during analysis. The index fingertip was examined on themicroscope stage of the inverted microscope(Fig.1). A metal plate was firmly screwed at theposition traditionally assigned to the motorizedstage. A 25 mm diameter hole was drilled atthe middle of the plate for sampling. This hole could be filled either with a secondround metal piece with a 1 mm hole in themiddle or a 2mm-thick quartz window. In bothcases, the part of the hand investigated can liein a flat and stable way during the experiment.To prevent any hand movement, a strap and some tape were used to ensure the fingersremain still. We checked that the measurementis repeatable by recording five successivespectra of the CH/OH region on the surface ofthe sample. This showed a good focus stabilitywith band area fluctuation of less than 5%. 3. Measurement Conditions Two different objectives were used dependingon the wavelength range: 20X LWD NIR(N.A=0.40) and 50X LWD visible (N.A=0.55).The laser power available at the sampling pointis around 5-10 mW,spectra were recorded atthe three wavelengths 633, 785 and 830 nm ina few tenth of seconds. Before undertaking surface and in-depth profilemeasurements. We determined theapproximate depth of focus of the objectiveused which is directly linked with the volumefrom which Raman signal is collected. For allmeasurements, the confocal hole was openedat either 200 or 400 um to find the bestcompromise betweenaxial resolution1 andsignal intensity due to the limited laser powerat the sampling point. The depth of focus wasroughly estimated for such a confocal hole andfor both objectives (50X LWD visible and 20XLWD NIR) and the results are presented below.For the evaluation of the depth of focus, asilicon sample was moved through the laserfouS nd the signal going through theconfocal pinhole was measured. The axialresolution is inferred from the width of theresponse curve at 50% of the maximum signal(Full Width at High Maximum). The derivedaxial resolutions are shown below. Wavelength Confocal hole Objective FWHM 633 nm 200 20X 25-30 um 633 nm 200 50X 6-8 um 785-830 nm 200 20X 25-30 um 785-830 nm 400 20X 40-45 um Figure 22:?:Top: example of the intensityresponse curve of the Silicon band.(521cm)for the determination of the depth of focus.Bottom: FWMH value depending on systemparameters. Results 1. Choice of the excitation? wavelength:spectra recorded at 633nm,,785nm and830nm We recorded the Raman spectra of the surfaceskin at 633nm, 785nm and 830nm which areshown Fig.3a. The CDD response is howeverreduced in the high frequencies domain at785nm and even limited to 2200cmat 830nmwhich can be rather limitating when whishing toobserve the OH, NH and CH stretching modeslying around 2800 cm" up to 3500 cm". It isthen necessary to select InGaAs detectorsoptimized for the NIR region. In this application,the use of the readily implemented 633nmlaser excitation for skin analysis is possiblewithout observing any tissue autofluorescence.However, for other in vivo applications (i.e.study of internal organs such as liver, brain,muscles...) and the investigated skin whichhas undergone cosmetic pre-treatments(hydration for example), it i:issometimespreferable to use Near InfraRed excitations toavoid interference of fluorescence emission.Moreover.,powerfullllasers focusedonmicrometric surfaces lead to increases in mosttissue temperature". As most tissues exhibit aminimum absorption of light in the NIR domain,using excitation wavelength in this domain willminimize the risks of sample heating and/orphotochemical interactions. 2. The fingerprint region The Figure 3b shows the Raman spectrum ofthe surface of the skin in which Ramansignature of the numerous constituents of theepidermis is well defined. Two typical Ramanfeatures of the collagen are identified in thespectrum at 855 cmand 936cm. Other Raman bands can be assigned to thefamily of Protein or to the family of Lipidsconstituting the tissue (see Tab.1). The 1655cm peak is attributed to proteinkeratin (80% of the dry weight of the stratumcorneum). Moreover, the fingerprint region gives access to the Raman signature of majoramino acids and derivatives constituents of thehuman natural moisturizing factors. A detailedstudy of this fingerprint region rprovidesinformation on thee molecular rreelativecomposition and conformation of some of themolecular species. Wavenumber (cm-1) Figure 3. (a) Raman spectra of the surface ofthe fingertip of the index finger recorded at633nm,785nm, 830nm .(b) detail ofthefingerprint region recorded at 633nm. 3. Fingerprint: In-depth measurements Figure 4 shows a series of spectra acquiredfrom the surface to 240 pm inside the skin witha 40pm step. This large step was chosen dueto the large depth of field of the objective used(here obj. 20x, 633nm). We still obtain exploitable spectra down to a240pm depth in the skin. The shoulder locatedat 1616 cm1seems; to) vanish whenpenetratingdeeper into the skin. The band at1412 cm alsodecreases whenprobingdeeper.. These subtle cchanges; arealsoobserved by Puppels et al.. This observationhas been reproduced in a similar experimentperformed at 785nm. Figure 4. Spectra of the fingerprint regionmeasured at different depths (um). All spectrahave been normalized with respect to the 1000cm-7band and artificially translated for a bettercomparison Peak Position (cm° Protein Assignments Lipid Assignments Others 1745 V(C=0) 1655 V(C=0)Amide1 1445 8(CH2),8(CH3)8 8(CH2) scissoring 1301 8(CH2) twisting, wagging 1269 v(CN), 8(NH) Amide III 1080 v(CC)skeletal v(CC), V (PO2) 1030 Vv(CC) skeletal Nucleic acids 1002 v(CC) Phenyl ring 938 v(CC) praline, valine 855 8(CCH) aromatic, olefinic polysaccaride 822 8(CCH)aliphatic Table 1: Summary of major vibrational bands identified in skin: v, stretching mode; Vs, symmetricstretch; 8, bending mode. 4. v(CH)/v(OH)/v(NH) region: Comparison ofwater concentration in hydrated and non-hydrated skins. In-depth spectra are recorded each 30um fromthe surface of the index fingertip down to300um in the skin. For a better comparison ofthe spectra, those are normalized with respectto the CH band area integrated in the range[2910-2965]cm". In the range [3200-3600]cm", the complexbroad band (see Fig. 3a, spectrum at 633nm).iIsS cCOonstituted of the v(OH) broad band and ofthe v(NH)thinner band located around3300cm. The evolution of the water content in tissuecan be determined by calculating the areabelow a part of the complex broad band in therange [3350-3550] cmthee normalizedofspectra (see Puppels et al. In the case of the non hydrated skin, the 3Drepresentation of the Figure 5a clearly showsan increase of the intensity the v(OH)-v(NH)complex band and of the weak band located at3060 cm (assigned to the aromatic CHstretching mode) when depth increases. Figure5b also points out the relative increase of watercontent as depth increase. In the case of the hydrated index finger, Figure6a clearly shows a parallel increase of intensityof the v(OH)-V(NH) complex band and of thepeak located at 3060cm". Figure 6b highlightsthat after hydration the water content is higherat the fingertip surface and 270 pm deep. Bycomparison with the profile recorded before thehydration, this measurement demonstrates theeffect of the moisturizing cream on skin surface. Figure 5 : Non hydrated skin (a) 3D view of thespectra ofthe CH/OH region recorded at differentdepths within the non hydrated skin. (b) In-depthprofile of the relative evolution ofthe v(OH) bandarea [3350-3550]cm . Figure 6: Hydrated skin (a) 3D view of the spectraof the CH/OH region recorded at different depthswithin the hydrated skin. (b) In-depth profile oftherelative evolution of the v(OH) band area [3350-3550]cm. Conclusion Thanks to confocal Raman spectroscopy wehave been able to investigate in vivo theepidermischemical composition in itsthickness. In depth measurements allowed usto observe modificationss of theerrelativeconcentration of some components(water,proteins) depending on the depth in the skinand on its state of hydration. The use of larger numerical aperture objectiveswould be helpful to emphasize the in-depthvariations because of the possible gain in axialresolution and therefore in-depth discrimination.Indeed, the operator could then probe in depthwith a smaller step size. As a possible gain on the abovemeasurements, theusee of morepowerfulcommercially available NIR diode lasers wouldyield up to ten times more laser power at thesample (60-80 mW) and would result in atremendous improvement in terms of signalcollection and integration time. Acknowledgement: We are grateful to theInstitute of Analytical and Marine Chemistry,University of Chalmers, Goteborg, Sweden astheywelcomedusto)carryoutthesemeasurements on their LabRAM INV. References 1.“In Vitro and In Vivo Raman Spectroscopyof Human skin", P.J. Caspers, G.WLucassen, R. Wolthuis, H.A. Bruining, G.J.Puppels,,Biospectroscopy,4. S31-S39.1998. 2. "In Vivo Confocal RamanMicrospectroscopy oftlthe skinNoninvasive determination of molecularconcentration profiles ”, P.J. Caspers,G.W Lucassen, Elizabeth A. Carter, R.Wolthuis, H.A. Bruining, G.J.Puppels,2001 3. "Automatedd(depthscanninigg confocalRaman Microspectrometer for rapid in-vivodeterminationof waterr concentrationprofiles in human skin", P.J. Caspers, G.WLucassen. H.A. Bruining, G.J. Puppels,2000 4.FHandbook of Raman Spectroscopy.Practical spectroscopy series volume 28.Ed. lan R. Lewis and Howell G. M.Edwards, pp549-574. 5. Handbook of Vibrational Spectroscopy,vol.5, Ed.J.M. Chalmers and P.R. Griffiths,Wiley, pp3362-3375. ORIBAExplore the future Thanks to confocal Raman spectroscopy we have been able to investigate in vivo the epidermis chemical composition in its thickness. In depth measurements allowed us to observe modifications of the relative concentration of some components (water, proteins) depending on the depth in the skin and on its state of hydration.The use of larger numerical aperture objectives would be helpful to emphasize the in-depth variations because of the possible gain in axial resolution and therefore in-depth discrimination. Indeed, the operator could then probe in depth with a smaller step size.As a possible gain on the above measurements, the use of more powerful commercially available NIR diode lasers would yield up to ten times more laser power at the sample (60-80 mW) and would result in a tremendous improvement in terms of signal collection and integration time.
确定
还剩3页未读,是否继续阅读?

产品配置单
HORIBA(中国)为您提供《人类皮肤活体中化学组成及分布检测方案(激光拉曼光谱)》,该方案主要用于上皮脱落细胞中化学组成及分布检测,参考标准--,《人类皮肤活体中化学组成及分布检测方案(激光拉曼光谱)》用到的仪器有HORIBA XploRA INV多功能拉曼及成像光谱仪
推荐专场


相关方案
更多
该厂商其他方案
更多