


以创建反相高压液相色谱(HPLC)方法来确定在用过的食用油聚合三酰基甘油酯,使用单校准,因为被控气溶胶检测与非易失性的普遍性的演示分析物。
?使用非多孔C18柱的三元梯度,高效液相色谱法的开发是为了分离和定量聚合三酰基甘油酯作为尖峰和没有一个标准。该方法是定量为使用单一,线性校准标准的三酰基甘油酯和聚合的三酰基甘油酯。
方案详情

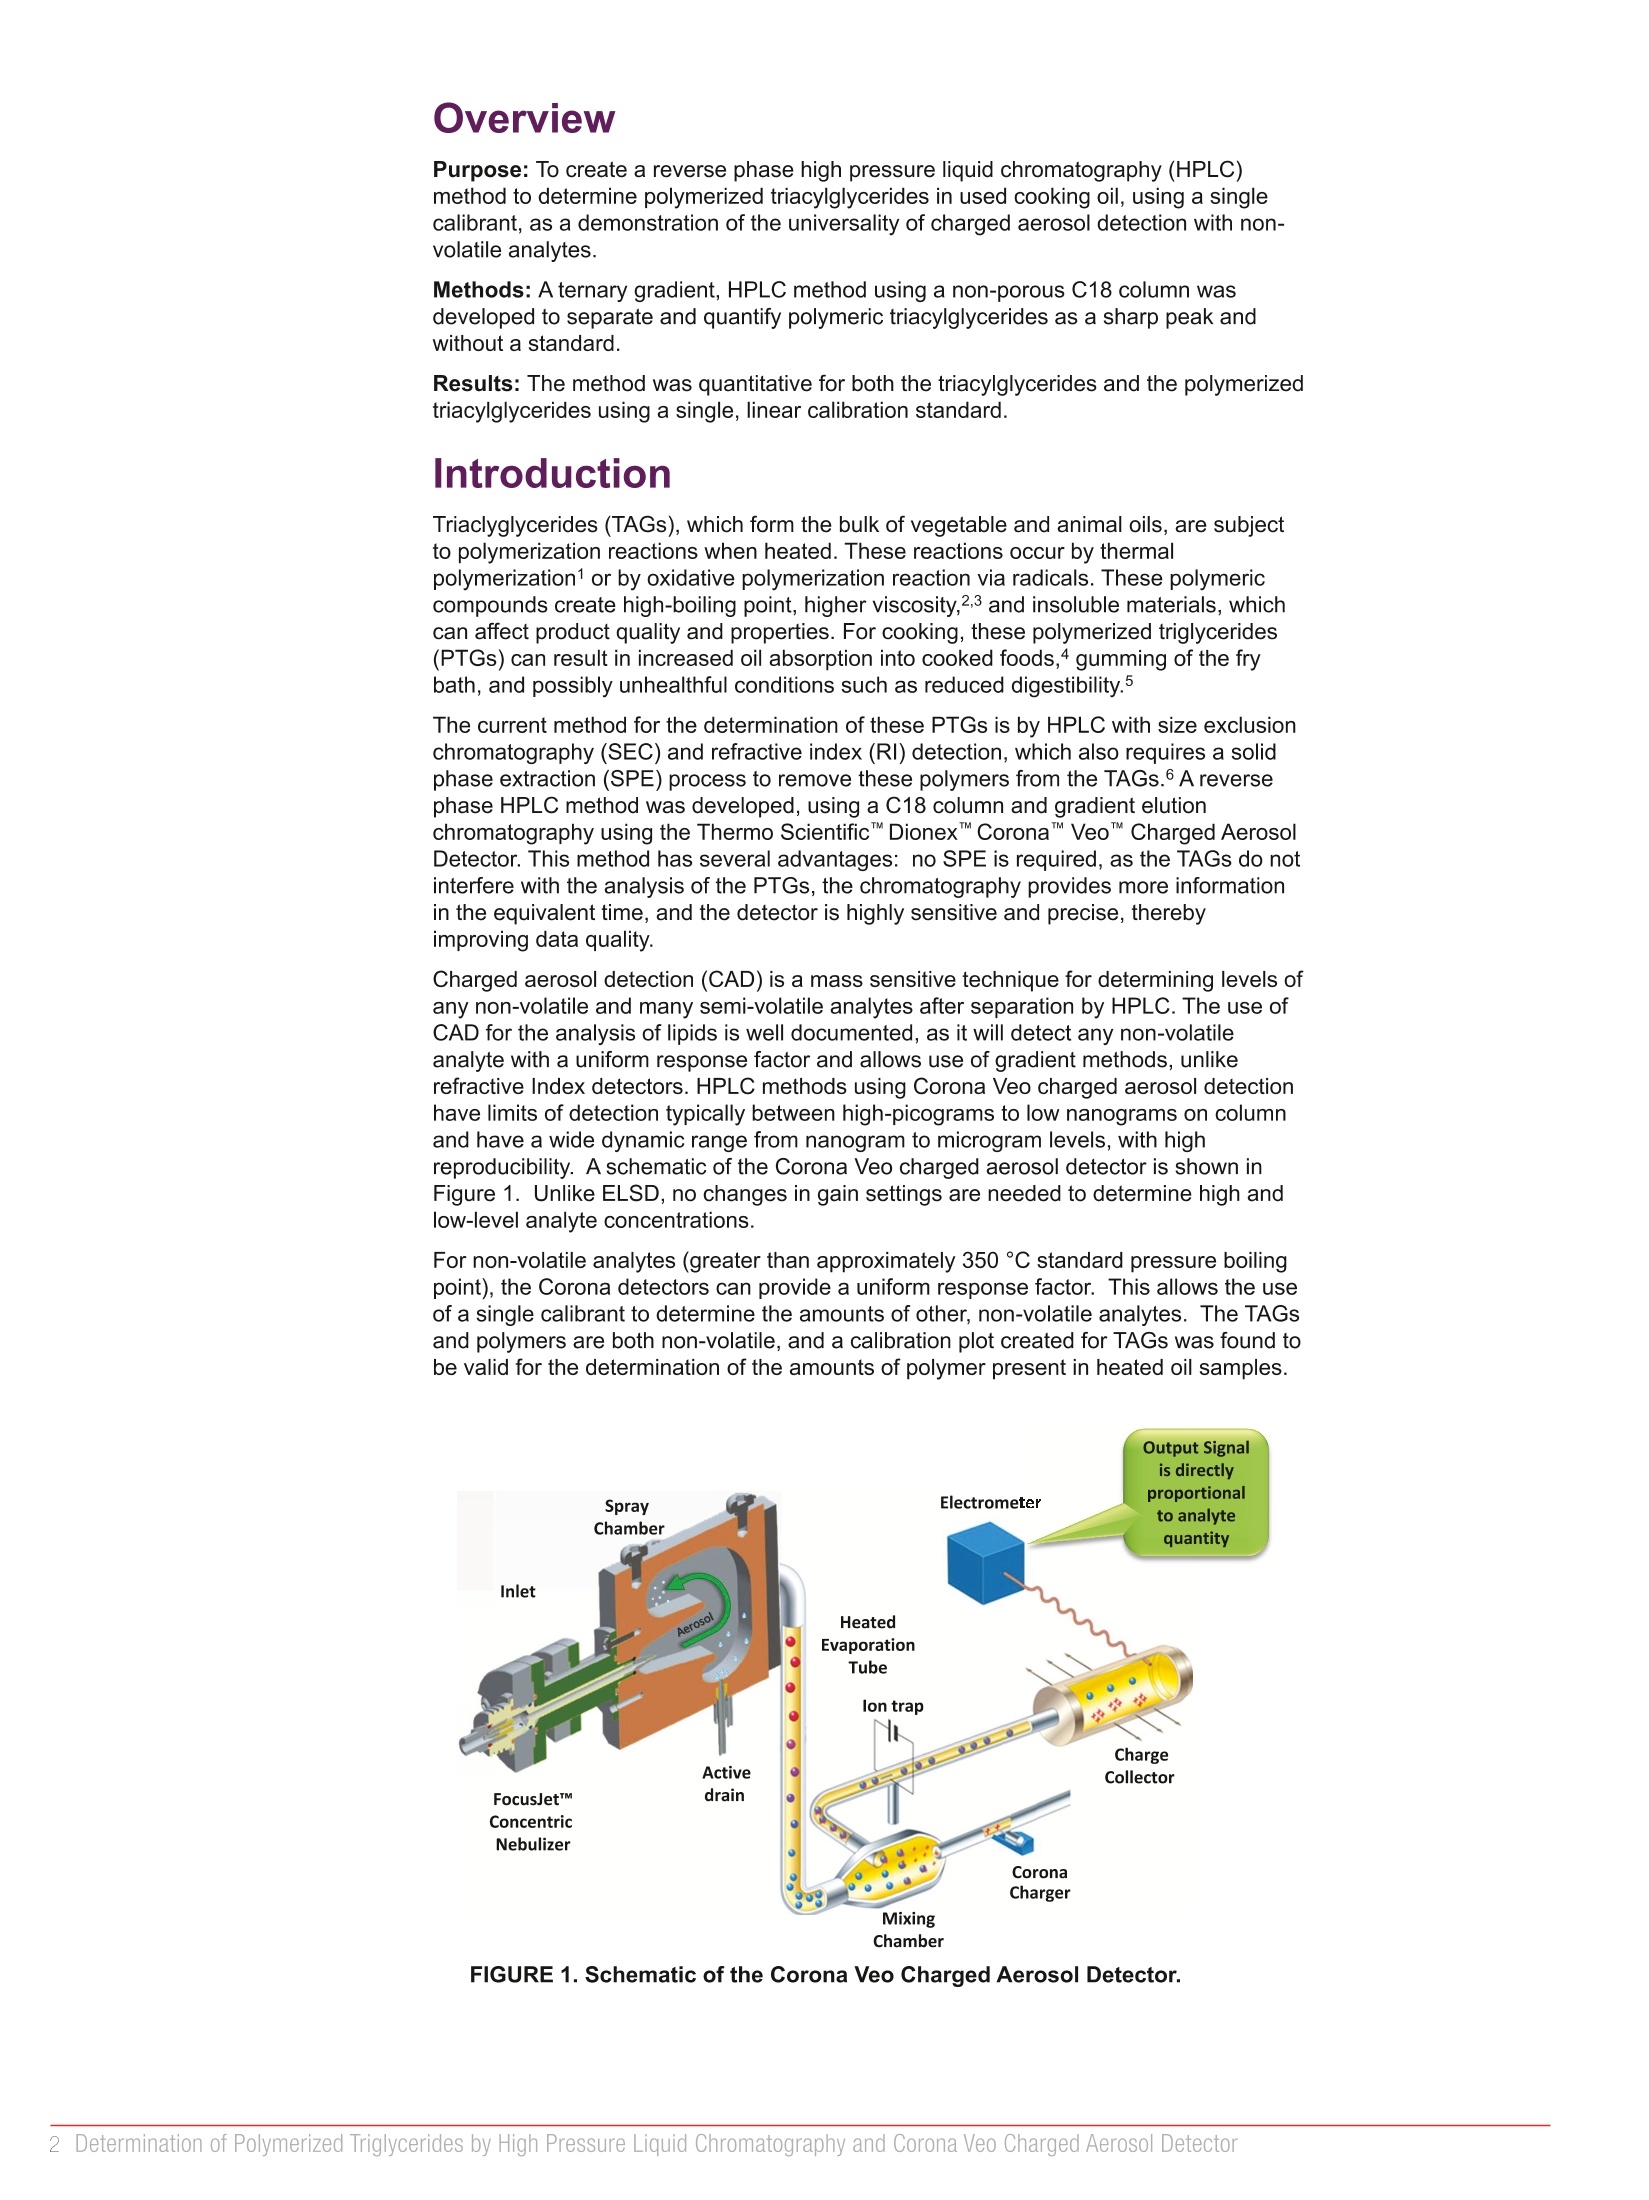
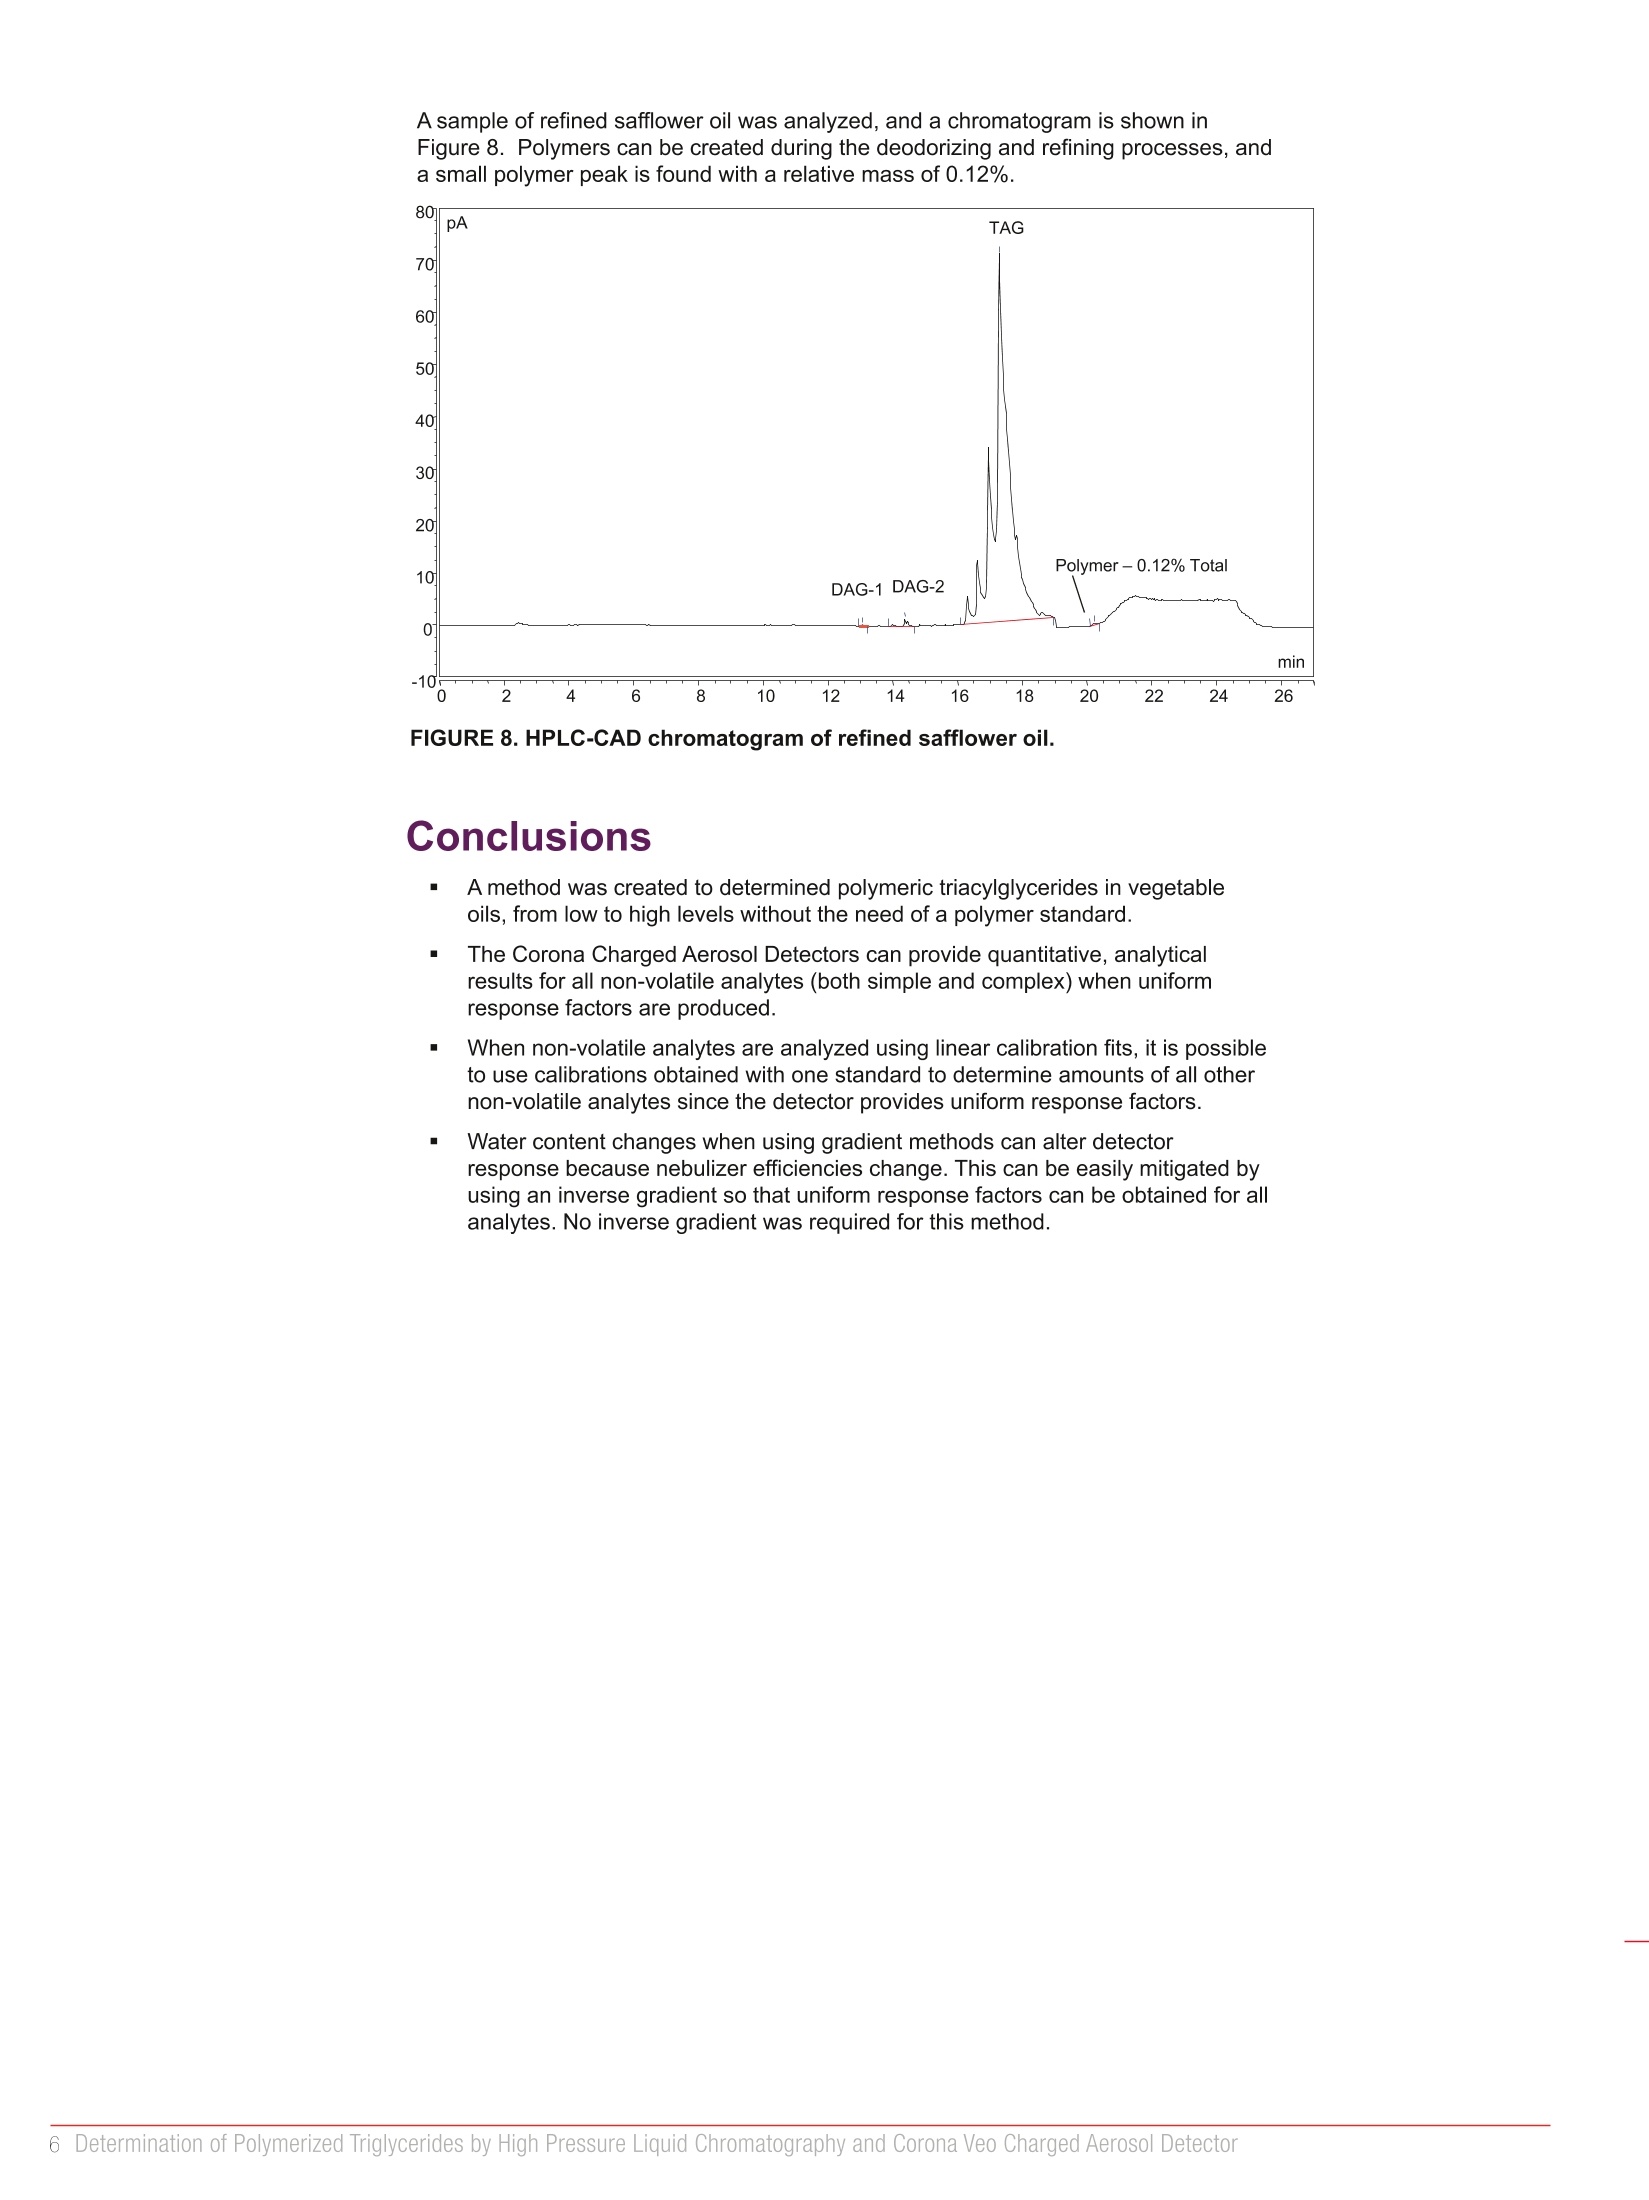
Determination of Polymerized Triglyceridesby High Pressure Liquid Chromatographyand Corona Veo Charged Aerosol Detector Marc Plante, Bruce Bailey, David Thomas, and Ian AcworthThermo Fisher Scientific, Chelmsford, MA, USA Overview Purpose: To create a reverse phase high pressure liquid chromatography (HPLC)method to determine polymerized triacylglycerides in used cooking oil, using a singlecalibrant, as a demonstration of the universality of charged aerosol detection with non-volatile analytes. Methods: A ternary gradient, HPLC method using a non-porous C18 column wasdeveloped to separate and quantify polymeric triacylglycerides as a sharp peak andwithout a standard. Results: The method was quantitative for both the triacylglycerides and the polymerizedtriacylglycerides using a single, linear calibration standard. Introduction Triaclyglycerides (TAGs), which form the bulk of vegetable and animal oils, are subjectto polymerization reactions when heated. These reactions occur by thermalpolymerization1 or by oxidative polymerization reaction via radicals. These polymericcompounds create high-boiling point, higher viscosity,2,3 and insoluble materials, whichcan affect product quality and properties. For cooking, these polymerized triglycerides(PTGs) can result in increased oil absorption into cooked foods,4 gumming of the frybath, and possibly unhealthful conditions such as reduced digestibility. The current method for the determination of these PTGs is by HPLC with size exclusionchromatography (SEC) and refractive index (RI) detection, which also requires a solidphase extraction (SPE) process to remove these polymers from the TAGs.6 A reversephase HPLC method was developed, using a C18 column and gradient elutionchromatography using the Thermo ScientificDionexCorona Veo Charged AerosolDetector. This method has several advantages: no SPE is required, as the TAGs do notinterfere with the analysis of the PTGs, the chromatography provides more informationin the equivalent time, and the detector is highly sensitive and precise, therebyimproving data quality. Charged aerosol detection (CAD) is a mass sensitive technique for determining levels ofany non-volatile and many semi-volatile analytes after separation by HPLC. The use ofCAD for the analysis of lipids is well documented, as it will detect any non-volatileanalyte with a uniform response factor and allows use of gradient methods, unlikerefractive Index detectors. HPLC methods using Corona Veo charged aerosol detectionhave limits of detection typically between high-picograms to low nanograms on columnand have a wide dynamic range from nanogram to microgram levels, with highreproducibility. A schematic of the Corona Veo charged aerosol detector is shown inFigure 1. Unlike ELSD, no changes in gain settings are needed to determine high andlow-level analyte concentrations. For non-volatile analytes (greater than approximately 350°℃ standard pressure boilingpoint), the Corona detectors can provide a uniform response factor. This allows the useof a single calibrant to determine the amounts of other, non-volatile analytes. The TAGsand polymers are both non-volatile, and a calibration plot created for TAGs was found tobe valid for the determination of the amounts of polymer present in heated oil samples. Output Signal Chamber FIGURE 1. Schematic of the Corona Veo Charged Aerosol Detector. Methods Sample Preparation The standard used, extra virgin olive oil (EVOO), was dissolved inmethanol/tetrahydrofuran (THF) (1:1) at an initial concentration of 10.0 mg/mL, anddiluted incrementally by 50% to a low concentration of 78 ug/mL. The first standardused in the calibration was at a concentration of 5.00 mg/mL. Heated oil samples were prepared by heating 200 mL of EVOO in a 1 L, coveredbeaker to a temperature of 270C. Aliquots of oil were removed with a metal spatulaand stored in HPLC vials for later dilution. Samples, including refined safflower oil, were dissolved in methanol/THF (1:1) at aconcentration of 10.0 mg/mL and then diluted 50%. Samples with undissolved material(samples heated for 240, 270, and 300 minutes) required the addition of THF first, andthen dilution with an equivalent volume of methanol. Liquid Chromatography HPLC System: Thermo Scientific DionexUltiMate"3000 system consisting ofa DGP-3600RS pump, WPS-3000TRS autosampler, and TCC-3000RS column oven Mobile Phase A: Water/methanol/acetic acid (600:400:4) Mobile Phase B: Acetonitrile/acetic acid (1000:4) Mobile Phase C: 2-Propanol/THF (800:200) Sample Temp.: 10°C Injection Volume: 2.00pLColumn: Imtakt Presto-FF* C18, 2 um,4.6x150mmColumn Temp.: 40°CDetector: Corona Veo RS Evaporation Temp.:80°C Data Rate: 10 Hz Power Functions: 0-19 minutes, 1.3; 19-27 minutes, 2.0Filter: 5 seconds Gradient: Time (minutes) Flow Rate (mL/min) %A %B %C -6 0.4 98 2 0 0 0.4 98 2 0 4 0.4 72 28 0 15 0.9 0 100 0 17 1.0 0 100 0 18 0.6 0 0 100 21 0.5 0 0 100 22 0.5 0 100 0 25 0.5 0 100 0 26 0.5 98 2 0 27 0.6 98 2 0 Data Analysis All data was collected and processed using the Thermo ScientificDionexChromeleon"" Chromatography Data System (CDS) 7.2 SR3 software and data station. Results Chromatography A non-porous C18 column was selected to avoid polymeric analytes from accumulatinginto the pores of packing media and thereby impairing performance. For aerosol-based detectors, and where water content changes significantly across agradient, an inverse gradient is typically employed to eliminate changes in responsefactor of analytes across the gradient. In this method, the main analytes elute from thecolumn at 100% organic eluent, no inverse gradients were required to maintain aconsistent response factor for these non-volatile analytes. In having the polymer peak as a single peak, the sensitivity and quantitation issimplified, as all of the polymers are eluted at the same / similar retention time, andonly one power function value needs to be determined for this complex analyte. Calibration The standard used for calibration purposes was the EVOO, itself, which is comprised ofTAGs with small amounts of diacylglycerides (DAGs), and monoacylglycerides (MAGs).In using standards with known concentrations, the total peak area can be used tocalibrate the instrument for the response factor for these analytes. Since CAD detectsanalyte particles, with compound volatility as the major factor with regards to signal,"theCorona charged aerosol detector is characterized by a uniform response toward aerosol-forming compounds with low vapor pressures,"or high-boiling points.’ Calibration linearity is an important factor for a quantitative method. Since chargedaerosol detection is inherently nonlinear, response factors can vary with peak height.Thus, differently shaped peak exhibit different response curves. By using the CAD powerfunction feature, response variability for different peaks can be eliminated. The CADpower function can be used to provide linear peak area correlations with mass. To determine the power function value for the TAGs, five concentrations of EVOO wereinjected and analyzed. A chromatogram of 5 pg on column (o.c.) of EVOO is shown inFigure 2. When a non-linear calibration plot is subjected to different Power Law values inChromeleon CDS 7.2, a convenient way to determine the power function value (PFV) forCAD output is provided. A linear calibration fit can then be obtained when correct PFVvalues are used and for the TAGs a PFV of 1.30 provided the best, linear fit. Since no standard or known concentration was available for the polymer peak, thesample obtained after 150 minute of heating was injected with four different injectionvolumes. Injection volumes of 1.0, 1.5, 2.0, and 2.5 uL were analyzed and response wasplotted to create known response differences between injected amounts. This served as ameans of calibration for the polymeric TAGs. Using Chromeleon Power Law,a PFV of2.00 was determined. A chromatogram of EVOO, heated at 270 °℃ for 210 minutes isshown in Figure 3 and this illustrates the mount of polymeric TAGs produced. After the power function values were determined, method parameters were adjustedusing these values during specified retention time windows (see Method Conditions). Acalibration sequence was performed, and the peak area vs. total glycerols was plottedand fit to a linear equation, with an R2=0.9997, as shown in Figure 4. The corresponding,volume-calibration plot for the polymer peak is shown in Figure5. methanol/tetrahydrofuran (1:1). FIGURE 3. HPLC-CAD chromatogram of EVOO (heated for 210 minutes at270°C) in methanol/tetrahydrofuran(1:1). total EVOO glycerols, from 0.156- 10 pg o.c., each in triplicate, PFV= 1.30. FIGURE 5. Power Law linearcalibration fit of EVOO-polymers,with PFV=2.00, using four, differentinjection volumes (y-axis not scaled). Sample Analysis The heated EVOO samples were analyzed and all of the acylglycerol peaks wereintegrated and quantified with the TG calibration equation. The polymer peak was alsointegrated and quantified using the same equation. The trend of percent-polymer in theheated oil samples was plotted over time and is shown in Figure 6. FIGURE 6. Percent polymer in 270 °C-heated EVOO over five hours'time, n=2. Calibrations based on detector uniform response factors for non-volatile analytes arepossible using the CAD. To verify that a valid quantitative method of analysis wasdeveloped, the total amounts of EVO0 peaks (MAGs, DAGs, and TAGs) and the totalpolymer peak produced during heating periods (shown in Figure 6) were evaluated.Since both the EVOO peaks and the unknown and complex polymer peak areassumed to be non-volatile the calibration results used in this study should be valid. To confirm the validity of this calibration process, the percent mass found (relative to10 ugo.c.) was plotted over all injections, covering the complete range of percent-polymer produced, and is shown in Figure 7. The total range of absolute error acrossthe experiment was approximately ±3 %. FIGURE 7. Percent total quantified mass over five hours'time, n=2. A sample of refined safflower oil was analyzed, and a chromatogram is shown inFigure 8. Polymers can be created during the deodorizing and refining processes, anda small polymer peak is found with a relative mass of 0.12%. FIGURE 8. HPLC-CAD chromatogram of refined safflower oil. Conclusions A method was created to determined polymeric triacylglycerides in vegetableoils, from low to high levels without the need of a polymer standard. mThe Corona Charged Aerosol Detectors can provide quantitative, analyticalresults for all non-volatile analytes (both simple and complex) when uniformresponse factors are produced. mWhen non-volatile analytes are analyzed using linear calibration fits, it is possibleto use calibrations obtained with one standard to determine amounts of all othernon-volatile analytes since the detector provides uniform response factors. Water content changes when using gradient methods can alter detectorresponse because nebulizer efficiencies change. This can be easily mitigated byusing an inverse gradient so that uniform response factors can be obtained for allanalytes. No inverse gradient was required for this method. References 1.NNewar, W.W. Lipids, Chapter 5 in“Food Chemistry," 3rd Ed. By O.R. Fennema,Marcel Dekker, Inc. New York, pp.225-319. 2. Berger, K.G. “The Practice of frying”PORIM Technology, 9, (1984), Palm OilResearch Institute of Malaysia. 3. Teah, Y.K. “Improvements in the frying quality of vegetable shortenings and palmolein," Palm Oil Development,8, (1988), 3-7. 4. Blumenthal, M. M. “A new look at the chemistry and physics of deep fat frying,”Food Technology, 45, (1991), 68-71. 5. http://www.researchgate.net/publication/231556345_Short-Term_in_Vivo_Digestibility_of_Triglyceride_Polymers_Dimers_and_Monomers_of_Thermoxidized_Palm_Olein_Used_in_Deep-Frying (accessed February 2015). 6. Dobarganes, M. C.; Velasco, J.;Dieffenbacher, A. “Determination of polarcompounds polymerized and oxidized triacylglycerols,and diacylglycerols in oilsand fats” Pure Appl. Chem., 72,(2000), 1563-1575. 7.Gorecki, T.;Lynen, F.; Szucs, R.; Sandra, P“Universal Response in LiquidChromatography Using Charged Aerosol Detection” Anal. Chem., 78, (2006),186-3192. SCIENTIFIC Determination of Polymerized Triglycerides by High Pressure Liquid Chromatography and Corona Veo Charged Aerosol Detector
确定


还剩5页未读,是否继续阅读?

产品配置单
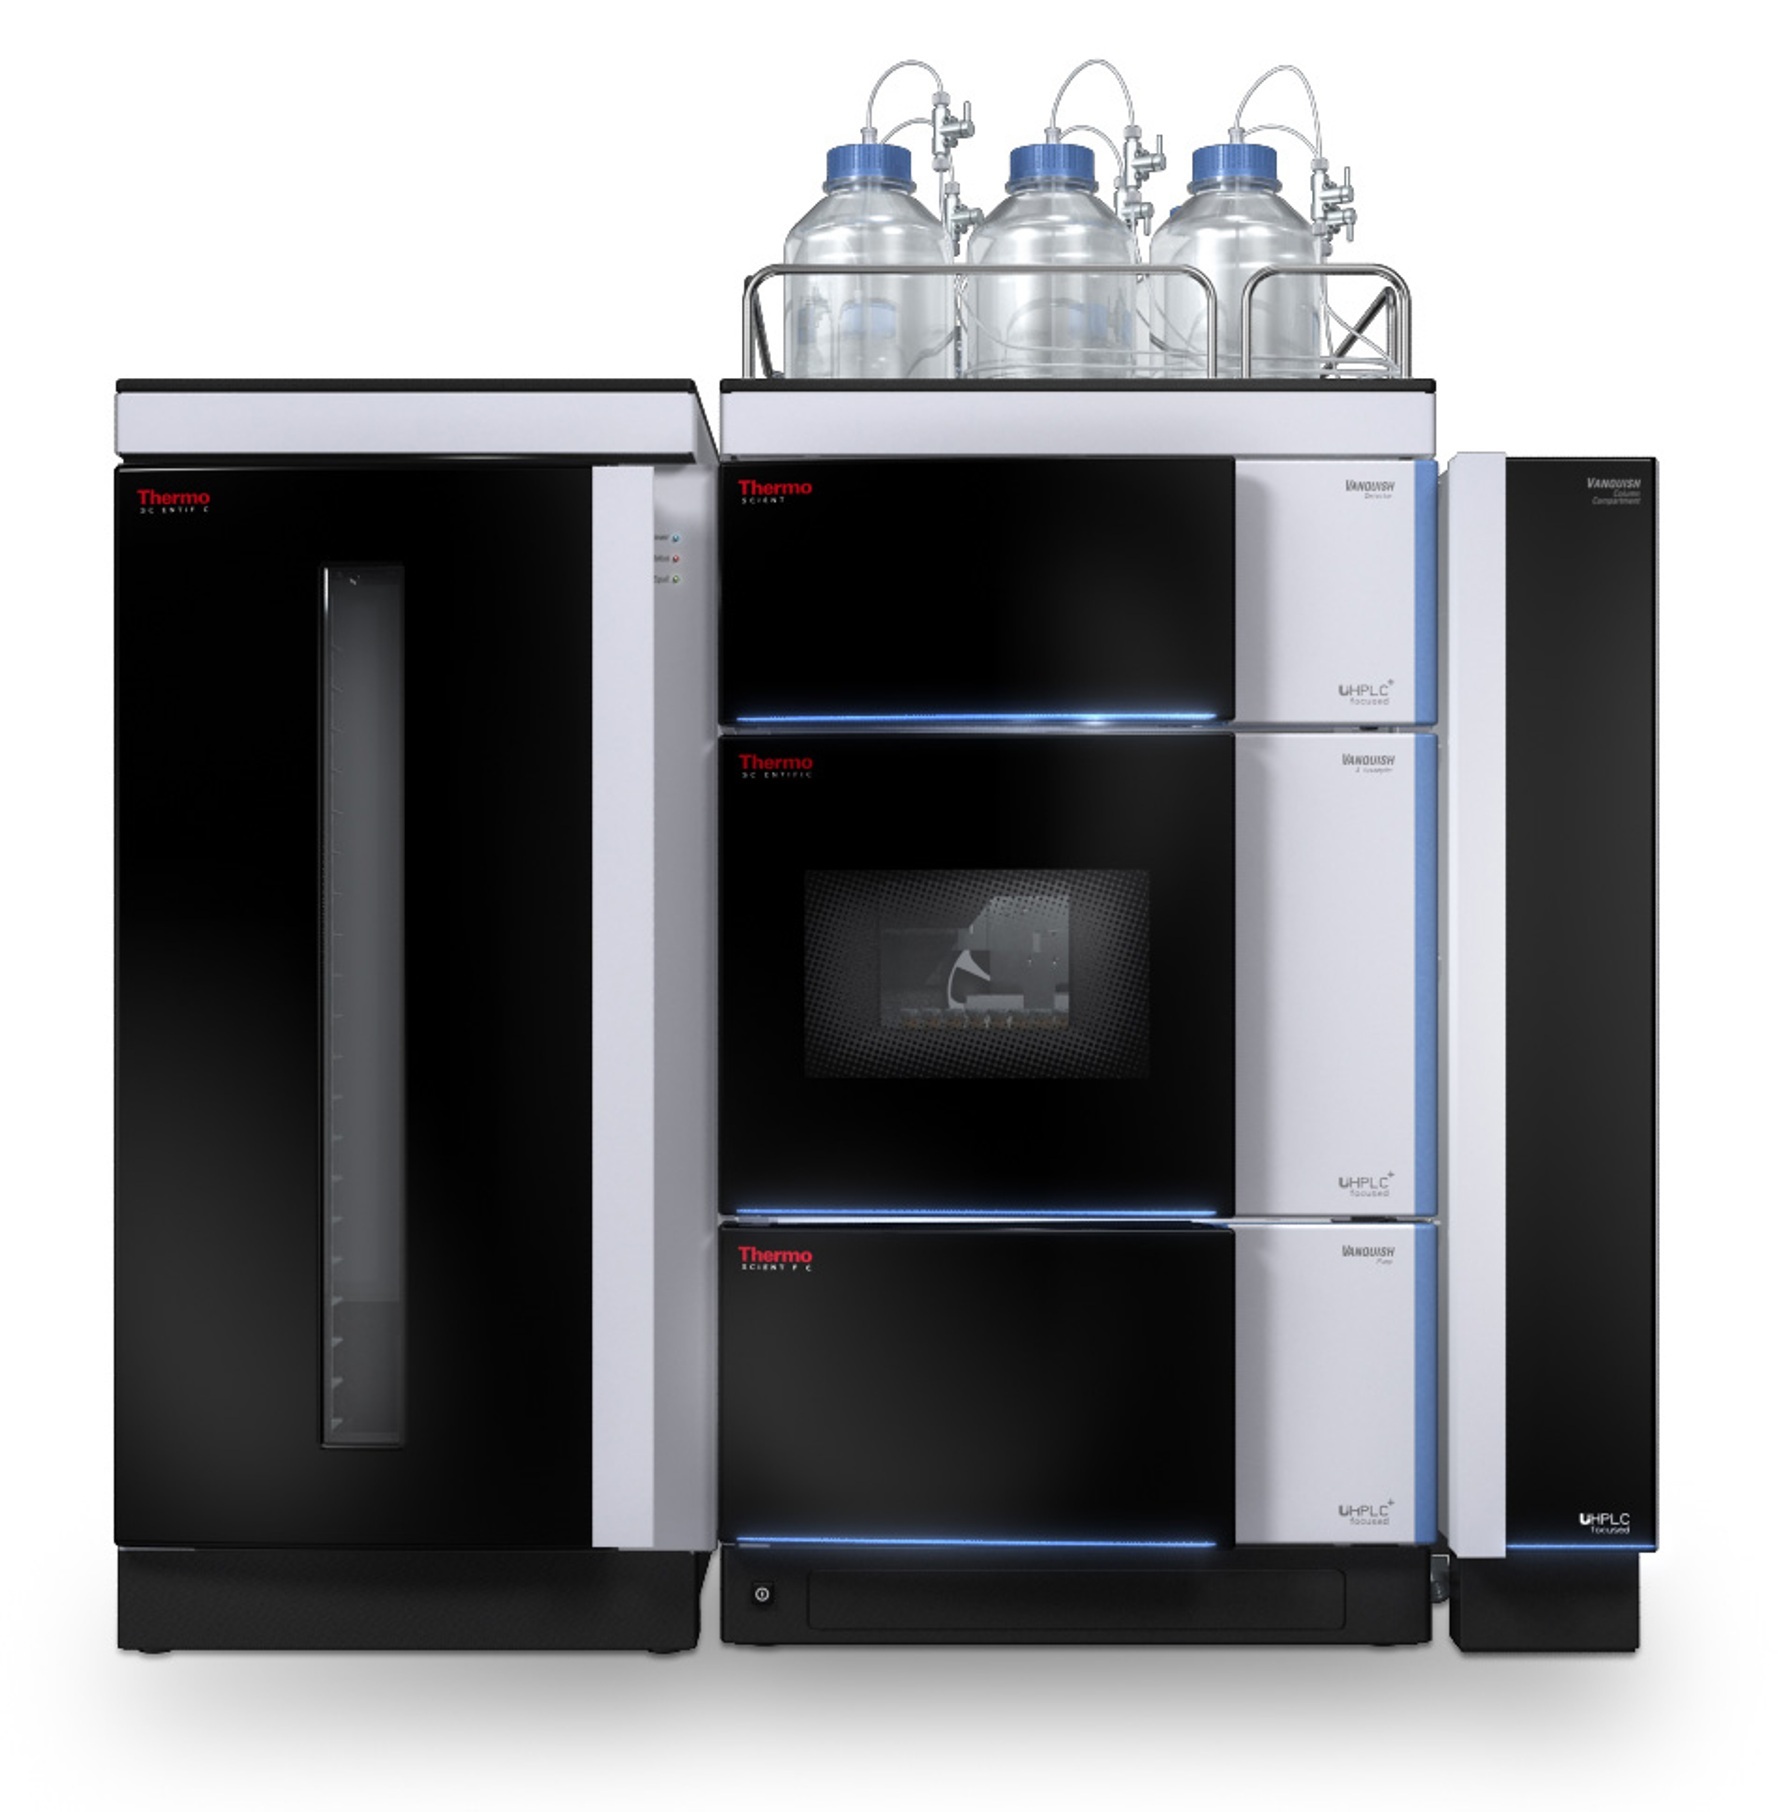
赛默飞色谱与质谱为您提供《聚合甘油三酸酯中主要成分含量检测方案(液相色谱仪)》,该方案主要用于化药制剂中含量测定检测,参考标准--,《聚合甘油三酸酯中主要成分含量检测方案(液相色谱仪)》用到的仪器有赛默飞 Vanquish™ UHPLC超高效液相色谱系统
推荐专场
相关方案
更多
该厂商其他方案
更多