


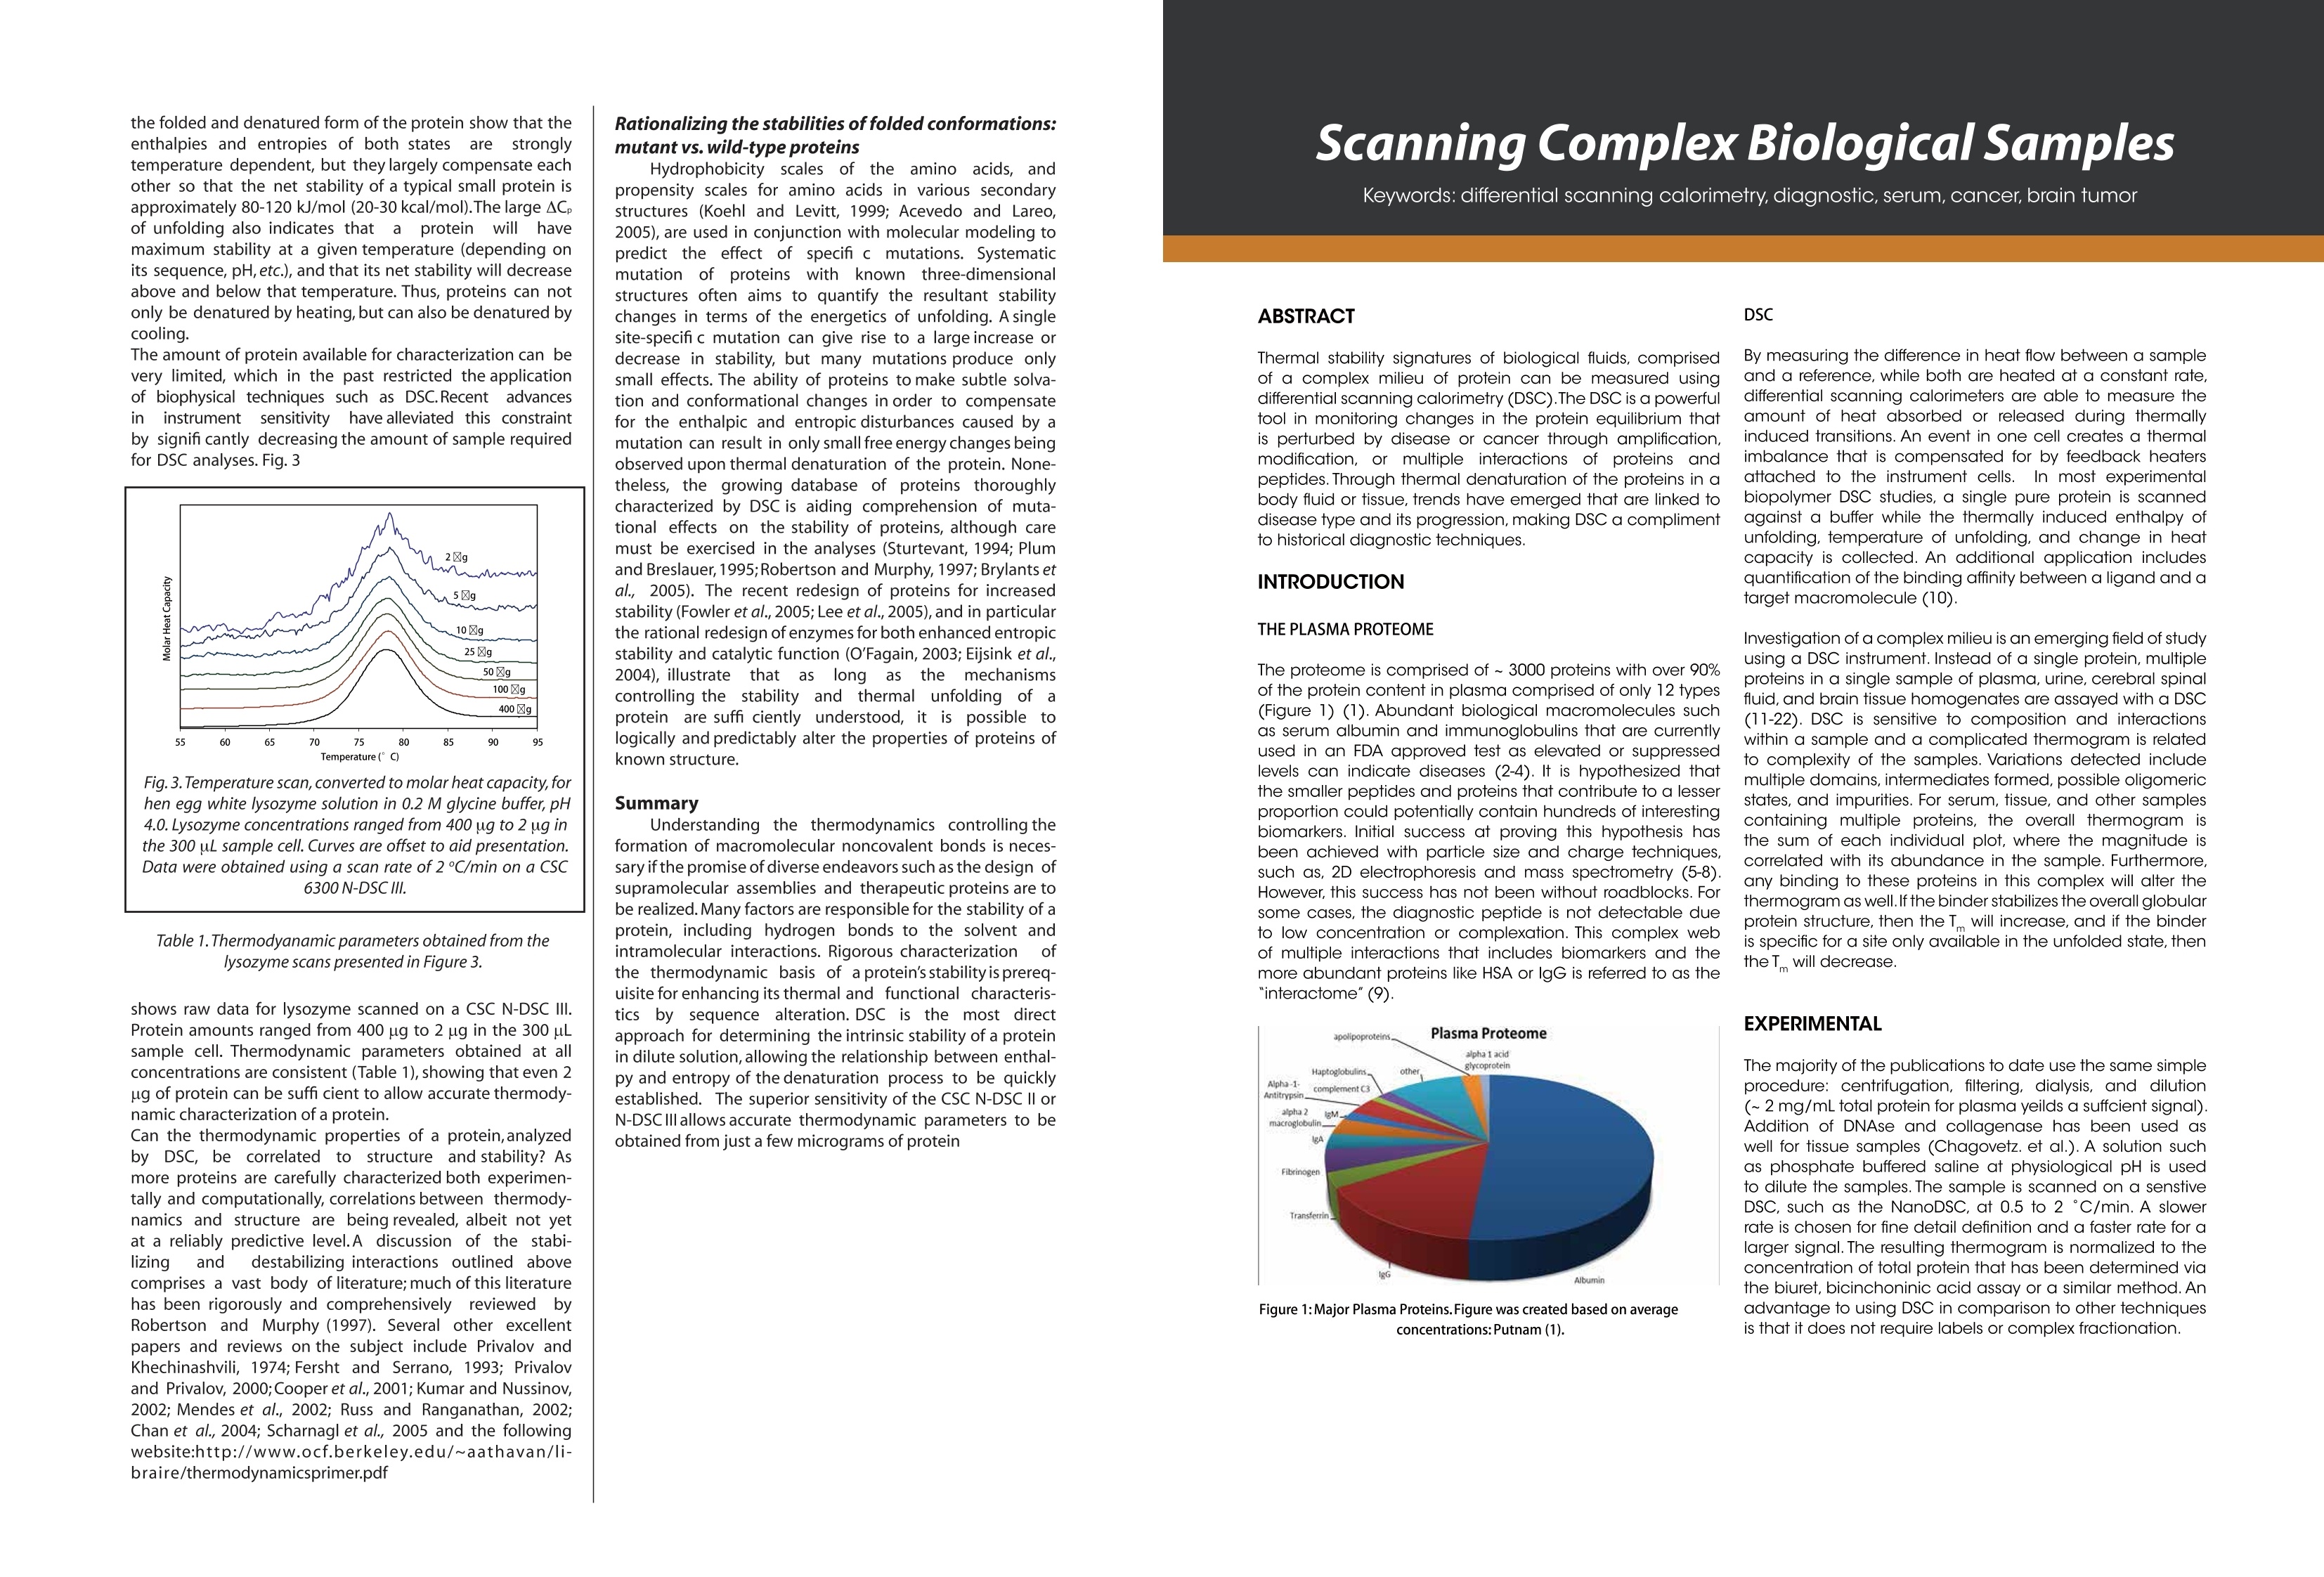
方案详情
文
The development of monoclonal antibody (Mab) based drugs has
undergone considerable growth since the release of the first Mab in the mid-eighties. Intuitive biophysical tools that examine and quantify interactions and conformational dynamics are important in demonstrating and understanding local and global conformational changes.
The structure of antibodies as well as other macromolecules is related to its function and efficacy therefore control over these parameters is essential. The association of antigens to antibodies or of antibodies to delivery assemblies such as liposomes or gold nanoparticles can be
addressed by isothermal titration calorimetry (ITC) while the folding of antibodies can be assayed using differential scanning calorimetry (DSC). Both techniques offer the advantage of using native solutions and both instruments are offered by TA Instruments.
方案详情

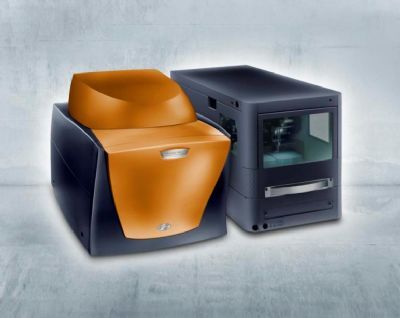
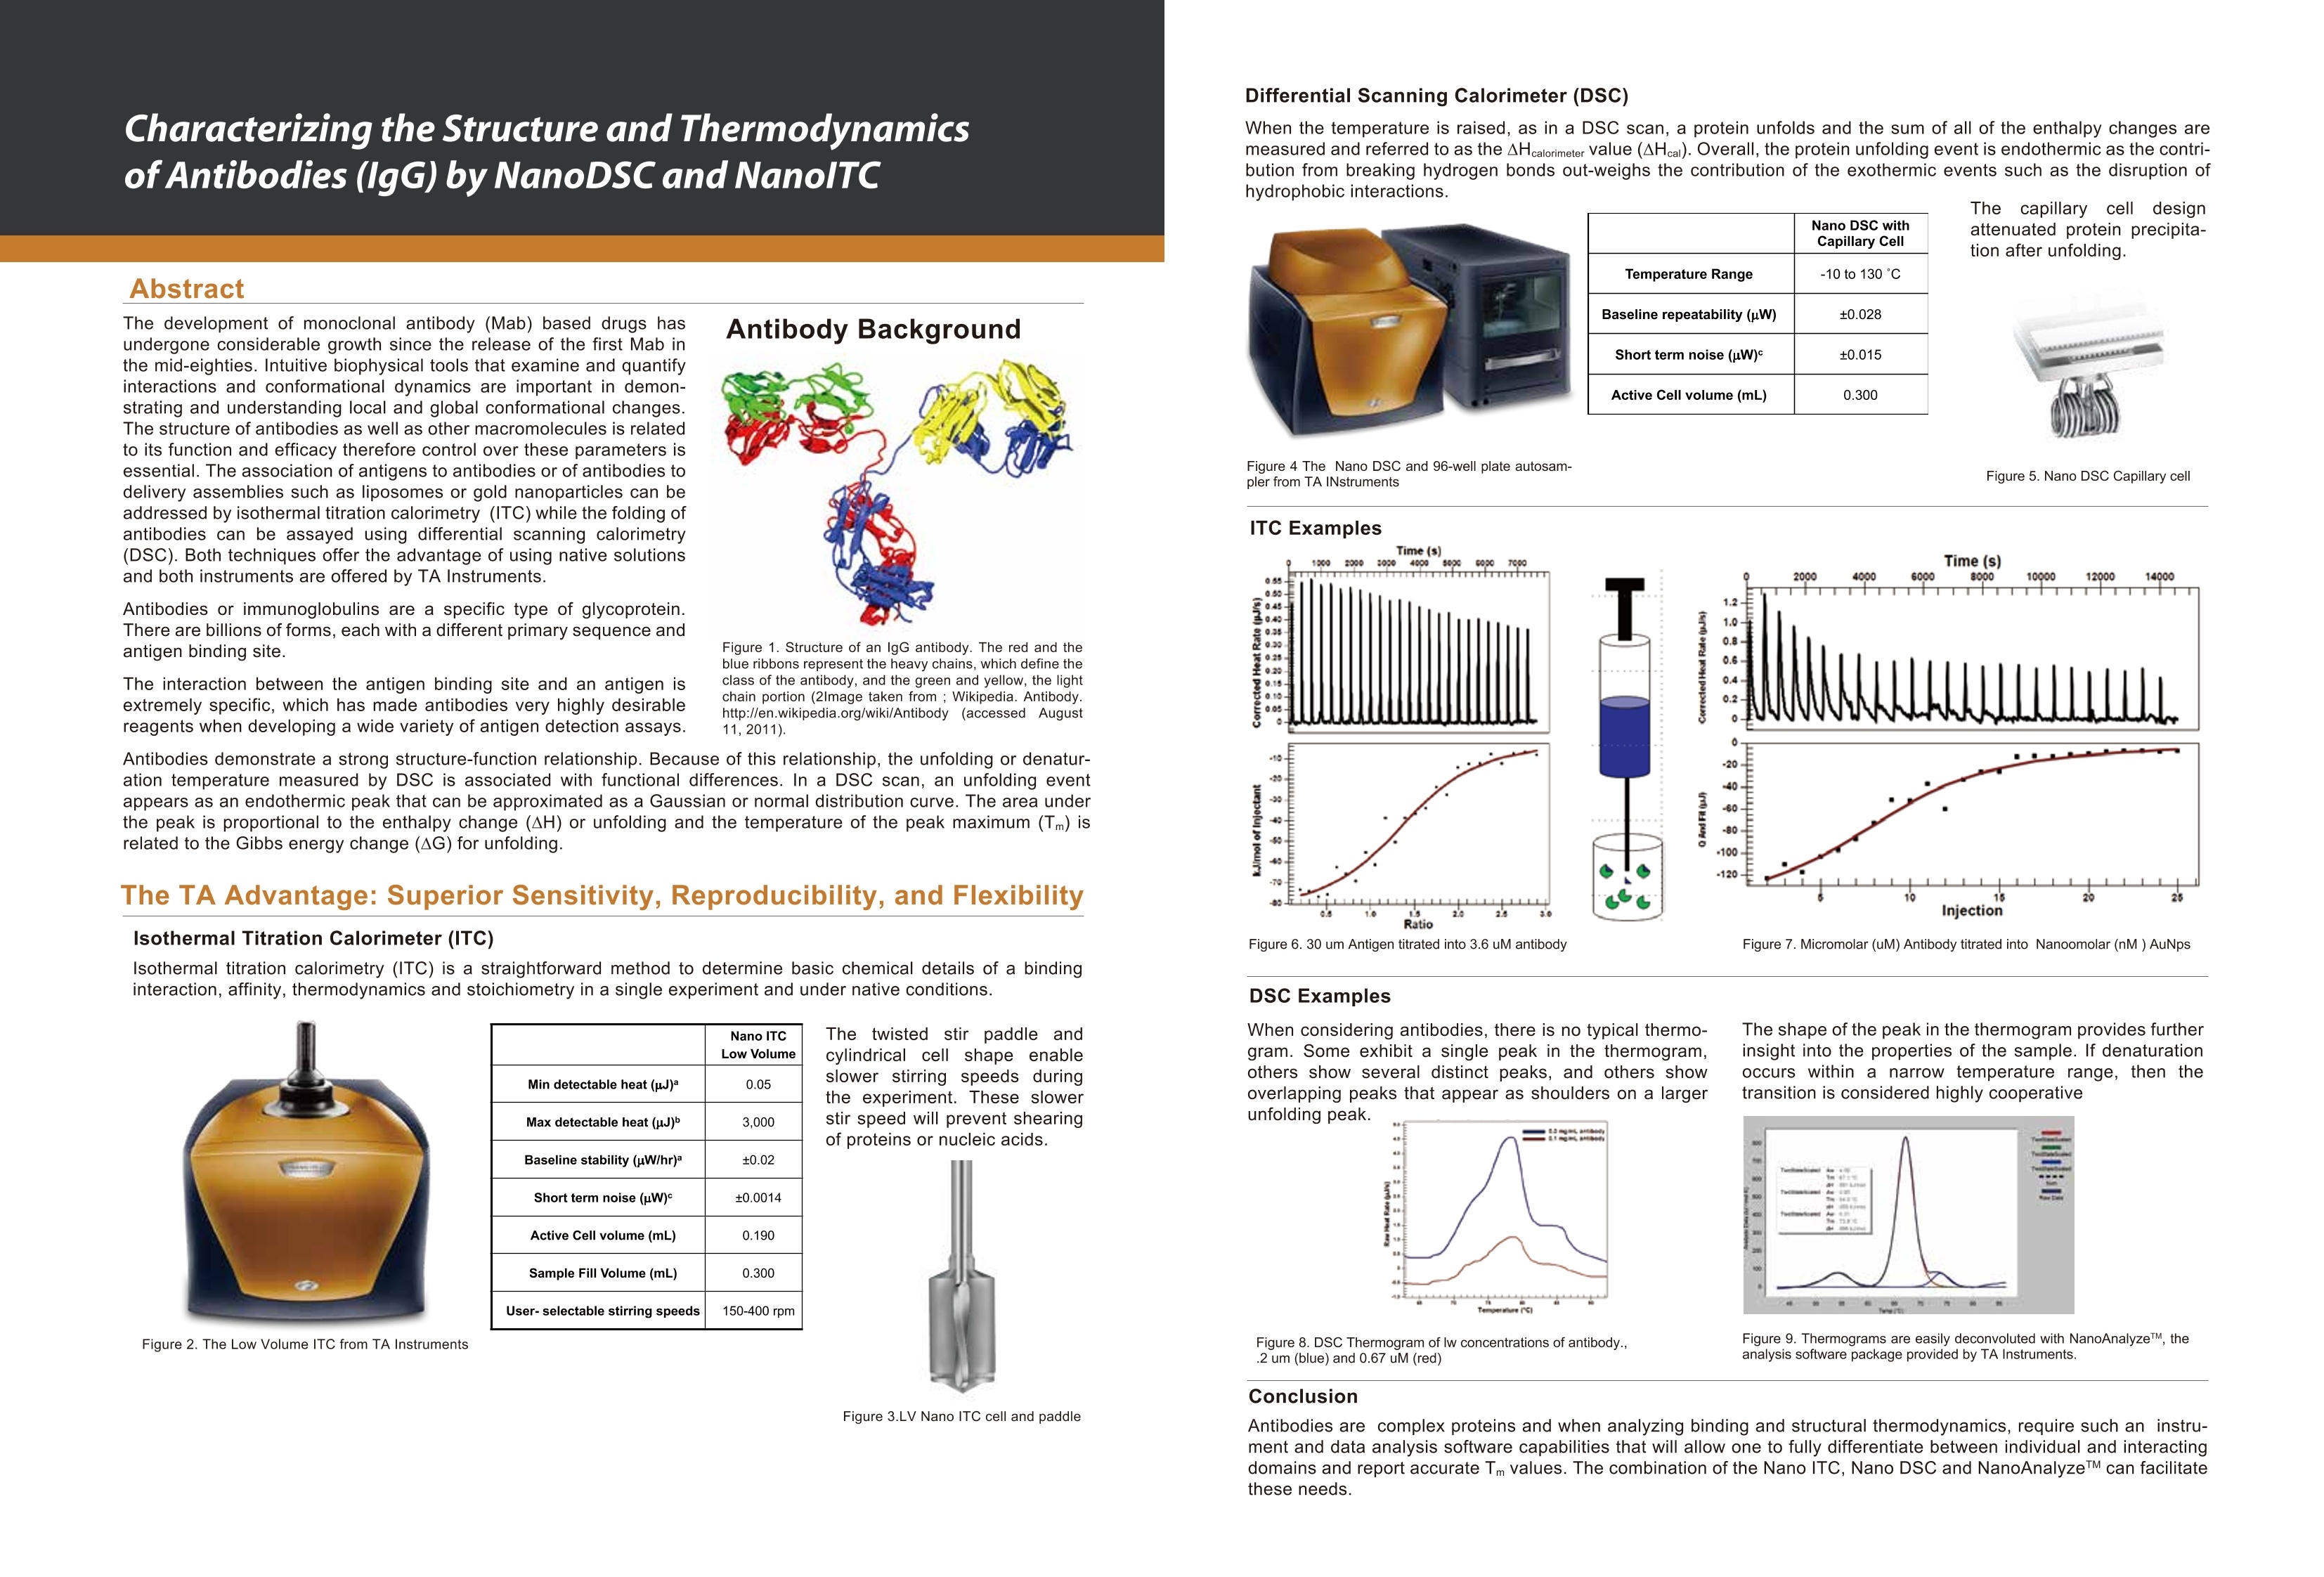
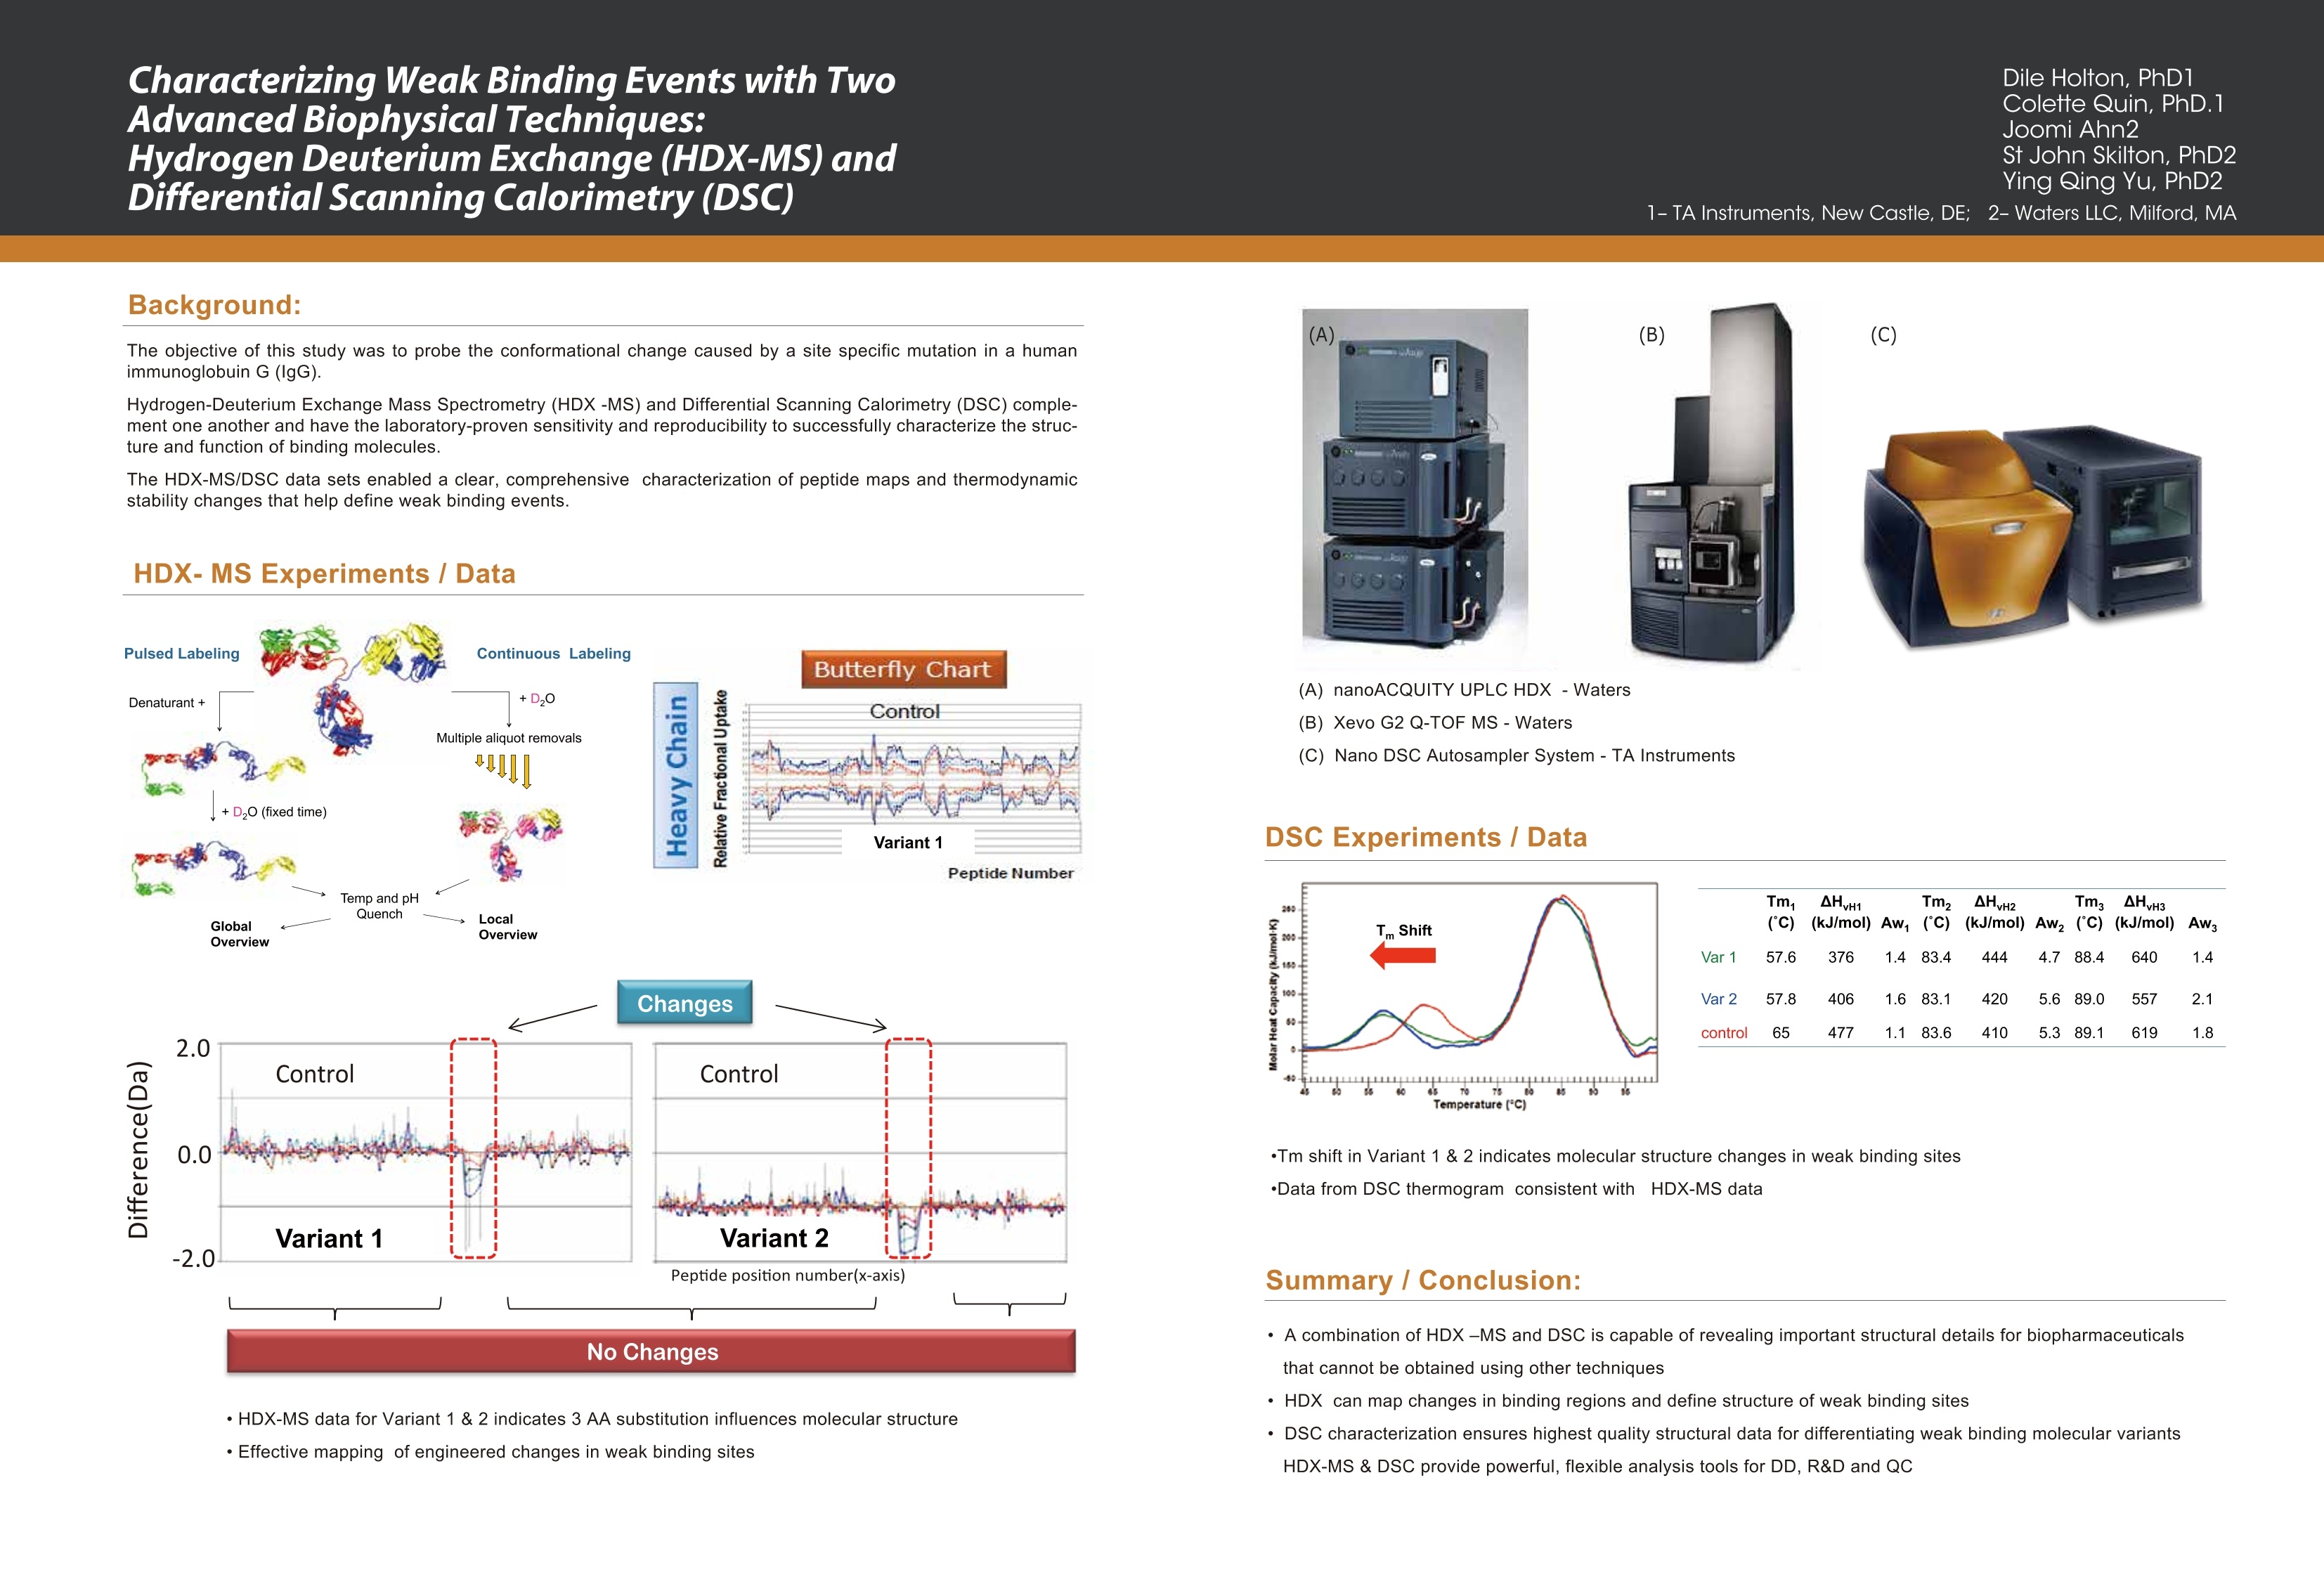
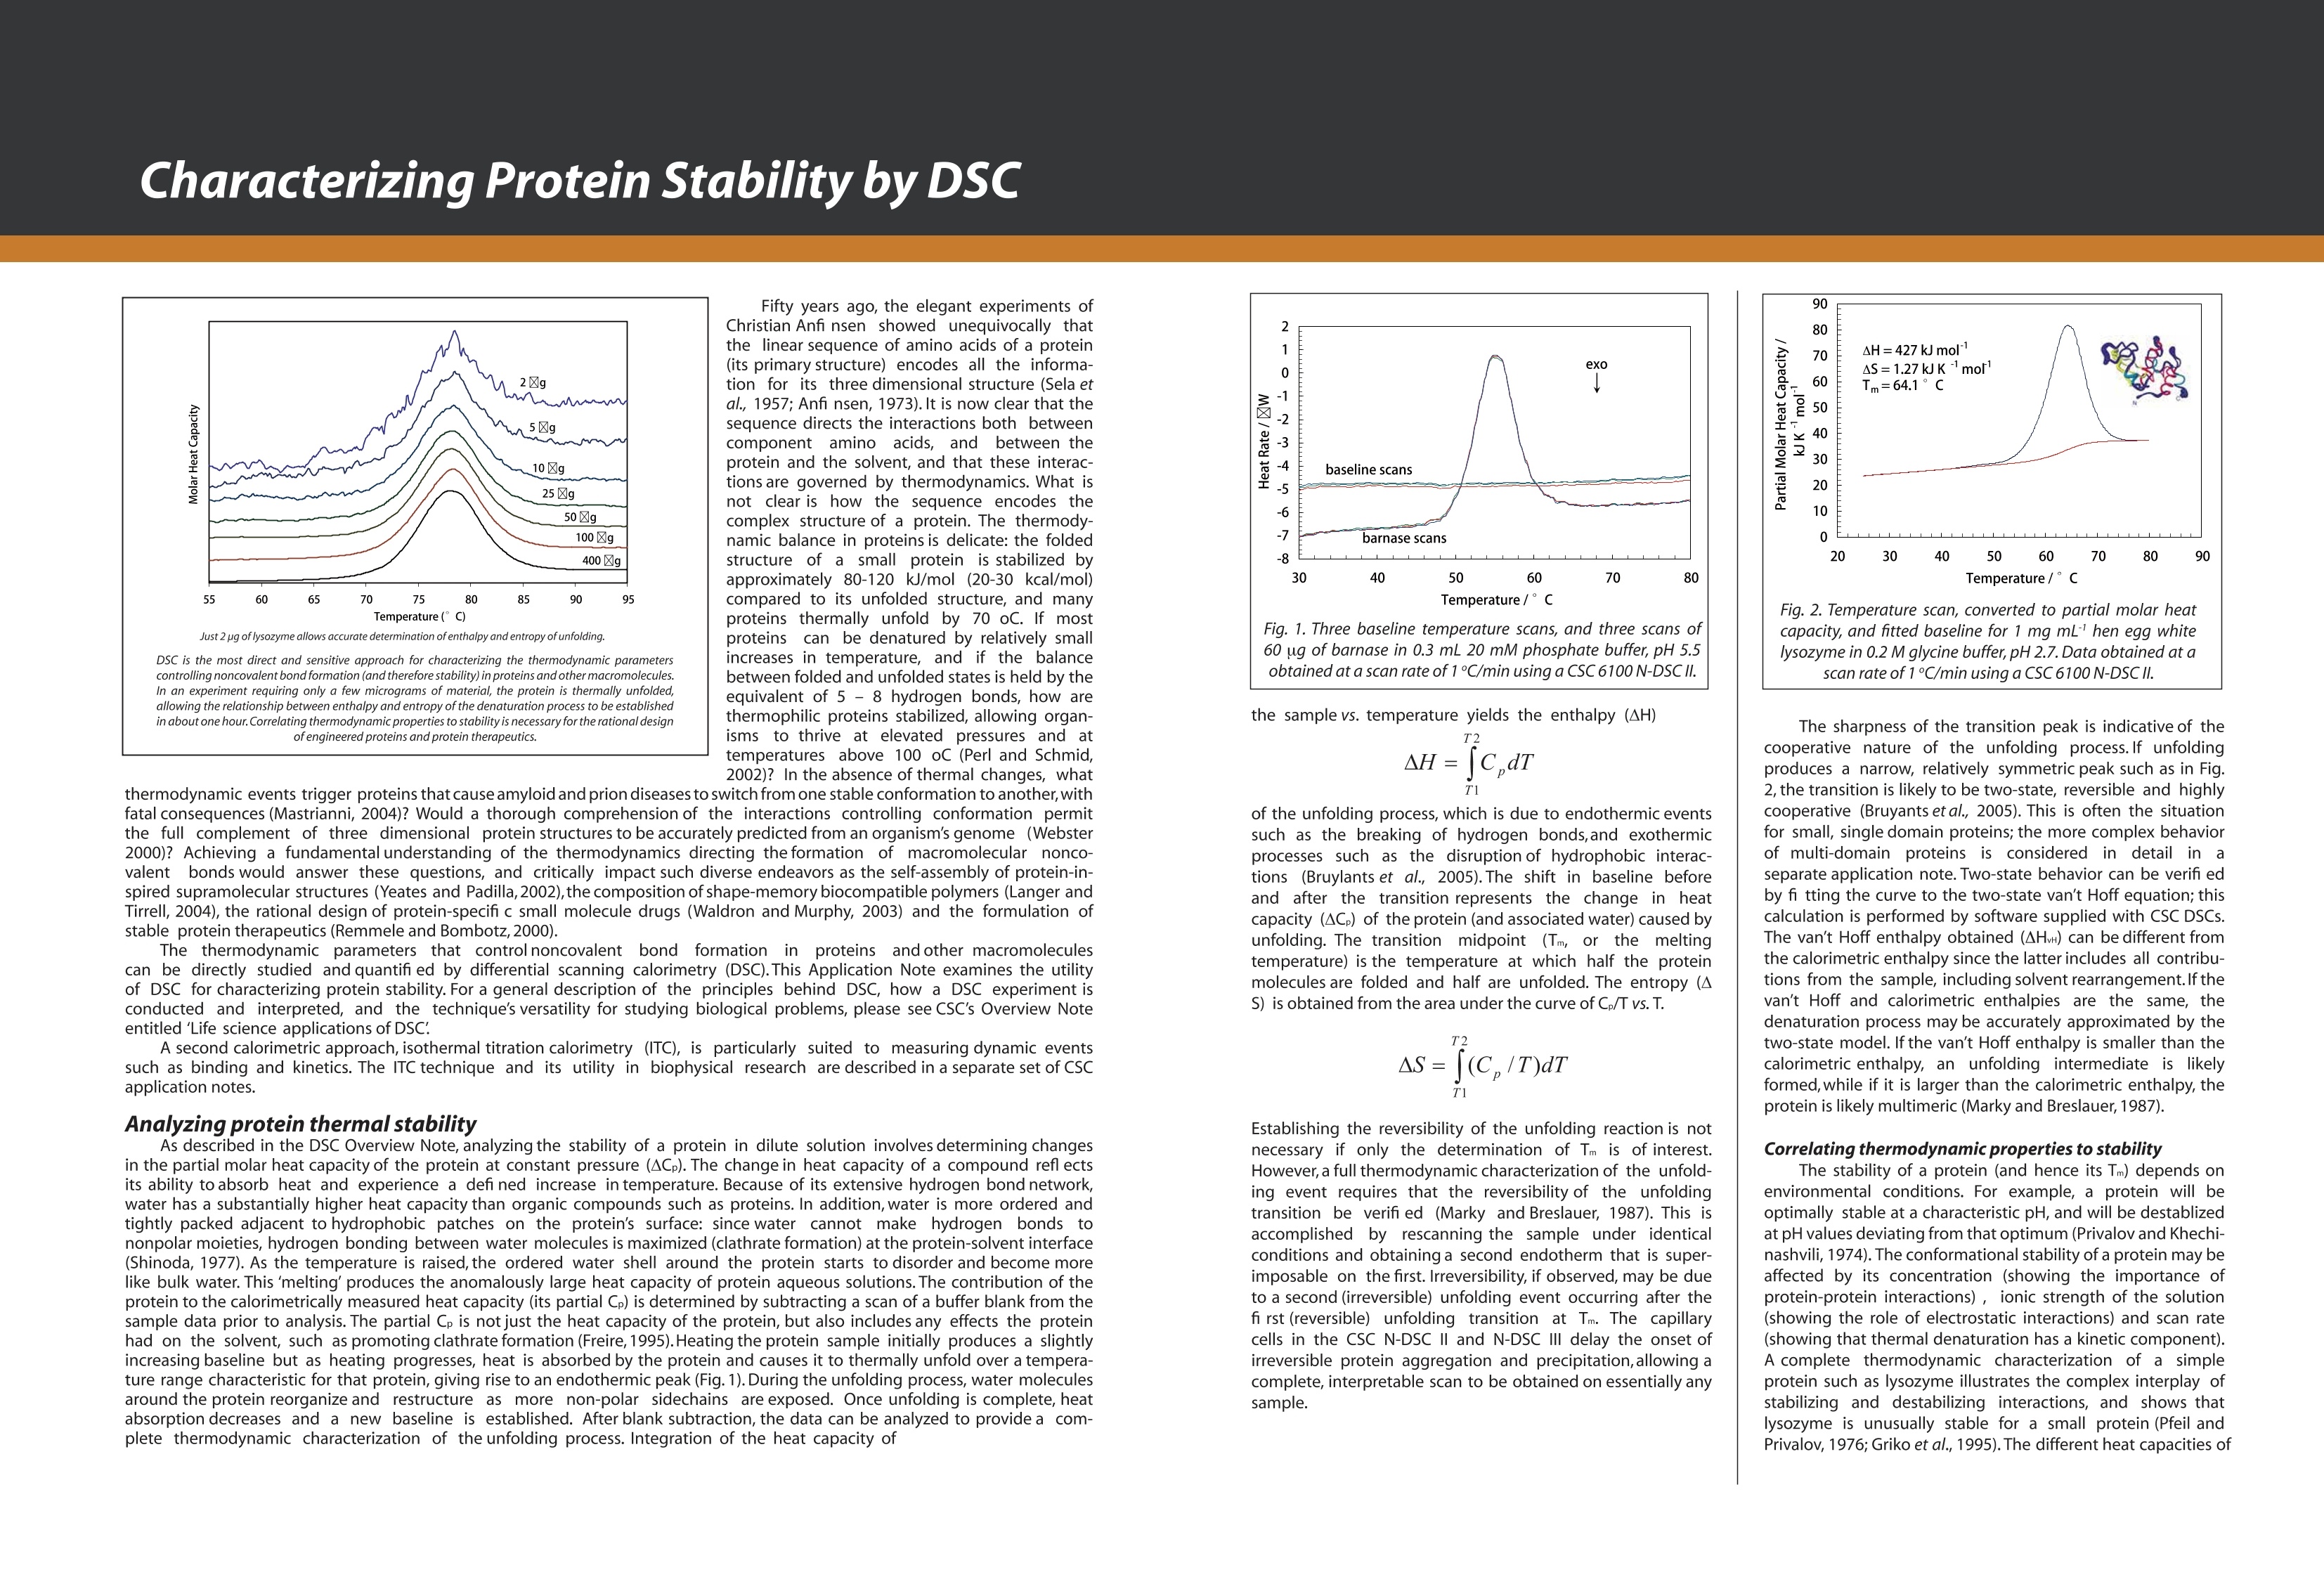
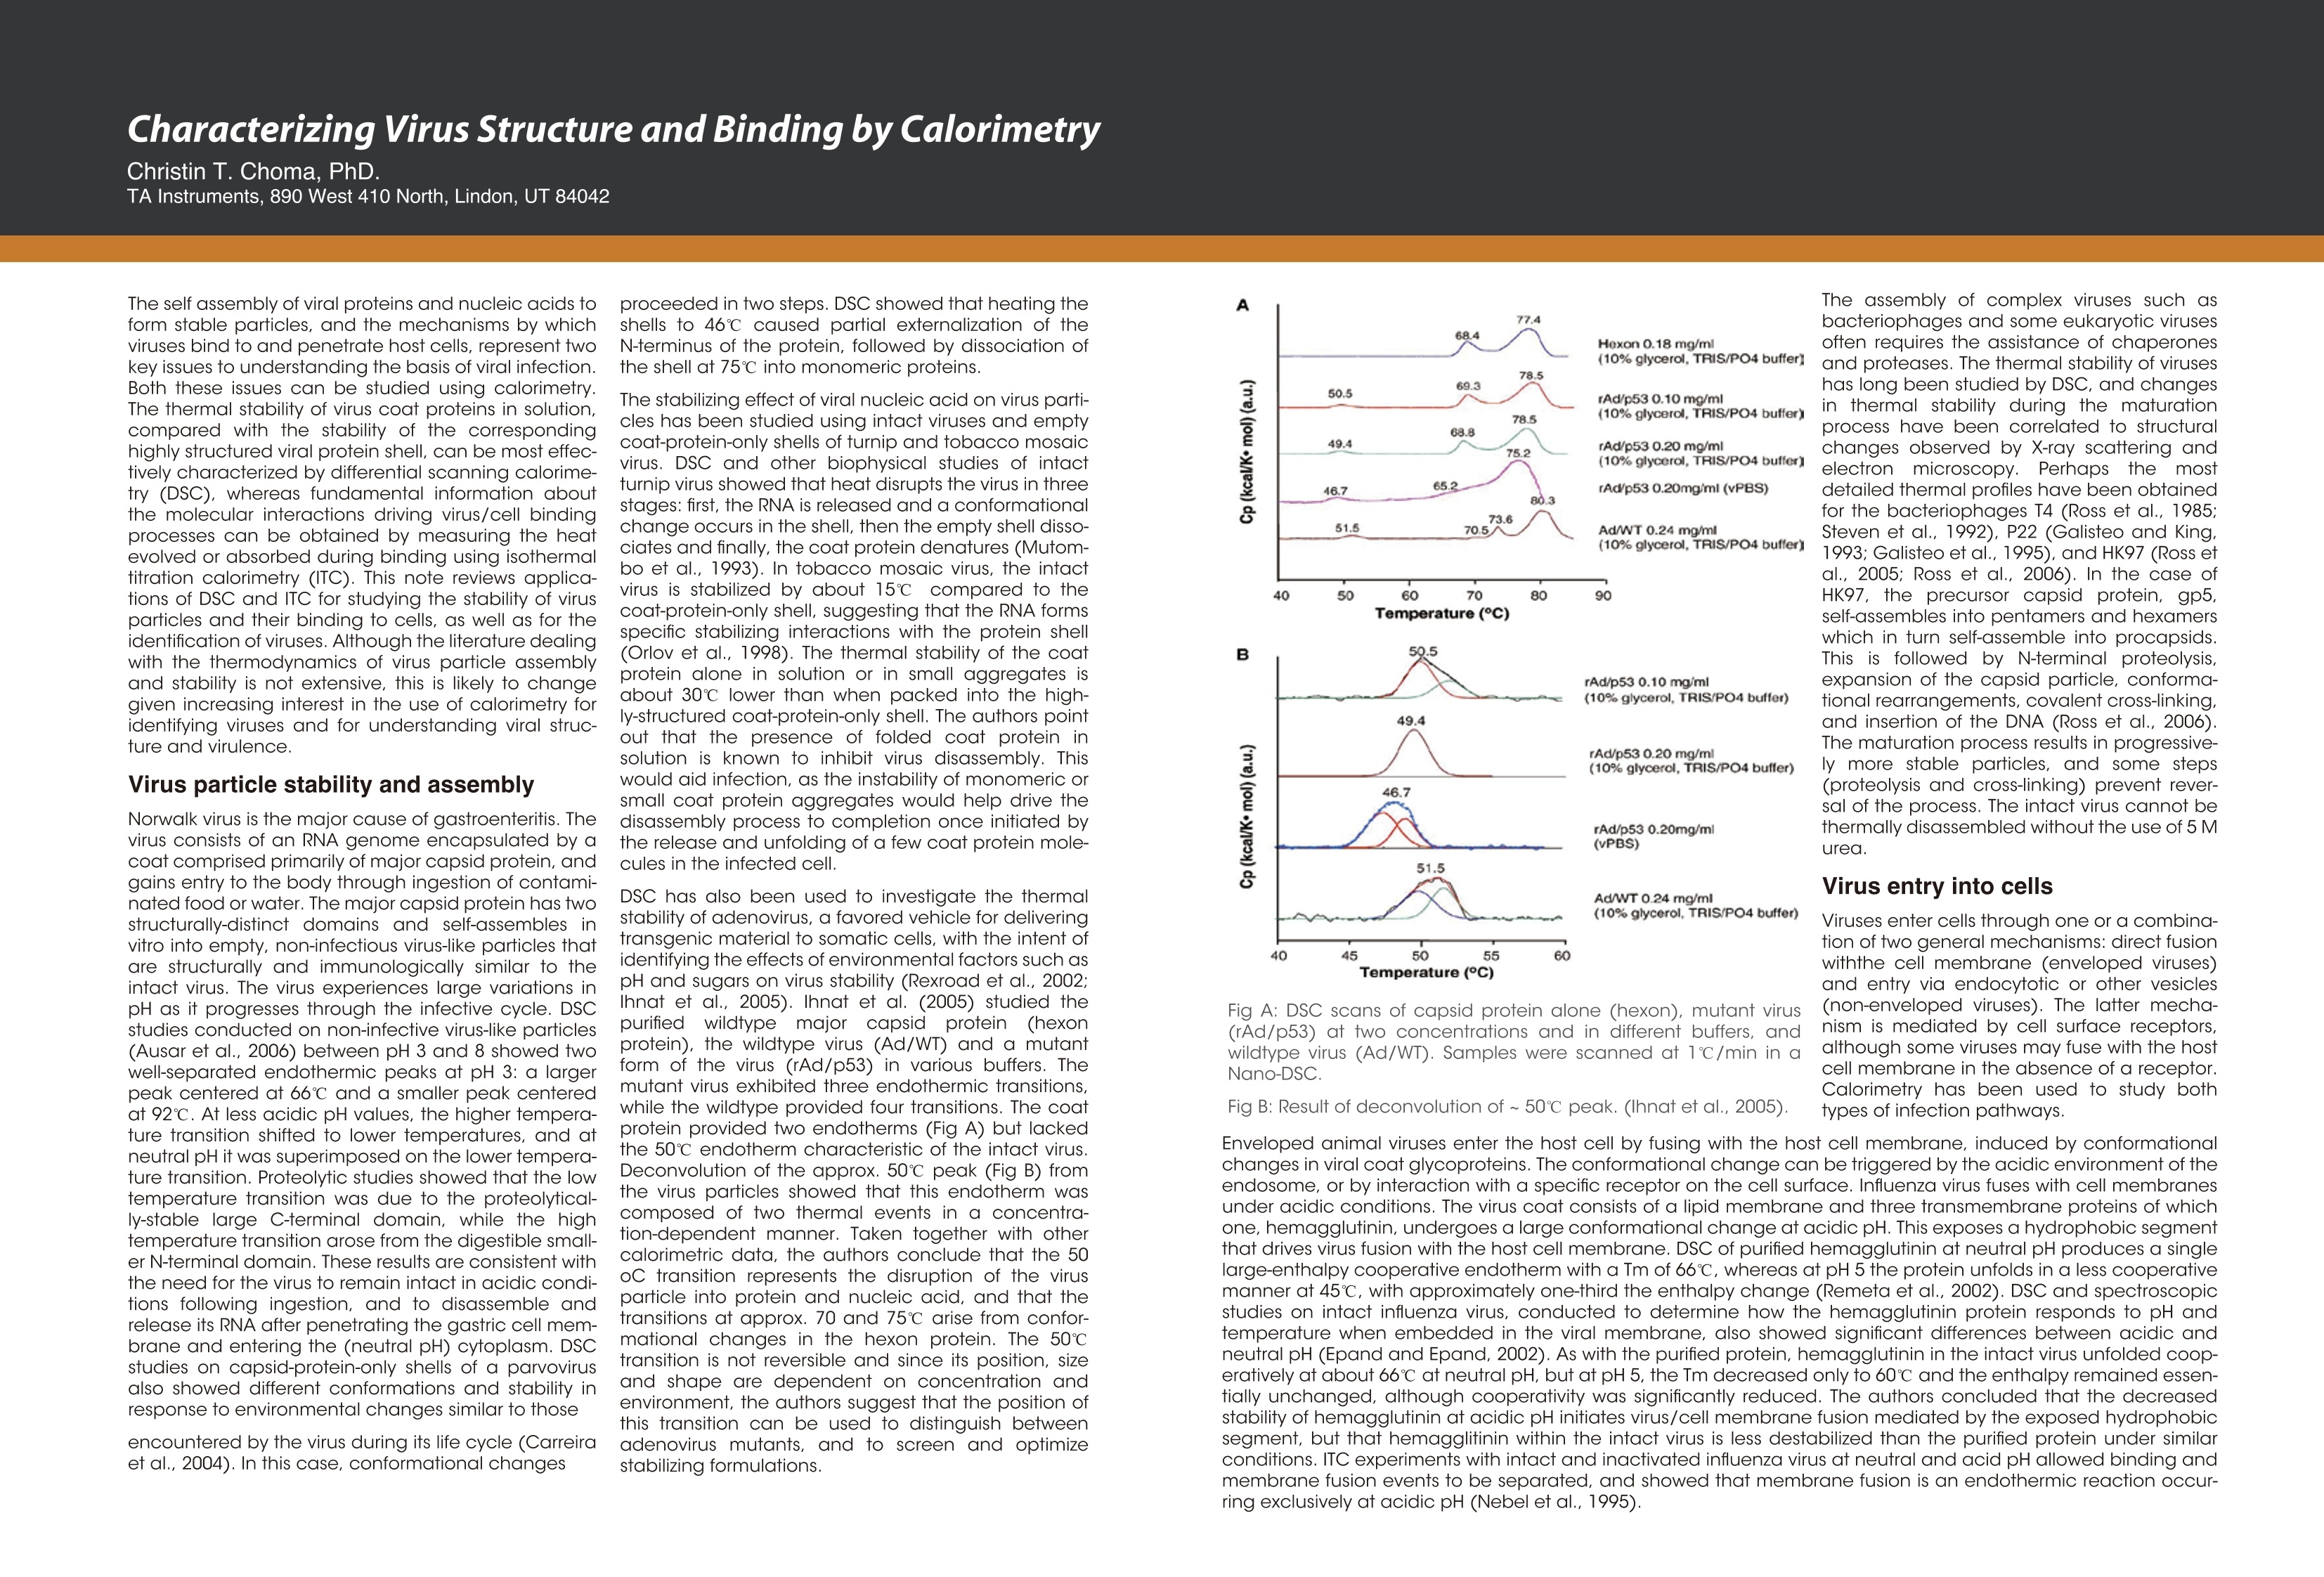
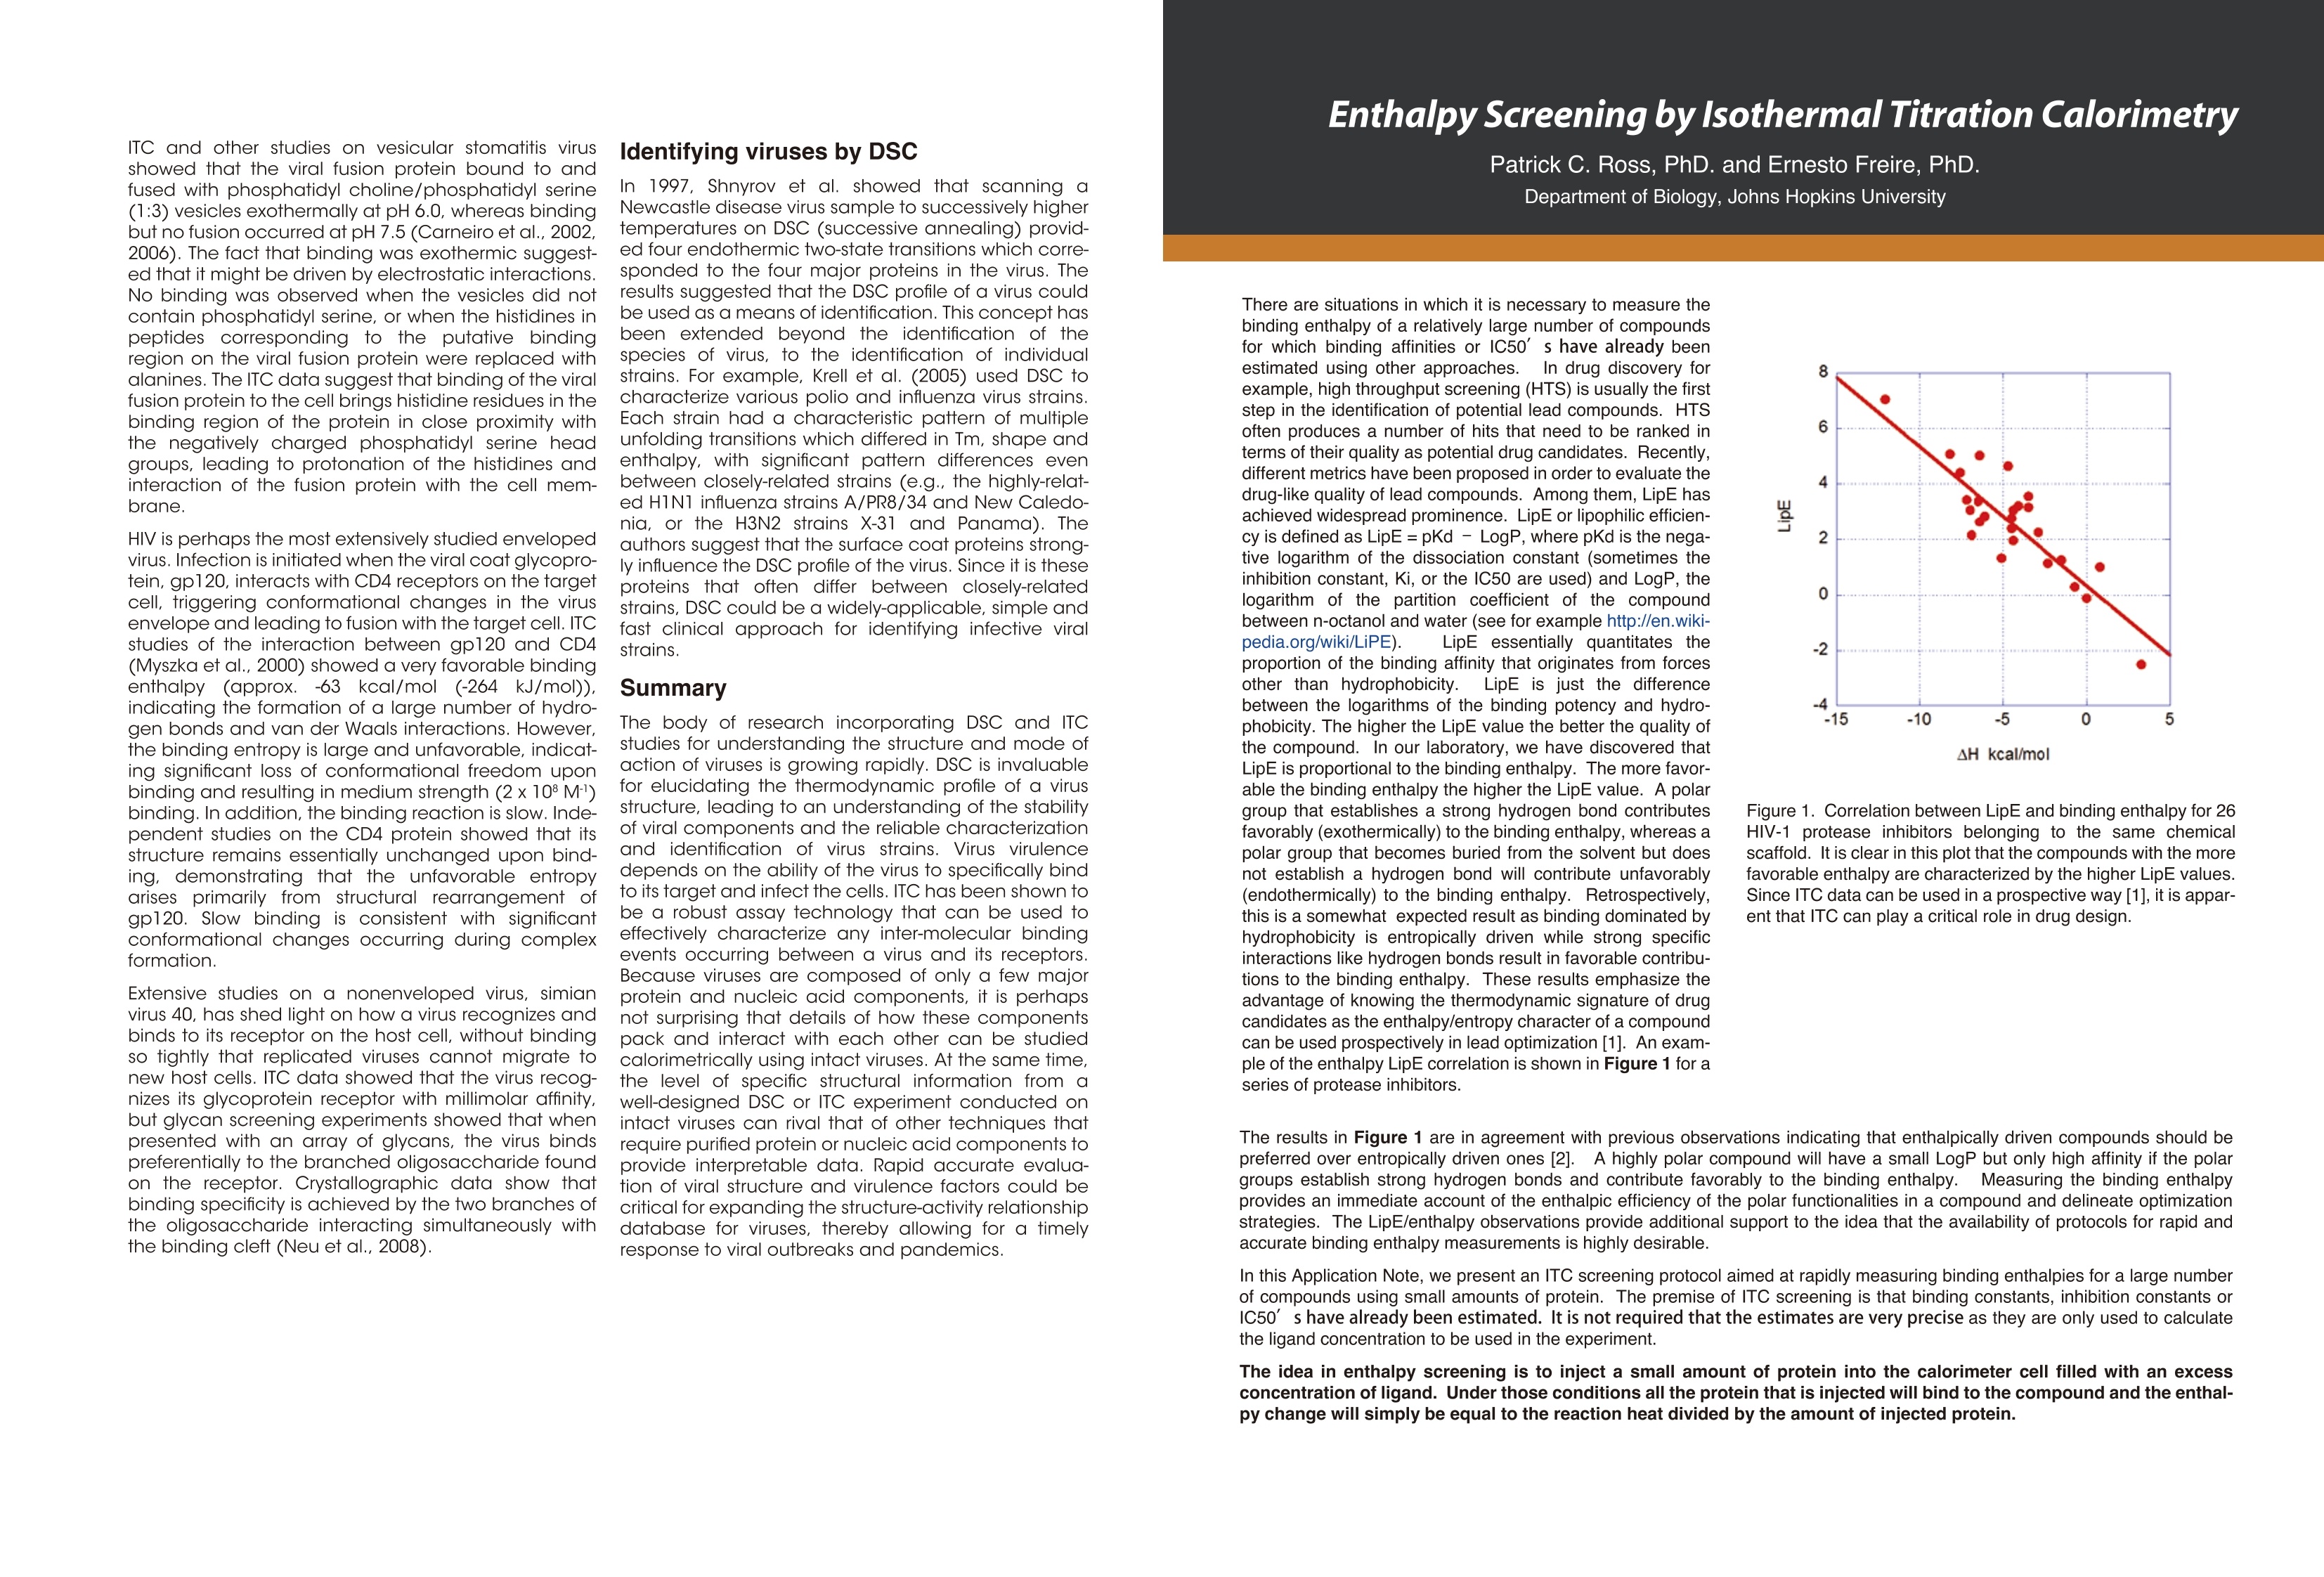
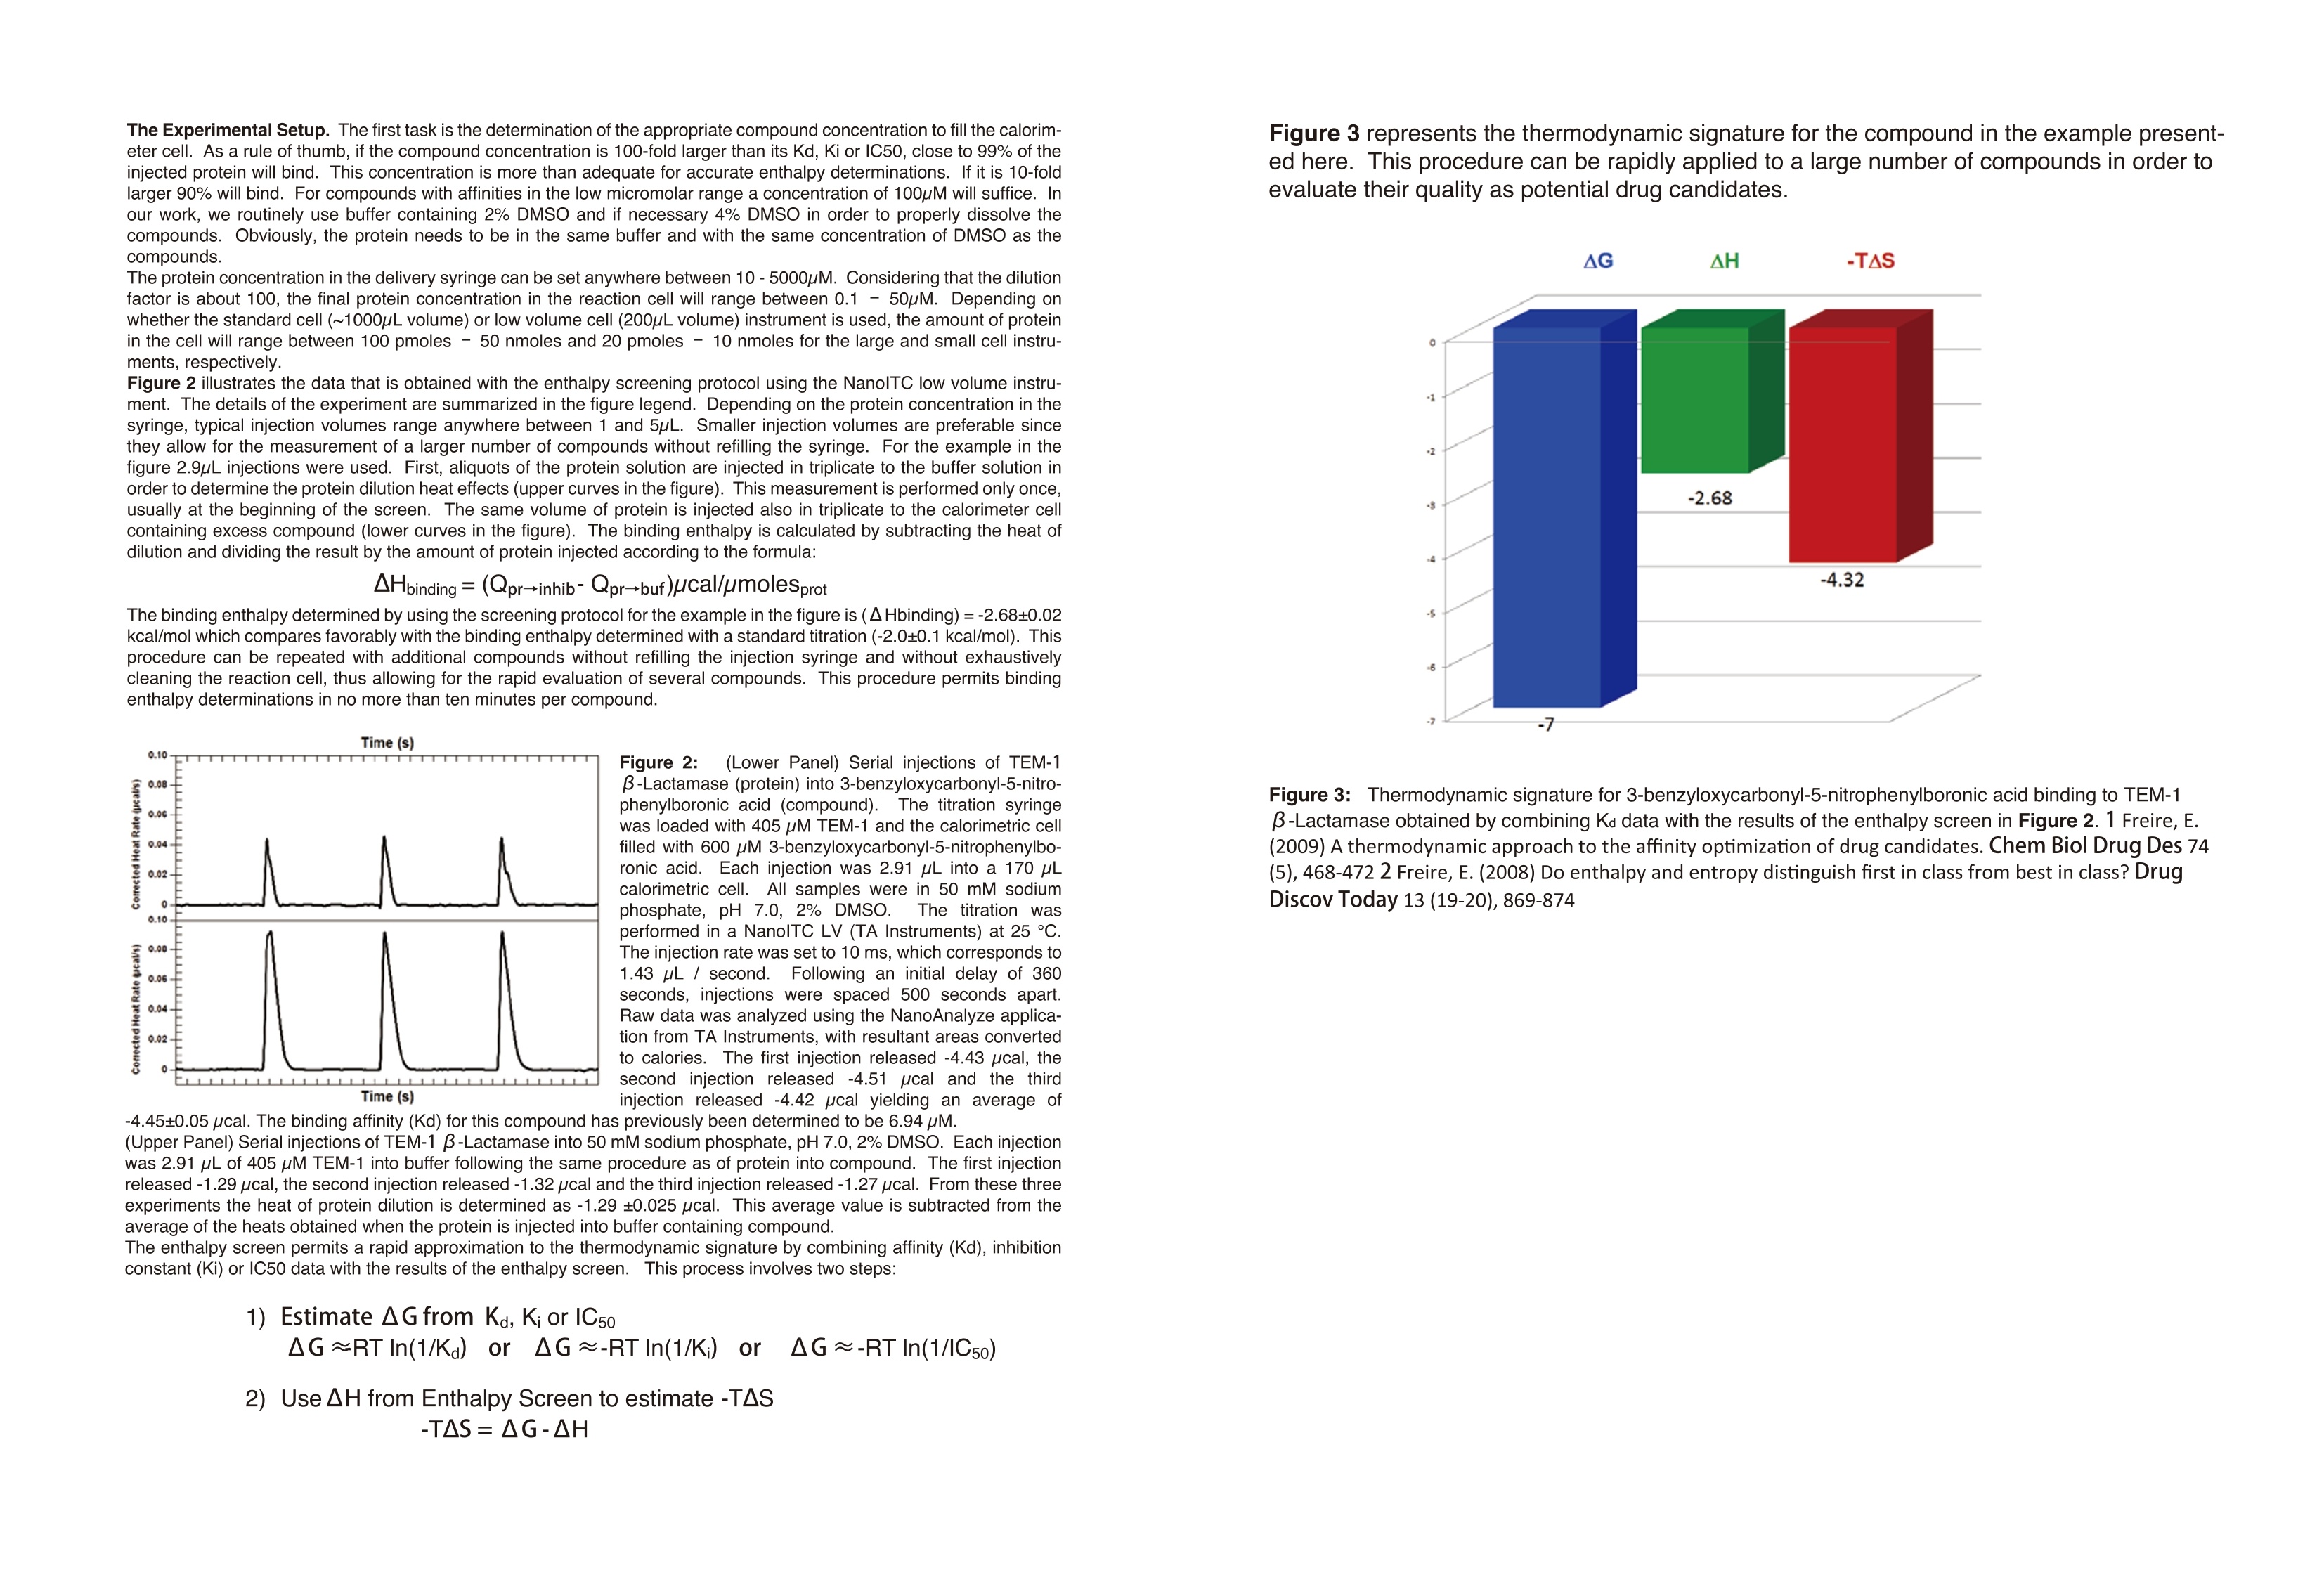
Dile Holton, PhD1Colette Quin, PhD.1Joomi Ahn2St John Skilton, PhD2Ying Qing Yu, PhD21-TAInstruments, New Castle, DE; 2- Waters LLC, Milford, MA Christin T. Choma, PhD.TA Instruments, 890 West 410 North, Lindon, UT 84042 全国咨询专线:800-820-3812 http://www.tainstruments.com.cn 上海总部 地址:上海市漕河泾开发区钦州北路1198号82号大厦16楼邮编:200233电话:021-34182000 传真:021-64951999 北京办事处 地址:北京市朝阳区光华路15号院铜牛国际大厦2号楼9层邮编:100026电话:010-52093842 传真:010-52932280 广州办事处 地址:广州市荔湾区中山七路50号西门口广场1707-08室邮编:510170电话:020-28296555 传真:020-28296556 TA INSTRUMENTS 香港办事处 地址:香港新界沙田香港科学园科技大道西2号 生物资讯中心6楼608室(Unit 608, 6/F, Bio-Informatics Centre,No.2Science Park West Avenue, Hong Kong SciencePark, Shatin, New Territories, Hong Kong)电话:+852-69114226 传真:+852-25496802 Characterizing the Structure andThermodynamics of Antibodies (lgG) by NanoDSC and NanolTC Abstract The development of monoclonal antibody (Mab) based drugs hasundergone considerable growth since the release of the first Mab inthe mid-eighties. Intuitive biophysical tools that examine and quantifyinteractions and conformational dynamics are important in demon-strating and understanding local and global conformational changes.The structure of antibodies as well as other macromolecules is relatedto its function and efficacy therefore control over these parameters isessential. The association of antigens to antibodies or of antibodies todelivery assemblies such as liposomes or gold nanoparticles can beaddressed by isothermal titration calorimetry (ITC) while the folding ofantibodies can be assayed using differential scanning calorimetry(DSC). Both techniques offer the advantage of using native solutionsand both instruments are offered by TA Instruments. Antibodies or immunoglobulins are a specific type of glycoprotein.There are billions of forms, each with a different primary sequence andantigen binding site. Figure 1. Structure of an IgG antibody. The red and the The interaction between the antigen binding site aSPnd an antigen isextremely specific, which has made antibodies very highly desirablereagents when developing a wide variety of antigen detection assays. blue ribbons represent the heavy chains, which define theclass of the antibody, and the green and yellow, the lightchain portion (2lmage taken from ; Wikipedia. Antibody.http://en.wikipedia.org/wiki/Antibody (accessed August11,2011). Antibodies demonstrate a strong structure-function relationship. Because of this relationship, the unfolding or denatur-ation temperature measured by DSC is associated with functional differences. In a DSC scan, an unfolding eventappears as an endothermic peak that can be approximated as a Gaussian or normal distribution curve. The area underthe peak is proportional to the enthalpy change (AH) or unfolding and the temperature of the peak maximum(Tm) isrelated to the Gibbs energy change (AG) for unfolding. The TA Advantage: Superior Sensitivity, Reproducibility, and Flexibility Isothermal Titration Calorimeter (ITC) Isothermal titration calorimetry (ITC) is a straightforward method to determine basic chemical details of a bindinginteraction, affinity, thermodynamics and stoichiometry in a single experiment and under native conditions. Nano ITCLow Volume Min detectable heat (uJ)a 0.05 Max detectable heat (uJ) 3,000 Baseline stability (uW/hr) ±0.02 Short term noise (pW) ±0.0014 Active Cell volume (mL) 0.190 Sample Fill Volume (mL) 0.300 User-selectable stirring speeds 150-400 rpm Figure 2. The Low Volume ITC from TA Instruments When the temperature is raised, as in a DSC scan, a protein unfolds and the sum of all of the enthalpy changes aremeasured and referred to as the AHcalorimeter value (AHcal).Overall, the protein unfolding event is endothermic as the contri-bution from breaking hydrogen bonds out-weighs the contribution of the exothermic events such as the disruption ofhydrophobic interactions. The capillary cell designattenuated protein precipita-tion after unfolding. Nano DSC withCapillary Cell Temperature Range -10 to 130℃ Baseline repeatability(uW) ±0.028 Short term noise (uW)° ±0.015 Active Cell volume (mL) 0.300 Figure 4 The Nano DSC and 96-well plate autosam-pler from TA INstruments Figure 5. Nano DSC Capillary cell ITC Examples Figure 6. 30 um Antigen titrated into 3.6 uM antibody Figure 7. Micromolar (uM) Antibody titrated into Nanoomolar (nM) AuNps DSC Examples When considering antibodies, there is no typical thermo-gram. Some exhibit a single peak in the thermogram,others show several distinct peaks, and others showoverlapping peaks that appear as shoulders on a largerunfolding peak. The shape of the peak in the thermogram provides furtherinsight into the properties of the sample. If denaturationoccurs within a narrow temperature range, then thetransition is considered highly cooperative Figure 8.DSC Thermogram of lw concentrations of antibody.,.2 um (blue) and 0.67 uM (red) Figure 9. Thermograms are easily deconvoluted with NanoAnalyzeTM, theanalysis software package provided by TA Instruments. Conclusion Antibodies are complex proteins and when analyzing binding and structural thermodynamics, require such an instru-ment and data analysis software capabilities that will allow one to fully differentiate between individual and interactingdomains and report accurate Tm values. The combination of the Nano ITC, Nano DSC and NanoAnalyzeTM can facilitatethese needs. Characterizing Weak Binding Events with TwoAdvanced Biophysical Techniques:Hydrogen Deuterium Exchange (HDX-MS) andDifferential Scanning Calorimetry (DSC) Background: The objective of this study was to probe the conformational change caused by a site specific mutation in a humanimmunoglobuin G (IgG). Hydrogen-Deuterium Exchange Mass Spectrometry (HDX-MS) and Differential Scanning Calorimetry (DSC) comple-ment one another and have the laboratory-proven sensitivity and reproducibility to successfully characterize the struc-ture and function of binding molecules. The HDX-MS/DSC data sets enabled a clear, comprehensive characterization of peptide maps and thermodynamicstability changes that help define weak binding events. HDX-MS Experiments / Data ·HDX-MS data for Variant 1 & 2 indicates 3 AA substitution influences molecular structure·Effective mapping of engineered changes in weak binding sites (A) nanoACQUITY UPLC HDX -Waters (B) Xevo G2 Q-TOF MS-Waters (C) Nano DSC Autosampler System - TA Instruments DSC Experiments / Data Tm shift in Variant 1 & 2 indicates molecular structure changes in weak binding sites·Data from DSC thermogram consistent with HDX-MS data Summary / Conclusion: · A combination of HDX-MS and DSC is capable of revealing important structural details for biopharmaceuticalsthat cannot be obtained usingother techniques · HDX can map changes in binding regions and define structure of weak binding sites ·DSC characterization ensures highest quality structural data for differentiating weak binding molecular variantsHDX-MS & DSC provide powerful, flexible analysis tools for DD, R&D and QC Fifty years ago, the elegant experiments ofChristian Anfi nsen showed unequivocally thatthe linear sequence of amino acids of a protein(its primary structure) encodes all the informa-tion for its three dimensional structure (Sela etal., 1957; Anfi nsen, 1973).It is now clear that thesequence directs the interactions both betweencomponent amino acids, and between theprotein and the solvent, and that these interac-tions are governed by thermodynamics. What isnot clear is how the sequence encodes thecomplex structure of a protein. The thermody-namic balance in proteins is delicate: the foldedelicastructure of a small protein is stabilized byapproximately 80-120 kJ/mol (20-30 kcal/mol)compared to its unfolded structure, and manyproteins thermally unfold by 70 oC. If mostproteinscan be denatured by relatively smallincreases in temperature, and if the balancebetween folded and unfolded states is held by theequivalent of 5 - 8 hydrogen bonds, how arethermophilic proteins stabilized, allowing organ-isms to thrive at elevated pressures and attemperatures above 100 oC (Perl and Schmid,2002)? In the absence of thermal changes, what thermodynamic events trigger proteins that cause amyloid and prion diseases to switch from one stable conformation to another,withfatal consequences (Mastrianni, 2004)? Would a thorough comprehension of the interactions controlling conformation permitthe full complement of three dimensional protein structures to be accurately predicted from an organism's genome (Webster2000)? Achieving a fundamental understanding of the thermodynamics directing the formation of macromolecular nonco-valent bonds would answer these questions, and critically impact such diverse endeavors as the self-assembly of protein-in-spired supramolecular structures (Yeates and Padilla,2002),the composition of shape-memory biocompatible polymers (Langer andTirrell, 2004), the rational design of protein-specifi c small molecule drugs (Waldron and Murphy,2003) and the formulation ofstable protein therapeutics (Remmele and Bombotz,2000). The thermodynamic parameters that control noncovalent bond formation in proteins and other macromoleculescan be directly studied and quantifi ed by differential scanning calorimetry (DSC). This Application Note examines the utilityof DSC for characterizing protein stability. For a general description of the principles behind DSC, how a DSC experiment isconducted and interpreted, and the technique's versatility for studying biological problems, please see CSC's Overview Noteentitled Life science applications of DSC. A second calorimetric approach, isothermal titration calorimetry (ITC), is particularly suited to measuring dynamic eventssuch as binding and kinetics. The ITC technique and its utility in biophysical research are described in a separate set of CSCapplication notes. Analyzing protein thermal stability As described in the DSC Overview Note, analyzing the stability of a protein in dilute solution involves determining changesin the partial molar heat capacity of the protein at constant pressure (ACp). The change in heat capacity of a compound refl ectsits ability to absorb heat and experience a defi ned increase in temperature. Because of its extensive hydrogen bond network,water has a substantially higher heat capacity than organic compounds such as proteins. In addition, water is more ordered andtightly packed adjacent to hydrophobic patches on the protein's surface: since water cannot make hydrogen bonds tononpolar moieties, hydrogen bonding between water molecules is maximized (clathrate formation) at the protein-solvent interface(Shinoda,1977). As the temperature is raised,the ordered water shell around the protein starts to disorder and become morelike bulk water. This 'melting' produces the anomalously large heat capacity of protein aqueous solutions. The contribution of theprotein to the calorimetrically measured heat capacity (its partial C) is determined by subtracting a scan of a buffer blank from thesample data prior to analysis. The partial C, is not just the heat capacity of the protein, but also includes any effects the proteinhad on the solvent, such as promoting clathrate formation (Freire, 1995).Heating the protein sample initially produces a slightlyincreasing baseline but as heating proqresses, heat is absorbed by the protein and causes it to thermally unfold over a tempera-ture range characteristic for that protein, giving rise to an endothermic peak (Fig.1). During the unfolding process, water moleculesatParound the protein reorganize and restructure as more non-polar sidechains are exposed. Once unfolding is complete, heatabsorption decreases and a new baseline is established. After blank subtraction, the data can be analyzed to provide a com-plete thermodynamic characterization of the unfolding process. Integration of the heat capacity of Fig. 1. Three baseline temperature scans, and three scans of60 ug of barnase in 0.3 mL 20 mM phosphate buffer, pH 5.5obtained at a scan rate of 1C/min using a CSC6100 N-DSCII. the sample vs. temperature yields the enthalpy (AH)AH_=jc,ar of the unfolding process, which is due to endothermic eventssuch as the breaking of hydrogen bonds,and exothermicprocesses such as the disruption of hydrophobic interac-tions (Bruylants et al., 2005). The shift in baseline beforeand after the transition represents the change in heatcapacity (ACp) of the protein (and associated water) caused byunfolding. The transition midpoint (Tm, or the meltingtemperature) is the temperature at which half the proteinmolecules are folded and half are unfolded. The entropy (AS) is obtained from the area under the curve of C,/T vs. T. Establishing the reversibility of the unfolding reaction is notnecessary if only the determination of Tm is of interest.However, a full thermodynamic characterization of the unfold-ing event requires that the reversibility of the unfoldingtransition be verifi ed (Marky and Breslauer, 1987). This isaccomplished by rescanning the sample under identicalconditions and obtaininga second endotherm that is super-imposable on the first. Irreversibility, if observed, may be dueto a second (irreversible) unfolding event occurring after thefi rst (reversible) unfolding transition at Tm. The capillarycells in the CSC N-DSC II and N-DSC III delay the onset ofirreversible protein aggregation and precipitation,allowing acomplete, interpretable scan to be obtained on essentially anysample. Fig. 2. Temperature scan, converted to partial molar heatcapacity, and fitted baseline for 1 mg mL hen egg whitelysozyme in 0.2 M glycine buffer, pH 2.7. Data obtained at a scan rate of 1 C/min using a CSC6100N-DSCI. The sharpness of the transition peak is indicative of thecooperative nature of the unfolding process.lf unfoldingproduces a narrow, relatively symmetric peak such as in Fig.2, the transition is likely to be two-state, reversible and highlycooperative (Bruyants et al., 2005). This is often the situationfor small, single domain proteins; the more complex behaviorof multi-domain proteins is considered in detail in aseparate application note. Two-state behavior can be verif edby fi tting the curve to the two-state van’t Hoff equation; thiscalculation is performed by software supplied with CSC DSCs.The van’t Hoff enthalpy obtained (AH) can be different fromthe calorimetric enthalpy since the latterincludes all contribu-tions from the sample, including solvent rearrangement.If thevan’t Hoff and calorimetric enthalpies are the same, thedenaturation process may be accurately approximated by thet1iwo-state model. If the van’t Hoff enthalpy is smaller than thecalorimetric enthalpy, an unfolding intermediate is likelyformed,while if it is larger than the calorimetric enthalpy, theprotein is likely multimeric (Marky and Breslauer, 1987). Correlating thermodynamic properties to stability The stability of a protein (and hence its Tm) depends onenvironmental conditions. For example, a protein will beoptimally stable at a characteristic pH, and will be destablizedat pH values deviating from that optimum (Privalov and Khechi-nashvili, 1974). The conformational stability of a protein may beaffected by its concentration (showing the importance ofprotein-protein interactions), ionic strength of the solution(showing the role of electrostatic interactions) and scan rate(showing that thermal denaturation has a kinetic component).LA complete thermodynamic characterization of a simpleprotein such as lysozyme illustrates the complex interplay ofstabilizing and destabilizing interactions, and shows thatlysozyme is unusually stable for a small protein (Pfeil andPrivalov, 1976; Griko et al.,1995). The different heat capacities of Fig. 3. Temperature scan, converted to molar heat capacity, forhen egg white lysozyme solution in 0.2 M glycine buffer, pH4.0. Lysozyme concentrations ranged from 400 ug to 2 ug inthe 300 uL sample cell.Curves are offset to aid presentation.Data were obtained using a scan rate of 2 ℃/min on a CSC6300 N-DSCIII. the folded and denatured form of the protein show that theenthalpies and entropies of both states aree stronglytemperature dependent, but they largely compensate eachother so that the net stability of a typical small protein isapproximately 80-120 kJ/mol (20-30 kcal/mol).The large AC,of unfolding also indicates that a protein will havemaximum stability at a given temperature (depending onits sequence,pH,etc.), and that its net stability will decreaseabove and below that temperature. Thus, proteins can notonly be denatured by heating, but can also be denatured bycooling.Can the thermodynamic properties of a protein,analyzedby DSC, be correlated to structure and stability? Asmore proteins are carefully characterized both experimen-tally and computationally, correlations between thermodyy-namics and structure are being revealed, albeit not yetat a reliably predictive level.A discussion of the stabi-lizing landdestabilizing interactions outlined abovecomprises a vast body of literature;much of this literaturehas been rigorously and comprehensively reviewed byRobertson and Murphy (1997). Several other excellentpapers and reviews on the subject include Privalov andKhechinashvili, 1974; Fersht and Serrano, 1993; Privalovand Privalov, 2000;Cooper et al., 2001; Kumar and Nussinov,2002; Mendes et al., 2002; Russ and Ranganathan, 2002;Chan et al., 2004; Scharnagl et al., 2005 and the followingwebsite:http://www.ocf.berkeley.edu/~aathavan/li-braire/thermodynamicsprimer.pdf The amount of protein available for characterization can bevery limited, which in the past restricted the applicationof biophysical techniques such as DSC.Recent advancesininstrumentn stensitivity have alleviated this cons. by signifi cantly decreasing the amount of sample requiredfor DSC analyses. Fig. 3 Temperature ("C) Table 1.Thermodyanamic parameters obtained from thelysozyme scans presented in Figure 3. shows raw data for lysozyme scanned on a CSC N-DSC Ⅲ.Protein amounts ranged from 400 ug to 2 ug in the 300 uLsample cell.Thermodynamic parameters obtained at allconcentrations are consistent (Table 1), showing that even 2ug of protein can be suffi cient to allow accurate thermody-namic characterization of a protein. Rationalizing the stabilities of folded conformations:mutant vs.wild-type proteins Hydrophobicity scales of the amino acids, andpropensity scales for amino acids in various secondarystructures (Koehl and Levitt, 1999; Acevedo and Lareo,2005), are used in conjunction with molecular modeling topredict the effect of specifi c mutations. Systematicmutation of proteins vwith known three-dimensionalstructures often aims to quantify the resultant stabilitychanges in terms of the energetics of unfolding. A singlesite-specific mutation can give rise to a large increase ordecrease in stability, but many mutations produce onlysmall effects. The ability of proteins to make subtle solva-tion and conformational changes in order to compensatefor the enthalpic and entropic disturbances caused by amutation can result in only small free energy changes beingobserved upon thermal denaturation of the protein. None-theless, the growing database of proteins thoroughlycharacterized by DSC is aiding comprehension of muta-tional effects on the stability of proteins, although caremust be exercised in the analyses (Sturtevant, 1994; Plumand Breslauer,1995;Robertson and Murphy,1997;Brylants etal., 2005). The recent redesign of proteins for increasedstability (Fowler et al.,2005;Leeet al.,2005), and in particularthe rational redesign of enzymes for both enhanced entropicstability and catalytic function (O'Fagain, 2003; Eijsink et al.,2004), illustrate thataslongasthee mechanismscontrolling the stability and thermal unfolding of aprotein are suff ciently understood, it is possible tologically and predictably alter the properties of proteins ofknown structure. Summary Understanding the thermodynamics controlling theformation of macromolecular noncovalent bonds is neces-sary if the promise of diverse endeavors such as the design ofsupramolecular assemblies and therapeutic proteins are tobe realized. Many factors are responsible for the stability of aprotein, including hydrogen bonds to the solvent andintramolecular interactions. Rigorous characterization ofthe thermodynamic basis of a protein's stability is prereq-uisite for enhancing its thermal and functional characteris-tics by sequence alteration. DSC is the most directapproach for determining the intrinsic stability of a proteinin dilute solution,allowing the relationship between enthal-py and entropy of the denaturation process to be quicklyestablished. The superior sensitivity of the CSC N-DSC Il orN-DSCIII allows accurate thermodynamic parameters to beobtained from justa few micrograms of protein Scanning Complex Biological Samples Keywords: differential scanning calorimetry, diagnostic,serum, cancer, brain tumor ABSTRACT Thermal stability signatures of biological fluids, comprisedof a complex milieu of protein can be measured usingdifferential scanning calorimetry (DSC).The DSC is a powerfultool in monitoring changes in the protein equilibrium thatis perturbed by disease or cancer through amplification,modification, or multiple interactions of proteins andpeptides. Through thermal denaturation of the proteins in abody fluid or tissue, trends have emerged that are linked todisease type and its progression, making DSC a complimentto historical diagnostic techniques. INTRODUCTION THE PLASMA PROTEOME The proteome is comprised of ~ 3000 proteins with over 90%of the protein content in plasma comprised of only 12 types(Figure 1) (1). Abundant biological macromolecules suchas serum albumin and immunoglobulins that are currentlyused in an FDA approved test as elevated or suppressedlevels can indicate diseases (2-4). It is hypothesized thatthe smaller peptides and proteins that contribute to a lesserproportion could potentially contain hundreds of interestingbiomarkers. Initial success at proving this hypothesis hasbeen achieved with particle size and charge techniques,such as, 2D electrophoresis and mass spectrometry (5-8)However, this success has not been without roadblocks. Forsome cases, the diagnostic peptide is not detectable dueto low concentration or complexation. This complex webof multiple interactions that includes biomarkers and themore abundant proteins like HSA or IgG is referred to as the"interactome" (9). Figure 1:Major Plasma Proteins. Figure was created based on averageconcentrations:Putnam (1). By measuring the difference in heat flow between a sampleand a reference, while both are heated at a constant rate,differential scanning calorimeters are able to measure theamount of heat absorbed or released during thermallyinduced transitions. An event in one cell creates a thermalimbalance that is compensated for by feedback heatersattached to the instrument cells.In most experimentalbiopolymer DSC studies, a single pure protein is scannedagainst a buffer while the thermally induced enthalpy ofunfolding, temperature of unfolding, and change in heatcapacity is collected. An additional application includesquantification of the binding affinity between a ligand and atarget macromolecule (10). Investigation of a complex milieu is an emerging field of studyusing a DSC instrument. Instead of a single protein, multipleproteins in a single sample of plasma, urine, cerebral spinalfluid, and brain tissue homogenates are assayed with a DSC(11-22). DSC is sensitive to composition and interactionswithin a sample and a complicated thermogram is relatedto complexity of the samples. Variations detected includemultiple domains, intermediates formed, possible oligomericstates, and impurities. For serum, tissue, and other samplescontaining multiple proteins, the overall thermogram isthe sum of each individual plot, where the magnitude iscorrelated with its abundance in the sample. Furthermore,any binding to these proteins in this complex will alter thethermogram as well. If the binder stabilizes the overall globularprotein structure, then the T will increase, and if the binderis specific for a site only available in the unfolded state, thentheT will decrease. EXPERIMENTAL The majority of the publications to date use the same simpleprocedure: centrifugation, filtering, dialysis, and dilution(~2 mg/mL total protein for plasma yeilds a suffcient signal).Addition of DNAse and collagenase has been used aswell for tissue samples (Chagovetz. et al.). A solution suchas phosphate buffered saline at physiological pH is usedto dilute the samples. The sample is scanned on a senstiveDSC, such as the NanoDSC, at 0.5 to 2C/min. A slowerrate is chosen for fine detail definition and a faster rate for alarger signal.The resulting thermogram is normalized to theconcentration of total protein that has been determined viathe biuret, bicinchoninic acid assay or a similar method. Anadvantage to using DSC in comparison to other techniquesis that it does not require labels or complex fractionation. A background buffer scan is subtracted and the datais normalized - typically to the total protein content. Theresulting unfolding thermogram can be fitted and the Tor T,AH, and shape are unique to each protein under aspecific condition. PLASMA AND SERUM STUDIES When investigating the proteome with DSC, the firstthermogram to establish is the "normal".This can be normalserum, plasma, or tissue, depending on the sample sourceOQnen eof the reasons that this type of DSC experiment worksis consistency. The thermograms below in Figure 2 werecollected and assayed in a similar manner to those outlinedby Garbett et al. 2009 (14). The profile agrees with previousdata of 100 healthy individuals (14) and as expected, thefibrinogen peak that is present in plasma (data not shown)around 50°C is absent in the serum thermogram.The normalor healthy assay is often used to assess the collection andprocessing of all experimental samples. There was a distinct difference in all disease versus normalplasma thermograms cited in this body of work (11-15, 17-19, 21, 22). Most noticeably was an increased percentageof the area of the total thermogram originating from highertemperature transitions. In order to better explain this shift,the idea of citing the temperature at half the area under theentire unfolding event (temperature first moment, Try) wasintroduced (13) and has been adopted by others (19). InFigure 4, a normal plasma thermogram has both theTandTu marked with excess heat capacity (C ex) on the y-axis. Acommon feature of the thermograms is a decrease in themagnitude of the Tmax and an increase in the later, highertemperature peaks, thereby shifting Tr· This could be due torelative changes in the concentrations of different proteins,such as the albumin concentration has decreased while theimmunoglobulin concentration has increased.An alternativeto this theory is proposed later in "modification and theinteractome". One of the plasma thermograms from this group was plottedalong with the individual thermograms of a few of the moreabundant proteins in plasma (Figure 3). The individualprotein thermograms were normalized using the area underthe plasma thermogram, and this area was multiplied by thepercent protein expected in plasma. These four abundantproteins in the blood make-up the majority of the featuresof the experimental thermogram and enable identificationof the major peaks. A more thorough study including the16 most abundant proteins was completed earlier and theadditional proteins add the fine detail to the thermogram(13,14). Figure 4. Features of unfolding: the yellow is the first half of the total areaand the green is the second half of the total area. For soft tissue inflammmation (STI) there was a decreasein the albumin concentration and an increase in theimmunoglbulin and fibringogen concentrations that wasobserved in the thermogram (3). The T did not changefor these cases, but the Te did shift to a higher temperatureas the concentration of the higher temperature proteins,such as the immuoglobulins, increased (19). Thermogramsfrom patients with Systemic Lupus Erythematosus werealso distinguished from the healthy profile because of theincreases in haptoglobulin,IgA, and IgM concentrations (13). In addition to the inflammation study, the primary focus ofthe Todinova paper was to assay colorectal cancer patientplasma. It was important not only to study healthy versusneoplastic thermograms, but also inflammation versuscancer, because inflammation can be a "hallmark of cancer"(19).The STI thermodynamic profile was distinguishable fromthe cancer profiles. Within the cancer examples,groups andsubgroups were thermally identified using pp(arameters suchas Trw, and excess heat capacity (C ex similar to height ofpeak) ratios of identified peaks. This study opens the ideathat the difference in profiles was not because of a decreaseor increase in protein levels, but had originated from anothercause other than amplification. For theseparatetediseasesis OT chroniicc obstructivepulmonarydisease (COPD)) and breast cancer, thethermograms of plasma showed significant changes in thealbumin peak. This peak appeared to be either shifted to ahigher temperature or the level of albumin was decreased(15,18).Based on the finding of Todinova, it is more likely thatthe protein concentrations remained consistent and thatthere was another protein stabilizing effect occurring. As thediseases progressed through stages, there were observablechanges within the thermograms. An increase in the Tof the major peak within the thermogram being relatedto the progression of each of the illnesses (15,18). For thebreast cancer study, the shift in the T was also related tothe size of the tumor (18). The DSC showed some potentialdiscriminatory power for both grade and stage in these twodiseases. MODIFICATION & INTERACTOME The complex and webbed interaction between proteins andpeptides has inspired the term"interactome"(9)Componentsof the peptidome bind with and thereby modify the moreabundant proteins, such as those listed in Figure 1. One ofthe difficulties posed when exploring small biomarkers withserum protein electrophoresis (SPE), is the minor changes inboth size and charge. The interactome idea may explain the trends observed in theDSC profile for diabetic patients concurrently suffering witheither severe coronary artery disease, rheumatoid arthritis,or Lyme disease (12,13). The FDA approved SPE assay thatdetects changes in major serum proteins, did not detect anysignificant changes between normal and diseased samplesfor these three separate cases (12,13). However, the diseasethermograms did display a marked change with largermagnitudes of higher temperature peaks (12,13). If theprotein concentration of the albumin and IgG had changedin magnitude or charge, this would have been detected bySPE.The changes detected by the DSC could be indicative of a modification or interaction of the major serum proteins with a potential biomarker. The hypothesis of the interactome was investigated byGarbett et al. 2008 by adding a known binder, bromocresolgreen, to a pure albumin sample (13).While the total proteincontent remained consistent, the peak shifted to a highertemperature, indicating that the addition of the ligandhelped stabilize the folded form of the protein (13). Thistheory has been further supported by a recent study of type1 diabetes patients with early renal function decline (21).Qualitatively, there was a significant shift in the size of the Tmaxpeak relative to normal and an increase in the area percent:(?1)of the higher temperature peaks (21). Thermal stabilizationthrough post-translational modification could accountfor increase in higher temperature peaks as the levels ofalbumin and immunoglobulins remained constant.This ideawas corroborated by an increase in modified or oxidized proteins that are known to interact with other proteins (21). Recent studies have paired this qualitative idea of the interactome with a more quantitative approach thatcombined DSC and Mass Spectrometry (MS).To support thisapproach,the shift in the DSC profile of the Trw to a highertemperature was due to modified proteins rather than anincrease in globulins and a decrease in albumin. Differentfractions were also analyzed by MS (22). In the fractionlabeled FX2, defined as isolated peptides that were boundto total plasma proteins, several biomarkers in the plasmaand urine were identified by MS, thereby supporting theinteractome concept (22). The discriminating features of theDSC that enabled differentiating between cancer stageswere observed in the C ex (height) ratio (22). All types ofcancer were significantly different from the healthy samples,showing discrimination in T,Trw, width and C ex ratios (22). One of the non-plasma examples,cerebral spinal fluid (CSF),from patients with brain cancer, was chosen because it wouldbe a closer fluid to the disease of interest(16). Chagovetzwas able use DSC thermograms to definitively separateneoplastic and non-neoplastic cases, and within neoplasticcases,carcinomatosis meningitis originating from non-neuralcancer from the neural cancer glioblastoma multiforme(GBM) (16). A key observation was that the metastasizedcancer retains specific properties that differentiate it eventhough it has spread to the meninges. TISSUES DSC was used to assay homogenates from human braintumor biopsy samples and the resulting thermograms werecorrelated with histological tumor classification (20).The datawas fitted to four independent Gaussians with variables fortemperature (T) enthalpy (AH) and a scaling factor (A).Ais related to the relative abundance of the protein denaturedin the transition.A and AH also describe the overall shape ofthe transitions.A small AH and large A will result in a relativelywide and short unfolding transition, whereas an unfoldingtransition with a small A., and large AH will be relatively sharp.Differences in glioma-specific thermograms were describedby using calculated parameters at transitions that werecharacterized and statistically significant differences typicallyobserved in the A and AH parameters (20).These differencesindicated that the temperature of unfolding didn't changesignificantly, but the abundance and ratios of proteins atthese temperatures did. Figure 5.Average thermograms for brain cancer tissue and normaltissue samples. CONCLUSION The studies referenced in this review have successfullydemonstrated a correlation between an observed uniquethermodynamic signature collected from body fluids andtissues and an existing disease. With each malady havingits own DSC signature, the DSC technique lends itself tobecoming an essential and complimentary diagnostic toolin identifying and monitoring disease progression. The datacollected via DSC should be considered a complimentto currently approved clinical methods such as SPE andhistology and their ability to differentiate types and gradesof diseases. A thorough and detailed differential diagnosiscan be critical in the selection and administration of themost efficacious therapy.As more studies are completed, it ispossible that a reference library of normal and disease DSC. profiles will emerge and be utilized to aid in future cases. ACKNOWLEDGEMENTS Prof. Graves, Prof. Hansen, Caitlin Nichols at BYU in Provo, UT forhealthy plasma and serum samples. Determining Thermal Stability of Antibodies with a Nano DSC Colette F. Quinn, Ph.D. and Neil A. Demarse, Ph.D. TA Instruments, 890 West 410 North, Lindon, UT 84042, USA Antibodies or immunoglobulins are a specific type ofglycoprotein. There are billions of forms, each with adifferent primary sequence and antigen binding site(1). Mammals have five classes of antibodies,IgA, IgD,IgE, lgM, and lgG; the major class of antibodies in theblood is IgG.A typical antibody structure is Y-shaped.The tail is referred to as the Fc (fragment crystallizable)region and the two arms, the Fab (fragment, antigenbinding) regions. Each Fab region, the red and blueportions paired with the green and yellow regions inthe structure below, contains the highly variableregions of the molecule and an antigen binding site(1). The interaction between the antigen binding siteand an antigen is extremely specific, which has madeantibodies very highly desirable reagents when devel-oping a wide variety of antigen detection assays. Figure 1. Structure of an IgG antibody. The red and the blueribbons represent the heavy chains, which define the class ofthe antibody, and the green and yellow, the light chainportion (2). Antibodies demonstrate a strong structure-functionrelationship (3). Because of this relationship, theunfolding or denaturation temperature measured byDSC is associated with functional differences. In a DSCscan, an unfolding event appears as an endothermicpeak that can be approximated as a Gaussian ornormal distribution curve. The area under the peak isproportional to the enthalpy change (AH) or unfoldingand the temperature of the peak maximum (Tm) isrelated to the Gibbs energy change (AG) for unfold-ing. Unfolding of a protein is dependent on thenon-covalent intramolecular bonds such as hydro-phobic interactions, hydrogen bonds, salt bridges,and conformational entropy(4). When the tempera-ture is raised, as in a DSC scan, a protein unfolds andthe sum of all of the enthalpy changes are measuredand referred to as the ▲ Healorimeter value (AHea). Over-all, the protein unfolding event is endothermic asthee contributionfrom breaking hydrogen bondsout-weighs the contribution of the exothermic eventssuch as the disruption of hydrophobic interactions. Theunfolding transition for almost all protein domainsoccurs at a characteristic temperature called thetransition midpoint, Tm, where the enthalpy changesand the entropy change, i.e. TAS, are equal. Since AG=AH-TAS and AG=0 at this temperature. The shape of the peak in the thermogramprovides further insight into the properties of thesample. If denaturation occurs within a narrowtemperature range, then the transition is consideredhighly cooperative (5). A thermogram with more thanone peak can also be fit with multiple Gaussianmodels. Proteins that contain multiple domains withdiffering stability and or highly interactive domains andsome oligomeric proteins typically require multiplemodel fitting of the thermogram data to fully under-stand the structure-function relationship. When considering antibodies, there is no typicalthermogram. Some exhibit a single peak in the thermo-gram, others show several distinct peaks, and othersshow overlapping peaks that appear as shoulders ona larger unfolding peak. The number of peaksobserved has been proposed to be related to theflexibility of the hinge region (6). Previous studies onmulti-domain proteins suggest these complex thermo-grams and overlapping peaks arise from interactionsbetween domains (7). Some DSC studies havesucceeded in identifying the unfolding temperature ofeach separate domain within the heavy chain portion(8). Thermograms are easily deconvoluted with Nano-Analyzem, the analysis software package provided byTA Instruments. This capability is shown in Figure 2, athermogram of an lgG antibody at a concentration of2 pM that exhibits these unfolding events. Initially, thedata was fit with a single two-state scaled model andthen additional models were added as needed. Themost appropriate number of models for an optimum fitof the complete thermogram in Figure 2 was three asshown by the plot of the differences between the mea-sured and fitted data. The final choice of the number ofdomains to fit individually was based on the goodnessof the fit (quantitative), the overlap of the sum, showngraphically, (qualitative), as well as additional relevantinformationobtained from references in the literatureto similar antibody systems (4). Figure 2. Antibody DSC Thermogram. In Figure 2, the first unfolding event was attributed tothe CH2 domain, the second to the Fab domain, and thethird, a high temperature event, to the CHs domain. Previ-ous data published by Wen in 2008 (8) assisted in theanalysis of the thermogram and allowed an accurateassignment of the individual domains to specific peaks orshoulders in the thermogram. The unfolding of the threedomains was not resolved into three separate peaks,indicating that these processes were influencing the finalthermogram shape. Despite the fact that these peakswere not resolved, the fitting algorithms were able tosuccessfully and accurately deconvolute this broad,asymmetrical, unfolding event. A large enthalpy and a small scaling factor allow forsharp (cooperative) unfolding events to be properly fitted.The enthalpies associated with each domain can becompared only after normalizing the data to obtain theAiheat associated with unfolding event. Direct comparisonof the AH values for each event suggests the CHs domainmake the largest contribution to overall enthalpy. Howev-er, to give a rank order to the contributions of eachdomain, the product of the Aw and AHvan’t Hof for eachindividual domain should be compared. The sum of theproduct of the scaling factors, Aw, and the enthalpies, AHvan’t Hoff, of the fit yields the total AHeal. For the antibody inFigure 2, this value is 3716 kJ/mol and 58% of the heatoriginates from the Fab portion and only 11% originatesfrom the CH3 domain, which is consistent with their relativesizes A second example, Figure 3, is of another antibodythat exhibits only a single skewed peak in the thermo-gram. A sigmoid baseline is applied to the data toaccount for the significant change in heat capacityaccompanying the unfolding. The DSC thermogram for the antibody in Figure 3was also asymmetrical. Since limited information wasavailable concerning the domain structure of thissample, several different analyses were applied. The firstwas the general model, which in addition to the AH andTm values, a heat capacity (ACp) value could be deter-mined from the model.During the unfolding process theheat capacity (ACp) of a protein also changes. ACp isalmost always positive: a denatured protein has a higherheat capacity than the native folded protein. The heat capacity changes are due to restructuring of solventmolecules around the non-polar side chains exposed tosolvent during the unfolding process (9). Therefore, themagnitude of AC is dependent on the number ofhydrophobic side chains that were buried in thenative conformation. Figure 3. Antibody DSC Thermogram showingonly one, skewed peak. After examining the residual and the magnitude ofthe AC, from the fitted data it was determined that theasymmetry restricted the ability of this model to fit thedata. Two other fitting routines were applied, one with asingle model and the other with two models. Although thedata was fit better with two models versus one, the residu-al and the standard deviation had insignificant changeas more variable were added. Rather than over fit or incorrectly fit the data, Tmax, AHea and ACp were reported. For this type of analysis, thedata is converted to molar heat capacity (MHC), asigmoidal baseline is applied, and the area under theentire unfolding curve is quantified and normalized. Themagnitude ofACp was determined manually bysubtracting the average of several data points after theunfolding transition from the average of several datapoints before the unfolding transition. The AC, deter-mined was 7.24 kJmoliK. The type of analysis for an antibody thermogram depends on the particular structural characteristics ofeach individual antibody. Although the asymmetricalshape in Figure 3 could indicate that there are domainsunfolding independently of each other, there is an alter-native explanation. The unfolding may not be a truetwo-state (folded or unfolded) process. Without furthersubunit analysis or other biophysical information on theantibody structure, the analysis was kept as simple aspossible and the enthalpy reported was free of modeling.The Nano DSC is an essential tool for scientists workingwith antibodies to characterize the structure-functionrelationships that may exist. Antibodies are complexproteins and when analyzing structural thermodynamics,require such an instrument and data analysis softwarecapabilities that will allow one to fully differentiatebetween individual and interacting domains and reportaccurate Tm values. The combination of the Nano DSCand NanoAnalyzetm can facilitate these needs. Discovery and Characterization of Inhibitors ofProtein/Protein Interactions by ITC. Arne Schon, PhD and Ernesto Freire,PhD Department of Biology, Johns Hopkins University The inhibition of protein-protein interactions is a major goal in the therapy of different pathological conditionsincluding cancer, inflammation, autoimmune diseas-es, diabetes, osteoporosis, infection, etc. Sinceprotein-protein interactions play a critical role in biolog-ical signaling, the identification and optimization ofmolecules that inhibit those interactions is a majorresearch objective in the pharmaceutical industry. Thenumber of targets of interest is continuously increasingand range from a vast number of cell surface recep-tors, such as EGFr, TNFr, and IGFr to other proteinsinvolved in signaling and regulation (1, 2). In the caseof HIV infection, for example, the first event is the bind-ing of the viral envelope glycoprotein gp120 to the cellsurface receptor CD4 (3. 4). Until now, biologics, i.e.monoclonal antibodies or recombinant versions ofligand proteins and/or soluble regions of the receptors,have defined the therapeutic arsenal aimed at target-ing protein/protein interactions. The identification of small molecules that accomplish the same goals hasbecome a new frontier in drug research. Isothermal Titration Calorimetry (ITC) plays a criticalrole in the identification and characterization of inhibi-tors of protein/protein interactions (PPI). The identifica-tion of PPI inhibitors is fundamentally different to theidentification of enzyme inhibitors for which inhibitionassays are relatively easy to implement using a varietyof approach. For PPI, functional or cell based assaysdo not reveal the molecular target(s) of moleculesidentified as active. On the other hand, binding assaysalone cannot tell if a binder is also a PPl inhibitor. ForPPI inhibitors it is necessary to implement an assay thatmeasures directly the association between the twoproteins and its inhibition by the inhibitor candidates.This is the assay where ITC excels. The identification of PPI inhibitors by ITC requires: 1. Measuring the binding of the two proteins.Thisexperiment is performed once and serves as thereference. 2. Measuring the binding of the two proteins in thepresence of a fixed concentration of the inhibitorcandidates. 3. The characterization of those molecules that scoreffuiesHaavorably in the PPI inhibitors screen is performed bydirectly measuring the binding of the selected com-pounds to the target proteins. Measuring Protein/Protein Binding In this Application Note we will use the binding of theenvelope glycoprotein of HIV-1 gp120 to the solubleform of the cell surface receptor sCD4 as an exampleThe reaction cell of the Nano ITC Low Volume (LV) (TAInstruments, New Castle, DE) is filled with 0.17 mL of 4.5pM of gp120. The injection syringe is filled with a 45 pMsolution of sCD4. These protein solutions are equiva-lent to 0.25 and 2.0 mg/mL respectively. Injectionvolumes are 2uL in all experiments presented here. Ingeneral, with the current instrument precision the. protein concentrations can be reduced 3-fold and stillobtain accurate results. All protein solutions are in PBS(Roche Diagnostics GmbH, Mannheim, Germany), pH7.4 with 2 %DMSO. Figure 1 shows the titration of sCD4into gp120. It is consistent with an associationconstant, Ko, of 1.2×10° M or equivalently a dissocia-tion constant Kd = 1/K。 of 8.3 nM. Furthermore, thebinding enthalpy, AH, is -38.0 kcal/mol and theentro-py contribution to the binding Gibbs energy, -TaS, is27.0 kcal/mol (1 cal= 4.184 joules). The thermody-namic signature in the inset provides a visual represen-tation of the magnitude of those contributions to bind-ing. Figure 1. ITC titration of sCD4 into gp120 The binding of sCD4 to gp120 is characterized by largefavorable enthalpy and large unfavorable entropychanges, indicative of a binding reaction associatedwith a large structuring process. In this case, the bind-ing of sCD4 triggers the folding of intrinsically disor-dered domains in gp120 (5.6). Protein/protein bind-ing not associated with large refolding processes arecharacterized by favorable enthalpy and entropychanges. Screening for Inhibitors The identification of PPI inhibitors is accomplishedby performing the same experiment shown in Figure 1except that the reaction cell also contains a fixedconcentration of an inhibitor candidate. Since initialleads are usually active in the low micromolar range, agood concentration is in the hundreds micromolarrange.. If a compound inhibits the protein/proteininteraction, it will be observed as a decrease in theobserved or apparent binding affinity, Kapp. The magni-tude of the decrease can be expressed in terms of theratio A= Kapp/Ka. If A = 1, then the compound has noeffect on the protein/protein interaction. If A<1, thenthe compound has an inhibitory effect. If all thecom-pounds are screened at the same concentration, then the parameter A suffices to rank them in terms of theirinhibitory potency. Sometimes a compound is foundthat exhibits an A value greater than one. This com-pound actually increases the binding affinity acting asan agonist of the protein/protein interaction. Whilemost of the time drug developers are searching forinhibitors, we should emphasize that this technologyalso allows for the identification of PPl agonists. Figure 2 shows a titration similar to the one shownin Figure 1 except that the reaction cell also contains200pM of NBD-556, a small molecular weight (MW =337.84) low affinity sCD4/gp120 inhibitor (5, 6). Thisexperiment is consistent with an apparent associationconstant, Kapp, of 7.7×10⁶ M or equivalently an appar-ent dissociation constant Kd.app = 1/Kapp of 130 nM,indicating that the presence of the compound signifi-cantly reduces the affinity of sCD4 for gp120.. Theapparent binding enthalpy is -23.0 kcal/mol and theapparent entropy contribution to binding is 13.6kcal/mol. The thermodynamic signature for this experi-ment is also displayed in the inset. Most importantly,the A value is 0.064 indicating that this compound is aPPl inhibitor. Figure 2. ITC titration of sCD4 into gp120 in the presenceof 200pM NBD-556 Characterization of PPI Inhibitor The experiments in Figures 1 and 2 identify a compound asa PPI inhibitor. A more complete characterization of thecompound is obtained by measuring its binding thermody-namics to the target protein. If the target protein is notknown, separate ITC experiments with each of the twoproteins need to be performed. The A parameter is related tothe affinity of the inhibitor to the target by the following equa-tion: where B is the degree of competitiveness of the inhibitor.If B =0 the inhibitor is absolutely competitive, i.e. either theinhibitor or the protein is bound but not both. If B= 1 thecompound does not affect the binding affinity of the protein.This situation can be observed for allosteric inhibitors ofprotein signaling in which binding of the inhibitor does notaffect the binding of the two proteins. For small molecularweight compounds B can assume a value between 0 and 1(7).This situation is possible because the binding footprint ofa small molecule is very small when compared to the entireprotein/protein interface which can make it possible for bothmolecules to bind simultaneously. The presence of the small molecule can be thought off as a mutation that lowers theaffinity but not abolishes the binding of the protein for itspartner. The parameter B can be calculated from the ITCdata by rearranging equation 1: where A is obtained for the experiments in Figures 1 and 2and Kl from the ITC titration of the inhibitor into the targetprotein. Figure 3 shows the ITC titration of NBD-556 into gp120which is the target protein in this particular example. In thisexperiment, the reaction cell contained 5 uM gp120 and wastitrated with 2 pL injections of a 300 pM NBD-556 in thesyringe. This experiment is consistent with an associationconstant, Kl, of 3.3 × 10⁵ M-1 or equivalently a dissociationconstant Kd,l=1/KI of 3.0 pM. The binding enthalpy is -20.4kcal/mol and the entropy contribution to binding is 12.9kcal/mol. The thermodynamic signature for this inhibitor isalso displayed in the inset. Equation 2 indicates that thebinding of NBD-556 is characterized by a B value of 0.05which is characteristic for a moderately competitive inhibitor.The optimization of protein/protein inhibitors requiresmaximization of the binding affinity and modulation of thedegree of competitiveness, B, in order to develop more orless competitive inhibtlVitors according to the specific designneeds. The results presented here demonstrate the uniquecapability of ITC to guide the optimization of protein/proteininhibitors. Figure 3. ITC titration of the small molecular weight inhibitorNBD-556 into gp120. The inhibition of protein/protein interactions is a major frontierin the pharmaceutical and biotechnological industries. Theidentification and optimization of protein/protein inhibitorsrequire accurate measurements of their binding affinity aswell as the efficiency with which they compete with the targetprotein. ITC is uniquely suited to perform this task as it canprovide both the binding affinity and the degree of competi-tiveness of an inhibitor. Contrary to traditional enzyme inhibi-tors in which the degree of inhibition is proportional to bindingaffinity, for protein/protein inhibitors binding affinity is notsufficient. Due to the large size of the protein/protein bindingfootprint when compared to the size of a~500 MW molecule,inhibitor optimization also requires tracking of the degree ofcompetitiveness since binding affinity alone does not reflectinhibitor potency. The experiments presented here demon-strate the critical role of the Nano ITC LV in the developmentof protein/protein interaction inhibitors. The self assembly of viral proteins and nucleic acids toform stable particles, and the mechanisms by whichviruses bind to and penetrate host cells, represent twokey issues to understanding the basis of viral infection.Both these issues can be studied using calorimetry.The thermal stability of virus coat proteins in solution,compared with the stability of the correspondinghighly structured viral protein shell, can be most effec-tively characterized by differential scanning calorime-try (DSC), whereas fundamental information aboutthe molecular interactions driving virus/cell bindingprocesses can be obtained by measuring the heatevolved or absorbed during binding using isothermaltitration calorimetry (ITC). This note reviews applica-tions of DSC and ITC for studying the stability of virusparticles and their binding to cells, as well as for theidentification of viruses. Although the literature dealingwith the thermodynamics of virus particle assemblyand stability is not extensive, this is likely to changegiven increasing interest in the use of calorimetry foridentifying viruses and for understanding viral struc-ture and virulence. Virus particle stability and assembly Norwalk virus is the major cause of gastroenteritis. Thevirus consists of an RNA genome encapsulated by acoat comprised primarily of major capsid protein, andgains entry to the body through ingestion of contami-nated food or water. The major capsid protein has twostructurally-distinct domains and self-assembles invitro into empty, non-infectious virus-like particles thatare structurally and immunologically similar ta八to theintact virus. The virus experiences large variations inpH as it progresses through the infective cycle. DSCstudies conducted on non-infective virus-like particles(Ausar et al., 2006) between pH 3 and 8 showed twowell-separated endothermic peaks at pH 3: a largerpeak centered at 66℃ and a smaller peak centeredat 92℃. At less acidic pH values, the higher tempera-ture transition shifted to lower temperatures, and atneutral pH it was superimposed on the lower tempera-ture transition. Proteolytic studies showed that the lowtemperature transition was due to the proteolytical-ly-stable large C-terminal domain, while the hightemperature transition arose from the digestible small-er N-terminal domain. These results are consistent withthe need for the virus to remain intact in acidic condi-tions following ingestion, and to disassemble andrelease its RNA after penetrating the gastric cell mem-brane and entering the (neutral pH) cytoplasm. DSCstudies on capsid-protein-only shells of a parvovirusalso showed different conformations and stability inresponse to environmental changes similar to thoseencountered by the virus during its life cycle (Carreiraet al., 2004). In this case, conformational changes proceeded in two steps. DSC showed that heating theshells to 46℃ caused partial externalization of theN-terminus of the protein, followed by dissociation ofthe shell at 75℃ into monomeric proteins. The stabilizing effect of viral nucleic acid on virus parti-cles has been studied using intact viruses and emptycoat-protein-only shells of turnip and tobacco mosaicvirus. DSC and other biophysical studies of intactturnip virus showed that heat disrupts the virus in threestages: first, the RNA is released and a conformationalchange occurs in the shell, then the empty shell disso-ciates and finally, the coat protein denatures (Mutom-bo et al., 1993). In tobacco mosaic virus, the intactvirus is stabilized by about 15℃ compared to thecoat-protein-only shell, suggesting that the RNA formsspecific stabilizing interactions with the protein shell(Orlov et al., 1998). The thermal stability of the coatprotein alone in solution or in small aggregates isabout 30℃ lower than when packed into the high-ly-structured coat-protein-only shell. The authors pointout that the presence of folded coat protein insolution is known to inhibit virus disassembly. Thiswould aid infection, as the instability of monomeric orsmall coat protein aggregates would help drive thedisassembly process to completion once initiated bythe release and unfolding of a few coat protein mole-cules in the infected cell. DSC has also been used to investigate the thermalstability of adenovirus, a favored vehicle for deliveringtransgenic material to somatic cells, with the intent ofidentifying the effects of environmental factors such aspH and sugars on virus stability (Rexroad et al., 2002;Ihnat et al., 2005). Ihnat et al. (2005) studied thepurifiedWwildtype major capsid protein (hexonprotein), the wildtype virus (Ad/WT) and a mutantform of the virus (rAd/p53) in various buffers. Themutant virus exhibited three endothermic transitions,while the wildtype provided four transitions. The coatprotein provided two endotherms (Fig A) but lackedthe 50℃ endotherm characteristic of the intact virus.Deconvolution of the approx.50℃ peak (Fig B) fromthe virus particles showed that this endotherm wascomposed of two thermal events in a concentra-tion-dependent manner. Taken together with othercalorimetric data, the authors conclude that the 50oC transition represents the disruption of the virusparticle into protein and nucleic acid, and that thetransitions at approx. 70 and 75℃ arise from confor-mational changes in the hexon protein. The 50℃transition is not reversible and since itsi eplolslition, sizeand shape are dependent on concentration andenvironment, the authors suggest that the position ofthis transition can be used to distinguish betweenadenovirus mutants, and to screen and optimizestabilizing formulations. (rAd/p53) at two concentrations and in different buffers, andwildtype virus (Ad/WT). Samples were scanned at 1℃/min in aNano-DSC Fig B: Result of deconvolution of~50℃ peak. (Ihnat et al., 2005). ( Enveloped a n imal viruses e n ter the h o st c e ll b y f using with the host cell membrane, i n duced by conformational c hanges in viral coat glycoproteins. The conformational ch a nge can be triggered by the acidic environment of theendosome, or by interaction wi t h a sp e cific receptor on th e cell surface. I n flu e nza v i rus fuses with c ell membranesunder acidic conditions. The v irus coat consists of a lip i d membrane and three t ransmembrane proteins of whichone,h e magglutinin, undergoes a large conformational change at acidic pH. Thi s exposes a hydrophobic segment t hat d rives virus fusion with the host cel l membrane. D S C of purified hemagglutinin at neu t ral pH p roduces a singlelarge-enthalpy cooperative endotherm with a Tm of 66℃, whereas at pH 5 the pr o tein unfolds i n a less cooperativemanner a t 45℃, w i th approximately one-third the e n thalpy change (Remeta et al., 2 0 0 2). DS C and spectroscopicstudies on i ntact influenza virus, conducted to determine h ow t h e hemagglutinin pr o tein re s ponds to p H a nd temperature when embedded in th e viral membrane, also showed si g nificant d ifferences between acidic and neutral pH ( Epand and Ep a nd,2002 ) . As w i th the p urified protein, he m agglutinin in the i ntact vir u s unfolded coop-eratively at about 66℃ a t neutral pH, but at pH 5, the Tm decreased o nly to 60℃ a nd the enthalpy remained essen- t ially unchanged, although c ooperativity was significantly reduced . The author s con c luded that the decreasedstability of hemagglutinin at acidic pH initiates virus/c e ll membrane fusion mediated b y the exposed hydrophobicsegment, but that hemagglitinin wit h in the int a ct vir u s is less destabilized than th e purified pr o tein under similarconditions. ITC experiments w i th intact a nd i n activated influenza virus a t neutral and acid pH a l lowed bi n ding andmembrane fusion events to b e separated, and showed that membrane fusion is an endothermic react i on occur-ring exclusively at acidic pH ( Nebel etal., 1 9 95). ) Patrick C. Ross, PhD. and Ernesto Freire, PhD. Department of Biology, Johns Hopkins University ITC and other studies on vesicular stomatitis virusshowed that the viral fusion protein bound to andfused with phosphatidyl choline/phosphatidyl serine(1:3) vesicles exothermally at pH 6.0, whereas bindingbut no fusion occurred at pH 7.5 (Carneiro et al., 2002,2006). The fact that binding was exothermic suggest-ed that it might be driven by electrostatic interactions.No binding was observed when the vesicles did notcontain phosphatidyl serine, or when the histidines inpeptides corresponding to the putative bindingregion on the viral fusion protein were replaced withalanines. The ITC data suggest that binding of the viralfusion protein to the cell brings histidine residues in thebinding region of the protein in close proximity withthe negatively charged phosphatidyl serine headgroups, leading to protonation of the histidines andinteraction of the fusion protein with the cell mem-brane. HIV is perhaps the most extensively studied envelopedvirus. Infection is initiated when the viral coat glycopro-tein,gp120, interacts with CD4 receptors on the targetcell, triggering conformational changes in the virusenvelope and leading to fusion with the target cell. ITCstudies of the interaction between gp120 and CD4(Myszka et al., 2000) showed a very favorable bindingenthalpy (approx. -63 kcal/mol (-264 kJ/mol)),indicating the formation of a large number of hydro-gen bonds and van der Waals interactions. However,the binding entropy is large and unfavorable, indicat-ing significant loss of conformational freedom uponbinding and resulting in medium strength (2x10⁸ M1)binding. In addition, the binding reaction is slow. Inde-pendent studies on the CD4 protein showed that itsstructure remains essentially unchanged upon bind-ing, demonstrating that the unfavorable entropyarises primarily from structural rearrangement ofgp120. Slow binding is consistent with significantconformational changes occurring during complexformation. Extensive studies on a nonenveloped virus, simianvirus 40, has shed light on how a virus recognizes andbinds to its receptor on the host cell, without bindingso tightly that replicated viruses cannot migrate tonew host cells. ITC data showed that the virus recog-nizes its glycoprotein receptor with millimolar affinity,but glycan screening experiments showed that whenpresented with an array of glycans, the virus bindspreferentially to the branched oligosaccharide foundon the receptor. Crystallographic data show thatbinding specificity is achieved by the two branches ofthe oligosaccharide interacting simultaneously withthe binding cleft (Neu et al., 2008). In 1997, Shnyrov et al. showed that scanning aNewcastle disease virus sample to successively highertemperatures on DSC (successive annealing) provid-ed four endothermic two-state transitions which corre-sponded to the four major proteins in the virus. Theresults suggested that the DSC profile of a virus couldbe used as a means of identification. Thi~s +conicenptf hasbeen extended beyond the identification of thespecies of virus, to the identification of individualstrains. For example, Krell et al. (2005) used DSC tocharacterize various polio and influenza virus strains.Each strain had a characteristic pattern of multipleunfolding transitions which differed in Tm, shape andenthalpy, with significant pattern differences evenbetween closely-related strains (e.g., the highly-relat-ed H1N1 influenza strains A/PR8/34 and New Caledo-nia, or the H3N2 strains X-31 and Panama). Theauthors suggest that the surface coat proteins strong-ly influence the DSC profile of the virus. Since it is theseproteins that often differ between closely-relatedstrains, DSC could be a widely-applicable, simple andfast clinical approach for identifying infective viralstrains. Summary The body of research incorporating DSC and ITCstudies for understanding the structure and mode ofaction of viruses is growing rapidly. DSC is invaluablefor elucidating the thermodynamic profile of a virusstructure, leading to an understanding of the stabilityof viral components and the reliable characterizationand identification of virus strains. Virus virulenceicdepends on the ability of the virus to specifically bindto its target and infect the cells. ITC has been shown tobe a robust assay technology that can be used toeffectively characterize any inter-molecular bindingevents occurring between a virus and its receptors.Because viruses are composed of only a few majorprotein and nucleic acid components, it is perhapsnot surprising that details of how these componentspack and interact with each other can be studiedcalorimetrically using intact viruses. At the same time,the level of specific structural information from awell-designed DSC or ITC experiment conducted onintact viruses can rival that of other techniques thatrequire purified protein or nucleic acid components toprovide interpretable data. Rapid accurate evalua-tion of viral structure and virulence factors could becritical for expanding the structure-activity relationshipdatabase for viruses, thereby allowing for a timelyresponse to viral outbreaks and pandemics. There are situations in which it is necessary to measure thebinding enthalpy of a relatively large number of compoundsfor which binding affinities or IC50' s have already beenestimated using other approaches.lIrn drug discovery forexample, high throughput screening (HTS) is usually the firststep in the identification of potential lead compounds. HTSoften produces a number of hits that need to be ranked interms of their quality as potential drug candidates. Recently,different metrics have been proposed in order to evaluate thedrug-like quality of lead compounds. Among them, LipE hasachieved widespread prominence. LipE or lipophilic efficien-cy is defined as LipE=pKd -LogP, where pKd is the nega-tive logarithm of the dissociation constant (sometimes theinhibition constant, Ki, or the IC50 are used) and LogP, thelogarithm of the partition coefficient of the compoundbetween n-octanol and water (see for example http://en.wiki-pedia.org/wiki/LiPE). LipE essentially quantitates theproportion of the binding affinity that originates from forcesother than hydrophobicity. LipE is just the differencebetween the logarithms of the binding potency and hydro-phobicity. The higher the LipE value the better the quality ofthe compound. In our laboratory, we have discovered thatLipE is proportional to the binding enthalpy. The more favor-able the binding enthalpy the higher the LipE value. A polargroup that establishes a strong hydrogen bond contributesfavorably (exothermically) to the binding enthalpy, whereas apolar group that becomes buried from the solvent but doesnot establish a hydrogen bond will contribute unfavorably(endothermically) to the binding enthalpy. Retrospectively,this is a somewhat expected result as binding dominated byhydrophobicity is entropically driven while strong specificinteractions like hydrogen bonds result in favorable contribu-tions to the binding enthalpy. These results emphasize theadvantage of knowing the thermodynamic signature of drugcandidates as the enthalpy/entropy character of a compoundcan be used prospectively in lead optimization [1]. An exam-ple of the enthalpy LipE correlation is shown in Figure 1 for aseries of protease inhibitors. Figure 1. Correlation between LipE and binding enthalpy for 26HIV-1 protease inhibitors belonging to the same chemicalscaffold. It is clear in this plot that the compounds with the morefavorable enthalpy are characterized by the higher LipE values.Since ITC data can be used in a prospective way [1], it is appar-ent that ITC can play a critical role in drug design. ( The resul t s in Figure 1 are in agreement with previous observations i n dicating that enthalpically driven compounds should b ep referred over e n tropically d r iven ones [2]. A h i gh l y polar comp o und will ha v e a small LogP but only high affinity if the polar g roups establish strong hydrogen bonds a n d contribute favorably t o the binding enthalpy. . Measuring t h e b i nding enthalpy provides a n immediate acc o unt of t h e e nth a lpic efficiency of the p ola r functionalities in a compound and delinea t e optimization s trategies. The LipE/enthalpy obs e rvations provide additional suppo r t to the idea that the availability of protocols for rapid and accurate binding enthalpy measurements is highly desirable. ) ( I n t his Application Note, we present an ITC screening protocol aimed at rapidly measuring binding enthal p ies for a large number o f compounds us i ng sm a ll am o unts of pro t ein. Th e premise of ITC scre e ning is that binding constants, inh i bition constants or I C50’ s have already been estimated. It i s not required that the estimates are very precise as they are only used to calculate t he ligand concentration to b e used i n the experiment. ) ( The i d ea i n e n thalpy screening is t o inject a s m a ll amount of protein into the calorimeter cell fille d with an e x cessconcentration of ligand. Un d er those conditions all the p rotein that is injected will bin d to the compound and the enthal-py change will simply be equal to the reaction he a t divided by the amount of injected prot e in. ) The Experimental Setup. The first task is the determination of the appropriate compound concentration to fill the calorim-eter cell. As a rule of thumb, if the compound concentration is 100-fold larger than its Kd, Ki or IC50, close to 99% of theinjected protein will bind. This concentration is more than adequate for accurate enthalpy determinations. If it is 10-foldlarger 90% will bind. For compounds with affinities in the low micromolar range a concentration of 100pM will suffice. Inour work, we routinely use buffer containing 2% DMSO and if necessary 4% DMSO in order to properly dissolve thecompounds. Obviously, the protein needs to be in the same buffer and with the same concentration of DMSO as thecompounds. The protein concentration in the delivery syringe can be set anywhere between 10-5000pM. Considering that the dilutionfactor is about 100, the final protein concentration in the reaction cell will range between 0.1 - 50pM. Depending onwhether the standard cell (~1000pL volume) or low volume cell (200pL volume) instrument is used, the amount of proteinin the cell will range between 100 pmoles - 50 nmoles and 20 pmoles - 10 nmoles for the large and small cell instru-ments, respectively. Figure 2 illustrates the data that is obtained with the enthalpy screening protocol using the NanolTC low volume instru-ment. The details of the experiment are summarized in the figure legend. Depending on the protein concentration in thesyringe, typical injection volumes range anywhere between 1 and 5pL. Smaller injection volumes are preferable sincethey allow for the measurement of a larger number of compounds without refilling the syringe. For the example in thefigure 2.9pL injections were used. First, aliquots of the protein solution are injected in triplicate to the buffer solution inorder to determine the protein dilution heat effects (upper curves in the figure). This measurement is performed only once,usually at the beginning of the screen. The same volume of protein is injected also in triplicate to the calorimeter cellcontaining excess compound (lower curves in the figure). The binding enthalpy is calculated by subtracting the heat ofdilution and dividing the result by the amount of protein injected according to the formula: AHbinding=(Qpr-inhib-Qpr-buf)pcal/umolesprot The binding enthalpy determined by using the screening protocol for the example in the figure is (AHbinding)=-2.68±0.02kcal/mol which compares favorably with the binding enthalpy determined with a standard titration(-2.0±0.1 kcal/mol). Thisprocedure can be repeated with additional compounds without refilling the injection syringe and without exhaustivelycleaning the reaction cell, thus allowing for the rapid evaluation of several compounds. This procedure permits bindingenthalpy determinations in no more than ten minutes per compound. Time (s) Figure 2: (Lower Panel) Serial injections of TEM-1B-Lactamase (protein) into 3-benzyloxycarbonyl-5-nitro-phenylboronic acid (compound). The titration syringewas loaded with 405 pM TEM-1 and the calorimetric cellfilled with 600 pM 3-benzyloxycarbonyl-5-nitrophenylbo-ronic acid. Each injection was 2.91 pL into a 170 pLcalorimetric cell. All samples were in 50 mM sodiumphosphate, pH 7.0, 2% DMSO.The titration wasperformed in a NanolTC LV (TA Instruments) at 25C.The injection rate was set to 10 ms, which corresponds to1.43 pL / second. Following an initial delay of 360seconds, injections were spaced 500 seconds apart.Raw data was analyzed using the NanoAnalyze applica-tion from TA Instruments, with resultant areas convertedto calories. The first injection released -4.43pcal, thesecond injection released -4.51 pcal and the third Time (s) injection released -4.42 pcal yielding an average of -4.45±0.05 pcal. The binding affinity (Kd) for this compound has previously been determined to be 6.94 pM.(Upper Panel) Serial injections of TEM-1 B-Lactamase into 50 mM sodium phosphate, pH 7.0, 2% DMSO. Each injectionwas 2.91 pL of 405 pM TEM-1 into buffer following the same procedure as of protein into compound. The first injectionreleased -1.29 pcal, the second injection released -1.32 pcal and the third injection released -1.27 pcal. From these threeexperiments the heat of protein dilution is determined as -1.29 ±0.025 pcal. This average value is subtracted from theaverage of the heats obtained when the protein is injected into buffer containing compound. The enthalpy screen permits a rapid approximation to the thermodynamic signature by combining affinity (Kd), inhibitionconstant (Ki) or IC50 data with the results of the enthalpy screen. This process involves two steps: Figure 3 represents the thermodynamic signature for the compound in the example present-ed here. This procedure can be rapidly applied to a large number of compounds in order toevaluate their quality as potential drug candidates. Figure 3:Thermodynamic signature for 3-benzyloxycarbonyl-5-nitrophenylboronic acid binding to TEM-1B-Lactamase obtained by combining Kd data with the results of the enthalpy screen in Figure 2. 1 Freire,E.(2009) A thermodynamic approach to the affinity optimization of drug candidates. Chem Biol Drug Des 74(5), 468-472 2 Freire,E.(2008) Do enthalpy and entropy distinguish first in class from best in class? DrugDiscov Today 13 (19-20),869-874 全新的勺 Affinity ITC 探索更多 分子结构及分子交互作用 TA领先业界,完成了其他人想做的事情 Affinity ITC是全自动化的高灵敏度等温滴定微量热仪, Nano ITC 用以表征种类繁多的分子间相互作用。 ·研究蛋白质-蛋白质交互作用 ·区分候选药物与目标物作用之亲和力 仪器亮点 ·验证配体与核酸之结合反应 •全新的96位温度控制及液体处理系统搭载智能型定位装置,能够全自动化操作及精确、可靠的注射。 ·可在一个ITC实验中, 同时获得反应热焓及熵 ·全新的 Flex SpinTM提供范围最广的搅拌速度。缓慢搅拌且均匀混合的速度 ·无须标定、修饰分子或进行分子固定化等前处理 (搅拌速度低于竞争厂家的十倍),确保仪器高敏感度及脆弱样品结构的保护。 全新的 AccuShotTM能够将样品导入在正确的位置,达到高效均匀搅拌。 Nano DSC ·蛋白质结构域及稳定性研究 全新的自动化及用户可选择的系统清理程序,可以消除不同实验间造成的交叉污染。 ·赋形剂对分子稳定性影响评估 ·全新的数据分析软件具备强大的批量自动数据分析功能。 ·生物药物分子稳定性表征 市场中唯一具备小体积(190ul)及标准体积(1ml)自动化等温滴定微量热系统。 ·直接量测分子热力学参数 微量热技术在生物制药应用专页 Figure .LV Nano ITC cell and paddle
确定


还剩10页未读,是否继续阅读?

产品配置单


TA仪器为您提供《生物制品中理化常数检测方案 》,该方案主要用于化药新药研发中其他检测,参考标准--,《生物制品中理化常数检测方案 》用到的仪器有NANO等温差示扫描量热仪、TA仪器+等温滴定微量热仪+ NANO ITC、TA仪器+差示扫描量热仪+NANO DSC
推荐专场

相关方案
更多