


方案详情
文
The analytical metabolomic workflow described here encompasses data acquisition, discovery of differentially
abundant metabolites, and metabolite identification.
The LTQ Orbitrap XL coupled to an Accela U-HPLC system afforded fast analysis times while maintaining high chromatographic resolution. Accurate mass measurements
increased the confidence in elemental composition assign -
ments and ultimately metabolite identification. SIEVE
differential analysis software enabled large-scale evalua -
tion of multiple complex LC-MS data and com parison of
metabolite profiles between green and black tea samples.
The spectral database and fragmentation algorithms of Mass Frontier software facilitated structural assignments of metabolites of interest utilizing MSn fragmentation spectra.
方案详情

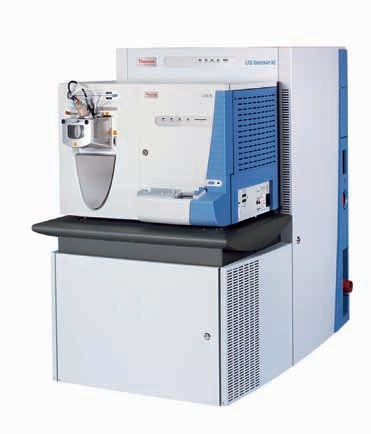
SCIENTIFICPart of Thermo Fisher Scientific Metabolomic Analysis of Green and Black TeaExtracts Using an LTQ Orbitrap XL HybridLinear Ion Trap Mass Spectrometer Donna L. Wilson and Charles Yang; Thermo Fisher Scientific, San Jose, CA, USA Overview Purpose: To show a complete analytical metabolomicworkflow including (1) data acquisition using a highresolution accurate mass instrument that is equipped witha Higher Energy Collisional Dissociation (HCD) cell andcoupled to a high pressure LC (Figure 1), (2) metabolitedifferential abundance analysis, and (3) structuralelucidation of relevant metabolites using accurate massand HCD fragmentation information to highlight thecomponent differences between green and black tea. Methods: Green and black tea extracts were analyzedusing an LTQ Orbitrap XL" with an HCD cell. Chroma-tography was performed using an Accela High Speed LCequipped with a 2.1 mm ID Hypersil GOLD" columnpacked with 1.9 um particles. Data Dependent"analysiswas performed using an LTQ Orbitrap XL with full scandata acquired at a resolving power of 30,000 and MS"data acquired at a resolving power of 7500 followingHCD fragmentation. Results: The study included a comparative analysis ofgreen and black tea using differential analysis softwareto identify compositional variations between the two teasamples. Using a UHPLC coupled with a small particlecolumn afforded a fast analysis time while maintainingvery high chromatographic resolution. The high massaccuracy data (better than 3 ppm with external calibra-tion) was used to determine elemental composition andfor tentative identification of compounds via databasesearching. HCD fragmentation facilitated structuralidentification and confirmation. This was demonstratedwith the example of epigallocatechin gallate (EGCG). Introduction Metabolomics, the comprehensive and quantitative analysisof wide arrays of metabolites in biological samples, markspromising new research territory. The numerous analytesin these samples have diverse chemistries and polarities.In addition, metabolites occur at a range of concentrationswithin a particular sample. Consequently, comprehensivemetabolomics investigations create many analyticalchallenges that can be addressed using LC-MS/MS. Tea contains a wide range of components includingvitamins, amino acids, and polyphenols, many of whichare structurally similar and may differ only in the typeand location of a side chain. The use of high resolutionchromatography is essential for the separation of sucha complex mixture. Furthermore, acquisition of accuratemass data in both full scan and MS" modes enablescomplete structural characterization. Here, we highlight an untargeted metabolomic work-flow from data acquisition through metabolite ID. Thestudy included differential and structural characterizationof polyphenolic catechin (flavan-3-ol) derivatives andtheaflavin components of green tea and black tea. Methods Samples Green tea and black tea aqueous extracts were examinedwithout any pre-treatment. Each sample was analyzed inquadruplicate. Figure 1: Schematic of the LTQ Orbitrap XL mass spectrometer with an HCD collision cell. The LTQ Orbitrap XL features an HCD collision cell to provide additionalflexibility for low level components in complex mixtures. lons can be selected in the linear ion trap and fragmented either in the ion trap (CID) or in the HCDcollision cell. For HCD, ions are passed through the C-trap into the gas-filled collision cell, providing high sensitivity and high signal-to-noise fragmentation. Chromatography Conditions Chromatographic separation was performed using theAccela UHPLC system (Thermo Fisher Scientific, San Jose,CA). The LC conditions were as follows: Column: Hypersil GOLD, 100×2.1 mm, 1.9 um particlesize (Thermo Fisher Scientific, Bellefonte, PA) Mobile phase: (A) water with 0.1% formic acid; (B) acetonitrile with 0.1% formic acid Flow rate: 500 pL/min Injection volume: 10 uL Gradient: Linear gradient of 100%-1% A over 20 minutes Mass Spectrometry Conditions MS analysis was carried out using an LTQ Orbitrap XLmass spectrometer (Thermo Fisher Scientific, San Jose, CA). The MS conditions were as follows: Positive electrospray ion source voltage: 5.0 kV All methods: Full scan MS in the Orbitrap with a massresolution of 30,000. Data Dependent MS/MS in theOrbitrap on the top three most intense ions from the fullscan at a mass resolution of 7500. Considerable interest has developed in the potential healthbenefits of teas, particularly in the antioxidant and otherproperties of some of the polyphenolic catechins andtheaflavins (Figure 2). The analysis described here focusedon detection, relative quantitation, and identification ofthese low molecular weight components in green andblack tea samples. The HPLC separation of tea samples shows excellentpeak separation and low noise, with most componentseluting in less than 10 min. High resolution full scan spectrawere acquired at a mass accuracy of better than 3 ppm. After data acquisition, SIEVE software was used todetermine statistically significant differences in the metabo-lite profiles of green and black tea samples (Figure 3).By comparing peak intensities between the two chromato-graphically aligned samples, metabolites present at differentlevels in the two teas were identified. Figure 2: Three types of tea are produced from Camellia sinensis leaves: green tea (nonfermented), oolong tea (semi-fermented), and black tea (fermented).Catechins are polyphenolic antioxidant plant metabolites of the class flavanoids called flavan-3-ols and are highly present in tea plants. Fermentation inducesenzymatic oxidation of flavan-3-ols and leads to the formation of two major pigments in black tea, theaflavins (TFs) and thearubigns (TRs). Catechins areexpected to be more abundant in green tea and theaflavins more abundant in black tea. The proposed fragmentation pathway for these compounds proceedsvia a Retro-Diels-Alder rearrangement as outlined here. After differentially abundant metabolites of interestwere detected, the accurate mass and the MS" data wereused for structural identification. The elemental formula,as determined by the accurate mass data, and the accuratemass value itself were used for metabolite database search-ing. The EGCG metabolite was tentatively assigned usingthis combination of tools. Further metabolite characterization was accomplishedusing MS" spectra and Mass Frontier software. MassFrontier allowed confident metabolite identification usingits comprehensive spectral library and predictive frag-mentation algorithms to facilitate structural elucidation(Figure 4). The compounds in Figure 3 were identifiedusing this workflow. Figure 3: Differential metabolite abundance analysis with SIEVE software. A) Chromatographic alignment of the various LC sample traces is the first step inthe SIEVE process. Differences between the green tea samples (Blue) and the black tea samples (Red) can be identified. The Accela UHPLC provided highlyresolved chromatographic peaks and high signal-to-noise ratios. B) After alignment, the corresponding peak intensities are compared for green tea (Blue) andblack tea (Red). The relative abundances of several compounds of interest are shown with their abundance ratios. These metabolites were identified usinga combination of accurate mass database searching and MS" spectra interpretation via Mass Frontier software. Figure 4: A metabolite of interest from Figure 3 was chosen for further characterization. This ion was present at levels ~3 times that of black tea and wasidentified as the potent antioxidant, EGCG. Accurate mass was used to identify the metabolite via database searching, and Mass Frontier software was usedto confirm the EGCG identification by using the fragmentation spectra of the parent ion. The analytical metabolomic workflow described hereencompasses data acquisition, discovery of differentiallyabundant metabolites, and metabolite identification.The LTQ Orbitrap XL coupled to an Accela U-HPLCsystem afforded fast analysis times while maintaining highchromatographic resolution. Accurate mass measurementsincreased the confidence in elemental composition assign-ments and ultimately metabolite identification. SIEVE differential analysis software enabled large-scale evalua-tion of multiple complex LC-MS data and comparison ofmetabolite profiles between green and black tea samples.The spectral database and fragmentation algorithms ofMass Frontier software facilitated structural assignments ofmetabolites of interest utilizing MS" fragmentation spectra. References Menet, MC., Sang, S. Yang, C.S.,Ho, CT, and Rosen, R.T., Analysis ofTheaflavins and Thearubigins from Black Tea Extract by MALDI-TOF MassSpectrometry. J. Agric. Food Chem. 2004, 52,2455-2461. Legal Notices C2008 Thermo Fisher Scientific Inc. All rights reserved. Mass Frontier is a trademark of HighChem, Ltd. All other trademarks are the property of ThermoFisher Scientific Inc. and its subsidiaries. This information is presented as an example of the capabilities of Thermo Fisher Scientific Inc. products. It is notintended to encourage use of these products in any manners that might infringe the intellectual property rights of others. Specifications, terms and pricing aresubject to change. Not all products are available in all countries. Please consult your local sales representative for details. View additional Thermo Scientific LC/MS application notes at: www.thermo.com/appnotes
确定


还剩2页未读,是否继续阅读?

产品配置单
赛默飞质谱分析为您提供《绿茶,红茶中生物标记物检测方案(液质联用仪)》,该方案主要用于茶叶中营养成分检测,参考标准--,《绿茶,红茶中生物标记物检测方案(液质联用仪)》用到的仪器有赛默飞LTQ Orbitrap XL™组合式质谱仪
推荐专场
相关方案
更多
该厂商其他方案
更多