


方案详情
文
1、采用专利的HDD检测器,可进行全谱采集。 2、具备恒定的高分辨率 1)2400 g/mm全息光栅:光学分辨率<5 pm(120-320 nm),<10 pm(320-800 nm); 2)4343 g/mm与2400 g/mm背靠背双光栅系统(可选):光学分辨率<6 pm(120-450 nm),<10 pm(450-800 nm)。 3、采用全球顶尖的离子刻蚀全息光栅:110×110 mm,具有极低的杂散光(1×10⁻⁷)。 4、配备CZERNY-TURNER单色仪,具备目前市面上最长的焦距(1m)。 5、采用特有的垂直矩管、侧向观测方法,可实现全等离子体观测,能够获得无可比拟的灵敏度和稳定性,尤其适用于一些复杂样品。 6、光谱范围为160-800nm,并且连续波长覆盖。
方案详情

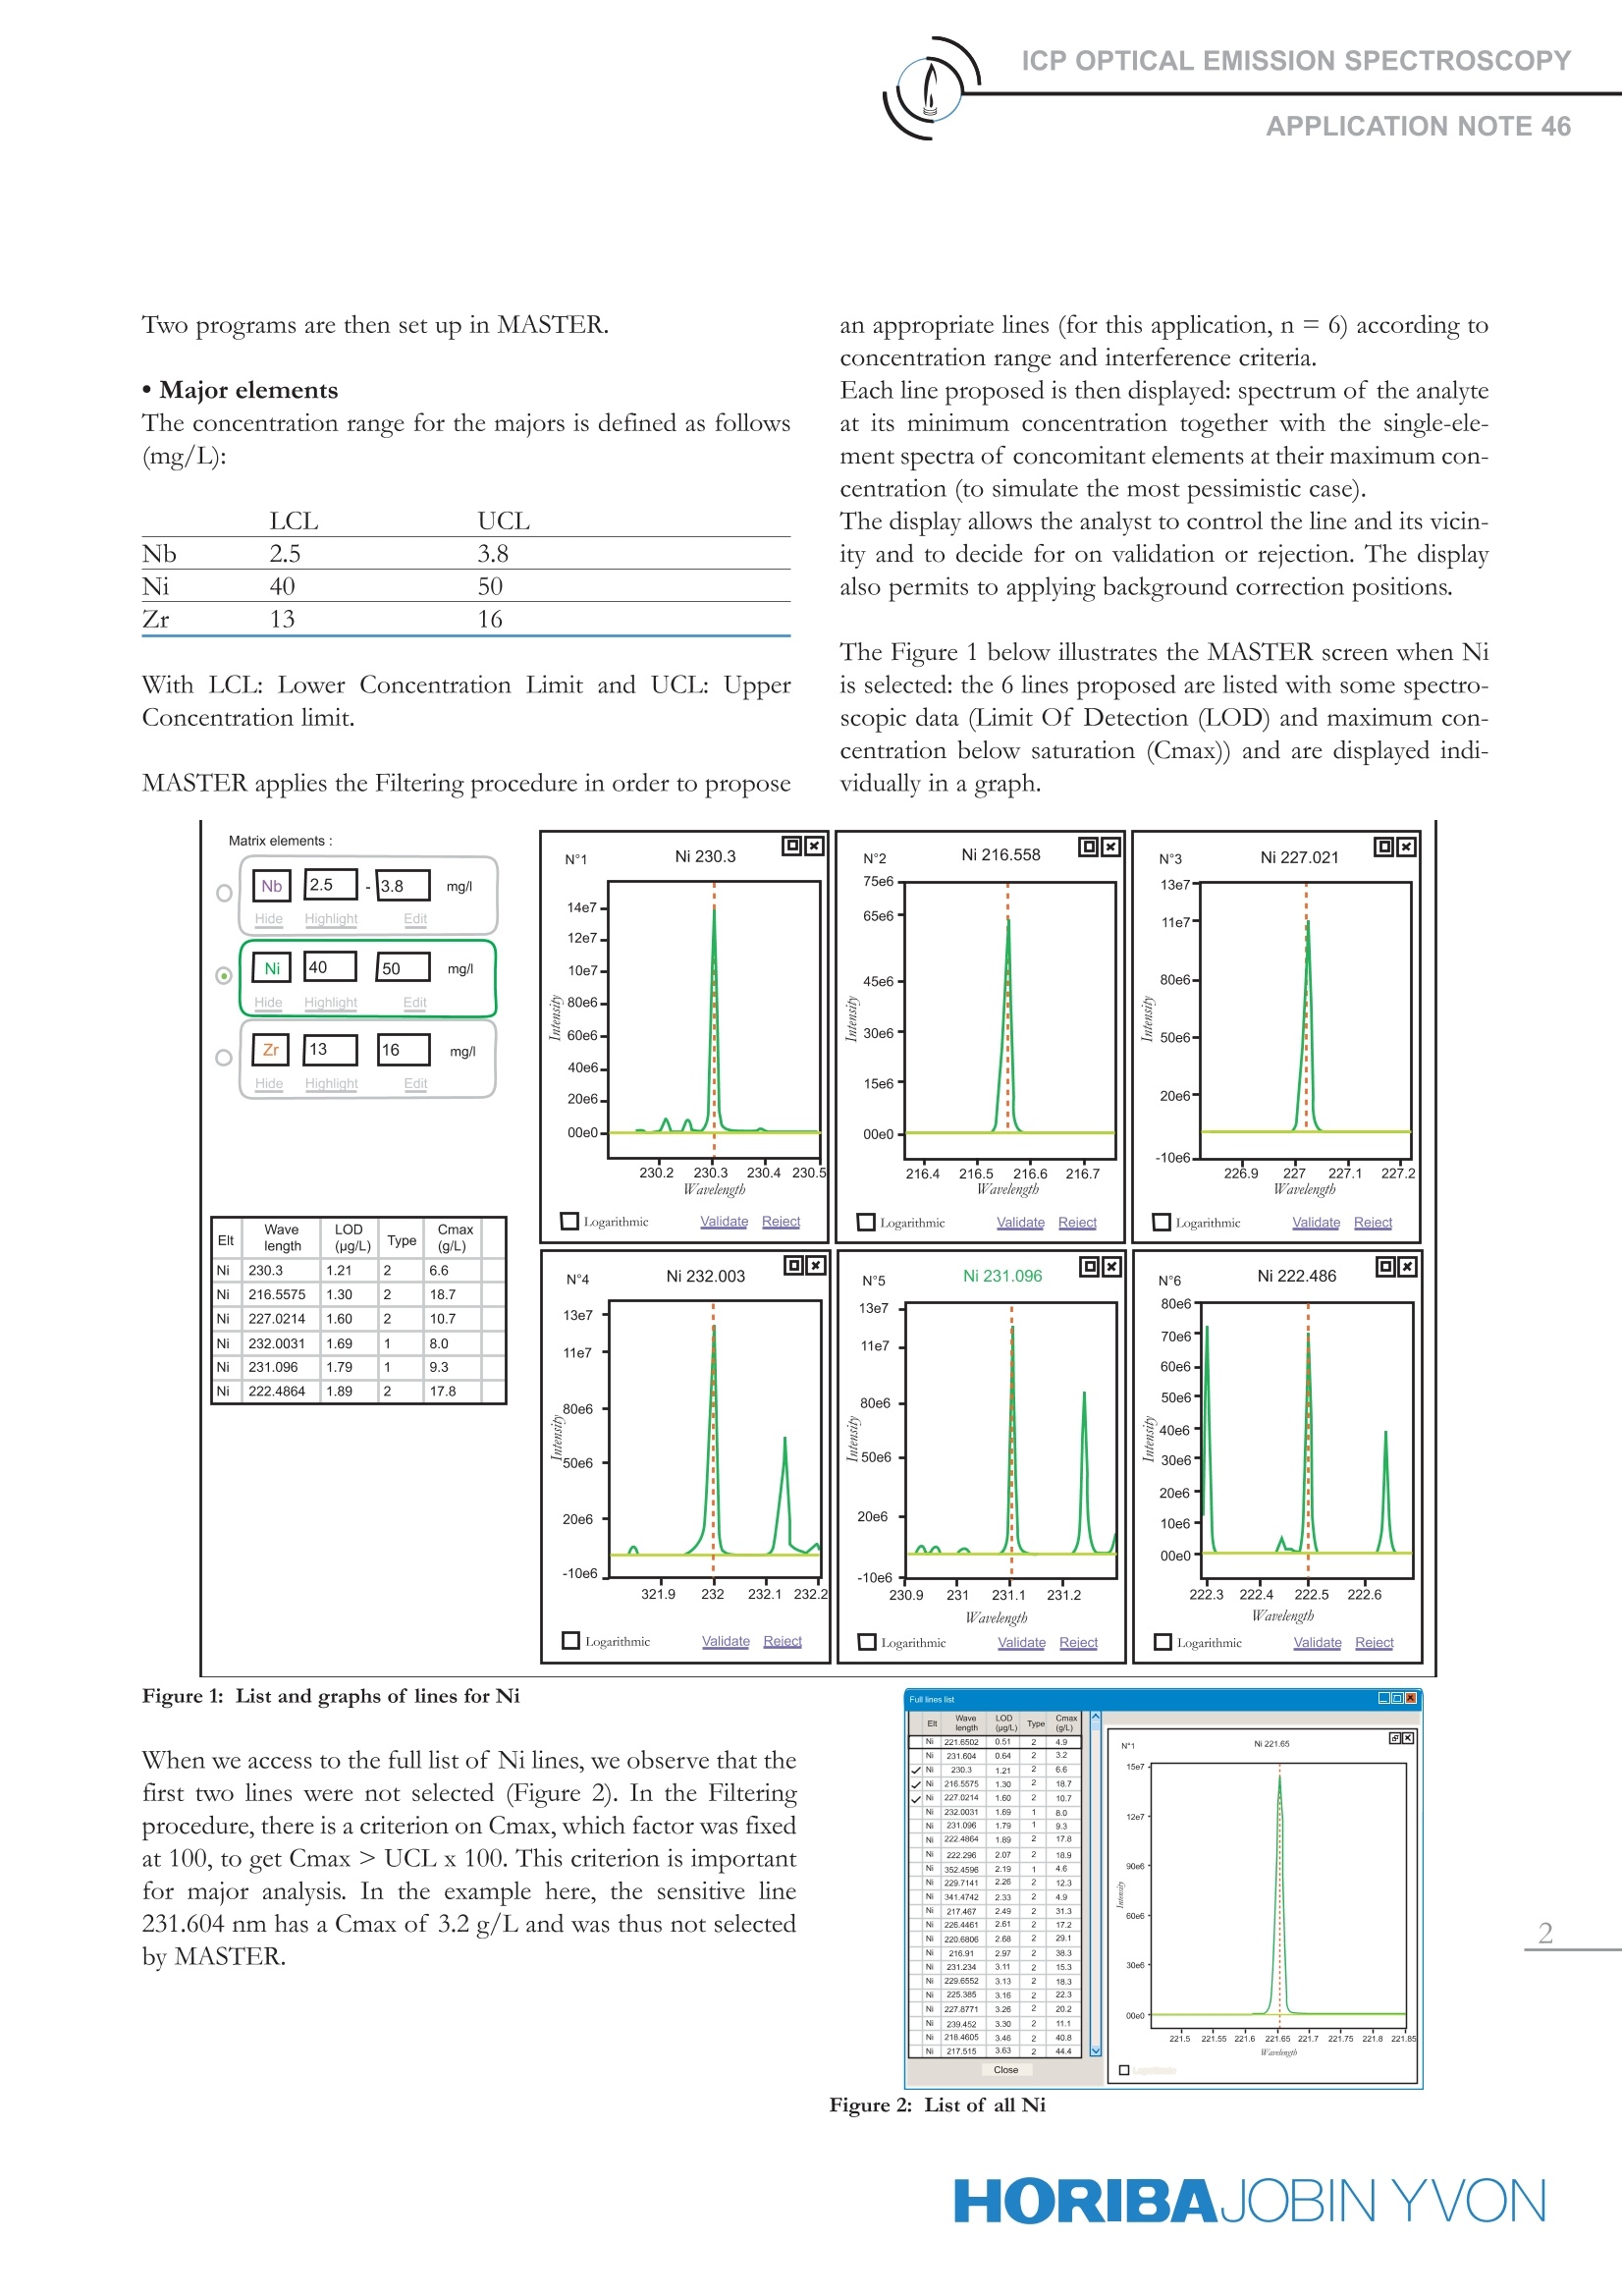
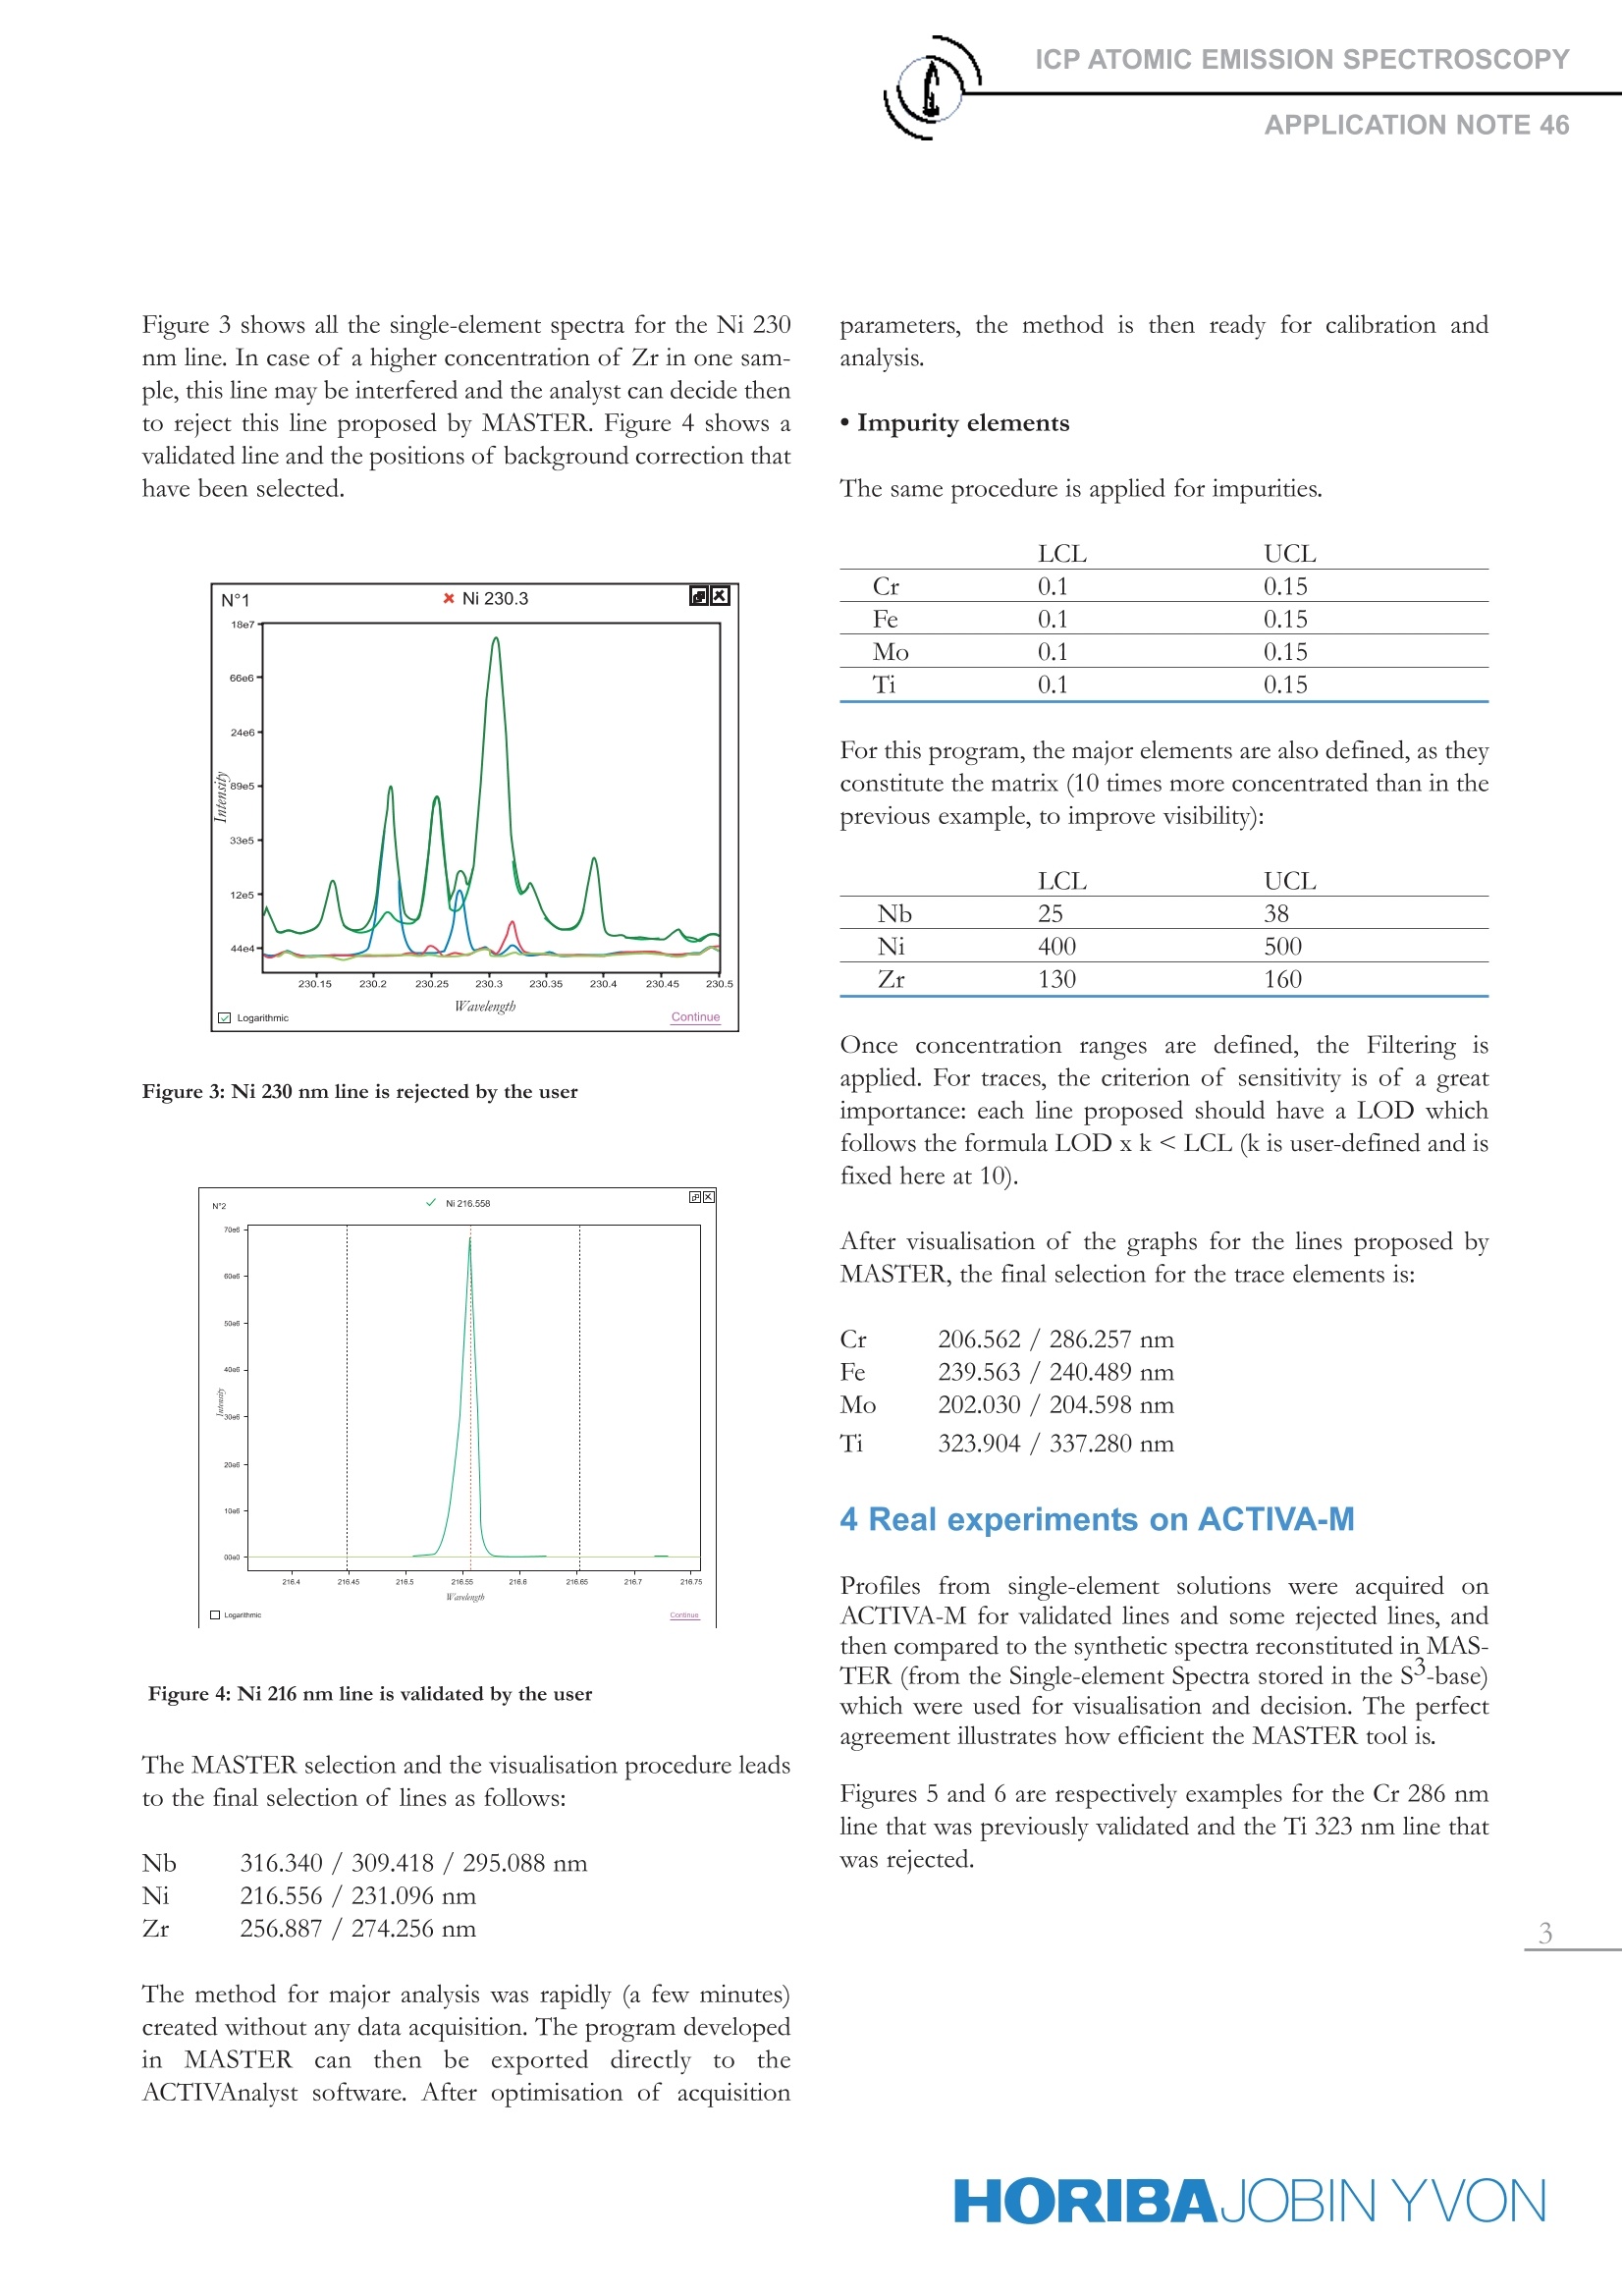
ICP ATOMIC EMISSION SPECTROSCOPYAPPLICATION NOTE 46 MASTER Assistance for Impurity Analysis in a Nb/Ni/ZrMatrix Jean-Claude Birolleau, CEA Le Ripault, Monts, France Agnes Cosnier, ICP Product Manager, HORIBA Jobin Yvon, Longjumeau, France Keywords: geology, determination of Rb 1 Introduction THE ACTIVA-M ICP-AES instrument allows the opera-tor to easily achieve the high reliability of results that everyanalyst wishes based on the concept of total multi-lineanalysis. Multi-line analysis makes the detection of outliers possible,thereby coping with unexpected spectral interferences and,consequently, improving the reliability of final results.However, the concept of selecting several lines per ele-ment complicates method development. The solution that HORIBA Jobin Yvon proposes with theACTIVA-M is assistance via specific software tools.Among them, the MASTER: Multi-line Analysis, SelectionTool for Enhanced Reliability. 2 Presentation of MASTER(1) The objective of the MASTER tool is to help the operatorin the selection of appropriate lines according to a definedapplication (matrix, elements and concentrations), and tocontrol any resulting spectral interferences. The essence of MASTER is the s-base (Single-elementSpectra, Spectroscopic data), a real ICP-based data basewith dual access that has been developed by HORIBAJobin Yvon. It is a collection of single-element spectra(acquired on an ACTIVA-M instrument, at different con-centrations, for all elements) and a data base containingwavelengths, ionisation state, excitation energy, sensitivity,background level, limit of detection, maximum concentra-tion below detector saturation and line width. More than50,000 lines have been assigned. Once the application is defined in MASTER by the user(list of elements and range of (expected,average)concentrations), the Filtering procedure is auto-matically applied and addresses a list of appropri-ate lines in terms of concentration range and inter-ferences. The Filtering consists of controlling the main criteria of sensitivity, maximum concentration and interference from S-base spectroscopic data. A Displayprocedure allows the analyst to verify the lines and set upbackground correction positions, thanks to the over-lap-ping of the blank spectrum and of single-element spectraof all elements of interest at the defined concentrations. The method development is consequently faster as it doesnot require any standard solution preparation and anypro-filing. The following diagram illustrates the elementsrequired for method development with and without theMASTER help: Without MASTER With MASTER -Matrix identification -Matrix identification -Elements and concentration -Elements and concentration range definition range definition -IICP-AES -Computer -Preliminary selection of wavelengths according to concentration range (from tables) -Single-element standards preparation -Solution profiling at selected wavelengths Control of spectral interferences -New wavelengths selection and profiling if needed 3 MASTER Assistance The analytical application is described in the followingTable 1: Table 1: Analytical application Matrix Ni 70-80% weightNb 4-6% weightZr 15-25 % weight Concentration provided bythe customer Impurities Cr,Fe, Mo, Ti Determine feasability Both major elements from matrix and impurities must beanalysed, leading to two different sample preparations. ·Major elements The concentration range for the majors is defined as follows(mg/L): M B With LCL: Lower Concentration Limit and UCL: UpperConcentration limit. an appropriate lines (for this application, n =6) according toconcentration range and interference criteria. Each line proposed is then displayed: spectrum of the analyteat its minimum concentration together with the single-ele-ment spectra of concomitant elements at their maximum con-centration (to simulate the most pessimistic case). The display allows the analyst to control the line and its vicin-ity and to decide for on validation or rejection. The displayalso permits to applying background correction positions. The Figure 1 below illustrates the MASTER screen when Niis selected: the 6 lines proposed are listed with some spectro-scopic data (Limit Of Detection (LOD) and maximum con-centration below saturation (Cmax)) and are displayed indi-vidually in a graph. MASTER applies the Filtering procedure in order to propose Figure 1: List and graphs of lines for Ni When we access to the full list of Ni lines, we observe that thefirst two lines were not selected (Figure 2). In the Filteringprocedure, there is a criterion on Cmax, which factor was fixedat 100, to get Cmax > UCL x 100. This criterion is importantfor major analysis. In the example here, the sensitive line231.604 nm has a Cmax of 3.2 g/L and was thus not selectedby MASTER. Figure 2: List of all Ni Figure 3 shows all the single-element spectra for the Ni 230nm line. In case of a higher concentration of Zr in one sam-ple, this line may be interfered and the analyst can decide thento reject this line proposed by MASTER. Figure 4 shows avalidated line and the positions of background correction thathave been selected. Figure 3: Ni 230 nm line is rejected by the user Figure 4: Ni 216 nm line is validated by the user The MASTER selection and the visualisation procedure leadsto the final selection of lines as follows: 316.340/309.418/295.088 nm M 216.556/231.096 nm 256.887 /274.256 nm The method for major analysis was rapidly (a few minutes)created without any data acquisition. The program developedin1MASTER can then be exported directly to)1theACTIVAnalyst software. After optimisation of acquisition parameters, the method is then ready for calibration andanalysis. ·Impurity elements The same procedure is applied for impurities. LCL UCL Cr 0.1 0.15 Fe 0.1 0.15 Mo 0.1 0.15 Ti 0.1 0.15 For this program, the major elements are also defined, as theyconstitute the matrix (10 times more concentrated than in theprevious example, to improve visibility): LCL UCL Nb 25 38 Ni 400 500 Zr 130 160 Once concentration ranges are defined, the Filtering isapplied. For traces, the criterion of sensitivity is of a greatimportance: each line proposed should have a LOD whichfollows the formula LOD x k
确定
还剩2页未读,是否继续阅读?

天津东方科捷科技有限公司为您提供《土壤中(类)金属及其化合物检测方案 》,该方案主要用于土壤中(类)金属及其化合物检测,参考标准--,《土壤中(类)金属及其化合物检测方案 》用到的仪器有
相关方案
更多