方案详情
文
LC-GC系统联用的技术优势,为我们提供了简单的样品制备和富集手段,同时可以获得最佳的灵敏度和分辨率。LC-GC技术通常对样品中的化合物基团使用正 相液相色谱法(NPLC)进行选择性的分离,之后通过大体积进样的方式将目标物转移至GC进行后续分离检测。
LC-GC联用技术已经在食品、香精香料、石油化工和工业样品、环境、药物以及生物样品等领域得到了成功的应用。多年来,科学家们使用LC- GC系统建立了许多有效的应用方法,著名的应用包括:食品中的矿物油和多环芳烃(Mineral oils, PAHs in Foods),质量评估橄榄油中的甲基酯、乙基酯和蜡酯(Methyl, ethyl and wax esters in olive oils),生物柴油中间馏分物中的脂肪酸甲酯(FAMES in middle distillates of Biodiesel blends)等。
其中最值得一提的是由著名的瑞士苏黎世食品监督局的首席化学家Koni Grob博士使用LC-GC系统开发的分离检测食品矿物油中的饱和烷烃(MOSH)和芳香烃(MOAH)的方法。该方法使用正相LC分离MOSH和MOAH组分,通过大体积 进样的方式将感兴趣的组分转移至GC进行进一步的分离检测,这为我们检测对人体有害的食品矿物油来源(包装材料、机器润滑油、灰尘吸附物、脱模剂、黄麻纤 维、受污染的动物饲料等)提供了快速有效的手段。
方案详情

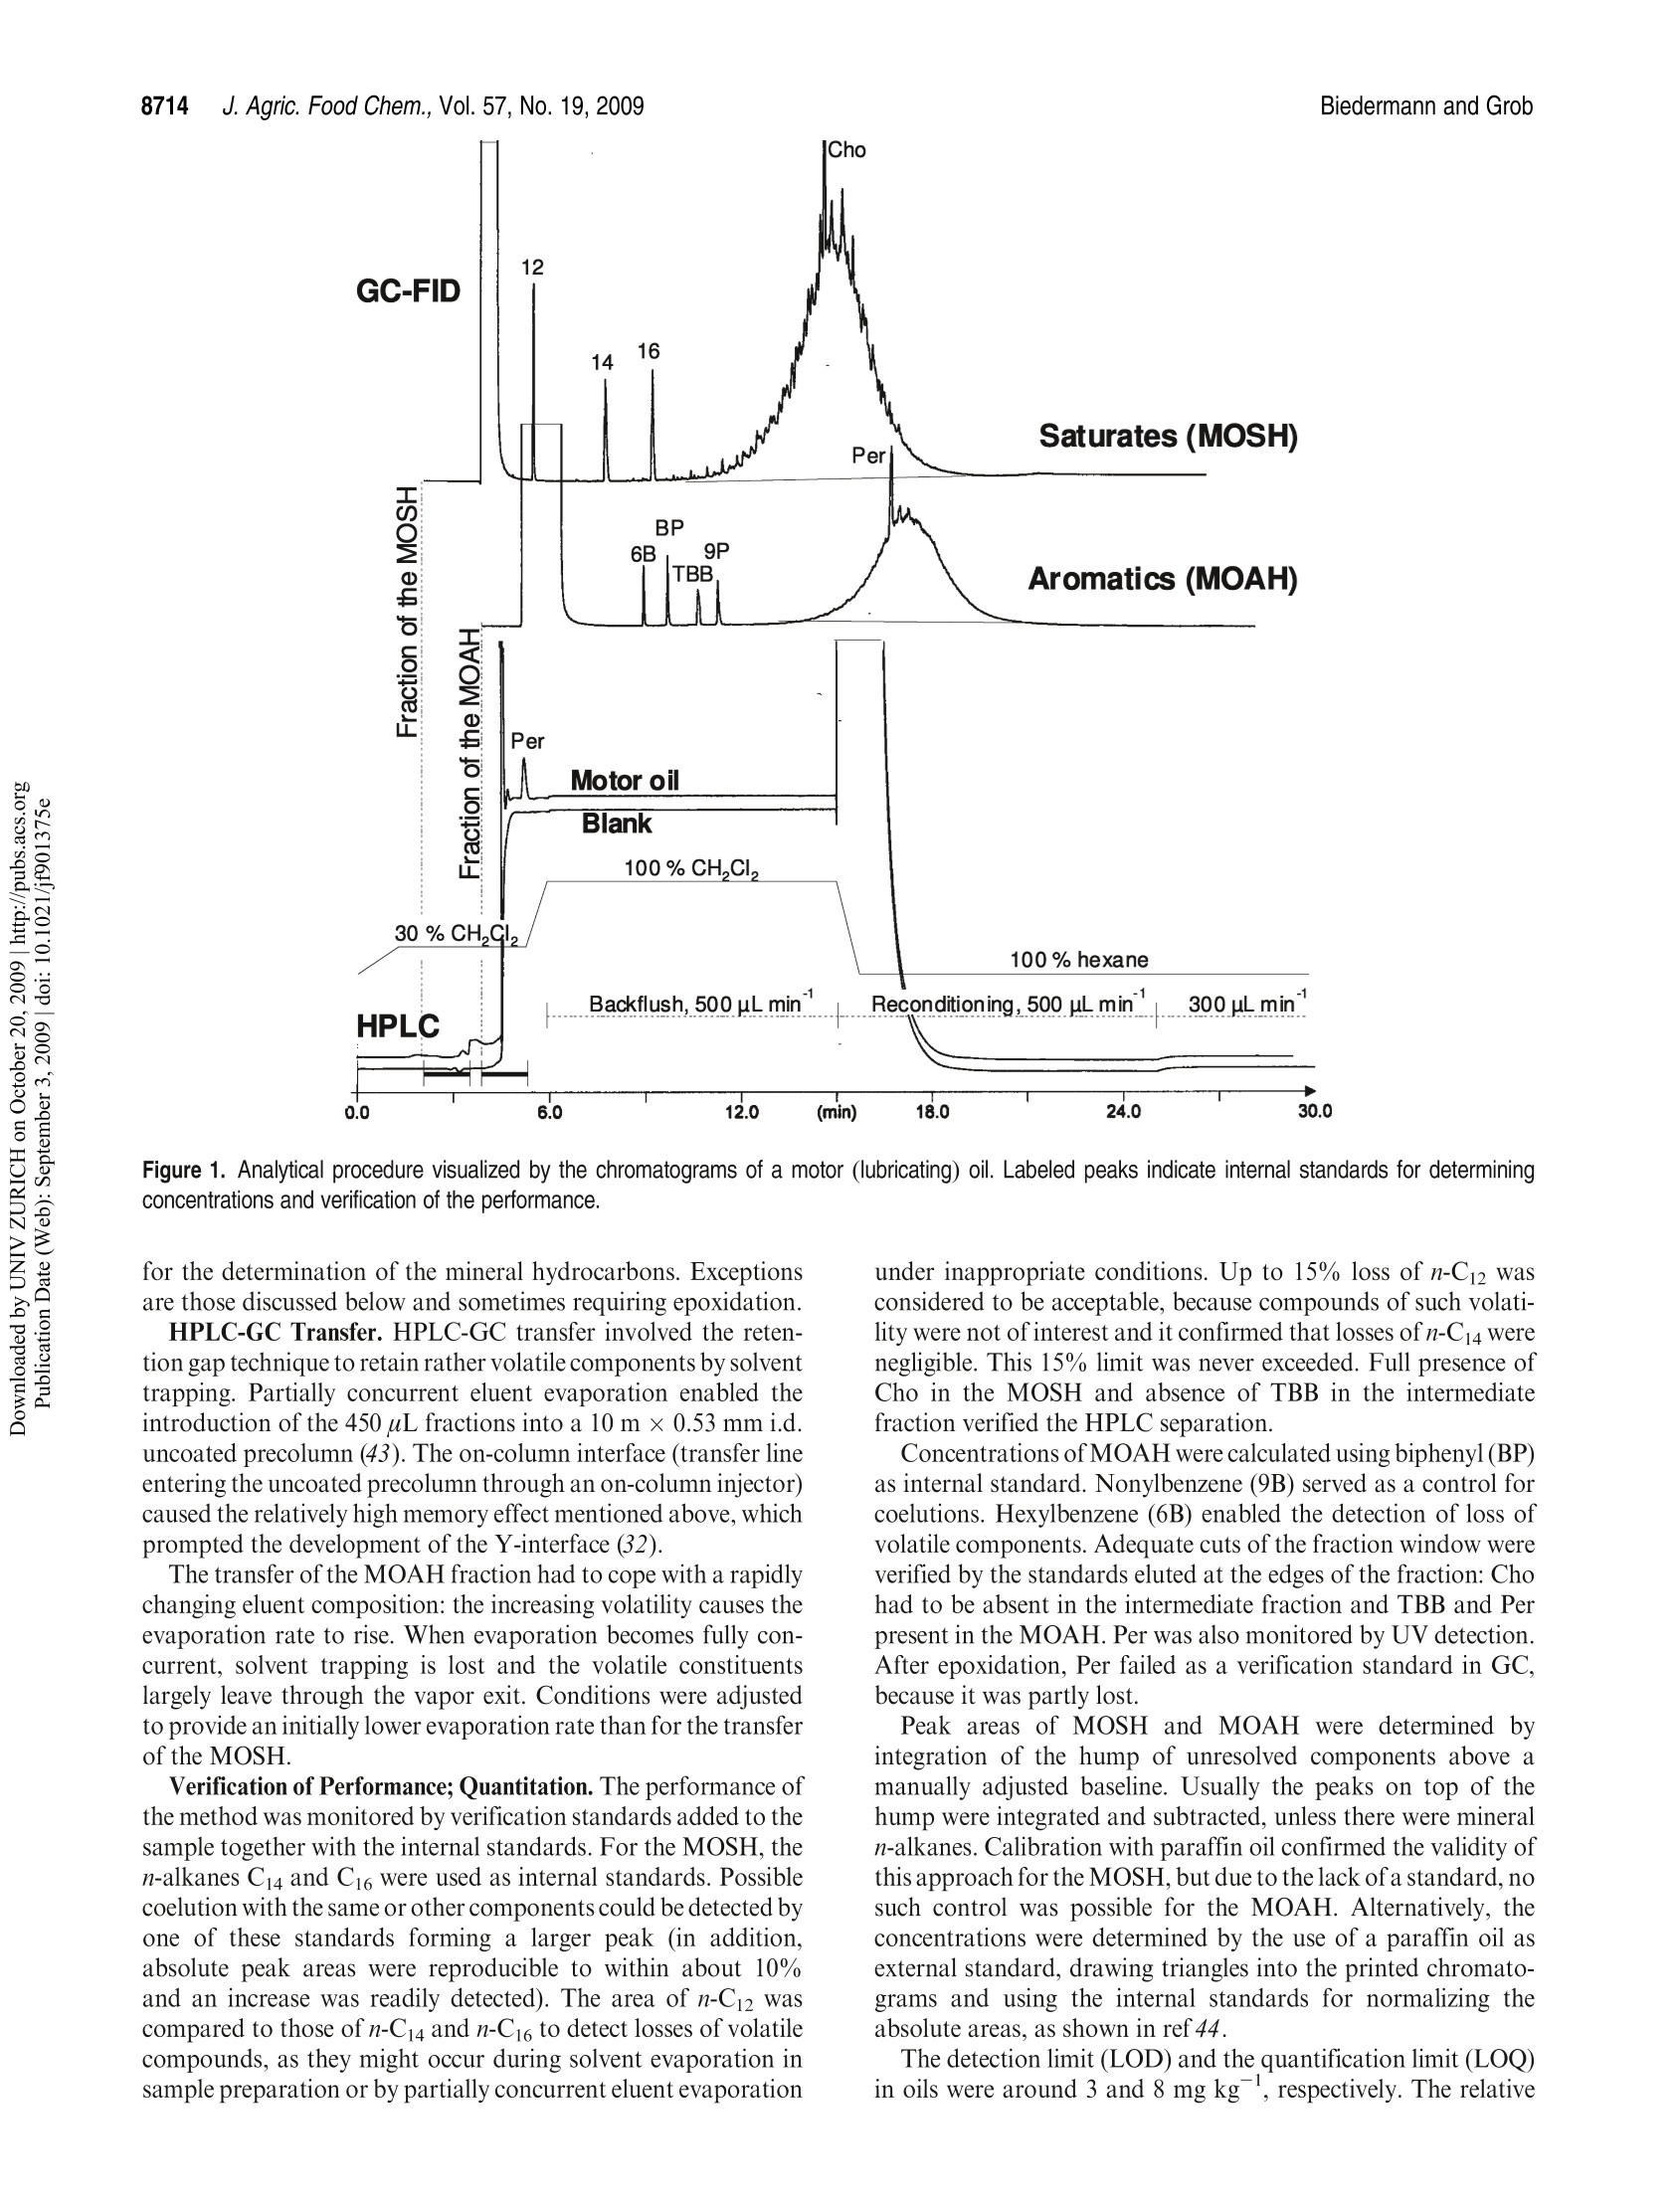
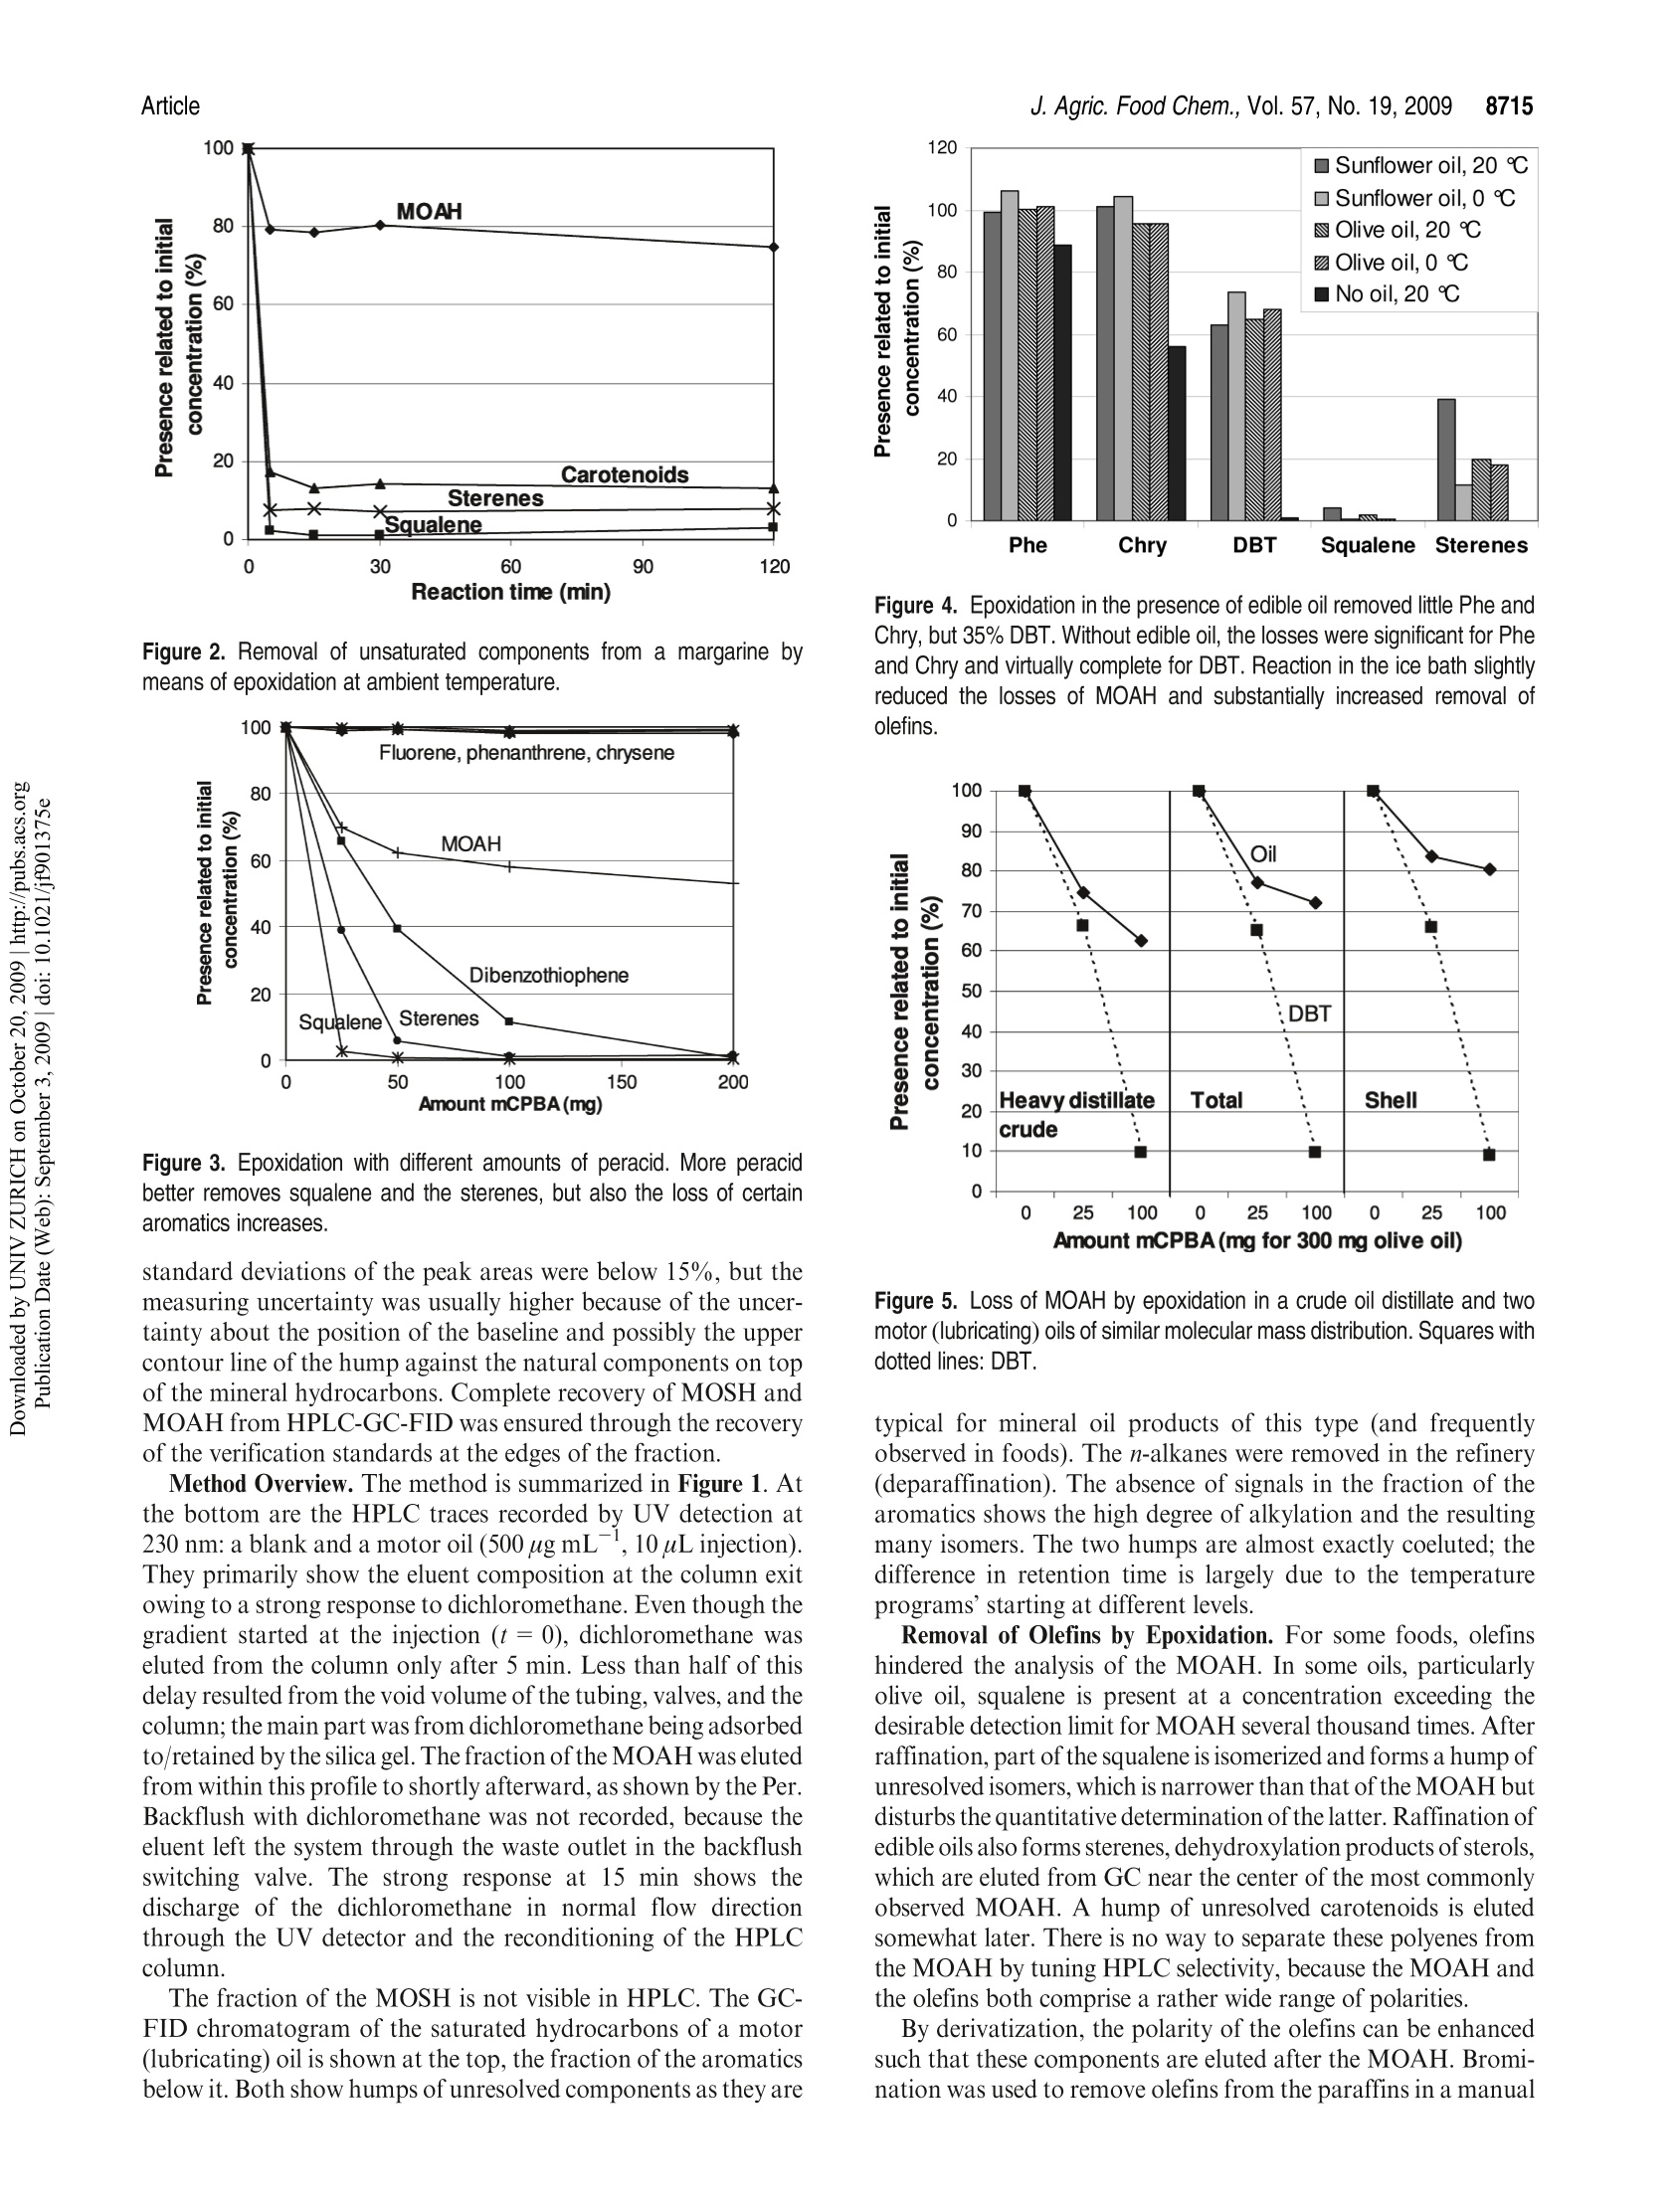
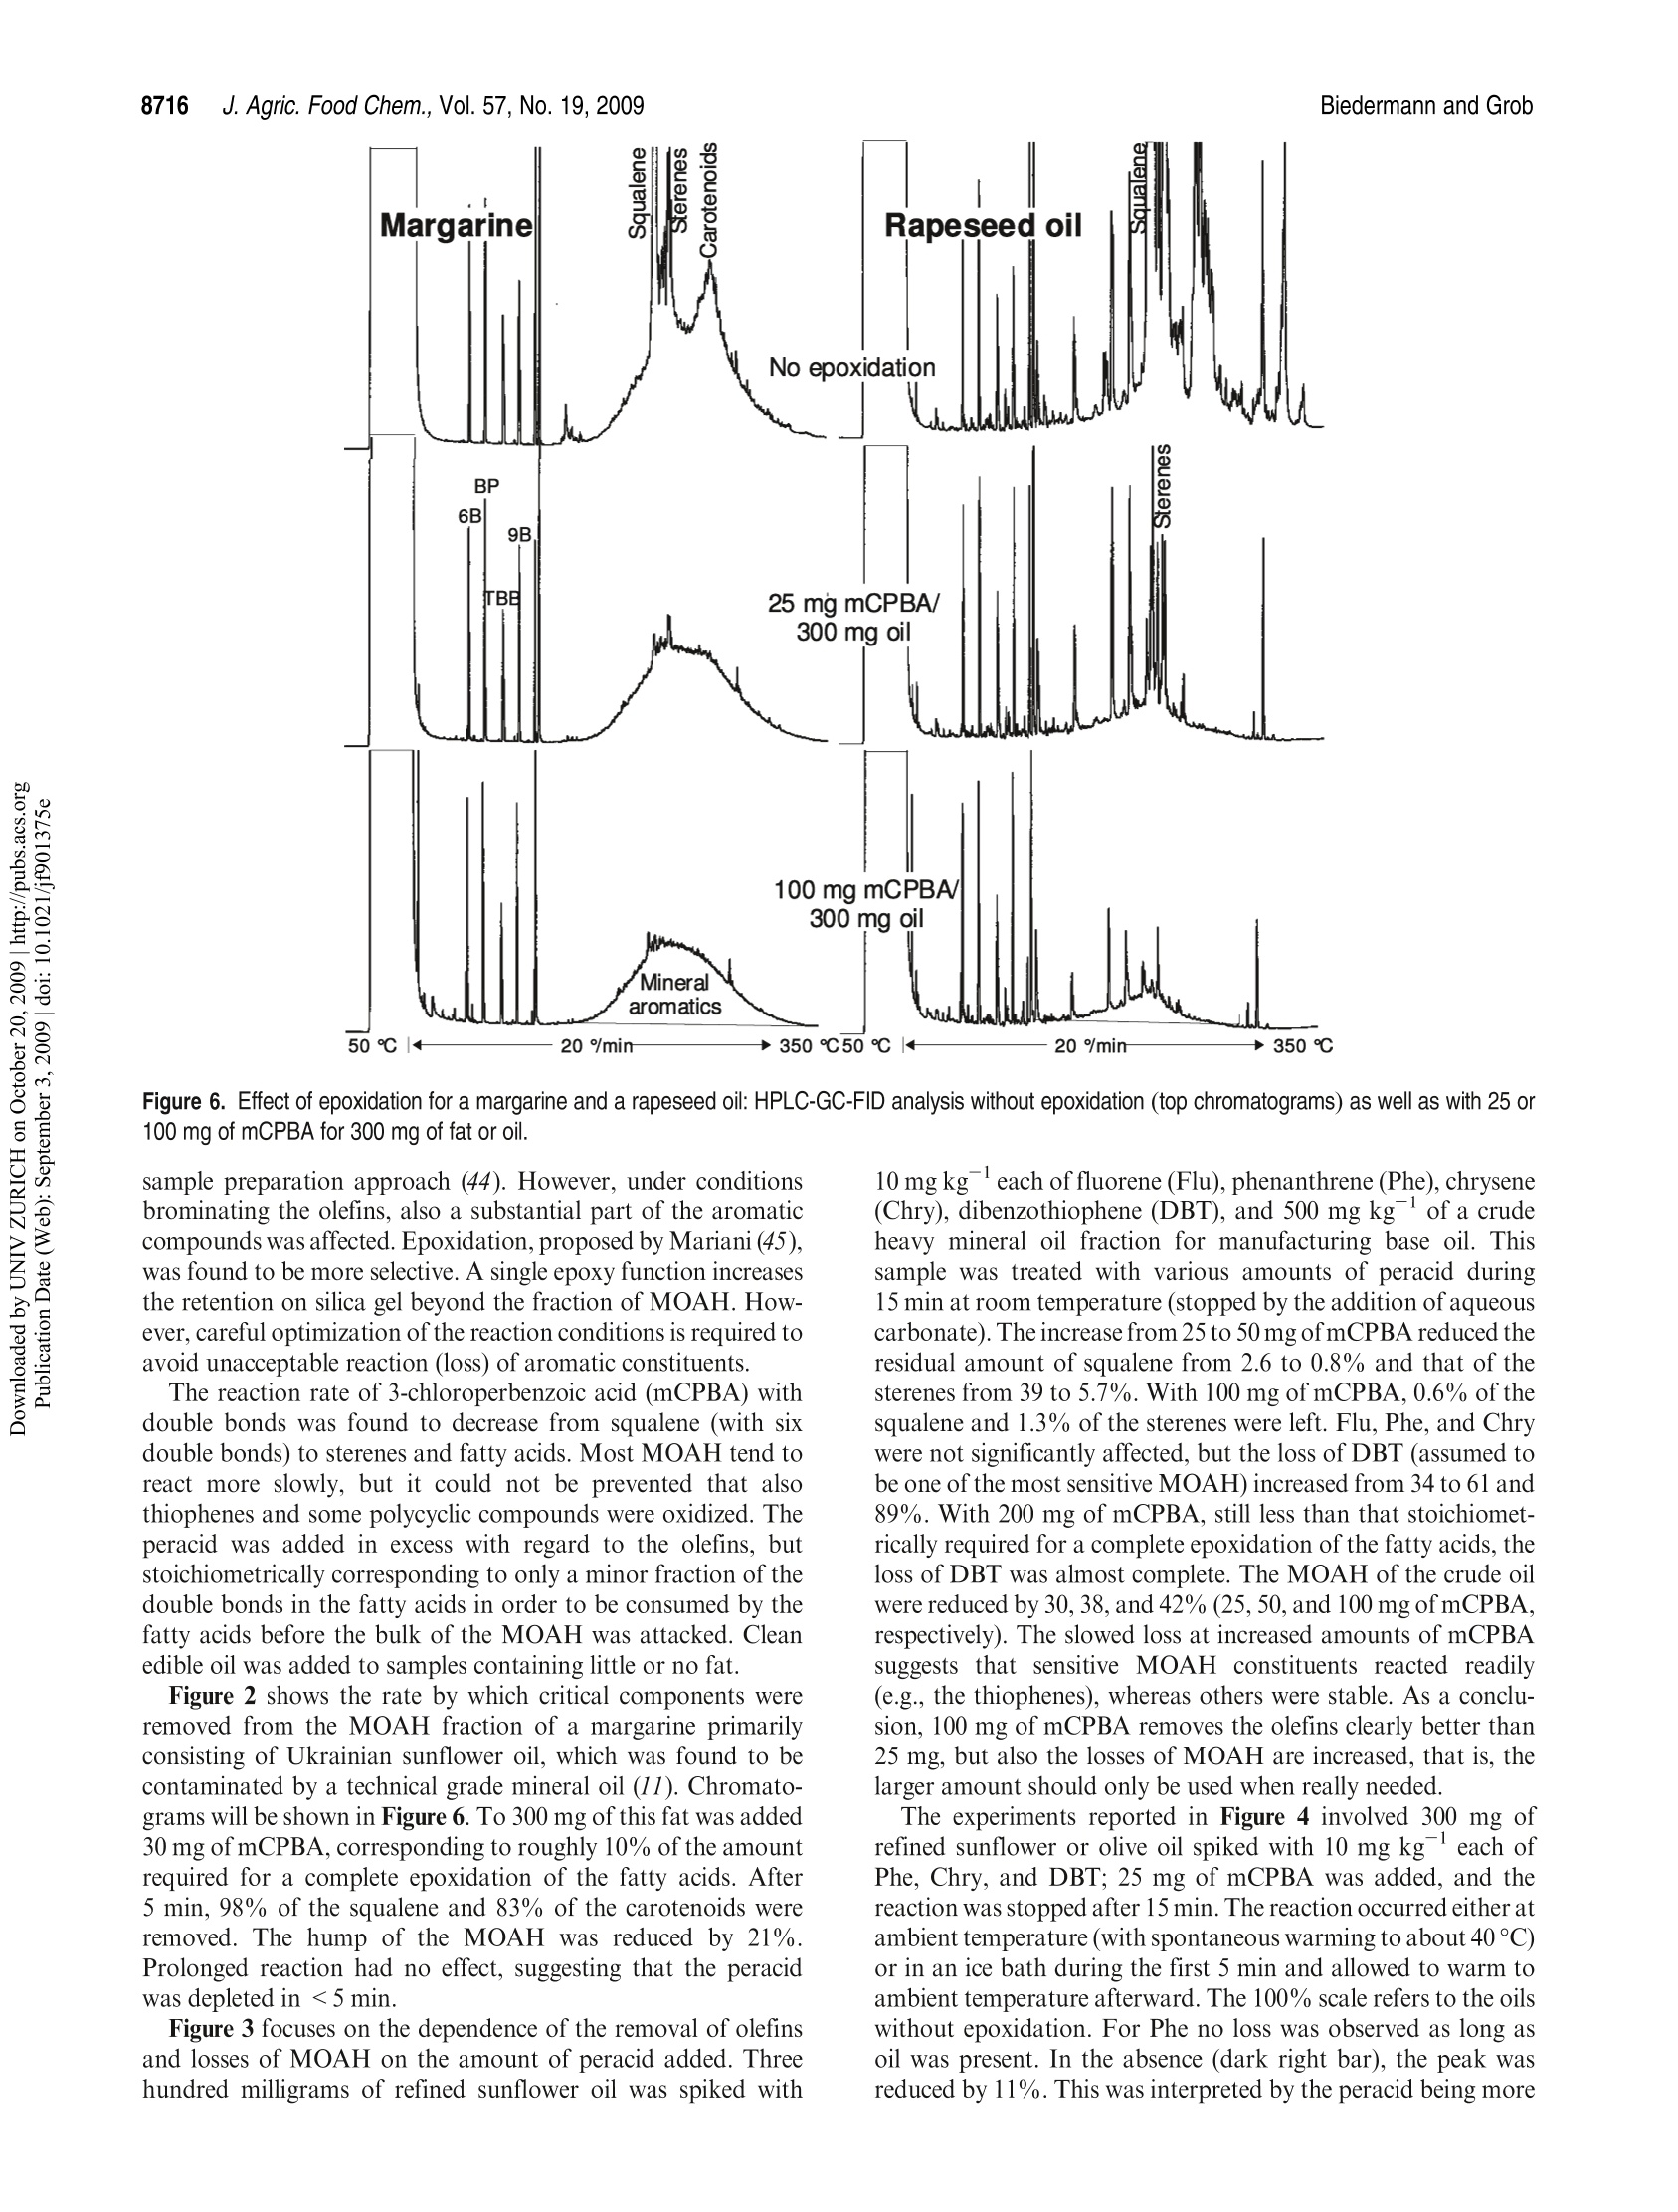
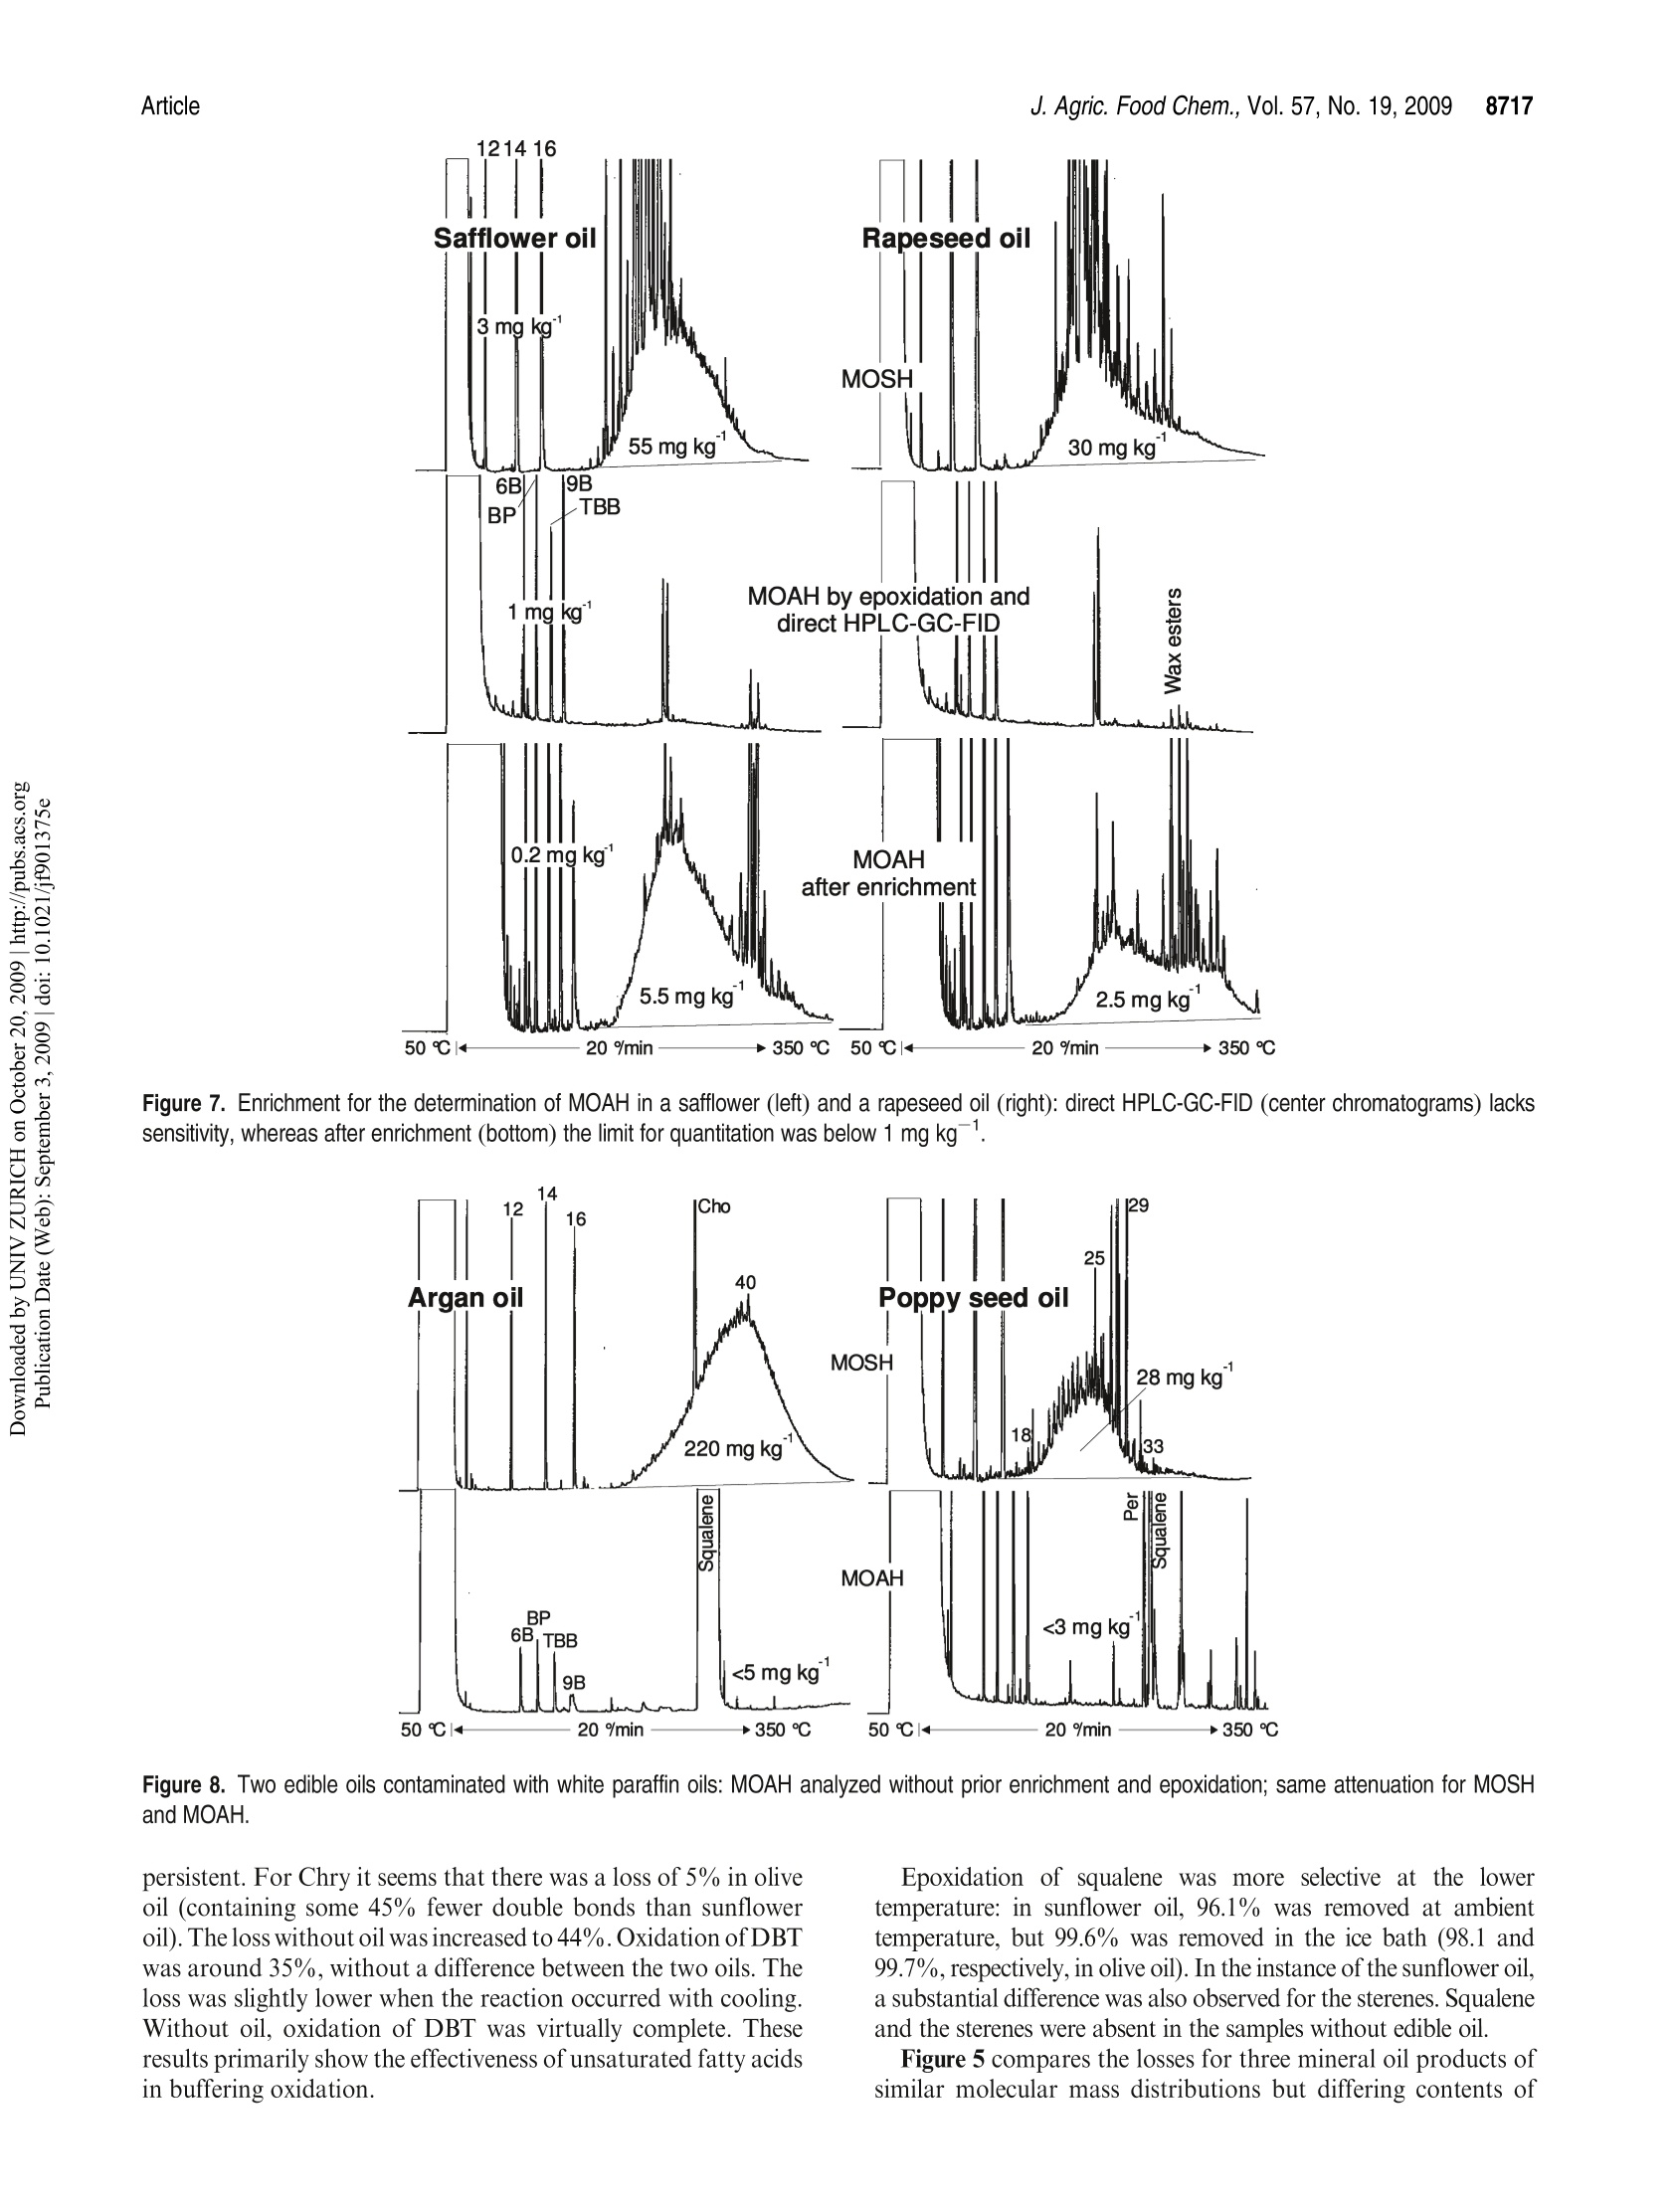
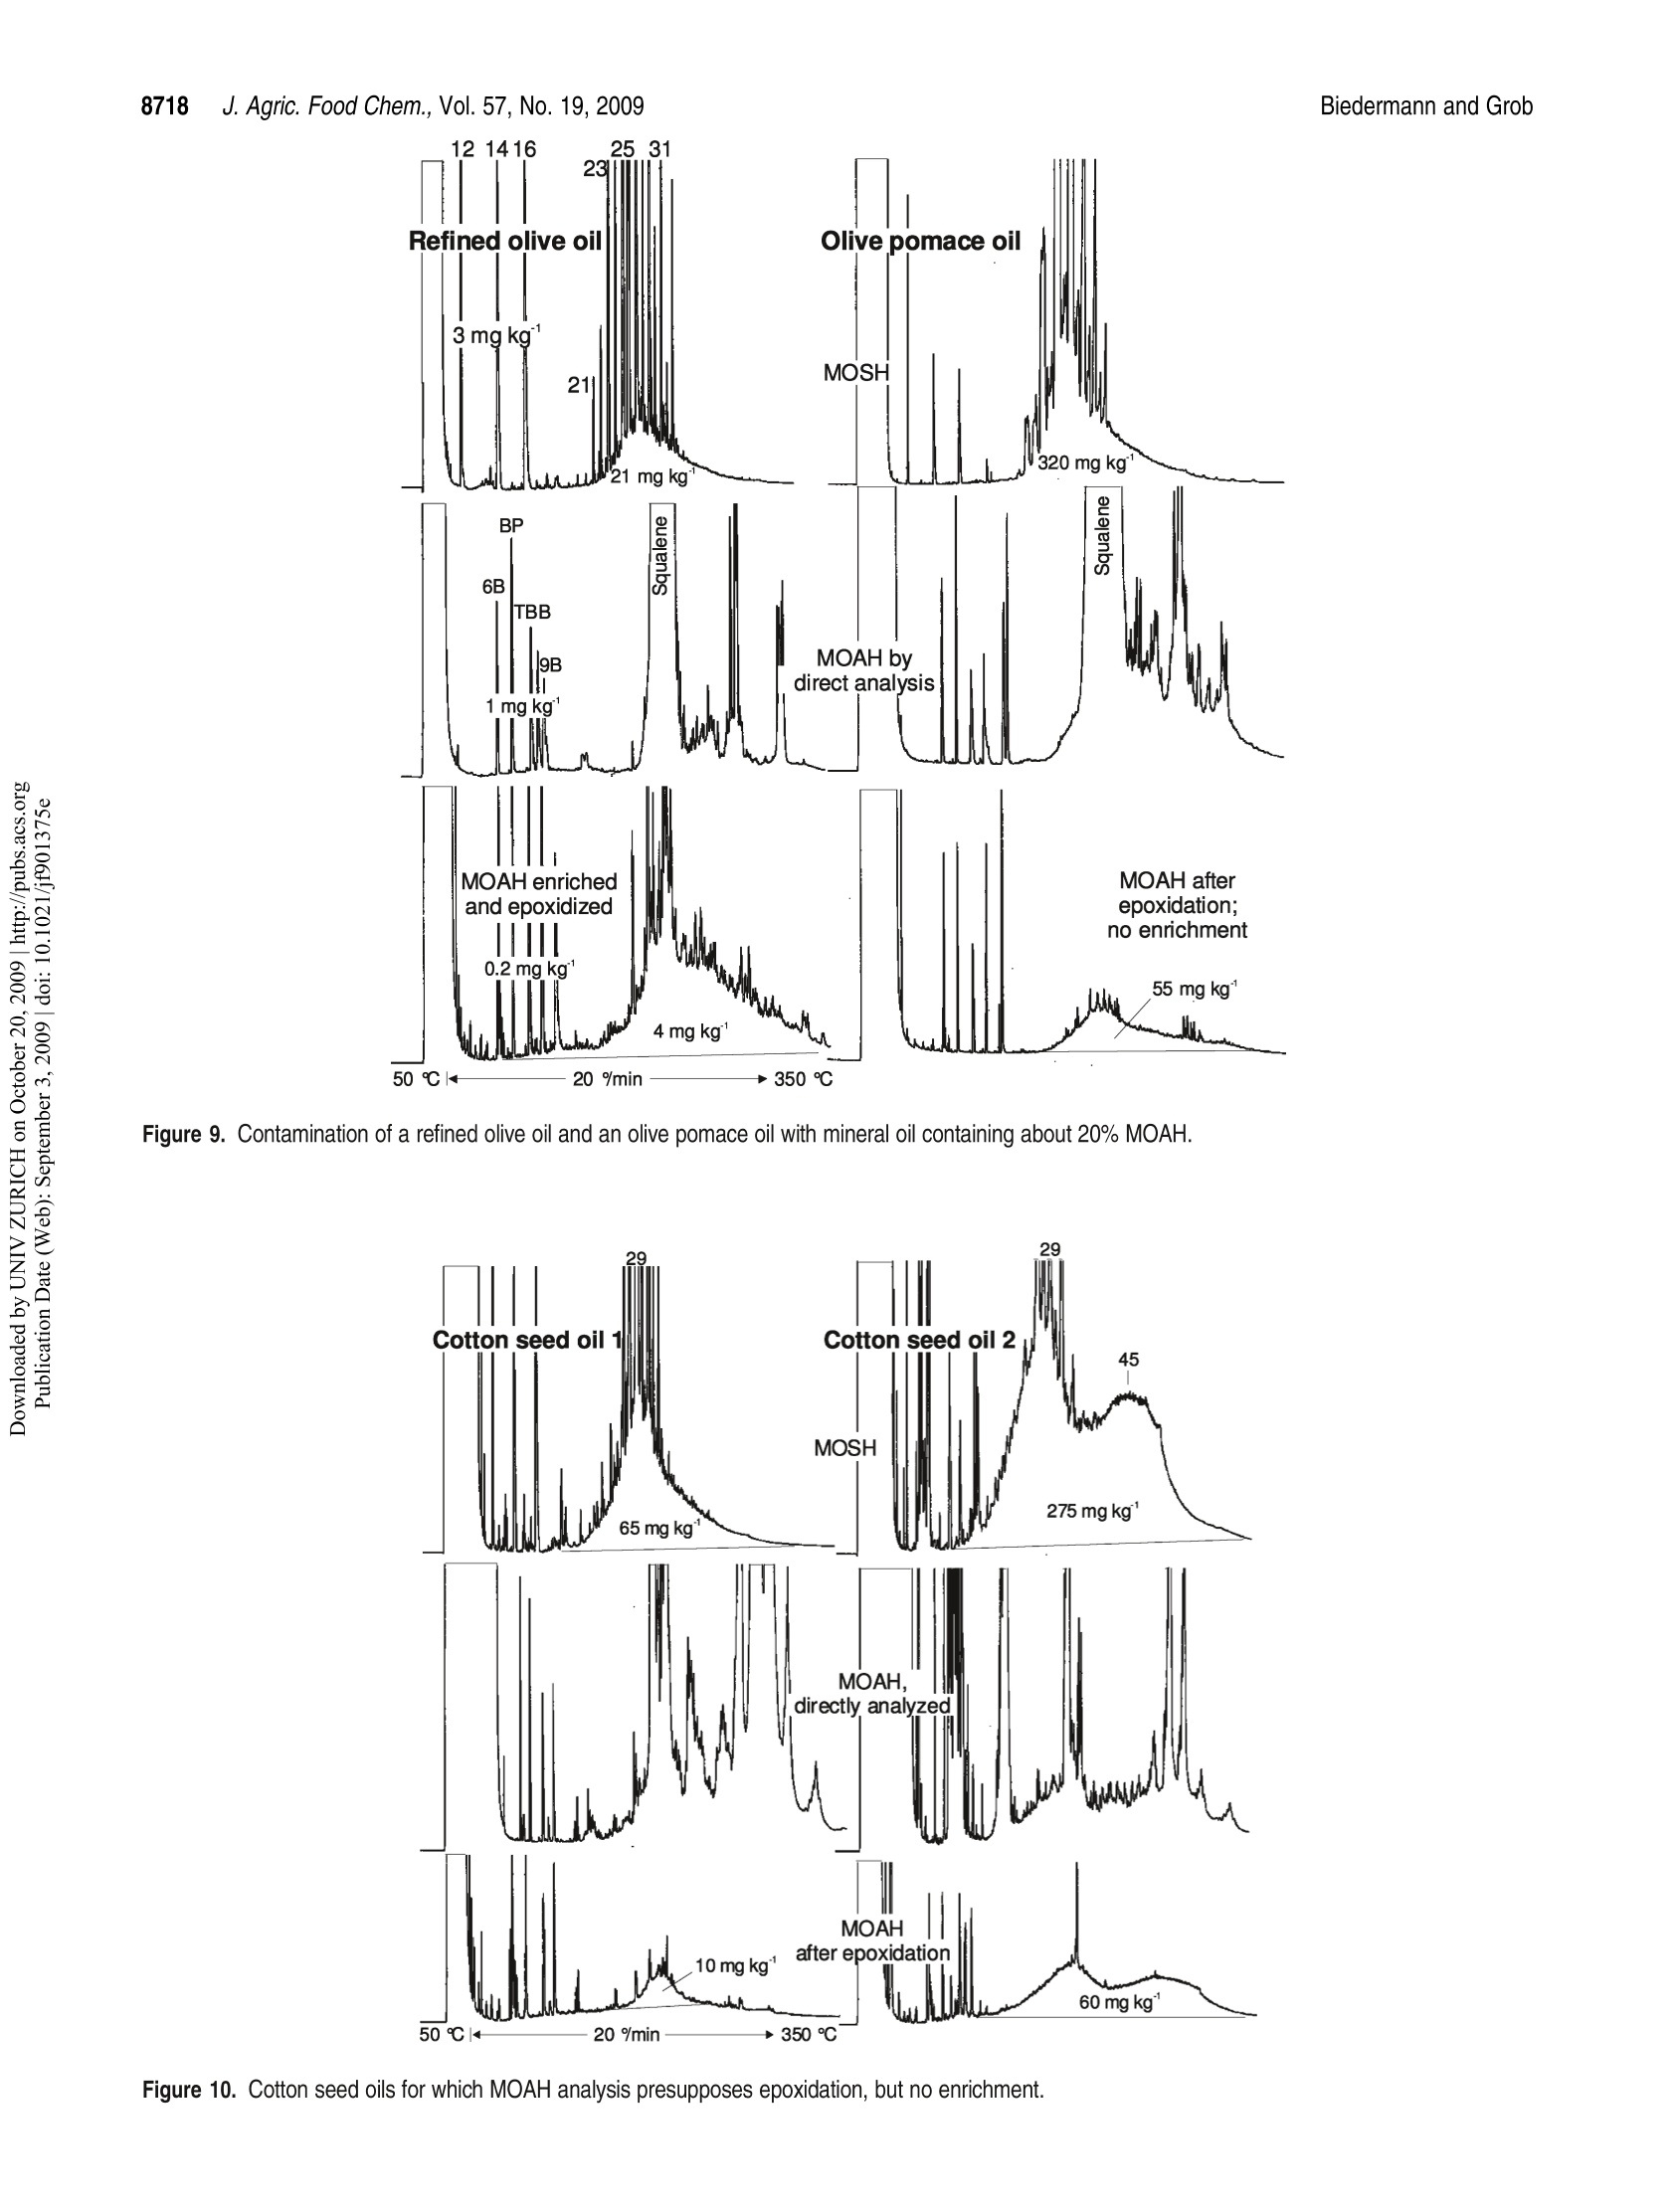
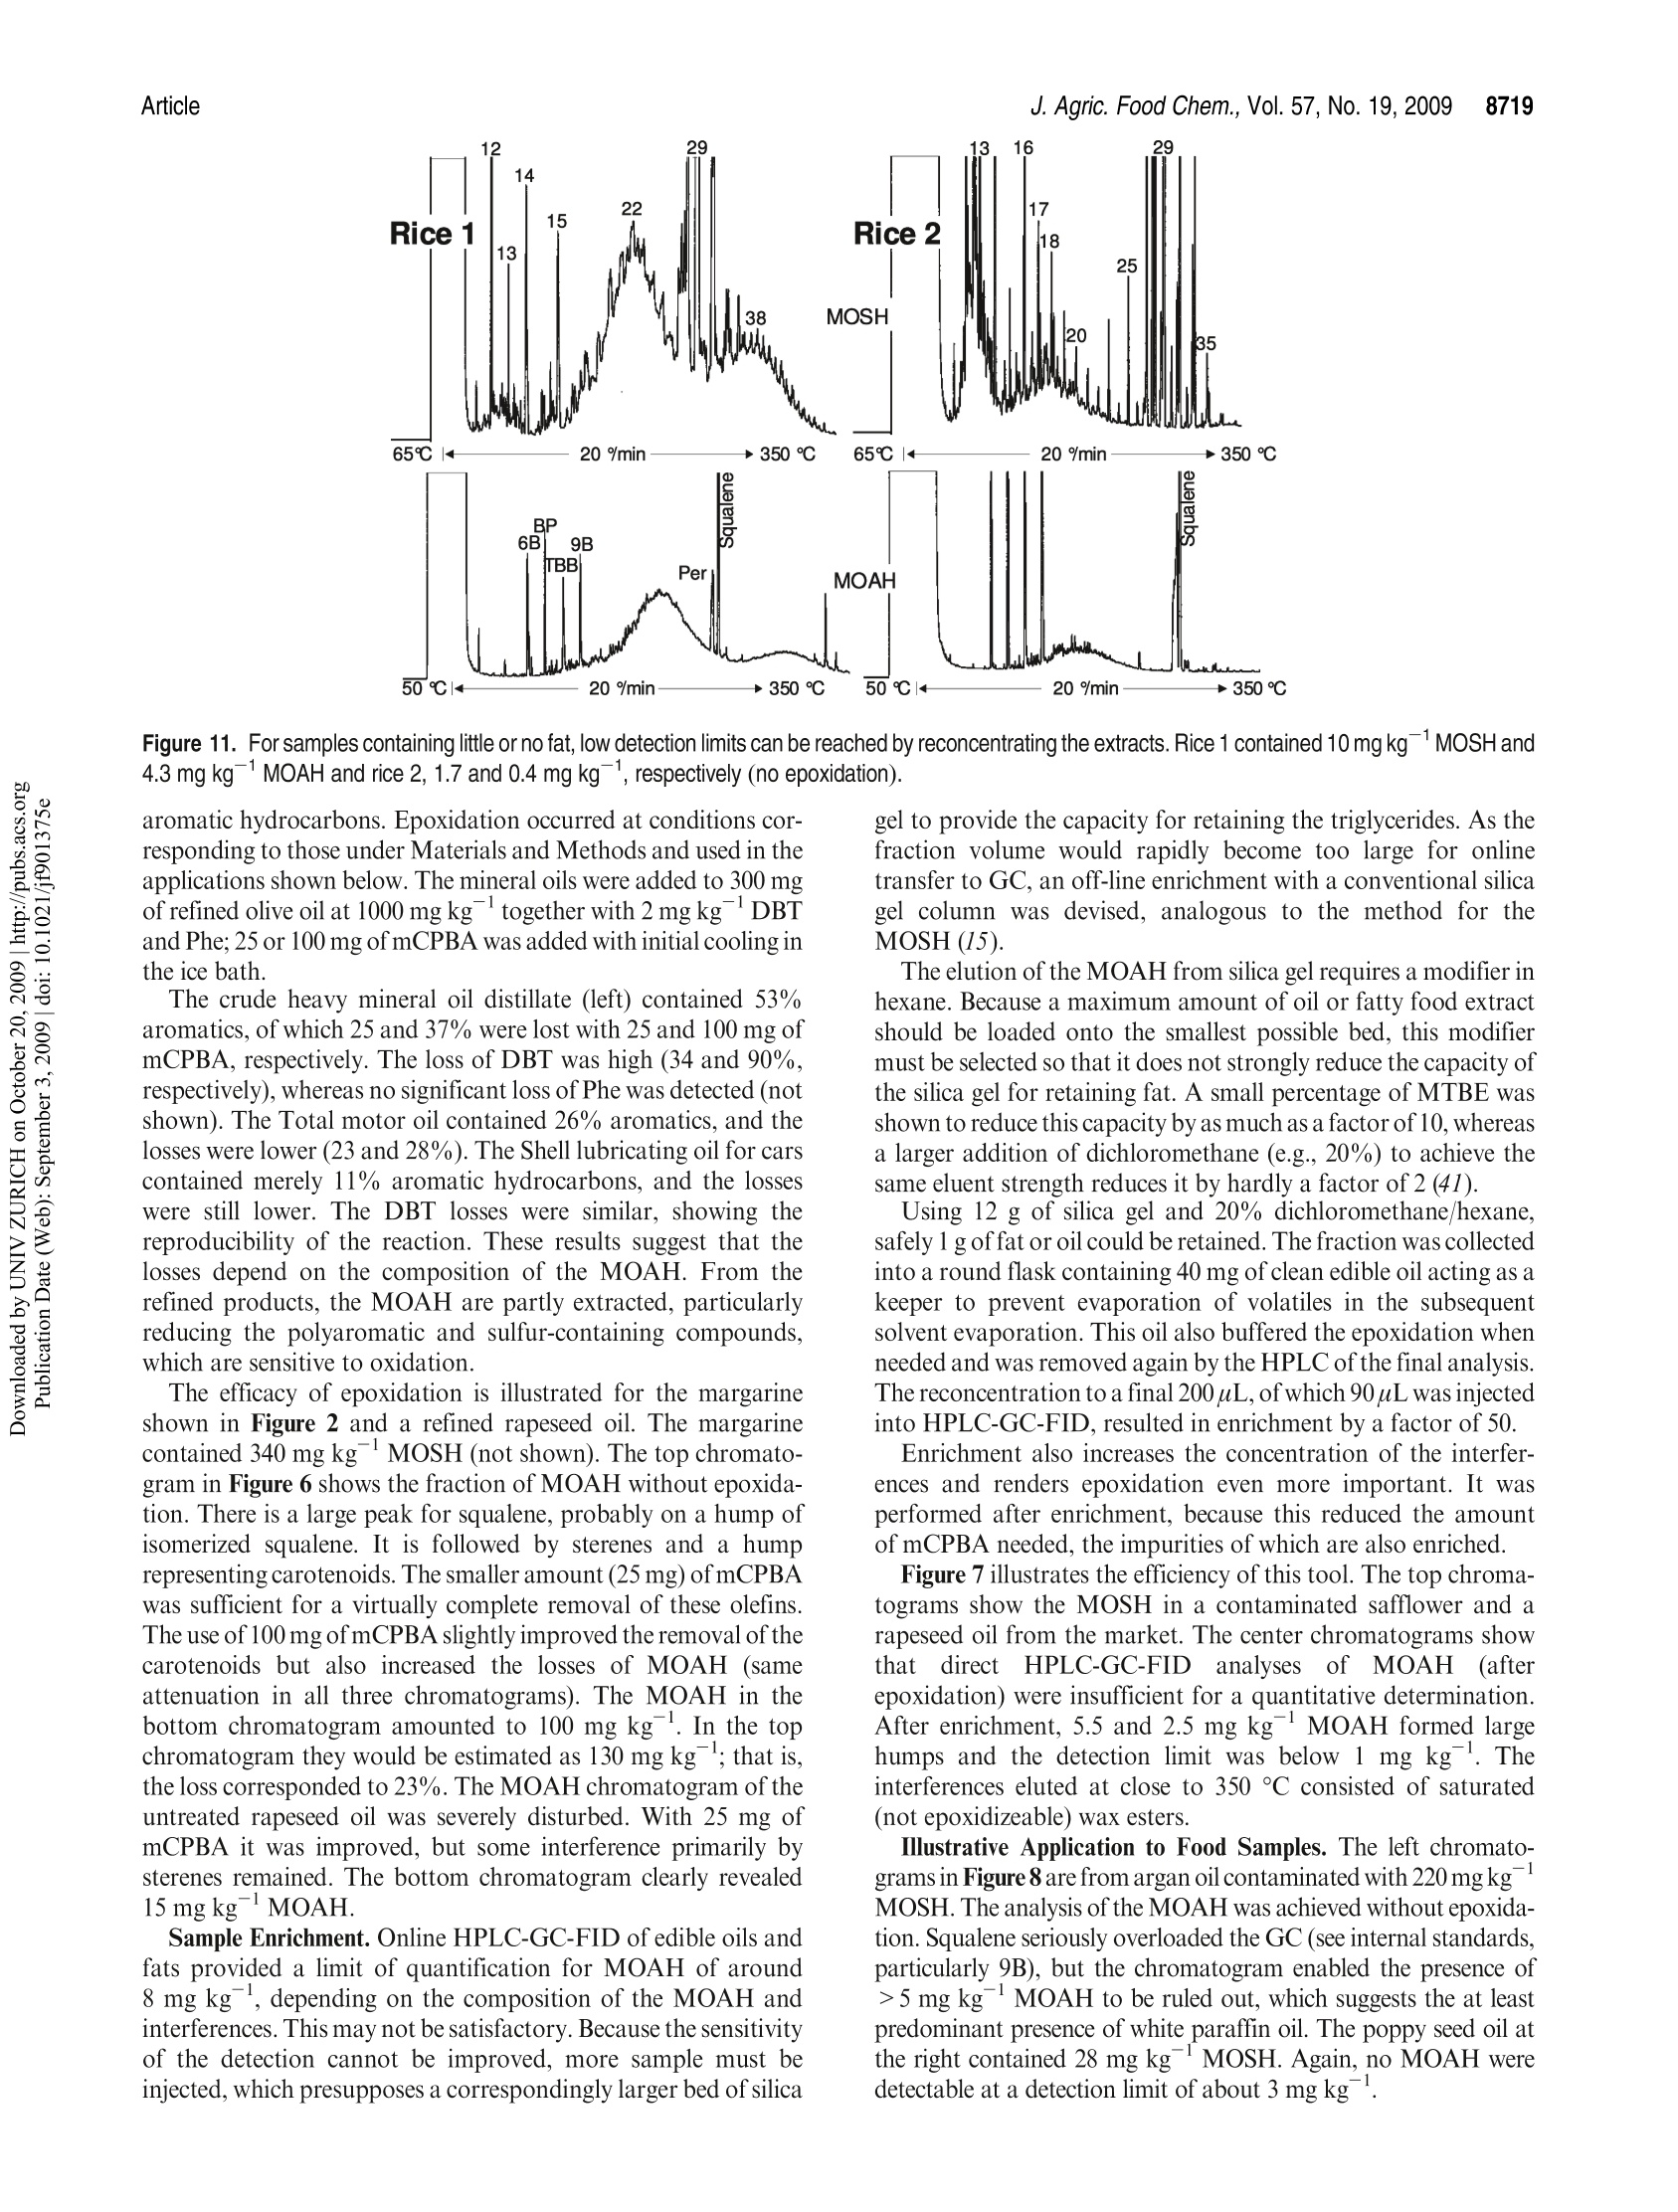
JOURNAIL OFAGRICULTURAL ANDFOOD CHEMISTRYAAFRRTI C LLE8711J. Agric. Food Chem.2009, 57,8711-8721DOl:10.1021/jf901375e 8712J. Agric. Food Chem., Vol. 57, No. 19, 2009Biedermann and Grob Published on Web 09/03/2009pubs.acs.org/JAFC@2009 American Chemical Society Aromatic Hydrocarbons of Mineral Oil Origin in Foods: Methodfor Determining the Total Concentration and First Results MAURUS BIEDERMANN, KATELL FISELIER, AND KONI GROB* Kantonales Labor (Official Food Control Authority of the Canton of Zurich), Fehrenstrasse 15,CH-8032 Zurich. Switzerland An online normal phase high-performance liquid chromatography (HPLC)-gas chromatography(GC)-flame ionization detection (FID) method was developed for the determination of the totalconcentration of the aromatic hydrocarbons of mineral oil origin with up to at least five rings in edibleoils and other foods. For some samples, the olefins in the food matrix were epoxidized to increasetheir polarity and remove them from the fraction of the aromatic hydrocarbons. This reaction wascarefully optimized, because also some aromatics tend to react. To reach a detection limit of around1 mg kgin edible oils, an off-line enrichment was introduced. Some foods contained elevatedconcentrations of white paraffin oils (free of aromatics), but the majority of the mineral oils detectedin foods were of technical grade with 20-30% aromatic hydrocarbons. Many foods containedmineral aromatic hydrocarbons in excess of 1 mg kg1 KEYWORDS: Mineral oil aromatic hydrocarbons; food contamination by mineral oil; epoxidation ofolefins; online HPLC-GC-FID INTRODUCTION Food Contamination by Mineral Oil. Many foods are contami-nated with mineral oil products, and there are numerous sources.Mineral batching oil used for spinning jute or sisal fiberscontaminated foods packed in corresponding bags (1,2). Also,other packaging materials release mineral oil products (3-7).Lubricating oils and release agents used in the food industry oftenconsisted of mineral oil (8,9). Eggs and meat were contaminatedwith mineral oil from feeds containing fat from waste collectionsites that inadequately separated spent fats and liquid wastessuch as used motor oil (10). Mineral oil was most probably alsoadded to edible oils as a fraud (11). There is an environmentalbackground contamination from soot containing incompletelyburned fuel and diesel oil as well as lubricating oil from vehicleswithout catalysts, primarily diesel engines (12,13). In numerousother cases, the source of the contamination still awaitsinvestigation (14-16). The evidence that the hydrocarbons areof mineral origin was discussed in ref17, the presence of hopanes,triterpenoid hydrocarbons formed under geological conditions,being a key argument. The use of certain mineral oil products for food production istolerated, for example, by the Joint FAO/WHO Expert Commit-tee on Food Additives (JECFA) (18). Apart from a required highviscosity, principally referring to a high molecular mass, these oilsmust be “food grade”or“white", which both primarily mean theabsence of aromatics. Human Exposure. The mean dietary exposure to mineralparaffins in the United States was estimated as 0.875 mg kgof body weight (bw)(19), half of which was from oils used asrelease agents for baking ware, for dedusting of grain, inconfectionaries, and for coatings of fruits and vegetables. InEurope, these practices were never authorized or their use was stopped. Tennant (20) estimated the mean exposure in Europe as0.39 mgkgof bwfor adults and 0.75mgkgofbwforchildren.This would correspond to an average mineral oil concentration infoods of around 25 mgkg .Unpublished surveillance data by theOfficial Food Control of Zurich, Switzerland, might have agreedwith this in the early 1990s, but since the major uses were stopped,exposure has probably decreased substantially below this level. Extrapolated from abdominal fat sampled during Caesareansections of Austrian women, the total amount of mineral hydrocarbons in the human body is on the order of1 g(21). Concentra-tions in human fat varied between 15 and 360 mgkg,with anaverage of 60.7 mgkg.The relative importance of the variouspotential sources (such as food, cosmetics, pharmaceuticals) is stillopen. Concentrations in human milk fat were similar to that in thebody fat at the beginning of breast feeding. Mineral oil principally consists of saturated hydrocarbons(paraffins, i.e., straight chain or branched alkanes, and naphthenes,cyclic saturates) and aromatic hydrocarbons. Paraffinic andnaphthenic oils are distinguished depending on the predominantclass of saturated hydrocarbons (see, e.g., ref 22). The relevance ofthis distinction regarding food safety is not clear. For instance, theEuropean Union Scientific Committee for Food (SCF) specified atemporary acceptable daily intake (ADI) for a “white paraffinicmineral oil"without reference to the naphthenics. We use the moregeneral term "mineral oil saturated hydrocarbons"(MOSH) and inthis way also distinguish them from the hydrocarbons of plantorigin. The mineral oil aromatic hydrocarbons (MOAH) differ fromthe widely analyzed polycyclic aromatic hydrocarbons (PAH)formed by pyrolysis at elevated temperature and present in, forexample, roasted or smoked food: PAH consist of a limitednumber of largely nonalkylated ring systems (23), whereas the MOAH are alkylated to 97-99% and consist of an enormousnumber of components (24). In the past, mineral oil analysis in foods referred to the MOSH.However, not all mineral oils contaminating foods are white, andthe MOAH might well be more of concern than the MOSH. Forinstance, the batching oil used for jute and sisal fibers is abrownish liquid containing roughly 25% aromatics (24). Also,environmental contamination is not limited to MOSH, and therecent contamination of Ukrainian sunflower oil occurred withan oil containing roughly a quarter of aromatic hydrocar-bons (11). The neglect of the MOAH is primarily due to the lackof a method for their analysis. Method of Analysis.MOSH are determined by flame ionizationdetection (FID), as it provides virtually equal response per unit ofmass for all hydrocarbons. Gas chromatography (GC) is theseparation technique of choice, because it enables the characteriza-tion of the MOSH and the separation of these from the hydro-carbons naturally present in foods. However, it is not selective: theMOSH produce a broad hump ofunresolved components, and theselectivity to rule out interference by other humps which could bemistaken as MOSH must be from the preseparation. Online high-performance liquid chromatography (HPLC)-GCprovides preseparation at high resolution, enables fully automatedanalysis of crude food extracts or diluted edible oils, and largelyrules out sample contamination during the analytical pro-cess (25,26). Recent progress in MOSH analysis involved activatedaluminum oxide for the removal of long-chain n-alkanes, inparticular those of plant origin often hindering MOSH analy-sis (27). Enrichment on a larger double-bed column containingactivated silica gel for retaining lipids and activated aluminumoxide for the retention of long chain n-alkanes lowered thedetection limit to below 1 mg kg(15). PAH can be determined individually, as shown by manymethods described in the literature (23). This is not possible forthe MOAH: they form broad humps of unresolved componentsand must be analyzed as a sum of all components or of groups, forexample, by ring number. Again, there is no selective detectorwith a predictable response: compounds of differing alkylation donot have the same UV or fluorescence spectra, which means that agroup-type calibration in HPLC is impossible. In mass spectro-metry (MS), there are no fragments common to groups ofcomponents and with an intensity enabling a group-type calibra-tion (28). The only system providing virtually the same responsefor all aromatic hydrocarbons is FID. Moret et al. (29, 30) developed an online method to measureMOAH in foods and characterize their composition by ringnumber. The hydrocarbons were isolated from an edible oil orfood extract by a large HPLC silica gel column. The eluent of thisfraction was evaporated in a miniaturized online solvent eva-porator, the MOAH of at least two rings separated by number ofrings on an amino HPLC column and analyzed online by GC-FID. This revealed the presence of MOAH on the order of10mg kgin various foods. For some foods, batching oil on jutebags was the origin, but for others, the sources were not identified. Scope of this Work. In this paper, a simpler online normalphase HPLC-GC-FID method for determining the total concen-tration of the MOAH in foods is described. suitable for routinecharacterization of mineral oil products in foods. Two auxiliarytools were needed for certain samples: epoxidation for theremoval of natural olefins when present in disturbing amountsand off-line enrichment to reach a detection limit of about1 mg kg for edible oils or fatty food extracts. Examplesillustrate the results. The characterization of the MOAH by ringnumber can be achieved by comprehensive two-dimensional GC(GCxGC-FID) added to this method (31). Samples. Food samples were from a local retail market. Chemicals and Solutions. Hexane from Brenntag (Schweizerhall AG,Basel Switzerland) was redistilled after purification through an aluminumoxide column (2 kg of aluminum oxide for 10 L of solvent). Dichloro-methane was from J. T. Baker (Deventer, The Netherlands). Silica gel 60,0.063-0.200 mm, sodium carbonate, mineral paraffin oil“Paraffin viscousPH Eur, BP, USP”, and biphenyl (BP) were from Merck (Darmstadt,Germany).1,1,2-Trichloroethane, n-dodecane (C12), n-tetradecane (C14),n-hexadecane(C16), hexylbenzene (6B), nonylbenzene (9B), perylene (Per),1,3,5-tri-tert-butylbenzene (TBB), 5-a-cholestane (Cho), 3-chloroperben-zoic acid (mCPBA, ca. 70%), and PS-255 (a dimethylpolysiloxane) werefrom Fluka/Sigma-Aldrich (Buchs, Switzerland). A sunflower oil contain-ing little mineral oil was selected among edible oils from the market. The reagent for epoxidation consisted of 10% mCPBA in dichloro-methane (slightly turbid; stored at ambient temperature for up to a week).The stock solutions of internal standards contained 100 mg of thecomponents in 10 mL of 1,1,2-trichloroethane: mixture 1, 6B, 9B, andBP; mixture 2, C12,C14, C16, mixture 3, Per and Cho.The internal standardsolution contained 100 uL of mixture 1, 300 uL of mixture 2, and 500 uL ofmixture 3 in 10 mL of 1,1,2-trichloroethane. Mixtures of hexylbenzenes and of octadecylbenzenes were obtained byFriedel Kraft reaction of benzene with the corresponding alkyl chlorides:to 5 mmol of benzene dried over sodium sulfate and 0.1 mmolof aluminumchloride cooled in an ice bath was added 5 mmol of 1-chloroalkanes inportions; the onset of the reaction was monitored by hydrogen chlorideleaving the condenser. The product was picked up in hexane and washedwith water. Sample Preparation. Of edible oil and fats, 2 g was weighed in andfilled to 10 mL with hexane together with 20 uL of internal standardsolution. To 20 g of rice, milled noodles, and similar products were added30 mL of hexane and 20 uL of standard solution, and the mixtures wereallowed to stand overnight. Ten milliliters of extract was brought to 1 mLby a rotary evaporator. Turbid solutions were centrifuged. Five grams ofchocolate was dissolved in 10 mL of hexane to which 25 uL of standardsolution was added. Epoxidation. In a 15 mL centrifuge tube with a screw cap, 1.5 mL ofthe above sample solution was brought to dryness by a stream of nitrogen.Of fats and oils, 300 mg was directly weighed in, and 3 uL of internalstandard solution was added. For samples containing little fat, 100 mg ofsunflower oil containing little mineral oil was admixed before solventevaporation. Dichloromethane(3 mL) was added and cooled in ice waterand then 1 mL of cooled mCPBA solution. The mixture was shaken andallowed to warm to ambient temperature after 5 min. After 15 min,3 mL of10% sodium carbonate was added, the solution was intensively shaken for15 s and then centrifuged. The aqueous supernatant was discarded, and thesample was extracted with 3 mL of water and centrifuged; 1.5 mL of thedichloromethane phase was transferred to an autosampler vial andbrought to dryness by a stream of nitrogen. The residue was redissolvedin 1 mL of hexane. Enrichment. Twelve grams of silica gel was packed into a 2 cm i.d.column and conditioned with 40 mL of 20% dichloromethane/hexane.Then 1 g of edible oil or fat in 2 mL of hexane and 10 uL of internalstandard solution were added. The first 10 mL of eluate (20% dichloro-methane/hexane) was discarded.The subsequent 35 mL was collected in around flask that contained 40 mg of the clean sunflower oil. The solventwas evaporated using a rotary evaporator and the residue transferred to anautosampler vial with 200 uL of hexane. If epoxidation was needed, the residue was transferred to a 15 mLcentrifuge tube with 1 mL of dichloromethane, and 150 uL of mCPBAsolution was added. After the reaction, the solution was washed with 1 mLof 10% sodium carbonate solution and water as described above. Thedichloromethane was evaporated and the residue recovered in 200 uL ofhexane. HPLC-GC-FID Analysis. The instrument for automated onlineHPLC-GC-FID was from Thermo Scientific (Milano, Italy) and consistedof a TriPlus autosampler with a 100 uL syringe, a Phoenix 40 dual syringepump with three switching valves, a microUVIS 20 UV detector, and aTrace gas chromatograph equipped with an on-column injector, an earlyvapor exit, and a transfer switching valve. Of the samples, 5-90 uL was injected onto a 25 cmx2 mmi.d. HPLCcolumn packed with Lichrospher Si 60, 5 um (Grom, Rottenburg-Hailfingen, Germany), and chromatographed at 300 uL min using agradient starting with hexane (0.1 min) and reaching 30% dichloro-methane after 2 min. The column was backflushed 6 min after the injectionwith dichloromethane at 500 uL minfor 9 min and then reconditioned at500 uL minwith hexane for 10 min and at 300 uL minup to thesubsequent injection. HPLC-GC transfer occurred by the retention gap technique andpartially concurrent eluent evaporation (25), initially through the on-column and later through the Y-interface (32). A 10 m x0.53 mm i.d.uncoated, deactivated precolumn was followed by a steel T-piece unionconnecting to the solvent vapor exit and a 15 m x0.25 mm i.d. separationcolumn coated in the laboratory with a 0.13 um film of PS-255. From HPLC, the saturated hydrocarbons were eluted from 2.0 to 3.5 minand transferred to GC at a carrier gas inlet pressure of 60 kPa (helium). Theelution window was established by transferring small fractions to GC. Theduration of solvent evaporation was determined by the flame method: theeffluent from the vapor outlet was lit and the time to the disappearance ofthe yellow flame measured by means of a stop watch. The solvent vapor exitwas switched to a strong restriction 2 s before the end of solvent evaporation,which was around 3.65 min (t=0 at injection into HPLC). The carrier gasinlet pressure was increased to 150 kPa at the moment of closing of the vaporexit. The oven temperature was programmed at 20 C minfrom 65℃(6 min) to 350 °C. The fraction comprising the MOAH ranged from 4.0 to5.5 min and was transferred at 110 kPa inlet pressure, with an increase to150 kPa upon closure of the vapor exit (5.7 min). The oven temperature wasprogrammed at 20C min-from 50C (8 min) to 350C. The FID baseblock was heated at 370 °C. Sometimes also the intermediate fraction(3.5-4.0 min) was transferred to GC, using the conditions applied to thefraction of the saturated hydrocarbons.IS. GCxGC for Confirmation. Comprehensive two-dimensional GC(GCxGC) was used for confirming adequate separation of MOSH andMOAH and will be described in ref 31. Briefly, HPLC fractions werecollected from the waste exit of the HPLC-GC transfer valve andreconcentrated to 20 uL. Of this, 10 uL was injected on-column onto asystem composed of a 1 mx0.53 mm i.d. deactivated precolumn followedby a 20 mx0.25 mm i.d. first-dimension separation column coated with a0.12 um film of PS-255 and a 1.5 m × 0.15 mm i.d. second-dimensioncolumn coated with a 0.075 um film of a 50%phenylpolysiloxane. Acryogenic jet modulator was used (Thermo Scientific). RESULTS AND DISCUSSION Concept of MOSH/MOAH Separation. During the initialevaluation of potential approaches, comprehensive two-dimen-sional GC (GCxGC) was considered for the separation ofparaffins, naphthenes, and various classes of MOAH (33-38).This was discarded, because naphthenes, including the steranesand the hopanes, cannot be fully separated from the MOAH byGCxGC (34,39,40)and there would still be the need for isolatingthe hydrocarbons from the food matrix. Preference was given to anormal phase HPLC-GC method to determine the sum of allaromatics, leaving the option of characterizing the MOAH byGCxGC as an add-on (31). As outlined in the Introduction, MOSH and MOAH consist ofextremely complex mixtures. GC-FID is the method of choice butjust forms broad humps ofunresolved components, reflecting thedistillation process in the refinery. Because the MOSH andMOAH are from the same mineral oil fraction, they are of thesame volatility range, and the selectivity must be obtained fromthe preseparation. Separation of MOSH and MOAH should be complete to theextent that a white mineral oil containing <1% MOAH can berecognized. Because the possibly small MOAH peak is elutedafter the predominating MOSH, a small tailing of the MOSHintothe MOAH fraction disturbs the determination. HPLC provideshigh resolution with minimal tailing. Silica gel was used, becauseit provides strong retention for aromatic hydrocarbons and a high capacity for retaining triglycerides (41). The 25 cm × 2 mm i.d.column used had a capacity to retain 20 mg of fat in such a waythat enough packing was left to achieve the MOSH/MOAHseparation. The HPLC separation was optimized and verified by standardsmarking the edges of the fractions. The start of the MOSHfraction is at breakthrough, whereby the large molecular compo-nents are eluted earlier than the smaller ones owing to the sizeexclusion effect. Naphthenes were eluted last: 5-a-cholestane(Cho) was baseline-separated from n-alkanes of similar molecularmass. Cho was used as a marker for the rear edge of the MOSHfraction: it had to be present in the MOSH and absent in theintermediate fraction between the MOSH and the MOAH. To find the least retained aromatic hydrocarbon, that is, thestart of the MOAH fraction, the retentions of trihexylbenzene,dioctadecylbenzene, and 1,3,5-tri-tert-butylbenzene (TBB) werecompared. TBB, eluted at a similar retention time as the longerchain derivatives, was chosen as the marker owing to its com-mercial availability: it had to be fully present in the MOAHfraction (area ratio to the internal standard, biphenyl, BP) andabsent in the intermediate fraction. Perylene (Per; five fusedaromatic rings) was selected as the most strongly retainedcompound to be included. The correct separation of MOSHand MOAH was checked by GCxGC with FID or MS: HPLCfractions were collected, reconcentrated, and injected on-columninto the GCxGC system. Lichrospher Si 60, a silica gel with strong retention power,provided abundant separation between the MOSH and MOAH,that is, between Cho and TBB. The distance between these waswelcome for a robust separation and to minimize the tailing of theMOSH into the MOAH. Strong retention also relies on hexanebeing free of polar impurities; because it tends to get oxidizedduring storage (42) and these byproducts cannot be removed bydistillation, it was purified through activated aluminum oxideprior to distillation. Strong retention of the MOAH implied a steep gradient toprevent an excessively broad fraction. First experiments withmethyl tert-butyl ether (MTBE) were not successful: hexanepropagated MTBE too slowly through the column, that is, thegradient had a strong delay and did not focus the fraction asefficiently as desirable. Furthermore, it took too much hexaneand time for the complete removal of the residual MTBE duringreconditioning. Dichloromethane was better suited in both re-spects. The gradient was started at the moment of the injection toachieve breakthrough of the dichloromethane at a retention timeof about 5 min. Backflush with dichloromethane proved to besatisfactory: the silica gel did not lose activity after more than1000 analyses. There was a gap of 30 s between the last eluted MOSH and thefirst MOAH. This intermediate fraction was often analyzed toconfirm complete separation of MOSH and MOAH: Cho andTBB as well as humps of mineral oil components had to be absent.Furthermore, the initially used on-column interface struggledwith a memory effect of 1.5-4%, and transfer of the intermediatefraction cleaned the transfer system. This was no longer neededwith the Y-interface (32). Crude mineral oils hardly contain olefins (22), but productsmay contain them from the raffination process. Furthermore, thefood matrix may contain olefins, either of natural origin or as aresult of heating or raffination (see below). Monoenes, such as1-octadecene, calarene, or kaurene, were eluted with the MOSH,sometimes tailing into the intermediate fraction (e.g., kaurene insunflower oils). Most olefins with more than one double bond(food constituents) were eluted with the MOAH, but usuallycreated no problems, as they form sharp peaks that are ignored Figure 1. Analytical procedure visualized by the chromatograms of a motor (lubricating) oil. Labeled peaks indicate internal standards for determiningconcentrations and verification of the performance. for the determination of the mineral hydrocarbons. Exceptionsare those discussed below and sometimes requiring epoxidation. HPLC-GC Transfer. HPLC-GC transfer involved the reten-tion gap technique to retain rather volatile components by solventtrapping. Partially concurrent eluent evaporation enabled theintroduction of the 450 uL fractions into a 10 m x 0.53 mm i.d.uncoated precolumn (43). The on-column interface (transfer lineentering the uncoated precolumn through an on-column injector)caused the relatively high memory effect mentioned above, whichprompted the development of the Y-interface (32). The transfer of the MOAH fraction had to cope with a rapidlychanging eluent composition: the increasing volatility causes theevaporation rate to rise. When evaporation becomes fully con-current, solvent trapping is lost and the volatile constituentslargely leave through the vapor exit. Conditions were adjustedto provide an initially lower evaporation rate than for the transferof the MOSH. Verification of Performance; Quantitation. The performance ofthe method was monitored by verification standards added to thesample together with the internal standards. For the MOSH, then-alkanes C14 and C16 were used as internal standards. Possiblecoelution with the same or other components could be detected byone of these standards forming a larger peak (in addition,absolute peak areas were reproducible to within about 10%and an increase was readily detected). The area of n-C12 wascompared to those of n-C14 and n-C16 to detect losses of volatilecompounds, as they might occur during solvent evaporation insample preparation or by partially concurrent eluent evaporation under inappropriate conditions. Up to 15% loss of n-C12 wasconsidered to be acceptable, because compounds of such volati-lity were not of interest and it confirmed that losses of n-C14 werenegligible. This 15% limit was never exceeded. Full presence ofCho in the MOSH and absence of TBB in the intermediatefraction verified the HPLC separation. Concentrations of MOAH were calculated using biphenyl(BP)as internal standard. Nonylbenzene (9B) served as a control forcoelutions. Hexylbenzene (6B) enabled the detection of loss ofvolatile components. Adequate cuts of the fraction window wereverified by the standards eluted at the edges of the fraction: Chohad to be absent in the intermediate fraction and TBB and Perpresent in the MOAH. Per was also monitored by UV detection.After epoxidation, Per failed as a verification standard in GC,because it was partly lost. Peak areas of MOSH and MOAH were determined byintegration of the hump of unresolved components above amanually adjusted baseline. Usually the peaks on top of thehump were integrated and subtracted, unless there were mineraln-alkanes. Calibration with paraffin oil confirmed the validity ofthis approach for the MOSH, but due to the lack ofa standard, nosuch control was possible for the MOAH. Alternatively, theconcentrations were determined by the use of a paraffin oil asexternal standard, drawing triangles into the printed chromato-grams and using the internal standards for normalizing theabsolute areas, as shown in ref 44. The detection limit (LOD)and the quantification limit (LOQ)in oils were around 3 and 8 mg kg, respectively. The relative Figure 2. Removal of unsaturated components from a margarine bymeans of epoxidation at ambient temperature. Figure 3. Epoxidation with different amounts of peracid. More peracidbetter removes squalene and the sterenes, but also the loss of certainaromatics increases. standard deviations of the peak areas were below 15%, but themeasuring uncertainty was usually higher because of the uncer-tainty about the position of the baseline and possibly the uppercontour line of the hump against the natural components on topof the mineral hydrocarbons. Complete recovery of MOSH andMOAH from HPLC-GC-FID was ensured through the recoveryof the verification standards at the edges of the fraction. Method Overview. The method is summarized in Figure 1. Atthe bottom are the HPLC traces recorded by UV detection at230 nm: a blank and a motor oil (500 ug mL, 10pL injection).They primarily show the eluent composition at the column exitowing to a strong response to dichloromethane. Even though thegradient started at the injection (t=0), dichloromethane waseluted from the column only after 5 min. Less than half of thisdelay resulted from the void volume of the tubing, valves, and thecolumn; the main part was from dichloromethane being adsorbedto/retained by the silica gel. The fraction of the MOAH was elutedfrom within this profile to shortly afterward, as shown by the Per.Backflush with dichloromethane was not recorded.because theeluent left the system through the waste outlet in the backflushswitching valve. The strong response at 15 min shows thedischarge of the dichloromethane in normal flow directionthrough the UV detector and the reconditioning of the HPLCcolumn. The fraction of the MOSH is not visible in HPLC. The GC-FID chromatogram of the saturated hydrocarbons of a motor(lubricating) oil is shown at the top, the fraction of the aromaticsbelow it. Both show humps of unresolved components as they are Figure 4. Epoxidation in the presence of edible oil removed little Phe andChry, but 35% DBT. Without edible oil, the losses were significant for Pheand Chry and virtually complete for DBT. Reaction in the ice bath slightlyreduced the losses of MOAH and substantially increased removal ofolefins. Figure 5. Loss of MOAH by epoxidation in a crude oil distillate and twomotor (lubricating) oils of similar molecular mass distribution. Squares withdotted lines: DBT. typical for mineral oil products of this type (and frequentlyobserved in foods). The n-alkanes were removed in the refinery(deparaffination). The absence of signals in the fraction of thearomatics shows the high degree of alkylation and the resultingmany isomers. The two humps are almost exactly coeluted; thedifference in retention time is largely due to the temperatureprograms’starting at different levels.S. Removal of Olefins by Epoxidation. For some foods, olefinshindered the analysis of the MOAH. In some oils, particularlyolive oil, squalene is present at a concentration exceeding thedesirable detection limit for MOAH several thousand times. Afterraffination, part of the squalene is isomerized and forms a hump ofunresolved isomers, which is narrower than that of the MOAH butdisturbs the quantitative determination ofthe latter. Raffination ofedible oils also forms sterenes, dehydroxylation products of sterols,which are eluted from GC near the center of the most commonlyobserved MOAH. A humpof 、1unresolved carotenoids is elutedsomewhat later. There is no way to separate these polyenes fromthe MOAH by tuning HPLC selectivity, because the MOAH andthe olefins both comprise a rather wide range of polarities. By derivatization, the polarity of the olefins can be enhancedsuch that these components are eluted after the MOAH. Bromi-nation was used to remove olefins from the paraffins in a manual Figure 6. Effect of epoxidation for a margarine and a rapeseed oil: HPLC-GC-FID analysis without epoxidation (top chromatograms) as well as with 25 or100 mg of mCPBA for 300 mg of fat or oil. sample preparation approach (44). However, under conditionsbrominating the olefins, also a substantial part of the aromaticcompounds was affected. Epoxidation, proposed by Mariani (45),was found to be more selective. A single epoxy function increasesthe retention on silica gel beyond the fraction of MOAH. How-ever, careful optimization of the reaction conditions is required toavoid unacceptable reaction (loss) of aromatic constituents. The reaction rate of 3-chloroperbenzoic acid (mCPBA) withdouble bonds was found to decrease from squalene (with sixdouble bonds) to sterenes and fatty acids. Most MOAH tend toreact more slowly, but it could not be prevented that alsothiophenes and some polycyclic compounds were oxidized. Theperacid was added in excess with regard to the olefins, butstoichiometrically corresponding to only a minor fraction of thedouble bonds in the fatty acids in order to be consumed by thefatty acids before the bulk of the MOAH was attacked. Cleanedible oil was added to samples containing little or no fat. Figure 2 shows the rate by which critical components wereremoved from the MOAH fraction of a margarine primarilyconsisting of Ukrainian sunflower oil, which was found to becontaminated by a technical grade mineral oil (11). Chromato-grams will be shown in Figure 6. To 300 mg of this fat was added30 mg of mCPBA, corresponding to roughly 10% of the amountrequired for a complete epoxidation of the fatty acids. After5 min, 98% of the squalene and 83% of the carotenoids wereremoved. The hump of the MOAH was reduced by 21%.Prolonged reaction had no effect, suggesting that the peracidwas depleted in <5 min. Figure 3 focuses on the dependence of the removal of olefinsand losses ofMOAH on the amount of peracid added. Threehundred milligrams of refined sunflower oil was spiked with 10 mg kgeach of fluorene (Flu), phenanthrene (Phe), chrysene(Chry), dibenzothiophene (DBT), and 500 mg kgof a crudeheavy mineral oil fraction for manufacturing base oil. Thissample was treated with various amounts of peracid during15 min at room temperature (stopped by the addition of aqueouscarbonate). The increase from 25 to 50 mg of mCPBA reduced theresidual amount of squalene from 2.6 to 0.8% and that of thesterenes from 39 to 5.7%. With 100 mg of mCPBA, 0.6% of thesqualene and 1.3% of the sterenes were left. Flu, Phe, and Chrywere not significantly affected, but the loss of DBT (assumed tobe one of the most sensitive MOAH) increased from 34 to 61 and89%. With 200 mg of mCPBA, still less than that stoichiomet-rically required for a complete epoxidation of the fatty acids, theloss of DBT was almost complete. The MOAH of the crude oilwere reduced by 30, 38, and 42%(25, 50, and 100 mg of mCPBA,respectively). The slowed loss at increased amounts of mCPBAsuggests that sensitive MOAH constituents reacted readily(e.g., the thiophenes), whereas others were stable. As a conclu-sion, 100 mg of mCPBA removes the olefins clearly better than25 mg, but also the losses of MOAH are increased, that is, thelarger amount should only be used when really needed. The experiments reported in Figure 4 involved 300 mg ofrefined sunflower or olive oil spiked with 10 mg kg-each ofPhe, Chry, and DBT; 25 mg of mCPBA was added, and thereaction was stopped after 15 min. The reaction occurred either atambient temperature (with spontaneous warming to about 40℃)or in an ice bath during the first 5 min and allowed to warm toambient temperature afterward.The 100% scale refers to the oilswithout epoxidation. For Phe no loss was observed as long asoil was present. In the absence (dark right bar), the peak wasreduced by 11%. This was interpreted by the peracid being more Figure 8. Two edible oils contaminated with white paraffin oils: MOAH analyzed without prior enrichment and epoxidation; same attenuation for MOSHand MOAH. persistent. For Chry it seems that there was a loss of 5% in oliveoil (containing some 45% fewer double bonds than sunfloweroil). The loss without oil was increased to 44%.Oxidation of DBTwas around 35%, without a difference between the two oils. Theloss was slightly lower when the reaction occurred with cooling.Without oil, oxidation of DBT was virtually complete. Theseresults primarily show the effectiveness of unsaturated fatty acidsin buffering oxidation. Epoxidation of squalene was more selective at the lowertemperature: in sunflower oil, 96.1% was removed at ambienttemperature, but 99.6% was removed in the ice bath (98.1 and99.7%, respectively, in olive oil). In the instance of the sunflower oil,a substantial difference was also observed for the sterenes. Squaleneand the sterenes were absent in the samples without edible oil. Figure 5 compares the losses for three mineral oil products ofsimilar molecular mass distributions but differing contents of Figure 9. Contamination of a refined olive oil and an olive pomace oil with mineral oil containing about 20% MOAH. Figure 11. For samples containing little or no fat, low detection limits can be reached by reconcentrating the extracts. Rice 1 contained10mgkgMOSH and4.3 mg kg-MOAH and rice 2, 1.7 and 0.4 mg kg, respectively (no epoxidation). aromatic hydrocarbons. Epoxidation occurred at conditions cor-responding to those under Materials and Methods and used in theapplications shown below. The mineral oils were added to 300 mgof refined olive oil at 1000 mg kgtogether with 2mg kgDBTand Phe; 25 or 100 mg of mCPBA was added with initial cooling inthe ice bath. The crude heavy mineral oil distillate (left) contained 53%aromatics, of which 25 and 37% were lost with 25 and 100 mg ofmCPBA, respectively. The loss of DBT was high (34 and 90%,respectively), whereas no significant loss of Phe was detected (notshown). The Total motor oil contained 26% aromatics, and thelosses were lower (23 and 28%). The Shell lubricating oil for carscontained merely 11% aromatic hydrocarbons, and the losseswere still lower. The DBT losses were similar, showing thereproducibility of the reaction. These results suggest that thelosses depend on the composition of the MOAH. From therefined products, the MOAH arepartly extracted, particularlyreducing the polyaromatic and sulfur-containing compounds,which are sensitive to oxidation. The efficacy of epoxidation is illustrated for the margarineshown in Figure 2 and a refined rapeseed oil. The margarinecontained 340 mg kg-MOSH (not shown). The top chromato-gram in Figure 6 shows the fraction of MOAH without epoxida-tion. There is a large peak for squalene, probably on a hump ofisomerized squalene. It is followed by sterenes and a humprepresenting carotenoids. The smaller amount (25 mg) of mCPBAwas sufficient for a virtually complete removal of these olefins.The use of 100 mg ofmCPBA slightly improved the removal of thecarotenoids but also increased the losses of MOAH (sameattenuation in all three chromatograms). The MOAH in thebottom chromatogram amounted to 100 mg kg . In the topchromatogram they would be estimated as 130 mg kg; that is,the loss corresponded to 23%. The MOAH chromatogram of theuntreated rapeseed oil was severely disturbed. With 25 mg ofmCPBA it was improved, but some interference primarily bysterenes remained. The bottom chromatogram clearly revealed15 mgkg-MOAH. Sample Enrichment. Online HPLC-GC-FID of edible oils andfats provided a limit of quantification for MOAH of around8 mg kg, depending on the composition of the MOAH andinterferences. This may not be satisfactory. Because the sensitivityof the detection cannot be improved, more sample must beinjected, which presupposes a correspondingly larger bed of silica gel to provide the capacity for retaining the triglycerides. As thefraction volume would rapidly become too large for onlinetransfer to GC, an off-line enrichment with a conventional silicagel column was devised, analogous to the method for theMOSH (15). The elution of the MOAH from silica gel requires a modifier inhexane. Because a maximum amount of oil or fatty food extractshould be loaded onto the smallest possible bed, this modifiermust be selected so that it does not strongly reduce the capacity ofthe silica gel for retaining fat. A small percentage of MTBE wasshown to reduce this capacity by as much as a factor of 10, whereasa larger addition of dichloromethane (e.g., 20%) to achieve thesame eluent strength reduces it by hardly a factor of 2 (41). Using 12 g of silica gel and 20% dichloromethane/hexane,safely 1 g of fat or oil could be retained. The fraction was collectedinto a round flask containing 40 mg of clean edible oil acting as akeeper to prevent evaporation of volatiles in the subsequentsolvent evaporation. This oil also buffered the epoxidation whenneeded and was removed again by the HPLC of the final analysis.The reconcentration to a final 200 uL,of which90 uL was injectedinto HPLC-GC-FID, resulted in enrichment by a factor of 50. Enrichment also increases the concentration of the interfer-ences and renders epoxidation even more important. It wasperformed after enrichment, because this reduced the amountof mCPBA needed, the impurities of which are also enriched. Figure 7 illustrates the efficiency of this tool. The top chroma-tograms show the MOSH in a contaminated safflower and arapeseed oil from the market. The center chromatograms showthattdirectHPLC-GC-FID analyses ofMOAHH(afterepoxidation) were insufficient for a quantitative determination.After enrichment, 5.5 and 2.5 mg kgMOAH formed largehumps and the detection limit was below 1 mg kg . Theinterferences eluted at close to 350 °C consisted of saturated(not epoxidizeable) wax esters. Illustrative Application to Food Samples. The left chromato-grams in Figure 8 are from argan oil contaminated with 220 mgkg-1MOSH. The analysis of the MOAH was achieved without epoxida-tion. Squalene seriously overloaded the GC (see internal standards,particularly 9B), but the chromatogram enabled the presence of>5 mg kgMOAH to be ruled out, which suggests the at leastpredominant presence of white paraffin oil. The poppy seed oil atthe right contained 28 mg kgMOSH. Again, no MOAH weredetectable at a detection limit of about 3 mgkg. Biedermann and Grob Figure 12. Chocolate and mung beans containing mineral oils of technical quality (concentrations given in the chromatograms) and rusk with a highconcentration of a white paraffin oil used as release agent. Figure 9 shows results for a refined olive oil (left chromatograms)contaminated with 21 mgkgMOSH and an olive pomace (sansa)oil with 320 mg kg-MOSH (determined by preseparation withaluminum oxide to remove the plant n-alkanes (27)). Epoxidationwas a prerequisite (center chromatograms), and for the refined oilalso enrichment was needed. The 4 mg kgMOAH found after aloss of perhaps 25% during epoxidation suggests that the mineraloil contained about 20% aromatics, which is in the range typical fortechnical oils. For the pomace oil, no enrichment was needed.Assuming 25% loss during epoxidation, the mineral oil contami-nant again contained 20% aromatics. Also in the two refined cotton seed oils analyzed and shown inFigure 10, containing 65 and 275mgkg-MOSH,MOAH could notbe analyzed without epoxidation (center chromatograms). Thesamples were not enriched: the 10 mg kgMOAH in oil1 could still be measured. Oil 2 seems to contain two mineral oilproducts: one with a molecular mass distribution frequently observedfor technical oils (similar to that in cotton seed oil 1), the other withan extremely high molecular mass (centered C45 and not completelyeluted from GC at 350C). Both contained MOAH at about 18%. For samples containing little or no fat,lower detection limitscan be reached by reconcentrating the extract. Figure 11 showsthis for two samples of Basmati rice. Rice 1 seems to becontaminated by three mineral oil products. The paraffinscentered on n-C22 could be from jute bags with mineral batchingoil. This mineral oil contained about 35% aromatics. The productwith the paraffins centered on n-C38 contained 15% aromatics,whereas none were detected for that with paraffins centered onn-C13. The sum of the MOSH amounted to 10 mg kgand thatof the MOAH to 4.3 mg kg . Rice 2 contained 0.9 mg kgof amineral oil product centered at n-C13 with no detectable MOAHand 0.8 mg kgof a product centered on n-Ci8 with 35%aromatics, possibly again from jute bags. In samples such as rice,the detection limit for MOAH is around0.1 mgkg . The chohmgkg ofamicolate in Figure 12 contained 30 mg kgraloil centeredat n-C16 with 20%MOAH and a smaller amount of ahigher molecular mass mineral oil (no epoxidation). The mung beans contained 22 mg kgof a mineral oil with a rather unusualmass distribution. The sample was epoxidized to remove thesqualene eluted at the top of the MOAH hump. The MOSH andMOAH profiles well correspond; the MOAH amounted to 35%.The rusk contained 910 mg kgof a paraffin oil used as releaseagent in the bakery with <0.2% aromatics (no epoxidation). Conclusions. A method was developed for determining the sumof the MOAH in foods ranging from highly alkylated benzenes tocomponents with at least five rings. Auxiliary tools were neededfor some of the samples: enrichment by the removal of lipids tcreach a detection limit of around 1 mg kgand the removal ofolefins of plant origin with the help of epoxidation. Epoxidationshould only be applied when needed, because it causes the loss ofroughly 25% MOAH, primarily affecting the thiophenes. Thismethod was investigated in detail and the performance of thecritical steps brought under control by verification tools. Proof of the mineral origin of the aromatic hydrocarbons isprimarily indirect: the correspondence of the molecular massdistribution with that of the MOSH for which the mineral originwas demonstrated. For this reason, MOSH and MOAH shouldbe analyzed in parallel. Presently, a limit of quantitation at 1 mg kgseems to besatisfactory, but a toxicological evaluation is needed to determinethe concentration (exposure) below which MOAH are no longerof relevant concern. For polycyclic aromatic hydrocarbons, >100times lower legal limits are enforced. If the MOAH contained just1% carcinogenic material, 1 mg kg-would be of concern. LITERATURE CITED (1) Grob, K.; Lanfranchi,M.;Egli, J.; Artho, A. Determination of foodcontamination by mineral oil from jute sacks using coupled LC-GC.J. AOAC Int. 1991, 74, 506-512. (2) Grob, K.; Artho, A.; Biedermann, M.; Caramaschi, A.; Mikle, H.Batching oils on sisal bags used for packaging foods: analysis bycoupled LC-GC. J. AOAC Int. 1992,75,283-287. (3) Castle, L. Migration of mineral hydrocarbons into foods: 1. Poly.styrene containers for hot and cold beverages. Food Addit. Contam.1991,8,693-700. ( (4) Grob, K.; Biedermann, M .; A rtho, A.; Egli, J . Food contaminationby hydrocarbons from packaging materials determined by coupled LC-GC. Z. Lebensm. Unters. Forsch. 1991,193,213-219. ) (5) Jickells, S. M.; Nichol, J.; Castle, L. Migration of mineral hydro-carbons into foods: 5. Miscellaneous applications of mineral hydro-carbons in food contact materials. Food Addit. Contam.1994. 11,333-341. (6) Droz, C.; Grob, K. Determination of food contamination by mineraloil material from printed cardboard using on-line coupled LC-GC-FinID. Z. Lebensm. Unters. Forsch. 1997, 205,239-241. (7) Grob, K.; Huber, M.; Boderius, U.; Bronz, M. Mineral oil materialin canned foods. Food Addit. Contam. 1997,14,83-88. (8) Grob, K.; Artho, A.; Biedermann, M.;Egli, J. Food contaminationby hydrocarbons from lubricating oils and release agents: determi-nation by coupled LC-GC. Food Addit. Contam. 1991,8, 437-446. (9) Grob, K.; Biedermann,M.; Bronz, M. Resultate einer Kontrolle vonSpeiseolen: Falschungen durch Zumischungen, Verunreinigungen.Mitt. Gebiete Lebensm. Hyg. 1994, 85, 351-365. (10) Grob, K.; Vass, M.; Biedermann, M.; Neukom, H. P. Contamina-tion of animal feed and food from animal origin with mineral oilhydrocarbons. Food Addit. Contam. 2001, 18, 1-10. (11) Biedermann,M.; Grob, K. How “white" was the mineral oil in thecontaminated Ukrainian sunflower oils? Eur. J. Lipid Sci. Technol.2009, 111,313-319. (12) Neukom, H. P.; Grob, K.; Biedermann, M.; Noti, A. Food con-tamination by C20-C50 mineral paraffins from the atmosphere.Atmos. Environ. 2002,36,4839-4847. (13) Brandenberger, S.; Mohr, M.; Grob, K.; Neukom, H. P. Contribu-tion of unburned lubricating oil and diesel fuel to particulateemission from passenger cars. Atmos. Environ. 2005, 39,6985-6994. (14) Fiorini,D.;Fiselier, K.; Biedermann, M.;Ballini, R.; Coni, E.; Grob,K. Contamination of grape seed oil with mineral oil paraffins.J. Agric. Food Chem. 2008, 58, 11245-11250. (15) Fiselier, K.; Grob, K. Mineral oil paraffins in foods: lowereddetection limit; contamination of sunflower seeds and oils. Eur.Food Res. Technol. 2008, 110, 979-981. (16) Wagner, Ch.; Neukom, H. P.; Grob, K.; Moret, S.; Populin, T.;Conte, L. S. Mineral paraffins in vegetable oils and refinery by-products for animal feeds. Mitt. Lebensm. Hyg. 2001, 92, 499-514. (17) Populin, T.; Biedermann, M.; Grob, K.; Moret, S.; Conte, L.Relative hopane content confirming the mineral origin of hydro-carbons contaminating foods and human milk. Food Addit. Contam.2004,21,893-904. (18) JECFA, Summary of evaluations performed by the Joint FAO/WHO Expert Committee on Food Additives. April 25, 2003. http://www.inchem.org/documents/jecfa/jeceval/jec_1655.htm (19) Heimbach, J. T.; Bodor, A. R.;Douglass,J. S.;Barraj, L. M.;Cohen,S. C.; Biles, R. W.; Faust, H. R. Dietary exposures to mineralhydrocarbons from food-use applications in the United States. FoodChem. Toxicol. 2002,40,555-571. (20) Tennant, D. R. The usage, occurrence and dietary intakes of whitemineral oils and waxes in Europe. Food Chem. Toxicol. 2004, 42,481-492. (21) Concin, N.; Hofstetter, G.; Plattner, B.; Tomovski, C.; Fiselier, K.;Gerritzen, K.; Fessler, S.; Windbichler, G.; Zeimet, A.; Ulmer, H.;Siegl, H.; Rieger, K.; Concin, H.; Grob, K. Mineral oil paraffins inhuman body fat and milk. Food Chem. Toxicol.2008, 46, 544-552. (22) Simanzhenkov,V.;Idem, R. Crude Oil Chemistry; Dekker: New York,2003. (23) Moret, S.; Conte, L. Polycyclic aromatic hydrocarbons in edible fatsand oils: occurrence and analytical methods. J. Chromatogr., A 2000,882,245-253. (24) Grob, K.; Biedermann, M.; Caramaschi, A.; Pacciarelli, B. LC-GCanalysis of the aromatics in a mineral oil: batching oil for jute bags.J. High Resolut. Chromatogr. 1991, 14, 33-39. (25) Grob, K. On-line Coupled LC-GC; Huthig: Heidelberg, Germany,1991; ISBN 3-7785-1872-0. (26) Grob, K. Efficiency through combining HPLC and HRGC: progress1995-1999.J. Chromatogr.,A2000,892,407-420. (27) Fiselier, K.; Fiorini, D.; Grob, K. Activated aluminum oxideselectively retaining long chain n-alkanes. Part II, integration into an on-line HPLC-LC-GC-FID method to remove plant paraffins forthe determination of mineral paraffins in foods and environmentalsamples. Anal. Chim. Acta 2009, 634, 102-109. (28) Zeigler, Ch.; MacNamara,K.; Wang,Z.;Robbat, A. Total alkylatedPAH characterization and quantitative comparison of selected ionmonitoring versus full scan GC/MS based on spectra deconvolution.J.Chromatogr., A 2008, 1205,109-116. (29) Moret, S.; Grob, K.; Conte, L. S. On-line HPLC (LC)-solventevaporation (SE)-LC-capillary GC-FID for the analysis of mineraloil polyaromatic hydrocarbons in fatty foods. J. Chromatogr. 1996,750,361-368. (30) Moret,S.; Grob, K.; Conte, L. S. Mineral oil polyaromatic hydro-carbons in foods, e.g. from jute bags, by on-line LC-solventevaporation (SE)-LC-GC-FID. Z. Lebensm. Unters. Forsch. 1997,204,241-246. (31) Biedermann, M.; Grob, K. Comprehensive two-dimensional GCafter HPLC preseparation for the characterization of aromatichydrocarbons of mineral oil origin in contaminated sunflower oil.J. Sep. Sci. 2009, in press. (32) Biedermann,M.; Grob, K. The Y-piece interface for on-line coupledHPLC-GC. J. Chromatogr., A 2009, in press. (33) Beens, J.; Blomberg, J.; Schoenmakers, P. J. Proper tuning ofcomprehensive two-dimensional gas chromatography (GCxGC) tooptimize the separation of complex oil fractions. J. High Resolut.Chromatogr. 2000, 23, 182-188. (34) Blomberg, J.; Schoenmakers, P. J.; Brinkman, U. A. Th. Gaschromatographic methods for oil analysis. J. Chromatogr., A 2002,972,137-173. (35) Frysinger,G. S.; Gaines, R. B.; Xu, L.; Reddy, C. M. Resolving theunresolved complex mixture in petroleum-contaminated sediments.Environ. Sci. Technol.2003,37,1653-1662. (36) Adam, F.; Bertoncini, F; Thiebaut, D.; Esnault, S.; Espinat, D.;Hennion, M. C. Towards comprehensive hydrocarbons analysis ofmiddle distillates by LC-GCxGC. J. Chromatogr. Sci. 2007,45,643-649. (37) Seeley,S. K.; Bandurski, S. V.; Brown,R. G.; McCurry,J.D.;Seeley,J.V. A comprehensive two-dimensional gas chromatography meth-od for analyzing extractable petroleum hydrocarbons in water andsoil. J. Chromatogr. Sci. 2007,45,657-663. (38) Ventura, G. T.; Kenig, F.;Reddy, C. M.; Frysinger, G. S.; Nelson,R.K.; Van Mooy, B.; Gaines, R. B. Analysis of unresolved complexmixtures of hydrocarbons extracted from late Archean sediments bycomprehensive two-dimensional gas chromatography (GCxGC).Org. Geochem. 2008,39, 846-867. (39) Edam, R.; Blomberg, J; Janssen, H. G.; Schoenmakers, P. J.Comprehensive multi-dimensional chromatographic studies on theseparation of saturated hydrocarbon ring structures in petrochem-ical samples. J. Chromatogr., A 2005,1086,12-20. (40) Vendeuvre, C.; Bertoncini, F.; Espinat, D.; Thiebaut, D.;Hennion,M. C. Multidimensional gas chromatography for the detailedPIONA analysis of heavy naphtha: hyphenation of an olefin trapto comprehensive two-dimensional gas chromatography. J. Chro-matogr., A2005,1090,116-125. (41) Grob,K.;Kalin, I.; Artho, A. Coupled LC-GC: capacity of silica gel(HP)LC columns for retaining fat. J. High Resolut. Chromatogr.1991,14,373-376. (42) Rohwer, E. R.; Chen, G.-C.; Hassett, A. J. Preparation and storageof ultra high purity hexane for solvent effect gas chromatographicanalysis. J. High Resolut. Chromatogr. 1993, 16, 561-564. (43) Boselli, E.; Grob, K.; Lercker, G. Capacity of uncoated 0.53 mmi.d.pre-columns for retaining sample liquid in presence of a solventvapor exit. J. High Resolut. Chromatogr. 1999, 22, 149-152. (44) Wagner, Ch.;Neukom, H.-P.; Galetti,V.; Grob, K. Determinationof mineral paraffins in feeds and foodstuffs by bromination andpreseparation on aluminum oxide: method and results of a ring test.Mitt. Lebensm. Hyg. 2001,92,231-249. (45) Mariani, C. Stazione Sperimentale per le Industrie degli Oli e Grassi,2009 (private communication). ( R eceived March 13, 20 0 9. Revised manuscript rece i ved July 31, 2009.Accepted A ugust 3, 2009. ) LC-GC 系统联用的技术优势,为我们提供了简单的样品制备和富集手段,同时可以获得最佳的灵敏度和分辨率。LC-GC技术通常对样品中的化合物基团使用正 相液相色谱法(NPLC)进行选择性的分离,之后通过大体积进样的方式将目标物转移至GC进行后续分离检测。LC-GC联用技术已经在食品、香精香料、石油化工和工业样品、环境、药物以及生物样品等领域得到了成功的应用。多年来,科学家们使用LC- GC系统建立了许多有效的应用方法,著名的应用包括:食品中的矿物油和多环芳烃(Mineral oils, PAHs in Foods),质量评估橄榄油中的甲基酯、乙基酯和蜡酯(Methyl, ethyl and wax esters in olive oils),生物柴油中间馏分物中的脂肪酸甲酯(FAMES in middle distillates of Biodiesel blends)等。其中最值得一提的是由著名的瑞士苏黎世食品监督局的首席化学家Koni Grob博士使用LC-GC 系统开发的分离检测食品矿物油中的饱和烷烃(MOSH)和芳香烃(MOAH)的方法。该方法使用正相LC分离MOSH和MOAH组分,通过大体积 进样的方式将感兴趣的组分转移至GC进行进一步的分离检测,这为我们检测对人体有害的食品矿物油来源(包装材料、机器润滑油、灰尘吸附物、脱模剂、黄麻纤 维、受污染的动物饲料等)提供了快速有效的手段。
确定

还剩9页未读,是否继续阅读?
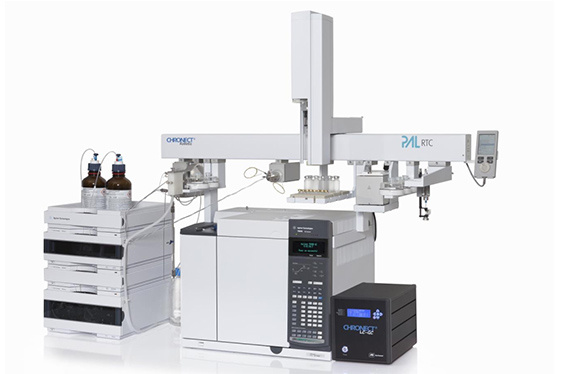
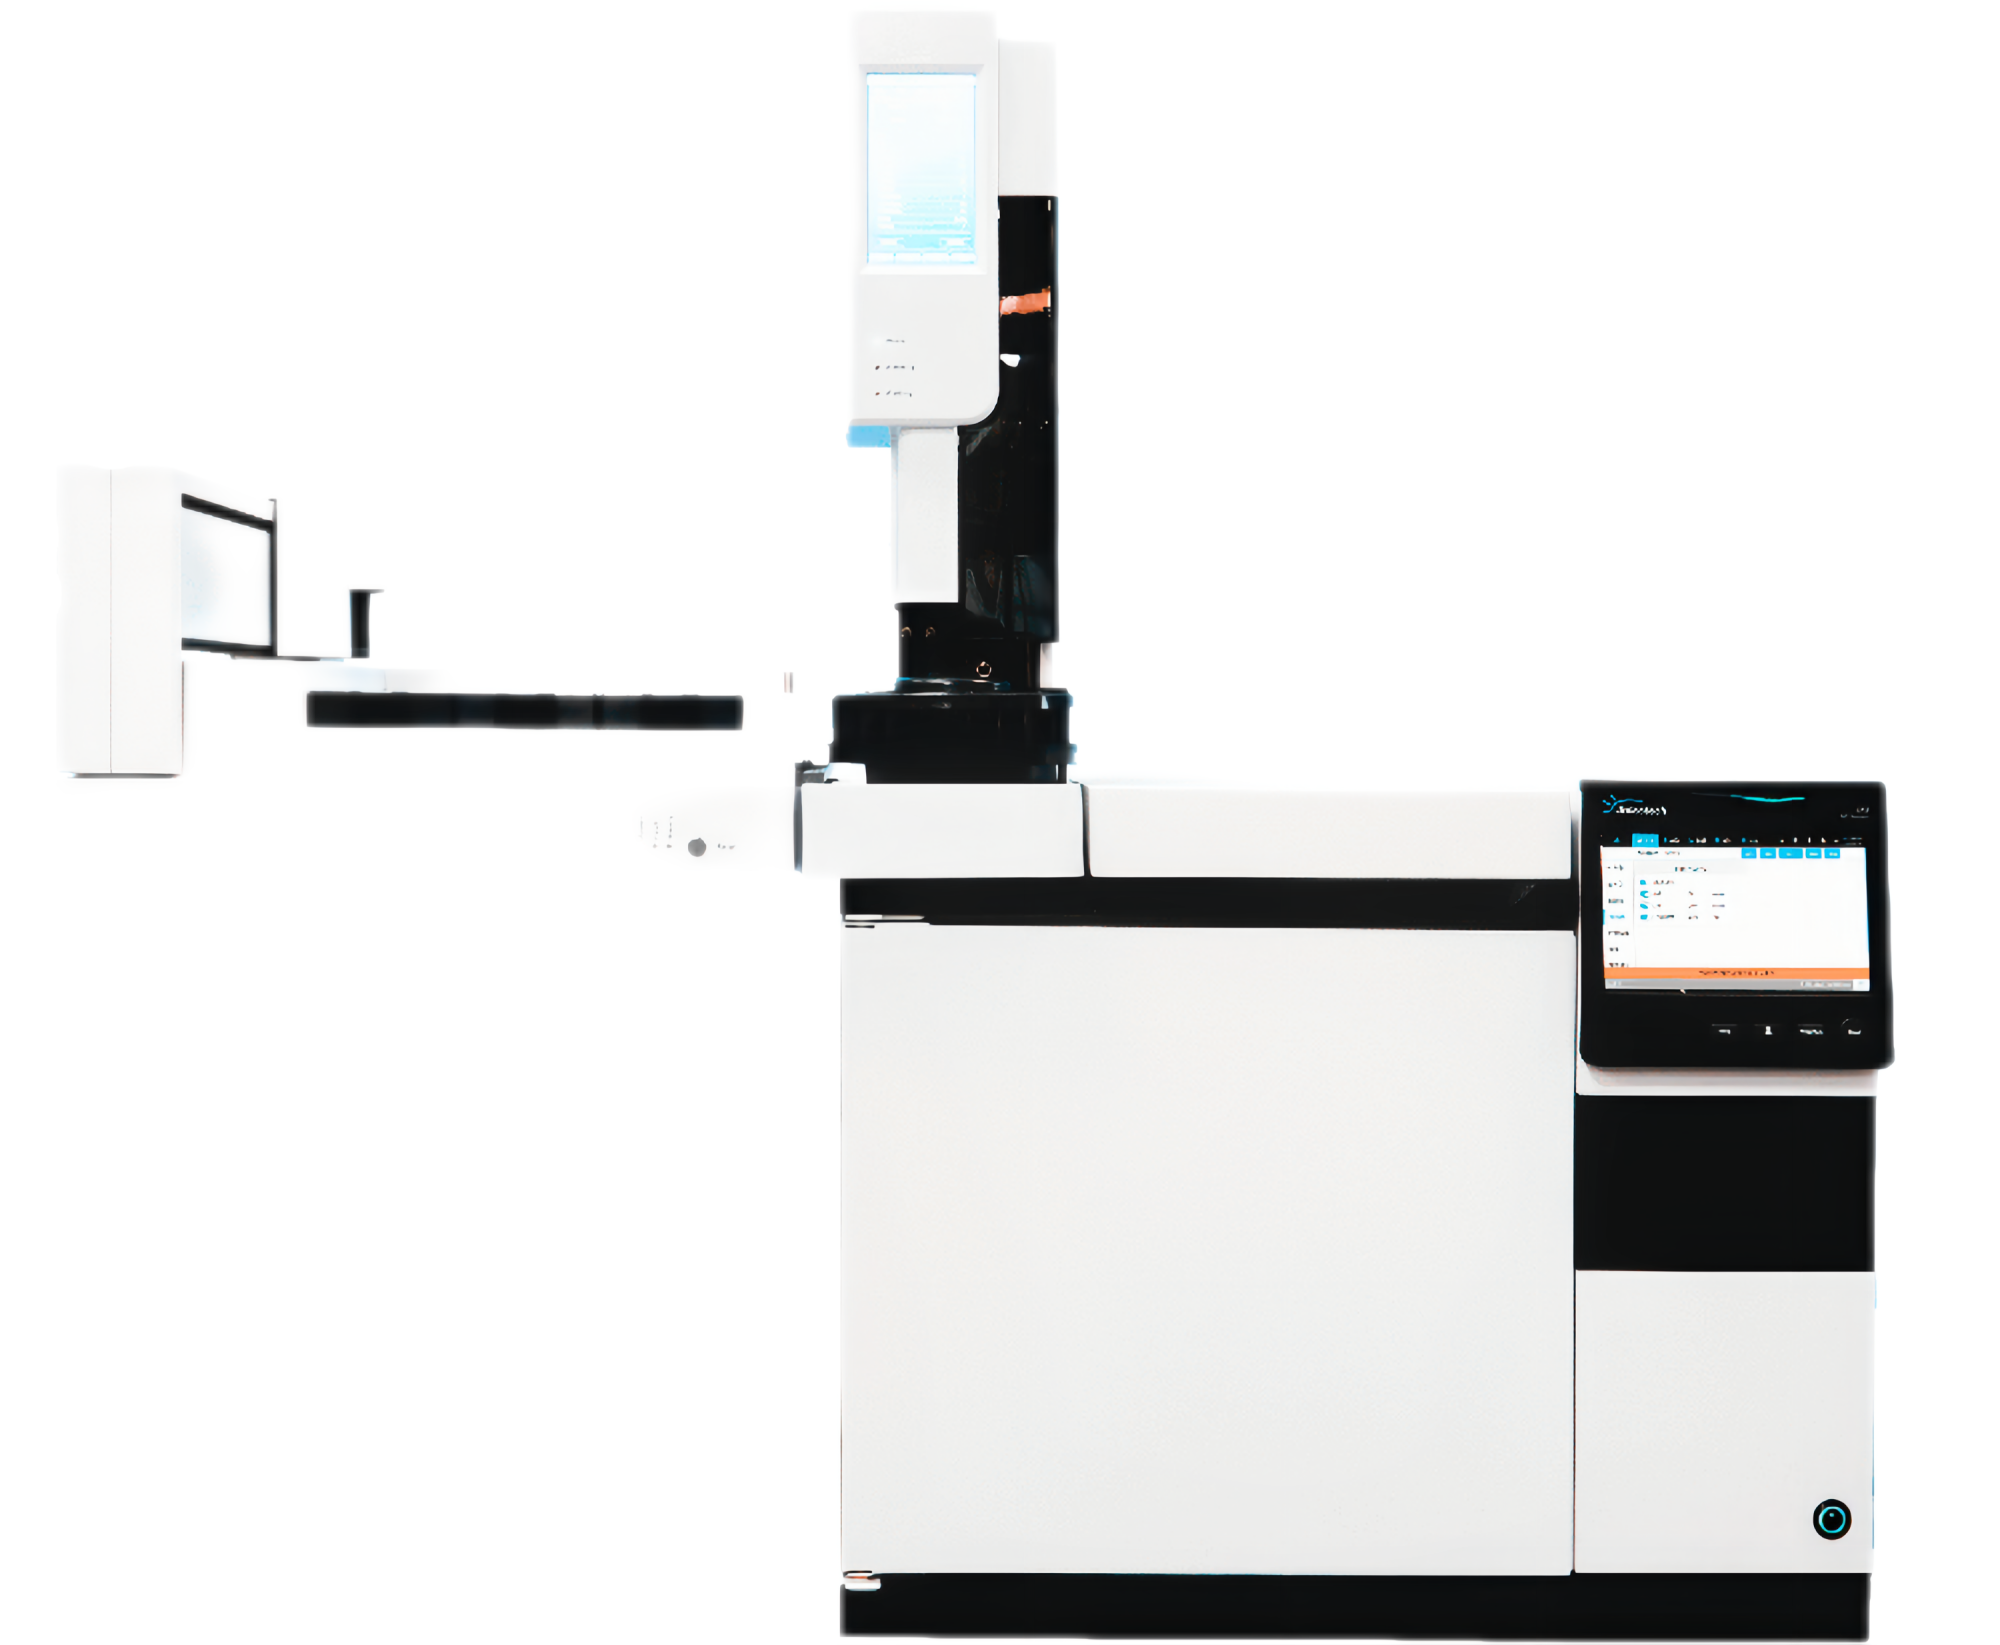
仪真分析仪器有限公司为您提供《食用油、油脂中甲基酯、乙基酯和蜡酯等环境污染物检测方案(气相色谱仪)》,该方案主要用于食用植物油中环境污染物检测,参考标准--,《食用油、油脂中甲基酯、乙基酯和蜡酯等环境污染物检测方案(气相色谱仪)》用到的仪器有食品中矿物油分析 LC-GC二维色谱联用系统 Axel Semrau
推荐专场
相关方案
更多
该厂商其他方案
更多

