


方案详情
文
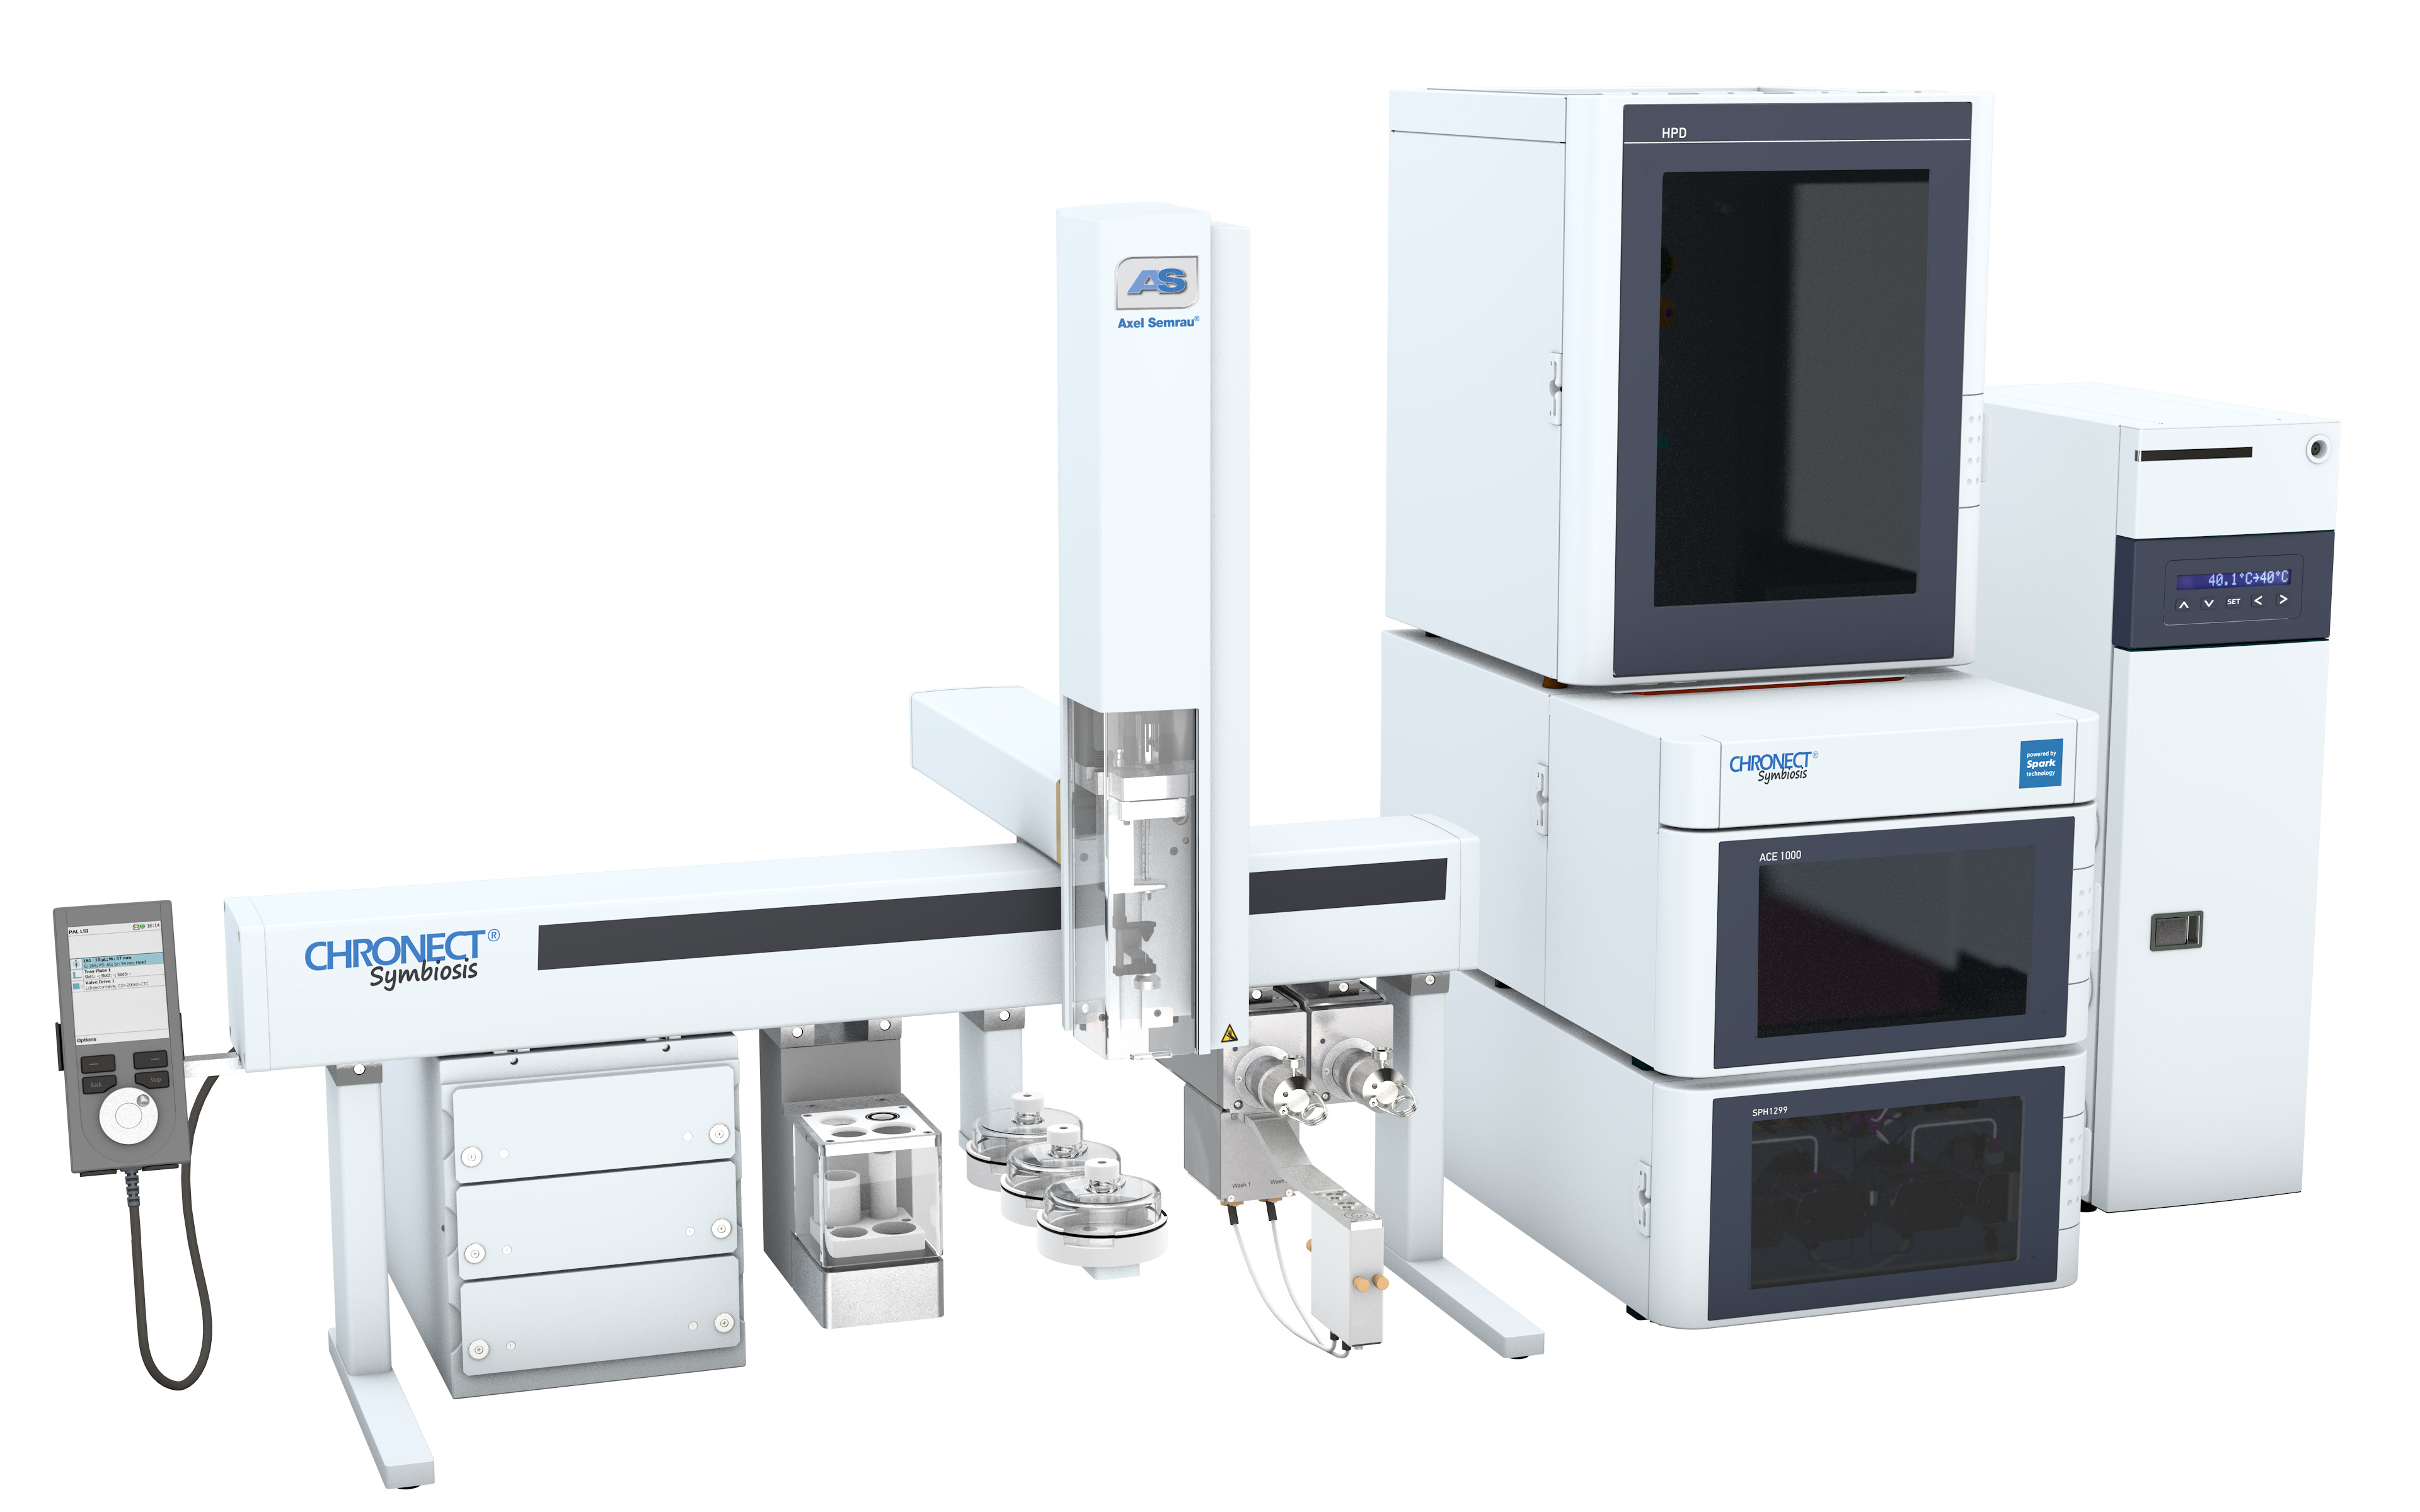
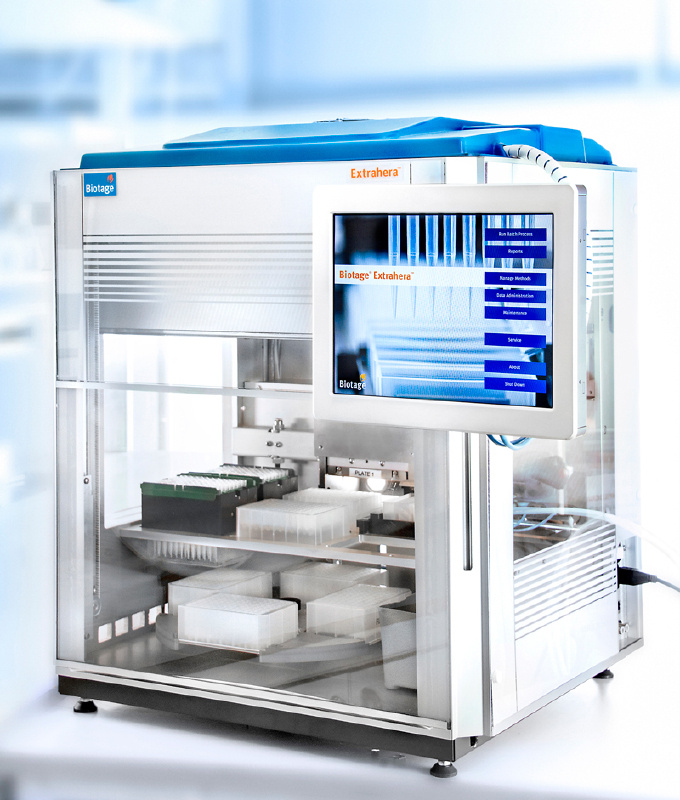
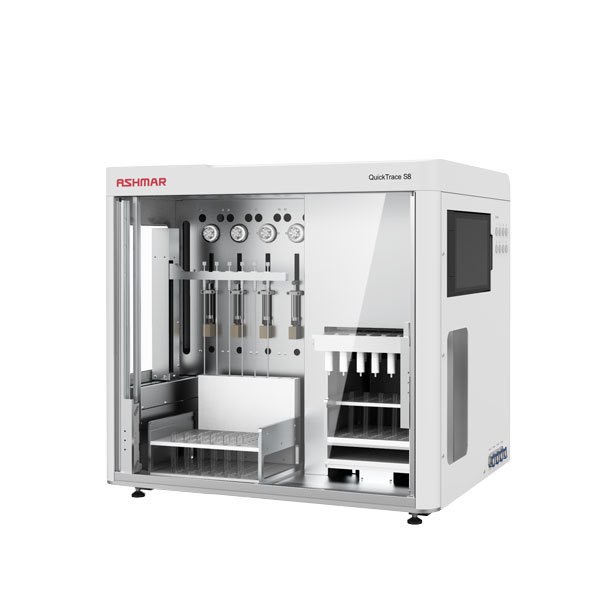
由荷兰Spark Holland公司生产的系列仪器“全自动在线固相萃取-液相色谱联用系统”为食品检测行业的用户带来了一种全新的样品前处理技术。该仪器与传统意义的离线手动固相萃取以及目前流行的全自动固相萃取仪器相比,具有颠覆性的创新技术含量,目前已在全球拥有超过1500家的实验室用户。自2009年进入中国市场以来,产品销量成大幅上升趋势,目前已有包括各级国家食品检验检疫机构,临床药代实验室,省级公安毒理实验室,烟草集团理化实验室,环境监测站以及中科院研究院所等超过三十家用户使用该设备进行各种检测项目和方法开发并获得了广泛的好评。
方案详情

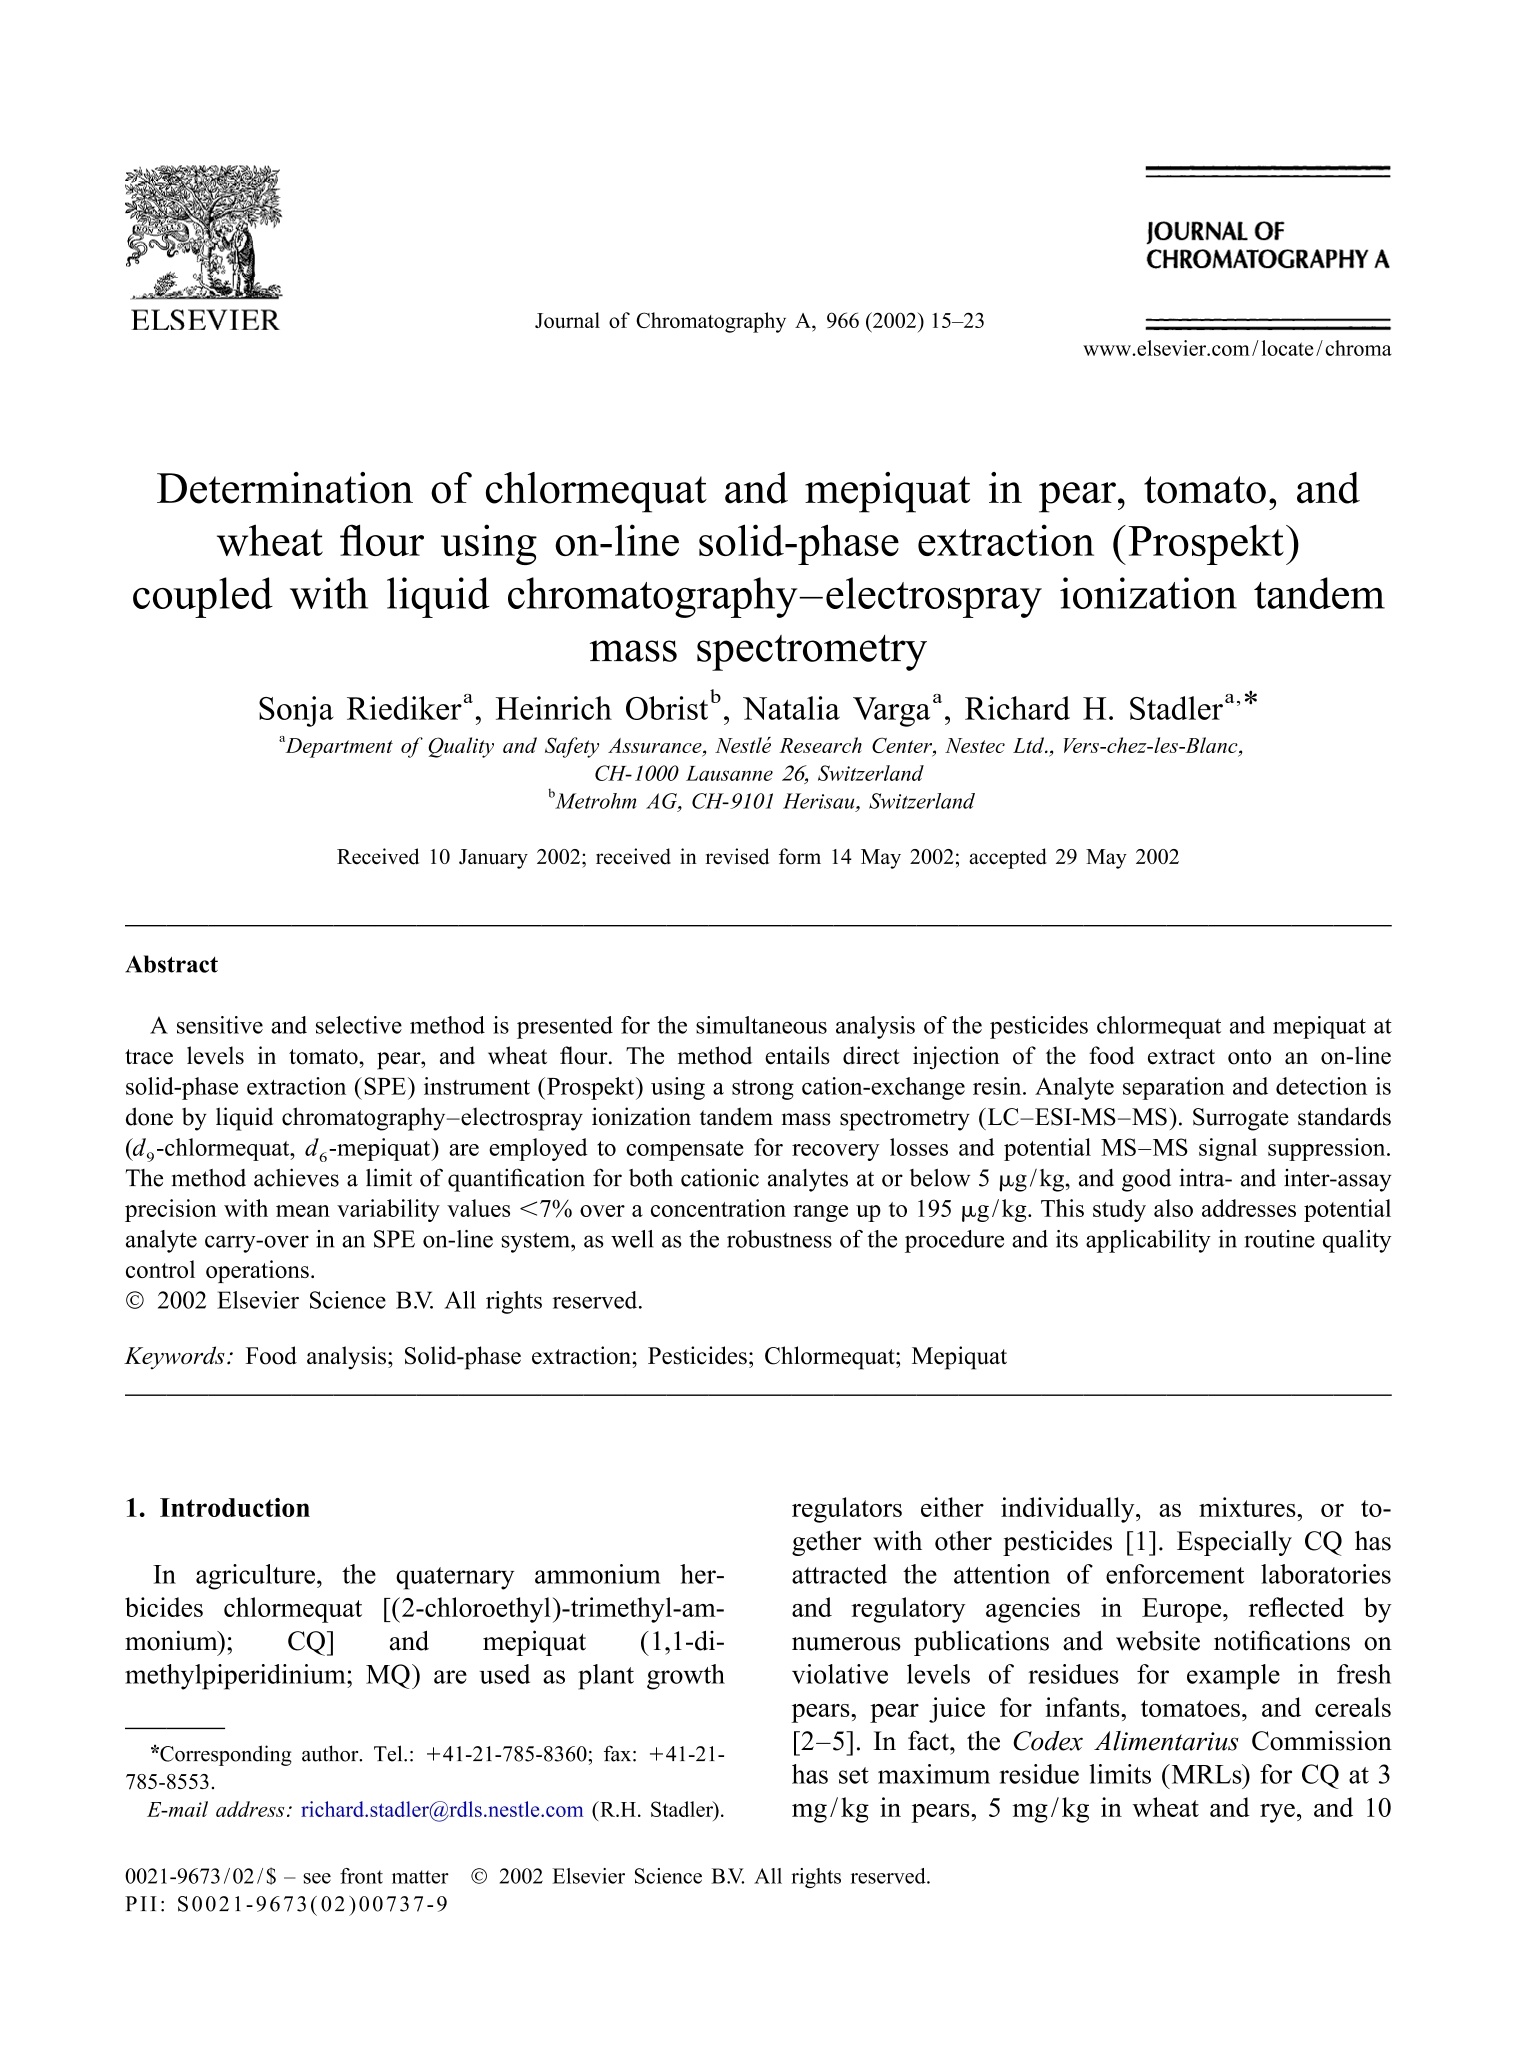
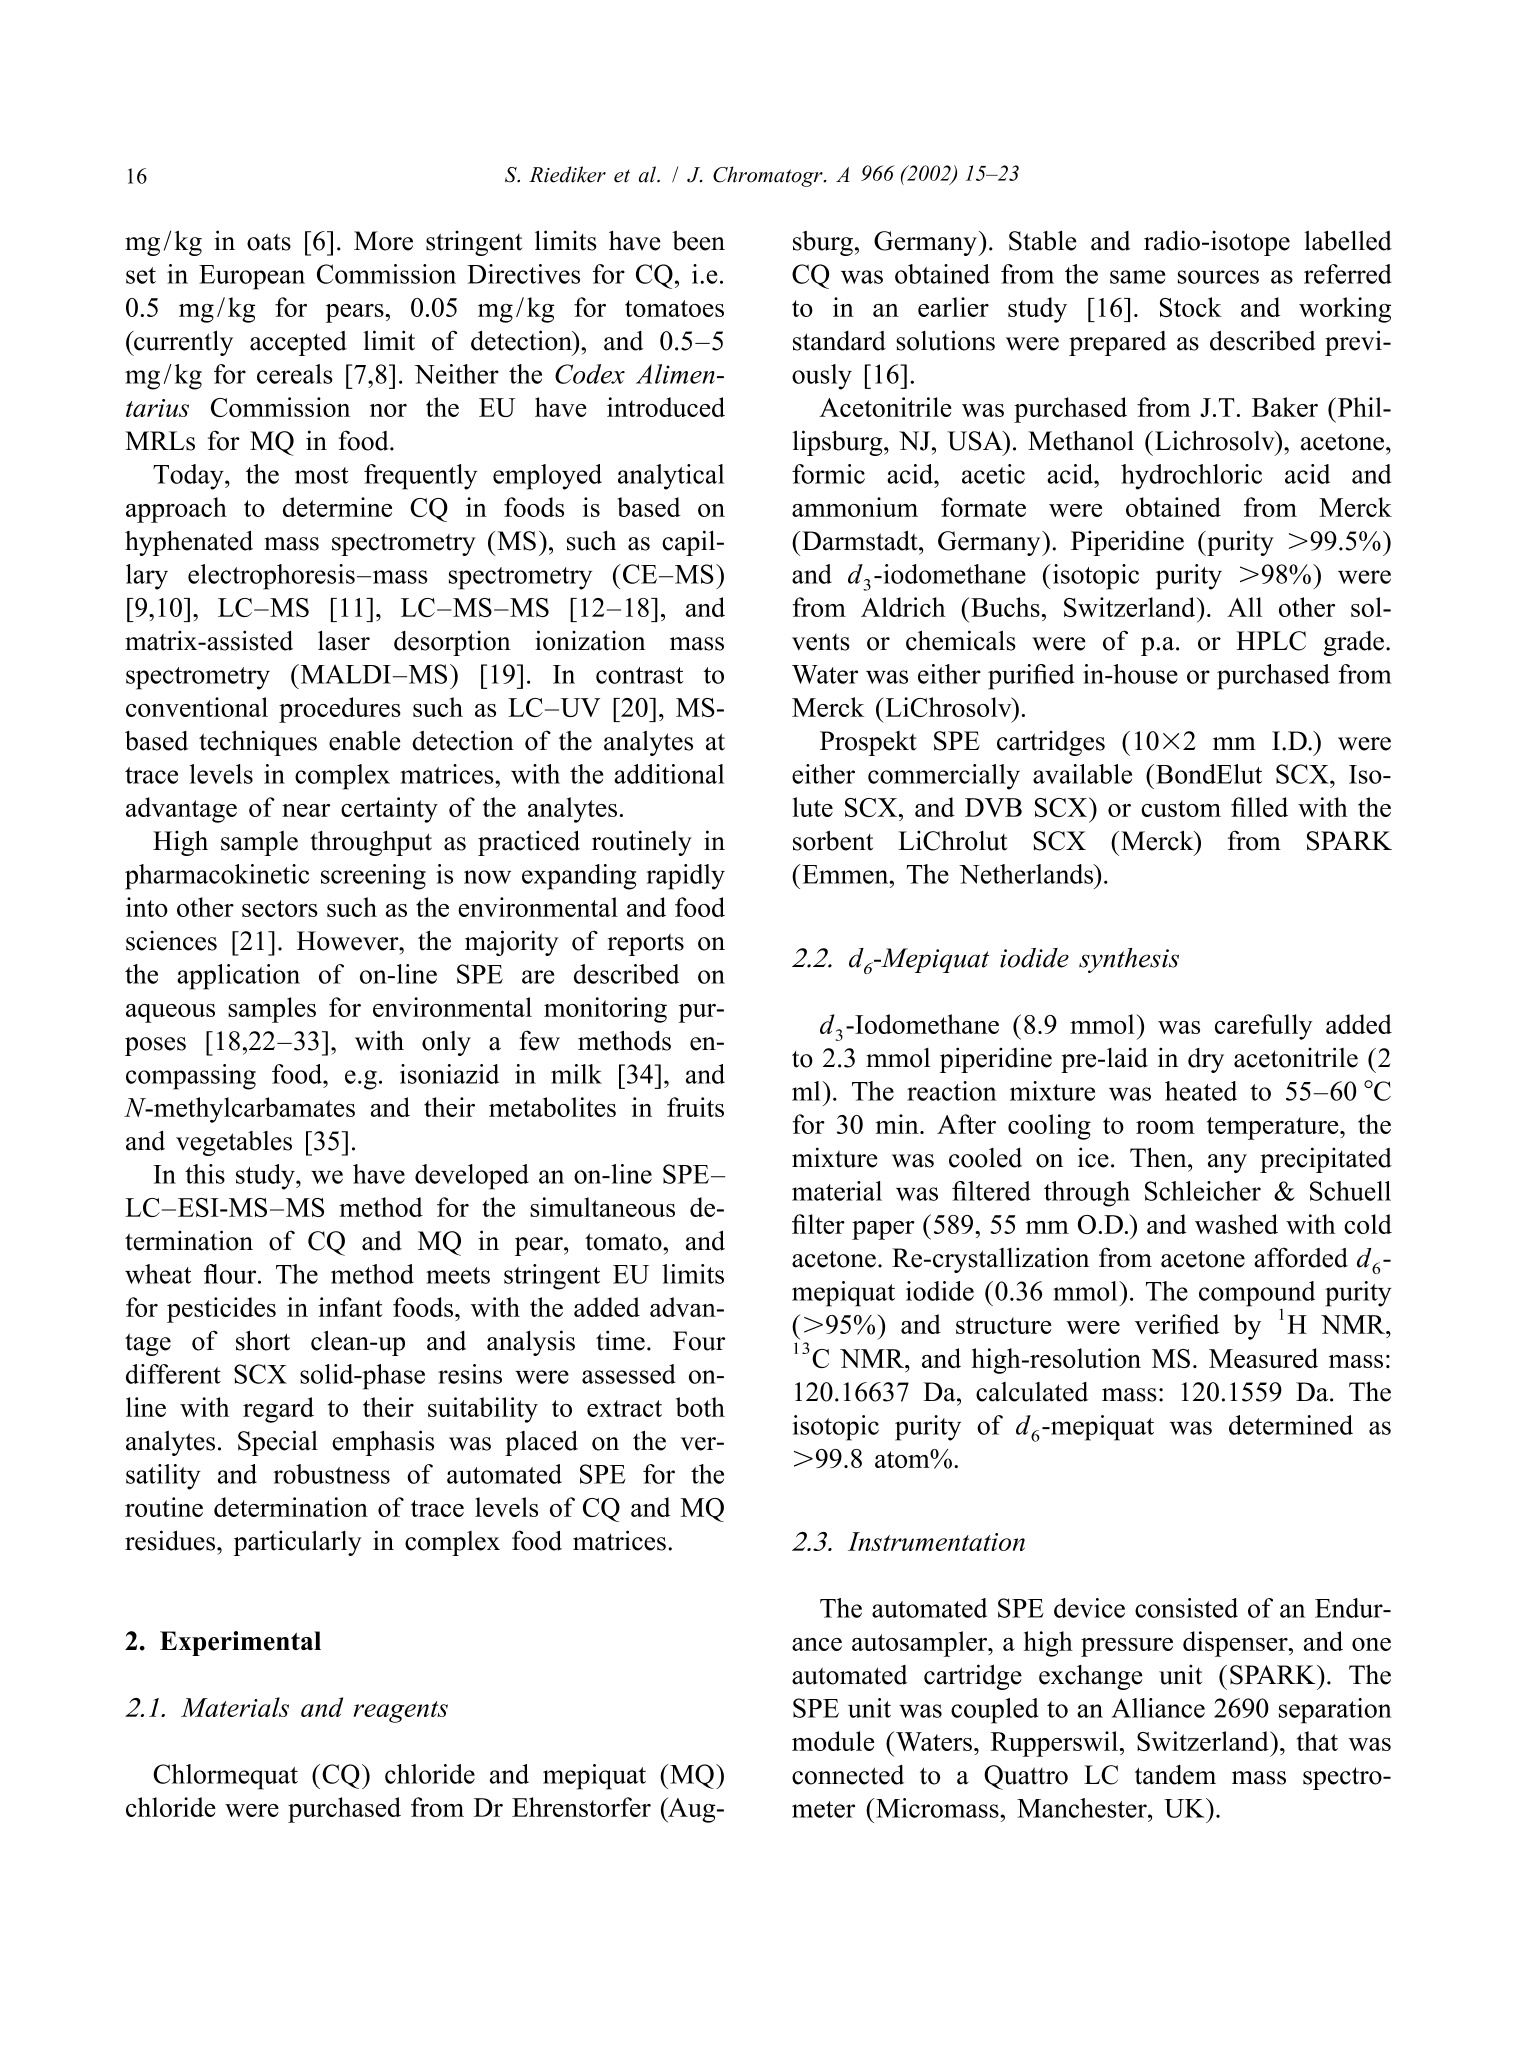
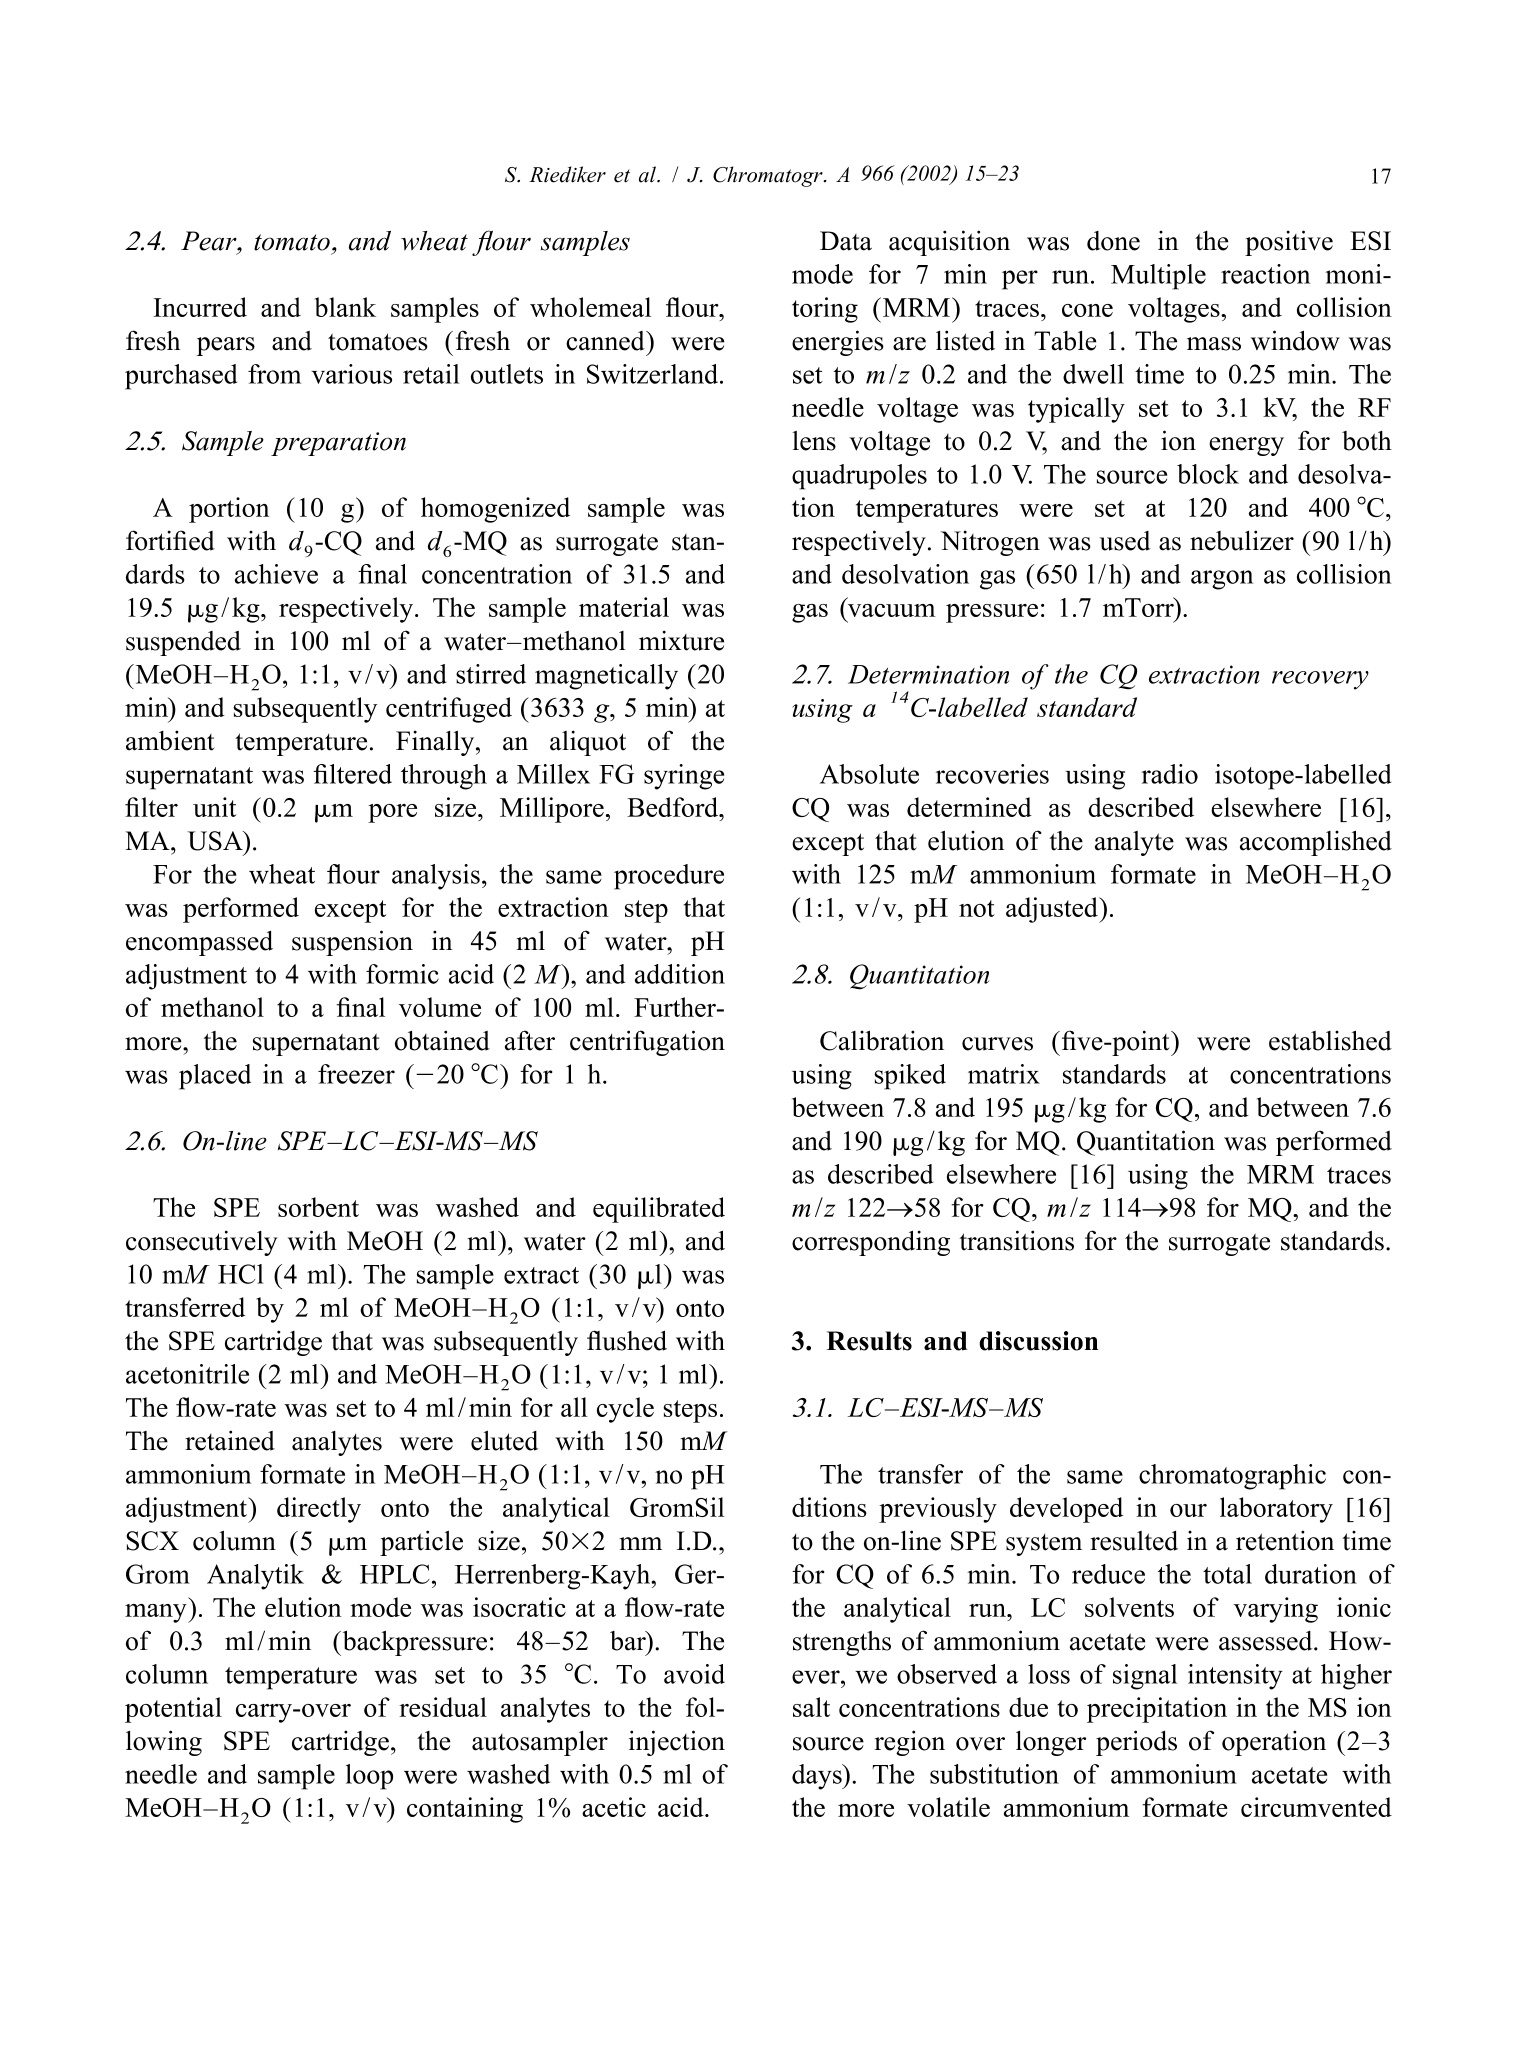
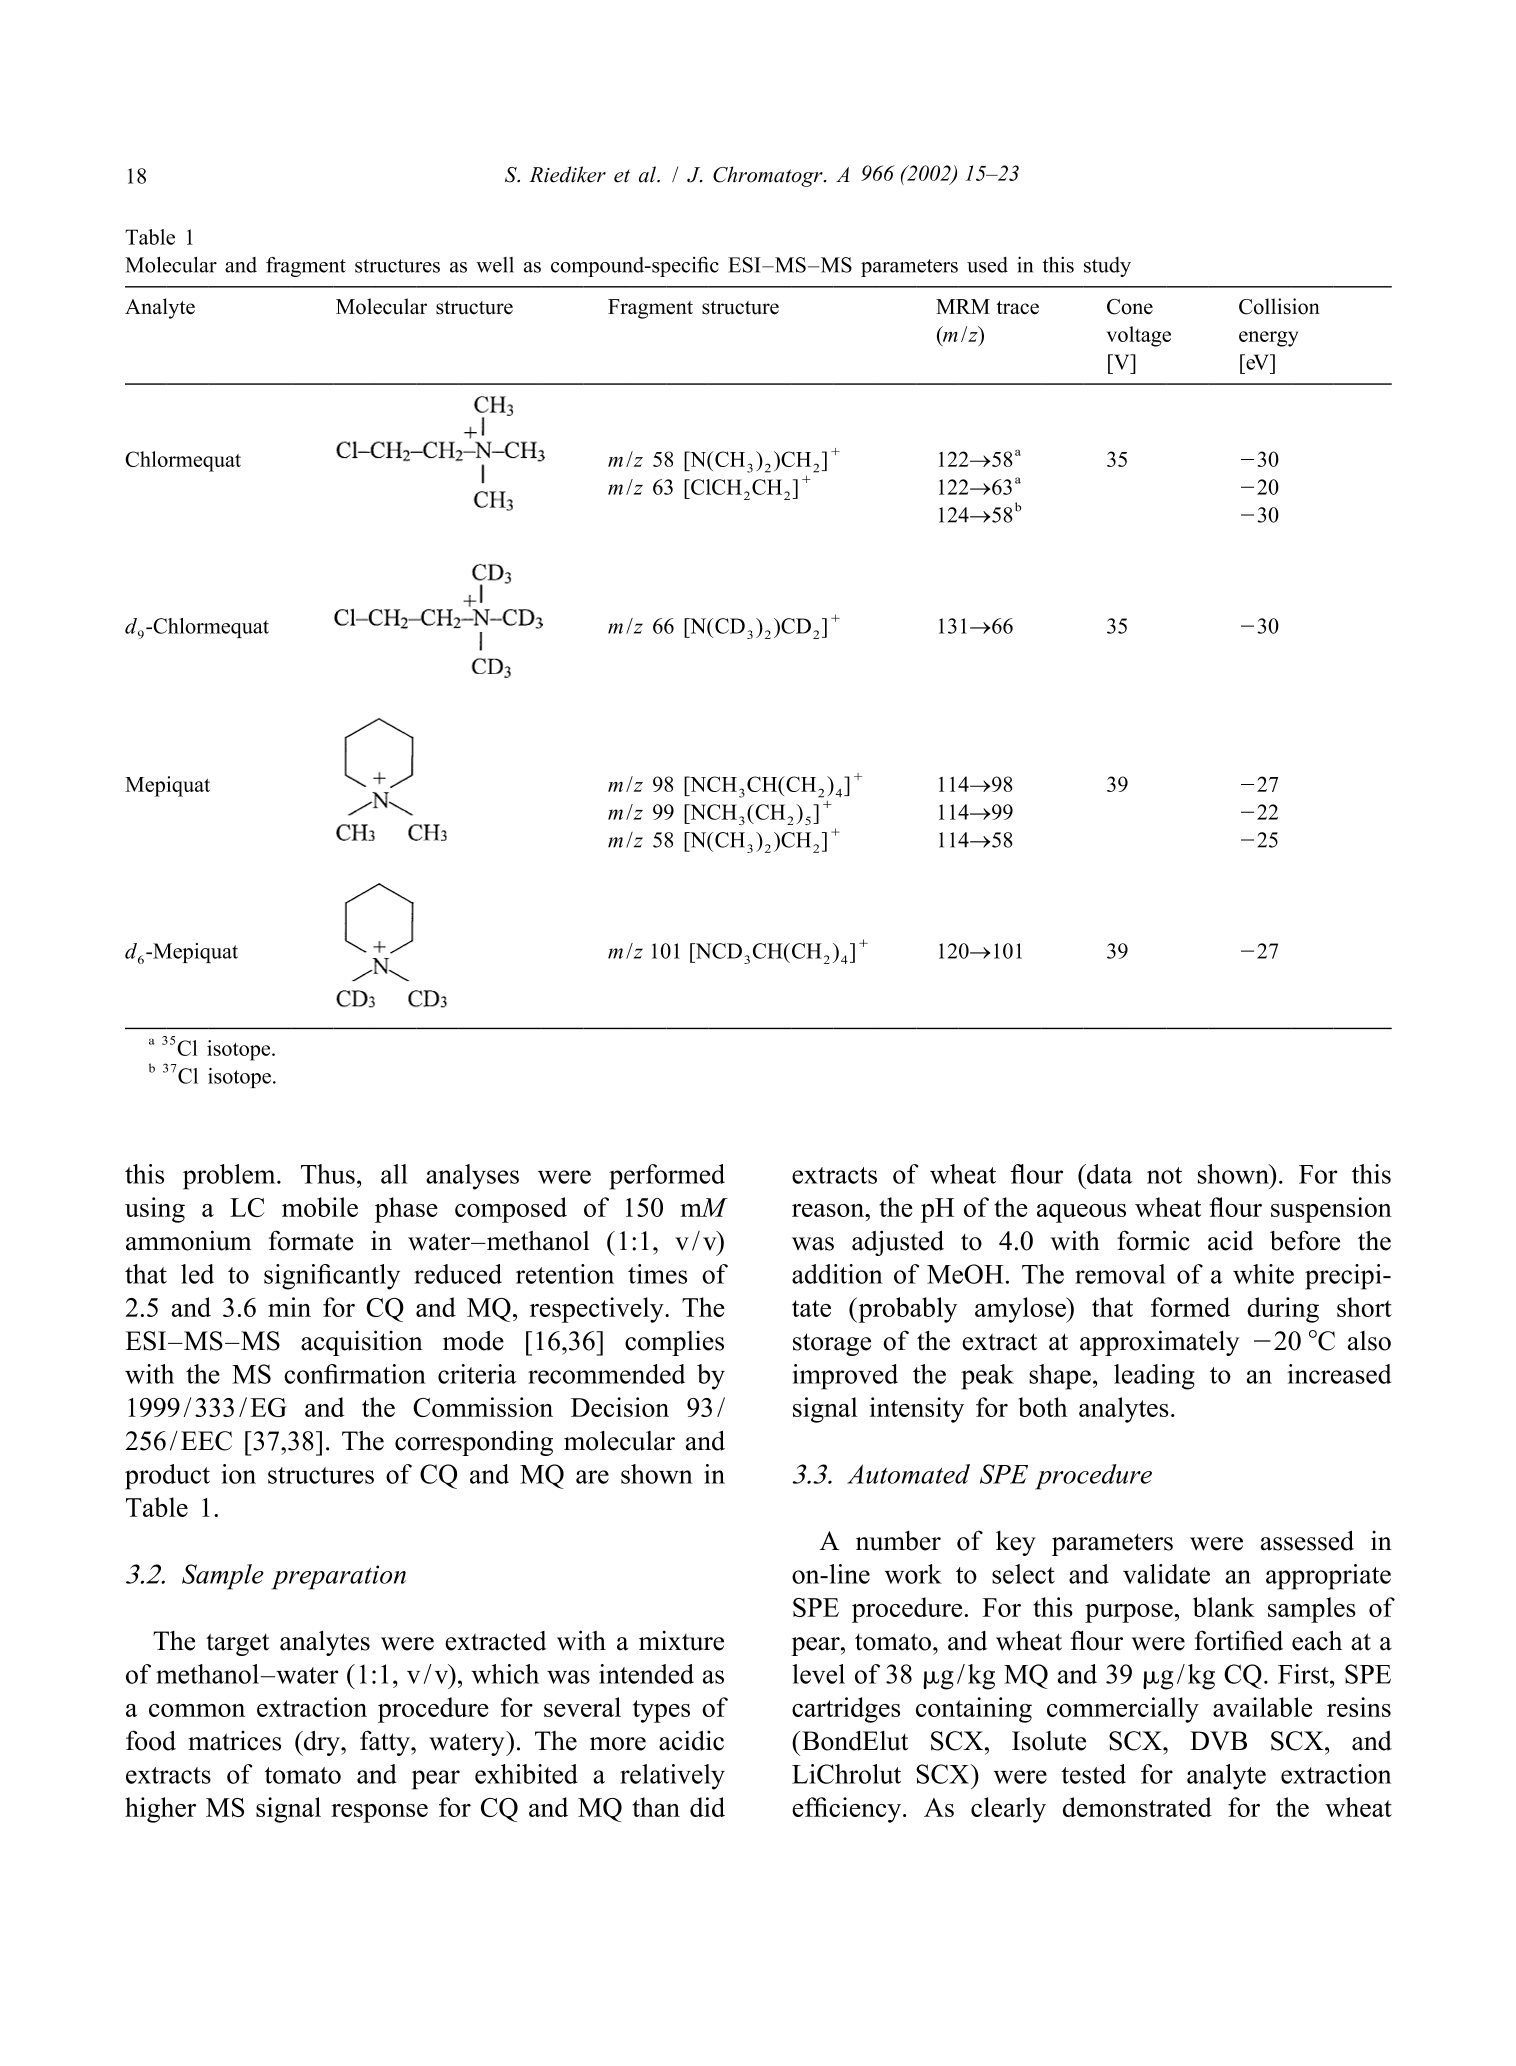
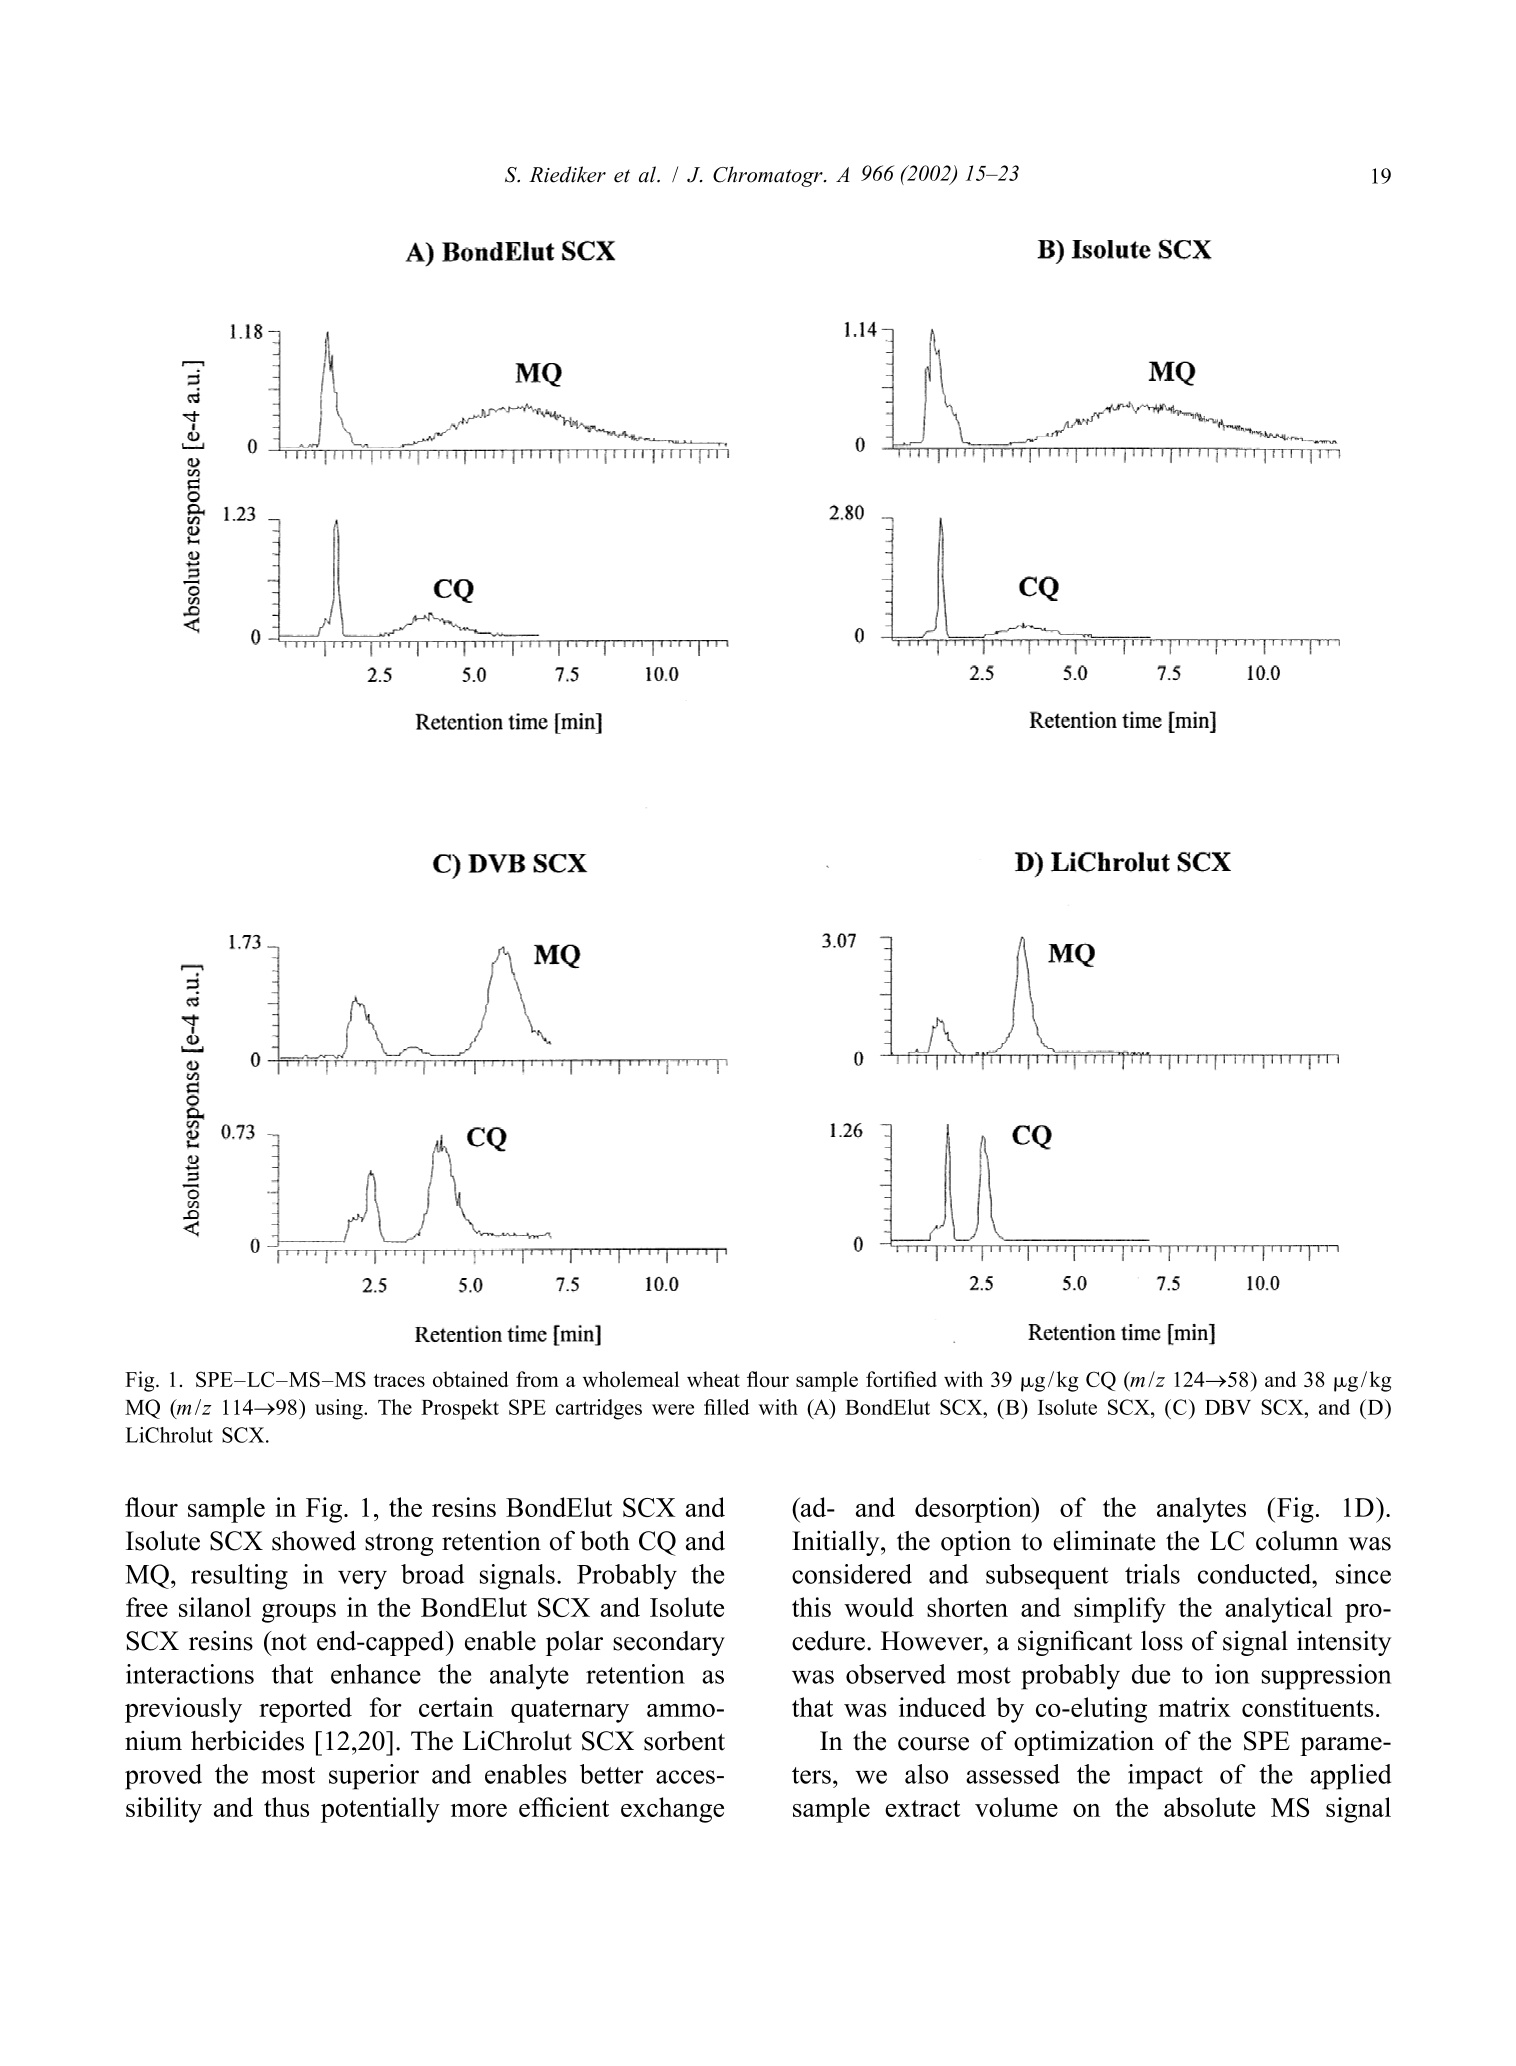
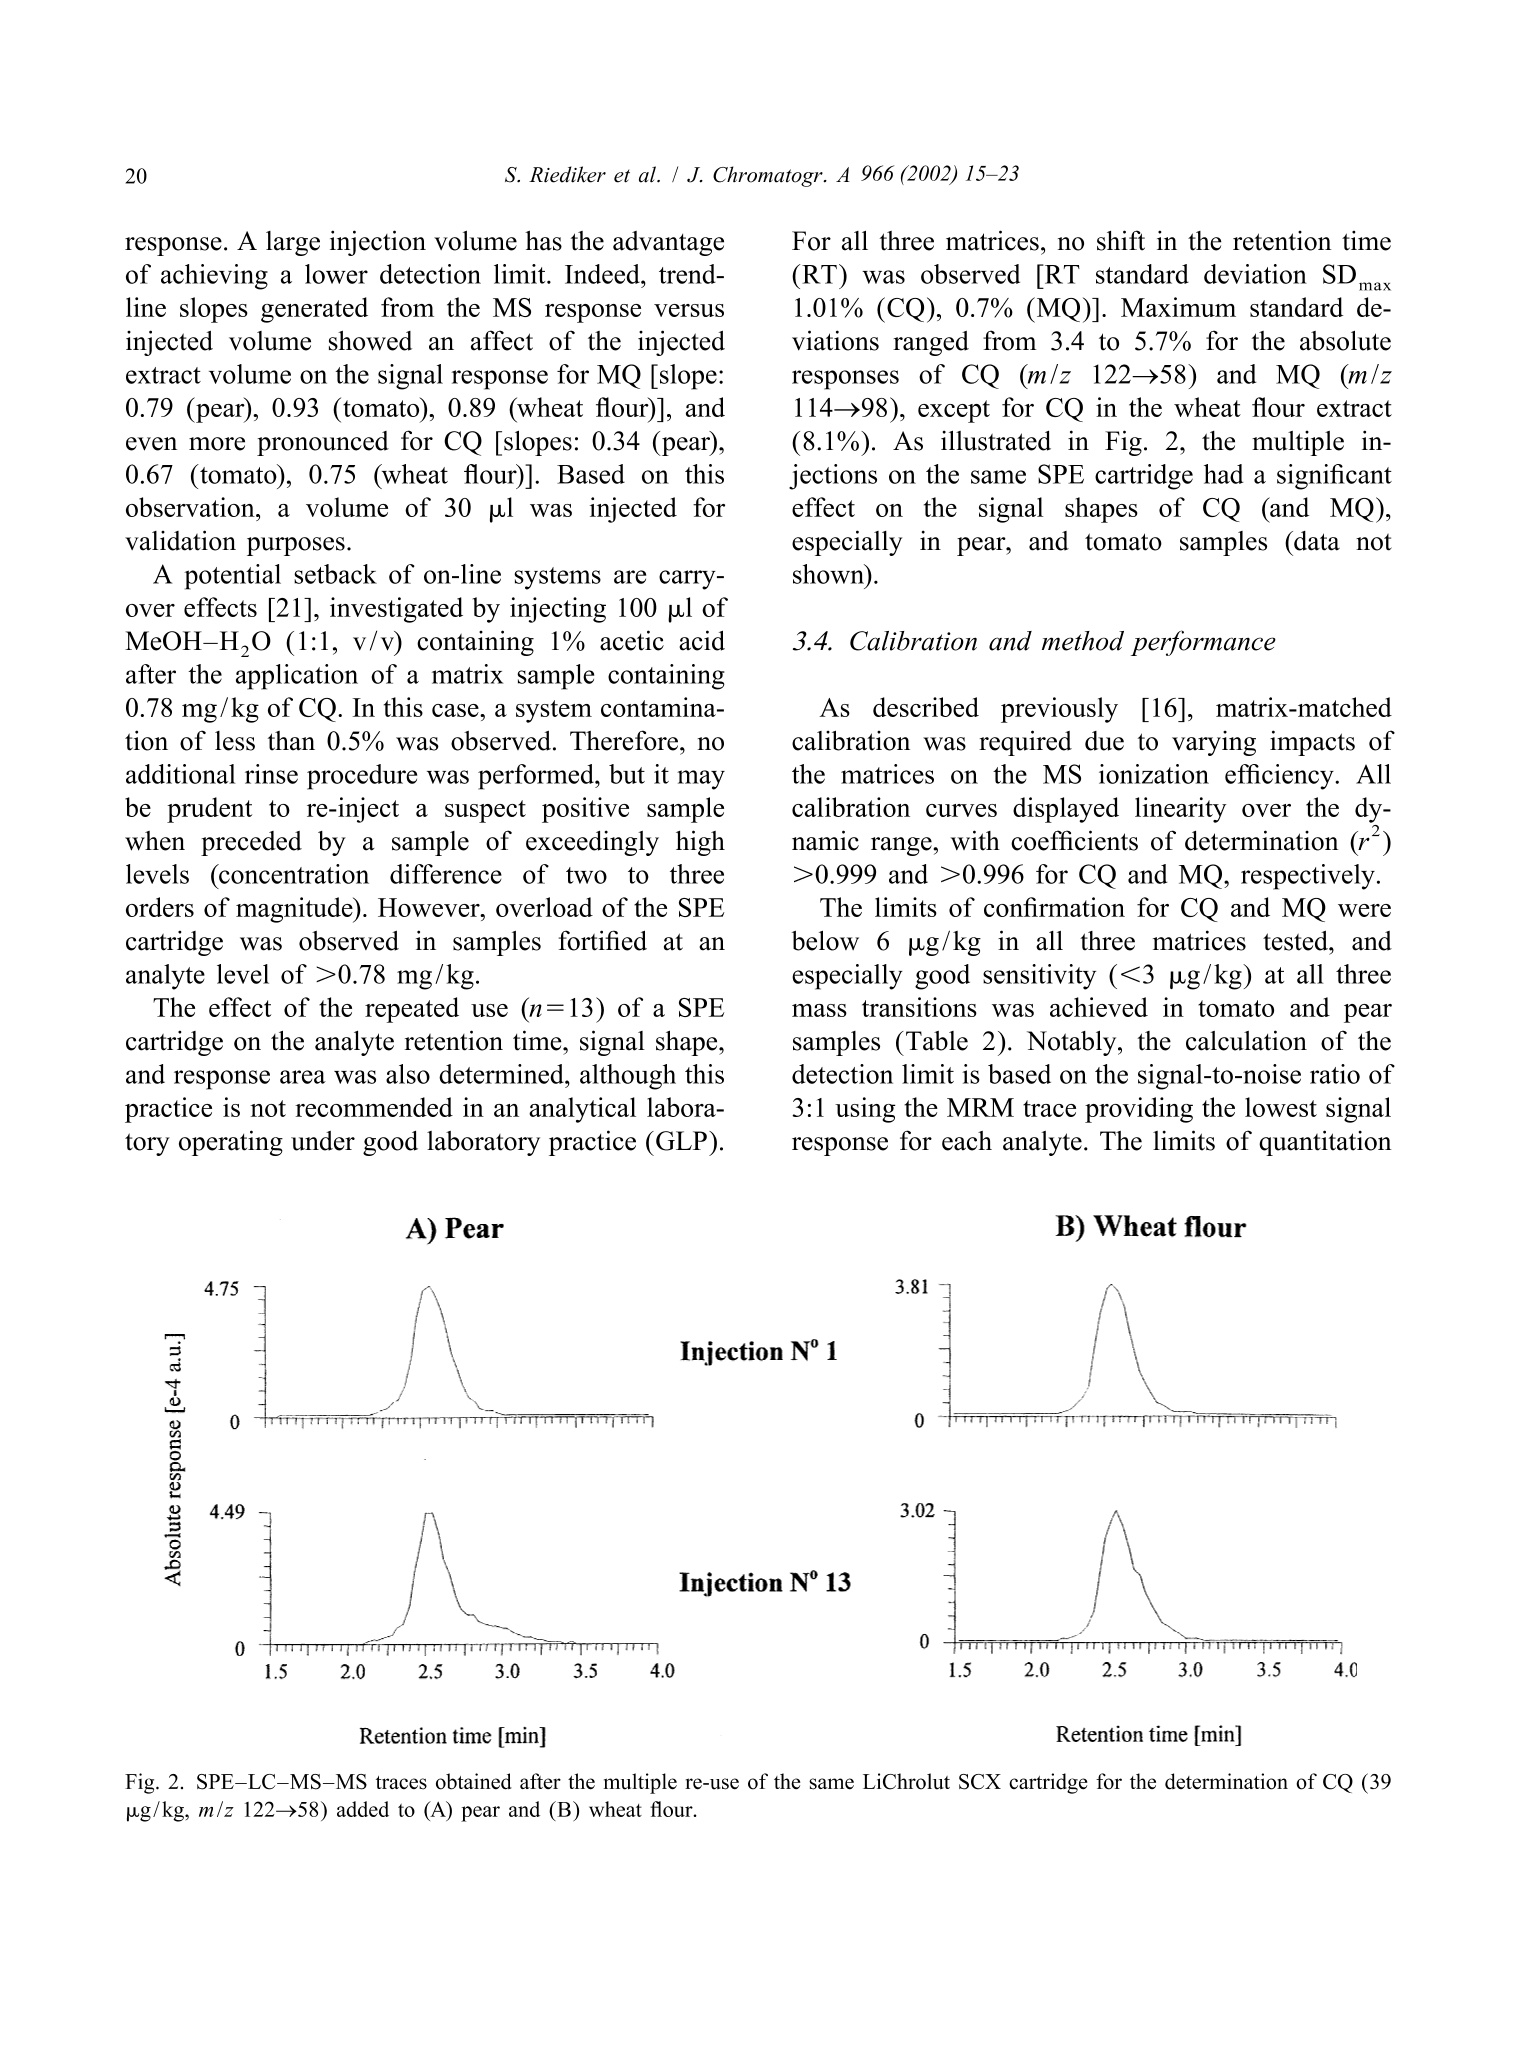
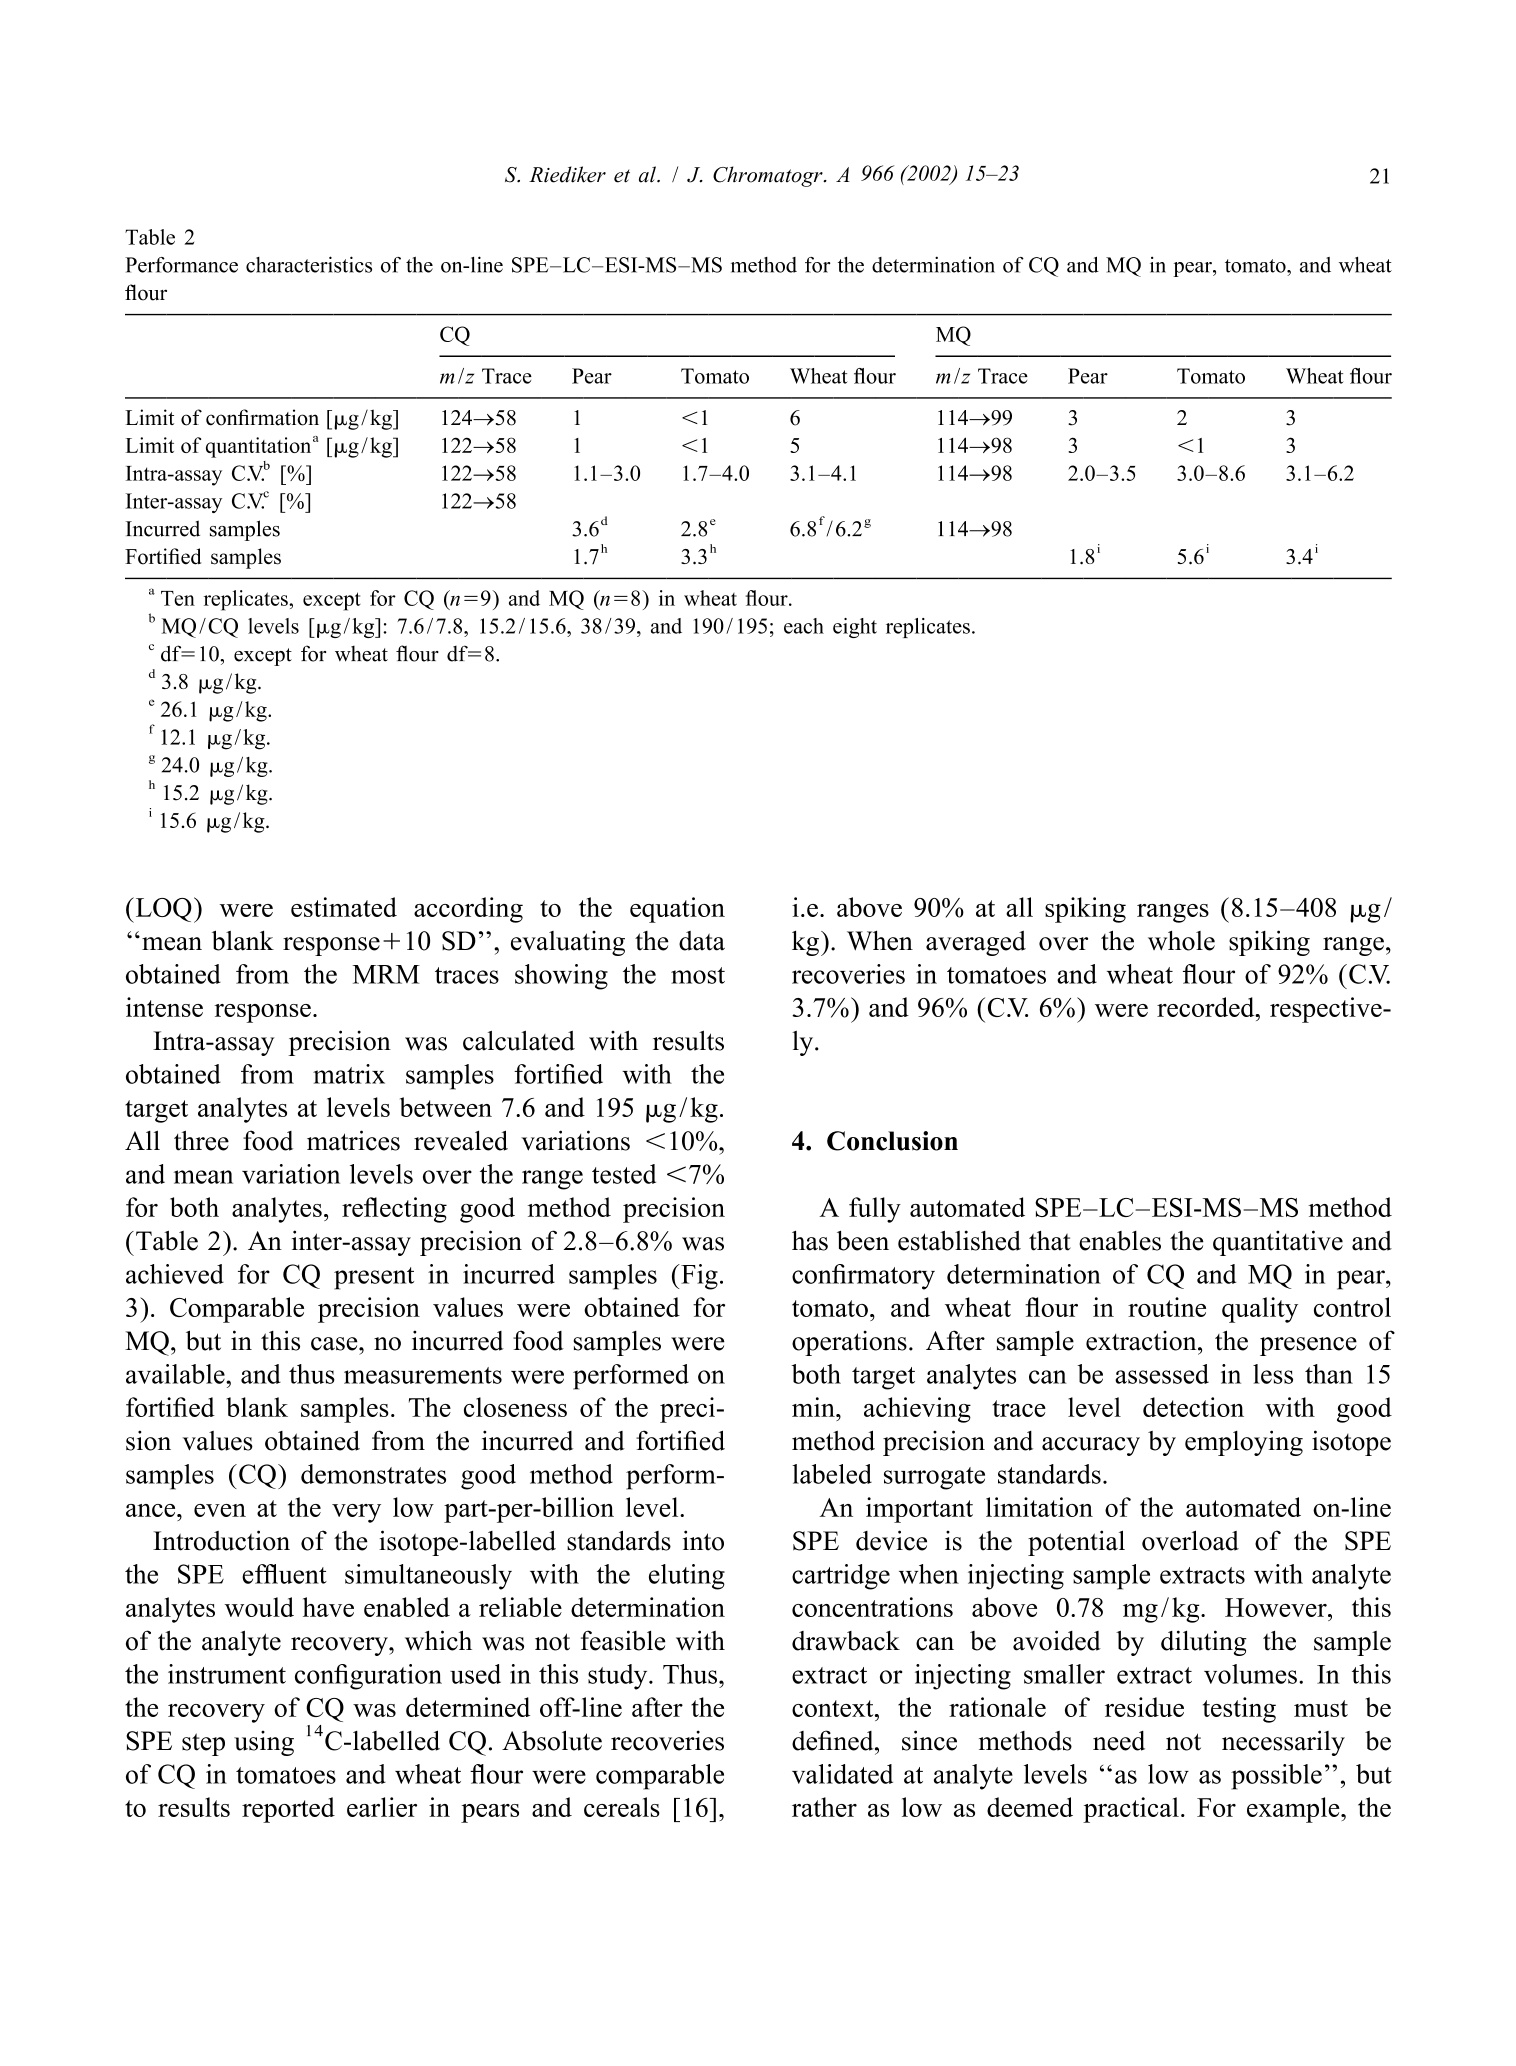
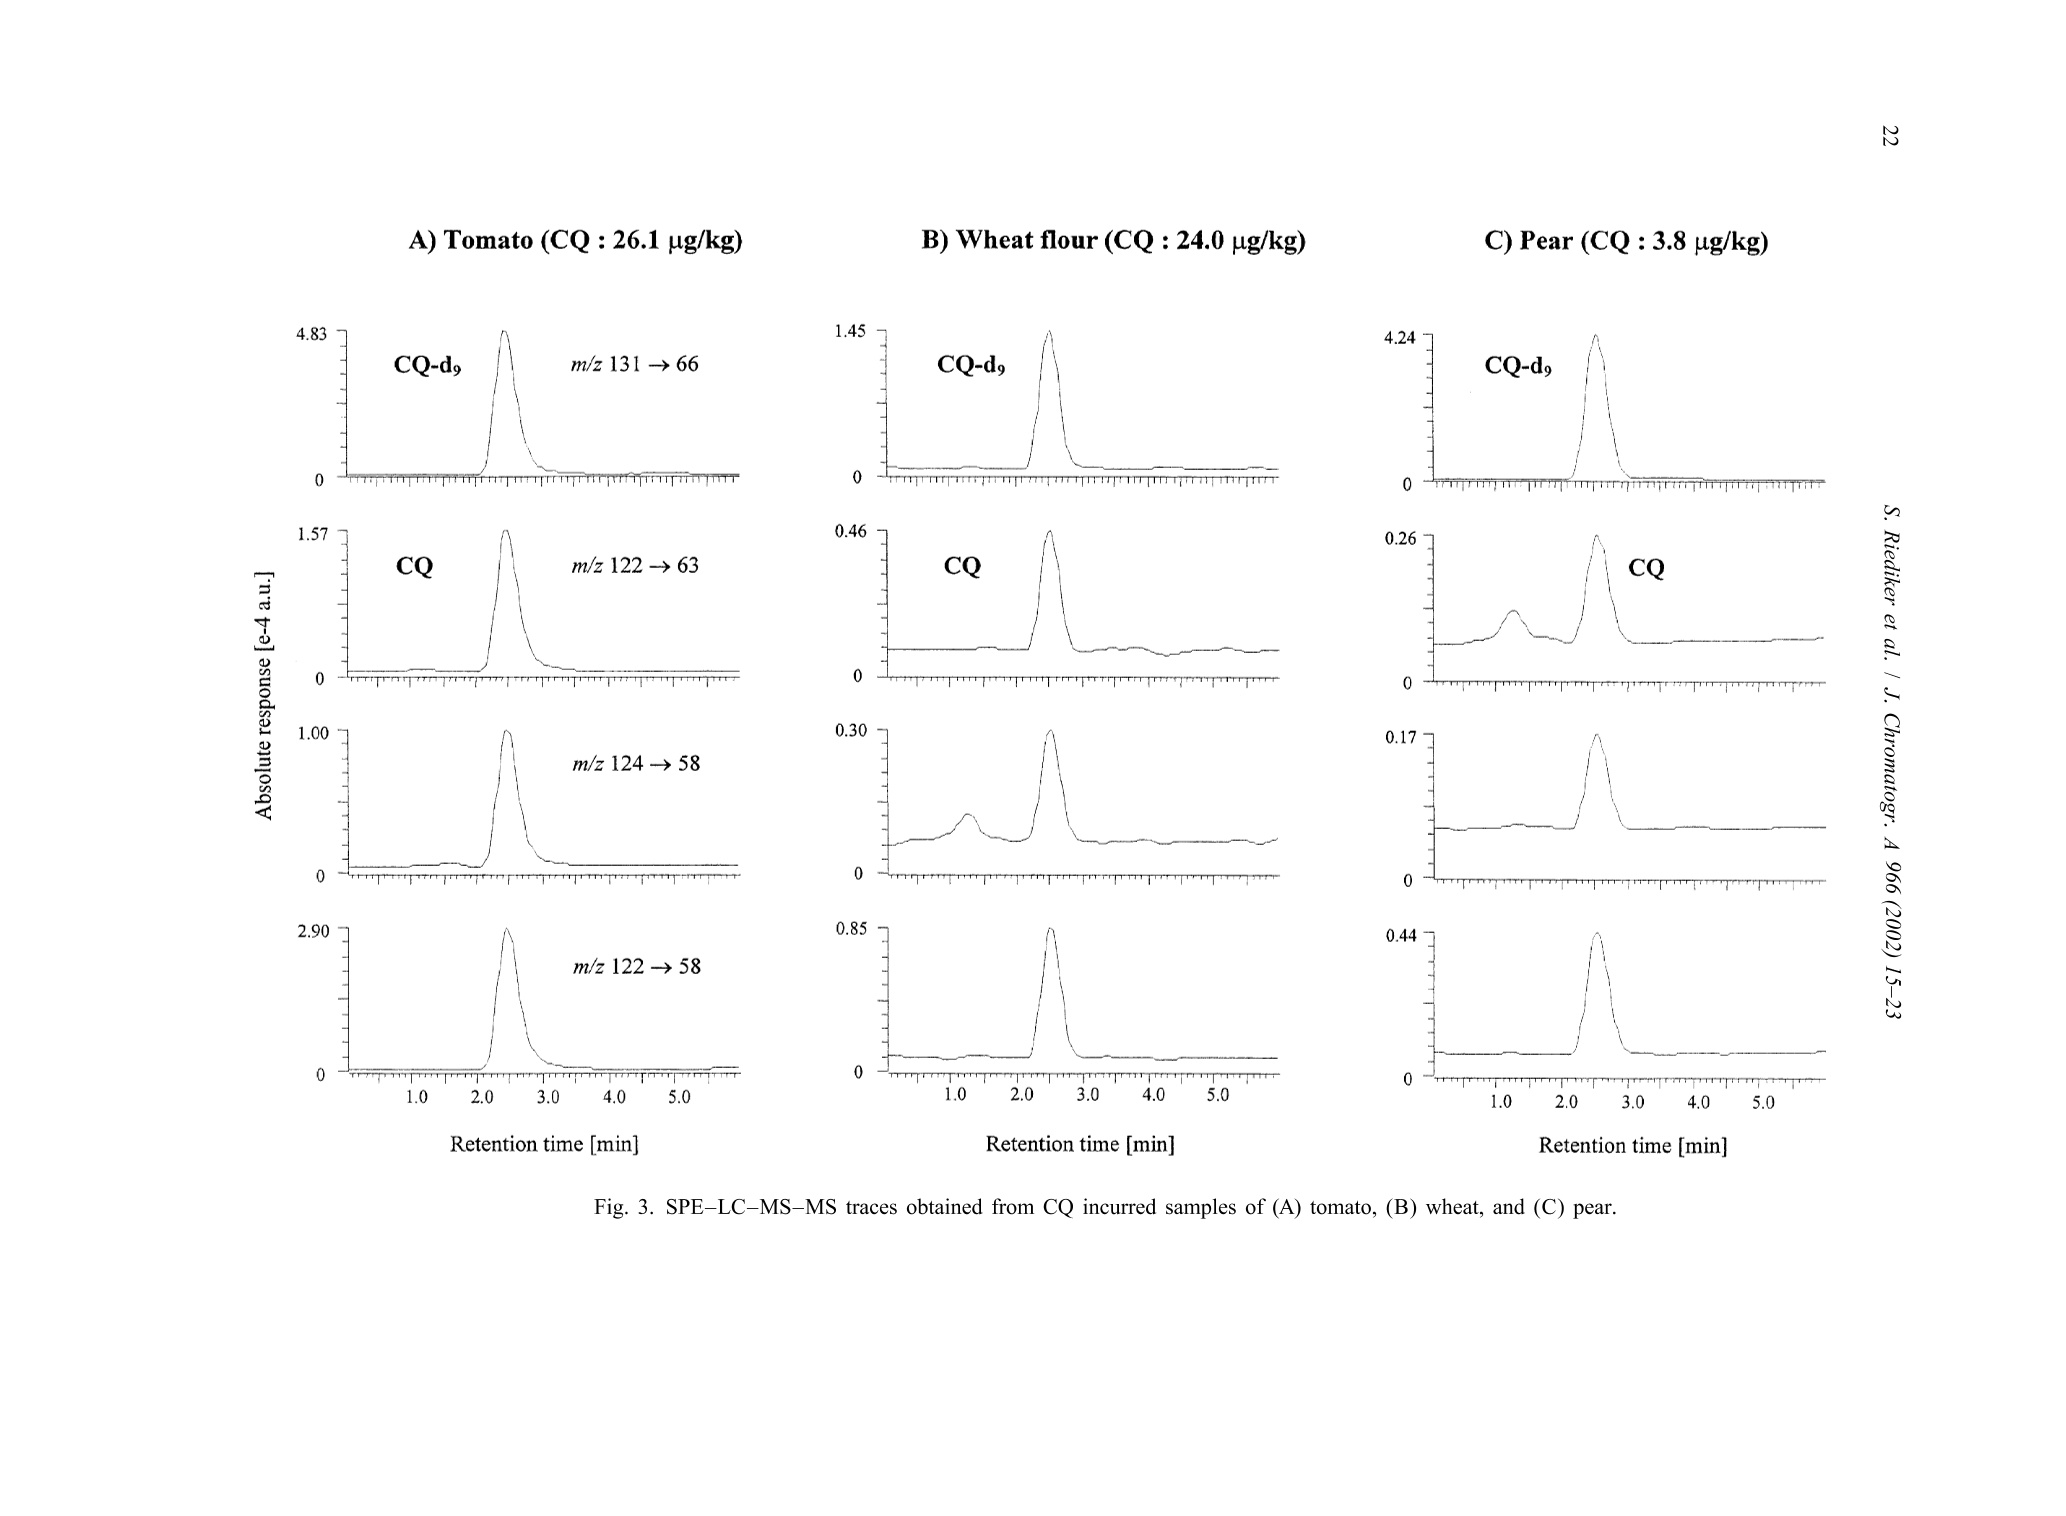
JOURNAL OFCHROMATOGRAPHY AJournal of Chromatography A, 966 (2002) 15-23 S. Riediker et al. / J. Chromatogr. A 966 (2002) 15-2316 www.elsevier.com/locate/chroma Determination of chlormequat and mepiquat in pear, tomato, andwheat flour using on-line solid-phase extraction (Prospekt)coupled with liquid chromatography-electrospray ionization tandemmass spectrometry Sonja Riediker, Heinrich Obrist, Natalia Varga", Richard H. Stadlera.* Department of Quality and Safety Assurance, Nestle Research Center, Nestec Ltd., Vers-chez-les-Blanc, CH-1000 Lausanne 26. Switzerland Metrohm AG, CH-9101 Herisau, Switzerland Received 10 January 2002; received in revised form 14 May 2002; accepted 29 May 2002 Abstract A sensitive and selective method is presented for the simultaneous analysis of the pesticides chlormequat and mepiquat attrace levels in tomato, pear, and wheat flour. The method entails direct injection of the food extract onto an on-linesolid-phase extraction (SPE) instrument (Prospekt) using a strong cation-exchange resin. Analyte separation and detection isdone by liquid chromatography-electrospray ionization tandem mass spectrometry (LC-ESI-MS-MS). Surrogate standards(d,-chlormequat, d-mepiquat) are employed to compensate for recovery losses and potential MS-MS signal suppression.The method achieves a limit of quantification for both cationic analytes at or below 5 pg/kg, and good intra- and inter-assayprecision with mean variability values <7% over a concentration range up to 195 pg/kg. This study also addresses potentialanalyte carry-over in an SPE on-line system, as well as the robustness of the procedure and its applicability in routine qualitycontrol operations. @ 2002 Elsevier Science B.V. All rights reserved. Keywords: Food analysis; Solid-phase extraction; Pesticides; Chlormequat; Mepiquat 1. Introduction In agriculture, the quaternary ammonium her-bicides chlormequat[(2-chloroethyl)-trimethyl-am-monium): CQ] and mepiquat (1,1-di-methylpiperidinium; MQ) are used as plant growth ( *Corresponding a uthor. Tel. : +41-21-785-8360; fax: +41-21- 785-8553. ) regulators either individually, as mixtures, or to-gether with other pesticides [1]. Especially CQ hasattracted the attention of enforcement laboratoriesand regulatory agencies in Europe, reflected bynumerous publications and website notifications onviolative levels of residues for example in freshpears, pear juice for infants, tomatoes, and cereals[2-5]. In fact, the Codex Alimentarius Commissionhas set maximum residue limits (MRLs) for CQ at 3mg/kg in pears, 5 mg/kg in wheat and rye, and 10 ( 0021-9673/02/$ - see front matter @ 2002 Els e vier Sci e nce B.V. All rig h ts reserved.PII: S0021-9673(02)00737-9 ) mg/kg in oats [6]. More stringent limits have beenset in European Commission Directives for CQ, i.e.0.5 mg/kg for pears, 0.05 mg/kg for tomatoes(currently accepted limit of detection), and 0.5-5mg/kg for cereals [7,8]. Neither the Codex Alimen-tarius Commission nor the EU have introducedMRLs for MQ in food. Today, the most frequently employed analyticalapproach to determine CQ in foods is tbased onhyphenated mass spectrometry (MS), such as capil-lary electrophoresis-massspectrometry (CE-MS)[9,10], LC-MS [11], LC-MS-MS [12-18], andmatrix-assistedlaser desorption ionizationmassspectrometry (MALDI-MS)[19]. In contrast toconventional procedures such as LC-UV [20], MS-based techniques enable detection of the analytes attrace levels in complex matrices, with the additionaladvantage of near certainty of the analytes. High sample throughput as practiced routinely inpharmacokinetic screening is now expanding rapidlyinto other sectors such as the environmental and foodsciences [21]. However, the majority of reports onthe application of on-line SPE are described onaqueous samples for environmental monitoring pur-poses; [18,22-33], with only a few methodsen-compassing food, e.g. isoniazid in milk [34], andN-methylcarbamates and their metabolites in fruitsand vegetables [35]. In this study, we have developed an on-line SPE-LC-ESI-MS-MS method for the simultaneous de-termination of CQ and MQ in pear, tomato, andwheat flour. The method meets stringent EU limitsfor pesticides in infant foods, with the added advan-tage of short clean-up and analysis time. Fourdifferent SCX solid-phase resins were assessed on-line with regard to their suitability to extract bothanalytes. Special emphasis was placed on the ver-satility and robustness of automated SPE for theroutine determination of trace levels of CQ and MQresidues, particularly in complex food matrices. 2. Experimental 2.1. Materials and reagents Chlormequat (CQ) chloride and mepiquat (MQ)chloride were purchased from Dr Ehrenstorfer (Aug- sburg, Germany). Stable and radio-isotope labelledCQ was obtained from the same sources as referredto in an earlier study [16]. Stock and workingstandard solutions were prepared as described previ-ously [16]. Acetonitrile was purchased from J.T. Baker (Phil-lipsburg, NJ, USA). Methanol (Lichrosolv), acetone,formic acid, acetic acid, hydrochloric acidandammonium formate were obtained from Merck(Darmstadt, Germany). Piperidine (purity >99.5%)and ds-iodomethane (isotopic purity >98%) werefrom Aldrich (Buchs, Switzerland). All other sol-vents or chemicals were of p.a. or HPLC grade.Water was either purified in-house or purchased fromMerck (LiChrosolv). Prospekt SPE cartridges (10×2 mm I.D.) wereeither commercially available (BondElut SCX, Iso-lute SCX, and DVB SCX) or custom filled with thesorbentLiChrolut SCX (Merck) from SSPARK(Emmen, The Netherlands). 2.2. d-Mepiquat iodide synthesis d,-Iodomethane (8.9 mmol) was carefully addedto 2.3 mmol piperidine pre-laid in dry acetonitrile (2ml). The reaction mixture was heated to 55-60℃for 30 min. After cooling to room temperature, themixture was cooled on ice. Then, any precipitatedmaterial was filtered through Schleicher & Schuellfilter paper (589, 55 mm O.D.) and washed with coldacetone. Re-crystallization from acetone afforded de-mepiquat isomnoiodide (0.36 mmol). The compound purity(>95%) and structure were verified by H NMR,C NMR, and high-resolution MS. Measured mass:120.16637 Da, calculated mass: 120.1559 Da. Theisotopic purity of d-mepiquat was determined as>99.8 atom%. 2.3. Instrumentation The automated SPE device consisted of an Endur-ance autosampler, a high pressure dispenser, and oneautomated cartridge exchange unit (SPARK). TheSPE unit was coupled to an Alliance 2690 separationmodule (Waters, Rupperswil, Switzerland), that wasconnected to a Quattro LC tandem mass spectro-meter (Micromass, Manchester, UK). 2.4. Pear, tomato, and wheat flour samples Incurred and blank samples of wholemeal flour,fresh pears and tomatoes (fresh or canned) werepurchased from various retail outlets in Switzerland. 2.5. Sample preparation A portion (10 g) of homogenized sample wasfortified with d,-CQ and d-MQ as surrogate stan-dards to achieve a final concentration of 31.5 and19.5 pg/kg, respectively. The sample material wassuspended in 100 ml of a water-methanol mixture(MeOH-H,O, 1:1, v/v) and stirred magnetically (20min) and subsequently centrifuged (3633 g, 5 min) atambient temperature. Finally, an aliquot of thesupernatant was filtered through a Millex FG syringefilter unit (0.2 um pore size, Millipore, Bedford,MA, USA). For the wheat flour analysis, the same procedurewas performed except for the extraction step thatencompassed suspension in 45 ml of water, pHadjustment to 4 with formic acid (2 M), and additionof methanol to a final volume of 100 ml. Further-more, the supernatant obtained after centrifugationwas placed in a freezer (-20℃) for 1 h. 2.6. On-line SPE-LC-ESI-MS-MS Thee SPE sorbent was washed and equilibratedconsecutively with MeOH (2 ml), water (2 ml), and10 mM HCl (4 ml). The sample extract (30 ul) wastransferred by 2 ml of MeOH-H,O (1:1, v/v) ontothe SPE cartridge that was subsequently flushed withacetonitrile (2 ml) and MeOH-H,O(1:1,v/v; 1 ml).The flow-rate was set to 4 ml/min for all cycle steps.The retained analytes were eluted with 150 mMammonium formate in MeOH-H,O(1:1,v/v, no pHadjustment) directly onto the analytical GromSilSCX column (5 um particle size, 50×2 mm I.D.,Grom Analytik & HPLC, Herrenberg-Kayh, Ger-many). The elution mode was isocratic at a flow-rateof0.3 ml/min (backpressure: 448-522bbar.Thecolumn temperature was set to 35 ℃. To avoidpotential carry-over of residual analytes to the fol-lowing SPE cartridge, the autosampler injectionneedle and sample loop were washed with 0.5 ml ofMeOH-H,O (1:1, v/v) containing 1% acetic acid. Data acquisition was done in the positive ESImode for 7 min per run. Multiple reaction moni-toring (MRM) traces, cone voltages, and collisionenergies are listed in Table 1. The mass window wasset to m/z 0.2 and the dwell time to 0.25 min. Theneedle voltage was typically set to 3.1 kV, the RFlens voltage to 0.2 V, and the ion energy for bothquadrupoles to 1.0 V. The source block and desolva-tion temperatureswere set aat 1 and 400C.respectively. Nitrogen was used as nebulizer (90 1/h)and desolvation gas (650 1/h) and argon as collisiongas (vacuum pressure: 1.7 mTorr). 2.7. Determination of the CO extraction recoveryusing a ’C-labelled standard Absolute recoveries using radio isotope-labelledCQ was determined as described elsewhere [16],except that elution of the analyte was accomplishedwith 125 mM ammonium formate in MeOH-H.O(1:1, v/v, pH not adjusted). 2.8. Quantitation alibration curves (five-point) wweerree e(stablishedusing spiked matrixx standardsaat.0concentrationsbetween 7.8 and 195 pg/kg for CQ, and between 7.6and 190 pg/kg for MQ. Quantitation was performedas described elsewhere [16] using the MRM tracesm/z 122→58 for CQ,m/z 114→98 for MQ, and thecorresponding transitions for the surrogate standards. 3. Results and discussion 3.1. LC-ESI-MS-MS The transfer of the same chromatographic con-ditions previously developed in our laboratory [16]to the on-line SPE system resulted in a retention timefor CQ of 6.5 min. To reduce the total duration ofthe analytical run, LC solvents of varying ionicstrengths of ammonium acetate were assessed. How-ever, we observed a loss of signal intensity at highersalt concentrations due to precipitation in the MS ionsource region over longer periods of operation (2-3days). The substitution of ammonium acetate withthe more volatile ammonium formate circumvented Analyte Molecular structure Fragment structure MRM trace Cone Collision (m/z) voltage energy [V] [eV] Chlormequat CH:+1 Cl-CH2-CH2-N-CH3 m/z 58 [N(CH,))CH,] 122→58* 35 -30 CH: m/z 63 [CICH,CH,]+ 122→63° 124→58° -20 -30 CD3 d,-Chlormequat Cl-CH2-CH2-N-CD3 m/z 66 [N(CD,))CD,] 131→66 35 -30 CD3 Mepiquat m/z 98 [NCH,CH(CH,)4] 114→98 39 -27 m/z 99 [NCH,(CH,)]* 114-99 -22 CH3 CH3 m/z 58 [N(CH,))CH,] 114→58 -25 d-Mepiquat m/z 101 [NCD,CH(CH,)4]7 120→101 39 -27 CD3 CD3 a 35Cl isotope.b 37Cl isotope. this problem. Thus, all analyses were performedusing a LC mobile phase composed of 150 mMammonium formate in water-methanol (1:1, v/v)that led to significantly reduced retention times of2.5 and 3.6 min for CQ and MQ, respectively. TheESI-MS-MS acquisition mode [16,36] complieswith the MS confirmation criteria recommended by1999/333/EG and the Commission Decision 93/256/EEC [37,38]. The corresponding molecular andproduct ion structures of CQand MQ are shown inTable 1. 3.2. Sample preparation The target analytes were extracted with a mixtureof methanol-water (1:1,v/v), which was intended asa common extraction procedure for several types offood matrices (dry, fatty, watery). The more acidicextracts of tomato and pear exhibited a relativelyhigher MS signal response for CQ and MQ than did extracts of wheat flour (data not shown). For thisreason, the pH of the aqueous wheat flour suspensionwas adjusted to 4.0 with formic acid before theaddition of MeOH. The removal of a white precipi-tate (probably amylose) that formed during shortstorage of the extract at approximately -20°℃ alsoimproved the peak shape, leading to an increasedsignal intensity for both analytes. 3.3. Automated SPE procedure A number of key parameters were assessed inon-line work to select and validate an appropriateSPE procedure. For this purpose, blank samples ofpear, tomato, and wheat flour were fortified each at alevel of 38 ug/kg MQ and 39 pg/kg CQ. First, SPEcartridges containing commercially available resins(BondElut SCX, Isolute SCX, DVB SCX, andLiChrolut SCX) were tested for analyte extractionefficiency. As clearly demonstrated for the wheat A) BondElut SCX B) Isolute SCX Retention time [min] C) DVB SCX Retention time [min] Fig. 1. SPE-LC-MS-MS traces obtained from a wholemeal wheat flour sample fortified with 39 pg/kg CQ (m/z 124→58) and 38 ug/kgMQ (m/z 114→98) using. The Prospekt SPE cartridges were filled with (A) BondElut SCX, (B) Isolute SCX, (C) DBV SCX, and (D)LiChrolut SCX. flour sample in Fig. 1, the resins BondElut SCX andIsolute SCX showed strong retention of both CQ andMQ, resulting in very broad signals. Probably thefree silanol groups in the BondElut SCX and IsoluteSCX resins (not end-capped) enable polar secondaryinteractions that enhance the analyte retention aspreviously reported for certain quaternary ammo-nium herbicides [12,20]. The LiChrolut SCX sorbentproved the most superior and enables better acces-sibility and thus potentially more efficient exchange ad-and desorption) of the analytes (Fig. 1D).Initially, the option to eliminate the LC column wasconsidered and subsequent trials conducted, sincethis would shorten and simplify the analytical pro-cedure. However, a significant loss of signal intensitywas observed most probably due to ion suppressionthat was induced by co-eluting matrix constituents. In the course of optimization of the SPE parame-ters, we also assessed the impact of the appliedsample extract volume on the absolute MS signal response. A large injection volume has the advantageof achieving a lower detection limit. Indeed, trend-line slopes generated from the MS response versusinjected volume showed an affect of the injectedextract volume on the signal response for MQ [slope:0.79 (pear), 0.93 (tomato), 0.89 (wheat flour)], andeven more pronounced for CQ [slopes: 0.34 (pear),0.67 (tomato), 0.75 (wheat flour)]. Based on thisobservation, a volume of 30 pl was injected forvalidation purposes. A potential setback of on-line systems are carry-over effects [21], investigated by injecting 100 pl ofMeOH-H,O (1:1, v/v) containing 1% acetic acidafter the application ofa matrix sample containing0.78 mg/kg of CQ. In this case, a system contamina-tion of less than 0.5% was observed. Therefore, noadditional rinse procedure was performed, but it maybe prudent to re-inject a suspect positive samplewhen preceded by a sample of exceedingly highlevels (concentration difference of two to threeorders of magnitude). However, overload of the SPEcartridge was observed in samples fortified at ananalyte level of >0.78 mg/kg. The effect of the repeated use (n=13) of a SPEcartridge on the analyte retention time, signal shape,and response area was also determined, although thispractice is not recommended in an analytical labora-tory operating under good laboratory practice (GLP). For all three matrices, no shift in the retention time(RT) was observed [RT standard deviation SDmax1.01% (CQ), 0.7%(MQ)]. Maximum standard de-viations ranged from 3.4 to 5.7% for the absoluteresponses of CQ (m/z 122→58) and MQ (m/z114→98), except for CQ in the wheat flour extract(8.1%). As illustrated in Fig. 2, the multiple in-jections on the same SPE cartridge had a significanteffect on the signal shapes of CQ (and MQ),especially in pear, and tomato samples (data notshown). 3.4. Calibration and method performance As described previously [16], matrix-matchedcalibration was required due to varying impacts ofthe matrices on the MS ionization efficiency. Allcalibration curves displayed linearity over the dy-namic range, with coefficients of determination (r)>0.999 and >0.996 for CQ and MQ, respectively. The limits of confirmation for CQ and MQ werebelow 6 pg/kg in all three matrices tested, andespecially good sensitivity (<3 ug/kg) at all threemass transitions was achieved in tomato and pearsamples (Table 2). Notably, the calculation of thedetection limit is based on the signal-to-noise ratio of3:1 using the MRM trace providing the lowest signalresponse for each analyte. The limits of quantitation A) Pear B) Wheat flour Injection N° Injection N' 13 Retention time [min] Fig. 2. SPE-LC-MS-MS traces obtained after the multiple re-use of the same LiChrolut SCX cartridge for the determination of CQ (39pg/kg, m/z 122→58) added to (A) pear and (B) wheat flour. Table 2 Performance characteristics of the on-line SPE-LC-ESI-MS-MS method for the determination of CQ and MQ in pear, tomato, and wheatflour CQ MQ m/z Trace Pear Tomato Wheat flour m/z Trace Pear Tomato Wheat flour Limit of confirmation [ug/kg] 124→58 1 <1 6 114→99 3 2 3 Limit of quantitation [ug/kg] 122→58 1 <1 5 114→98 3 <1 3 Intra-assay C.V.[%] 122→58 1.1-3.0 1.7-4.0 3.1-4.1 114→98 2.0-3.5 3.0-8.6 3.1-6.2 Inter-assay C.V. [%] 122-58 Incurred samples 3.6° 2.8 6.8f/6.2 114→98 Fortified samples 1.7 3.3" 1.8 5.6' 3.4 MQ/CQ levels [ug/kg]: 7.6/7.8,15.2/15.6,38/39, and 190/195; each eight replicates. ° df=10, except for wheat flour df=8. 3.8 pg/kg. 26.1 pg/kg. (LOQ) were estimated according to the equation“mean blank response+10 SD”, evaluating the dataobtained from the MRM traces showing the mostintense response. Intra-assay precision was calculated with resultsobtained from matrixt samples fortified with thetarget analytes at levels between 7.6 and 195 pg/kg.All three food matrices revealed variations <10%.and mean variation levels over the range tested <7%for both analytes, reflecting good method precision(Table 2). An inter-assay precision of 2.8-6.8% wasachieved for CQ present in incurred samples (Fig.3). Comparable precision values were obtained forMQ, but in this case, no incurred food samples wereavailable, and thus measurements were performed onfortified blank samples. The closeness of the preci-sion values obtained from the incurred and fortifiedsamples (CQ) demonstrates good method perform-ance, even at the very low part-per-billion level. Introduction of the isotope-labelled standards intothe SPE effluent simultaneously with the elutinganalytes would have enabled a reliable determinationof the analyte recovery, which was not feasible withthe instrument configuration used in this study. Thus,the recovery of CQ was determined off-line after theSPE step using C-labelled CQ. Absolute recoveriesof CQ in tomatoes and wheat flour were comparableto results reported earlier in pears and cereals [16], i.e. above 90% at all spiking ranges (8.15-408 pg/kg). When averaged over the whole spiking range,recoveries in tomatoes and wheat flour of 92% (C.V.3.7%) and 96%(C.V. 6%) were recorded, respective-ly. 4. Conclusion A fully automated SPE-LC-ESI-MS-MS methodhas been established that enables the quantitative andconfirmatory determination of CQ and MQ in pear,tomato, and wheat flour in routine quality controloperations. After sample extraction, the presence ofboth target analytes can be assessed in less than 15min, achieving trace level detection with goodmethod precision and accuracy by employing isotopelabeled surrogate standards. An important limitation of the automated on-lineSPE device is the potential overload of the SPEcartridge when injecting sample extracts with analyteconcentrations above 0.78 mg/kg. However, thisdrawback can be avoided by diluting the sampleextract or injecting smaller extract volumes. In thiscontext, the rationale of residue testing must bedefined, since methods need not necessarily bevalidated at analyte levels “as low as possible”, butrather as low as deemed practical. For example, the A) Tomato (CQ : 26.1pg/kg) B) Wheat flour (CQ : 24.0 pg/kg) C) Pear (CQ:3.8 pg/kg) 4.83 1.57 寸0oo 1.00 0 2.90 0 Fig. 3. SPE-LC-MS-MS traces obtained from CQ incurred samples of (A) tomato, (B) wheat, and (C) pear. EU MRL of CQ in pears is set at 0.5 mg/kg, andthus it may be more facile to adapt the method forlimits at or around this value. In case of monitoringCQ and MQ at “blanket levels”of 0.01 mg/kg inraw material that is intended for the production ofinfant food [39,40], the method performance shouldbe ideally determined with samples contaminated atthe very low part-per-billion level. Acknowledgements We thank Drs Laurent B. Fay and Jorg Hau forconducting HRMS analyses, and Francia Arce-Verafor recordingIH and 1133C NMRt spectra of d-mepiquat. ( References ) ( [1] C.D.S. Tomlin, T he Pesticide Manual, 1 1th e d, British Crop Protection Council, United K ingdom, 1 9 97. ) ( [2] EU F ood A l ert, 1 1 J a nuary 2001, ht t p: / /www . pes t icides.gov.uk/citizen/ r esidues/oth e r/ r apidvarweb.htm. ) ( [3] Pesticides Residues M onitoring-Information Sheet Ap ril2000: h t tp://www.maff.gov.uk/about ma f/ps d /psdhome. htm. ) ( [4] EU Food A l ert, 13 D e cember 2000, htt p: / /www.pest i cides- .gov.uk/citizen/residues/other/ r apidvarweb. htm . ) ( [5] R.K. J uhler, M. V ahl, J . A ssoc. O ff. A nal. C hem. In t . 8 2 (1999) 331. ) ( [6] Codex Alimentariu s Commission , Joi n t FAO/WHO F oodStandards P rogram. Report o f the 31st S ession o f the C o dexon P esticide Residues, The Hague, 12 -17, April 1999,ALINORM 99/24A. ) ( [7] Commission Directive 2001/35/EC of 11 M ay 2001, OJ No L 1 36/42,18.05.2001. ) ( [8] European C ouncil D irective 1996/33/EC of 21 M ay 1996, OJ N o L144, 1 8.06.1996. ) ( [9] E. Moyano, D .E. Games, M .T. G alceran, Rapid Commun. Mass S pectrom. 1 0 (1996)1379. ) ( [10] D. Wycherley, M.E. R o se, K . Giles, T . M . Hu t ton, D.A.Rimmer, J. Chromatogr. A 734 (1996) 339. ) ( [1 1 ] D. Volmer, K. L evsen, G . W uensch, J . Chromatogr. A 660 ( 1 994) 231. ) ( [12] M . Vahl, M. G r aven, R.K. Ju h ler, Fresenius J. A n al. Chem. 361 ( 1998)817. ) ( [13] J .E. S tartin, S.J. Hird, M.D. Sykes, J.C. Taylor, A . R.C. Hi l l, Analyst 124 (1999) 1 011. ) ( [ 1 4] H .G.J. M ol, R . C.J. V an Dam, R.J. Vreeken, O.M. Steijger, J. Assoc. O ff. A nal. C hem. Int. 83 (2000) 742. ) ( [15] C.S. Evans, J. R S tartin, D.M. G oodall, B .J. K eely, J.Chromatogr. A 897 (2000) 399. ) ( [16] J . Hau, S. Riediker, N. Varga, R.H. Stadler, J. Chromatogr. A 878 (2000) 77. ) ( [17] C .S. E vans, J.R. S tartin, D.M. Goodall, B.J. K e ely, R a pidCommun. M a ss Spectrom. 1 4 (2000) 1 1 2. ) ( [ 1 8] R . Castro, E. Moyano, M .T. G alceran, J. Chromatogr. A 914(2001)111. ) ( [ 1 9] J. Horak, W. Werther, E.R. Schmid, Rapid Commun. M a ssSpectrom. 15 (2001) 241. ) ( [20] Y . P ico, G . Fo n t, J.C. Molto, J. M anes, J. Chromatogr. A 885 (2000) 251. ) ( [ 2 1] D.T. R ossi, N . Z hang, J. Chromatogr. A 88 5 (2000) 97. ) ( [22] A.C. Hogenboom, W.M.A. Niessen, D . Little, U . A.Th. Brinkman, Rapid Commun. M a ss Spectrom. 1 3 ( 1 999) 125. ) [23] A.C. Hogenboom, M.P. Hofman, D.A. Jolly, W.M.A. Nies-sen, U.A.Th. Brinkman, J. Chromatogr. A 885 (2000) 377. ( [24] S.R. Ruberu, W.M. D raper, S. Kusum Perera, J. Agric. FoodChem. 48 (2000) 4 109. ) ( [25] J . Slobodnik, A .C. H o genboom, J.J . Vr e uls, J . A. R o ntree, B.L.M. v an B aar, W .M.A. Niessen, U .A.Th. B rinkman, J. Chromatogr. A 7 41 ( 1996) 59. ) ( [26] A.C. H ogenboom, W.M.A. Ni e ssen, U. A .Th. Brinkman, J.Chromatogr. A 841 (1999) 3 3 . ) ( [27] M .-C. Hennion, J. C hromatogr. A 8 5 6 (1999) 3 . ) ( [28] M. B ouzige, G . M a chtalere, P . L e geay, V. Pichon, M. - C. H ennion, Waste M anagement 1 2 (2) ( 1 999) 1 7 1. ) ( [29] C. R ivasseau, G . Vanhoenacker, P . Sandra, M.-C. H e nnion, J. Microcol. Sep . 12(5)(2000)323. ) ( [30] J.J.Vreuls, A.J.H. Louter, U.A.Th. Brinkman, J. Chromatogr. A 8 56( 1 999) 279. ) ( [31] R . K oeber, C . F l eischer, F. L anza, K.-S. B o os, B . Sellergren,D. Barcelo, Anal . Chem. 73 (2001)2437. ) ( [32] M.J. Lopez d e A lda, D . Barcelo, J . Chromatogr. A 9 1 1 (2001) 2 03. ) ( [33] I . Ferrer, D. Barcel6, J. Chromatogr. A 926 (2 0 01) 228 . ) ( [34] L . Grasso,G. S c arano, E . I m parato, O. Arace, G . O l iviero,F o od A ddit. Contam. 1 7 (2000) 749. ) ( [35] A . D e Kok, M. H i emstra, J . A ssoc. O ff. Anal. Chem. Int. 7 5(1992) 1063. ) ( [36] S . R iediker, R .H. Stadler, A nal. Chem. 73 (2001) 1614. ) ( [37] Commission Recommendation 1999/333/EG of 3 M a rch 1999, OJ N o L 1 2 8, 21.05.1999. ) [38] Commission Decision 93/256/EEC of 14 April 1993, OJ NoL 118.14.05.1993. ( [39] E uropean Council Directive 1999/39/EC of 6 May 1999, OJNo L 124/8. 1 8 .05.1999. ) ( [40] European Council Directiv e 1999/50/EC of 25 May 1999, OJ No L 139.02.06.1999. ) 由荷兰Spark Holland公司生产的系列仪器“全自动在线固相萃取-液相色谱联用系统”为食品检测行业的用户带来了一种全新的样品前处理技术。该仪器与传统意义的离线手动固相萃取以及目前流行的全自动固相萃取仪器相比,具有颠覆性的创新技术含量,目前已在全球拥有超过1500家的实验室用户。自2009年进入中国市场以来,产品销量成大幅上升趋势,目前已有包括各级国家食品检验检疫机构,临床药代实验室,省级公安毒理实验室,烟草集团理化实验室,环境监测站以及中科院研究院所等超过三十家用户使用该设备进行各种检测项目和方法开发并获得了广泛的好评。
确定
还剩7页未读,是否继续阅读?

产品配置单
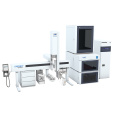
仪真分析仪器有限公司为您提供《小麦中矮壮素检测方案(液相色谱仪)》,该方案主要用于小麦粉中农药残留检测,参考标准--,《小麦中矮壮素检测方案(液相色谱仪)》用到的仪器有超高压液相在线SPE色谱联用系统CHRONECT Symbiosis
推荐专场

相关方案
更多
该厂商其他方案
更多