


方案详情
文
文中介绍了DSC 8000( 或8500) 及 RamanStation™ 400 and RamanFlex™ lines可用于此类样品的研究。
方案详情

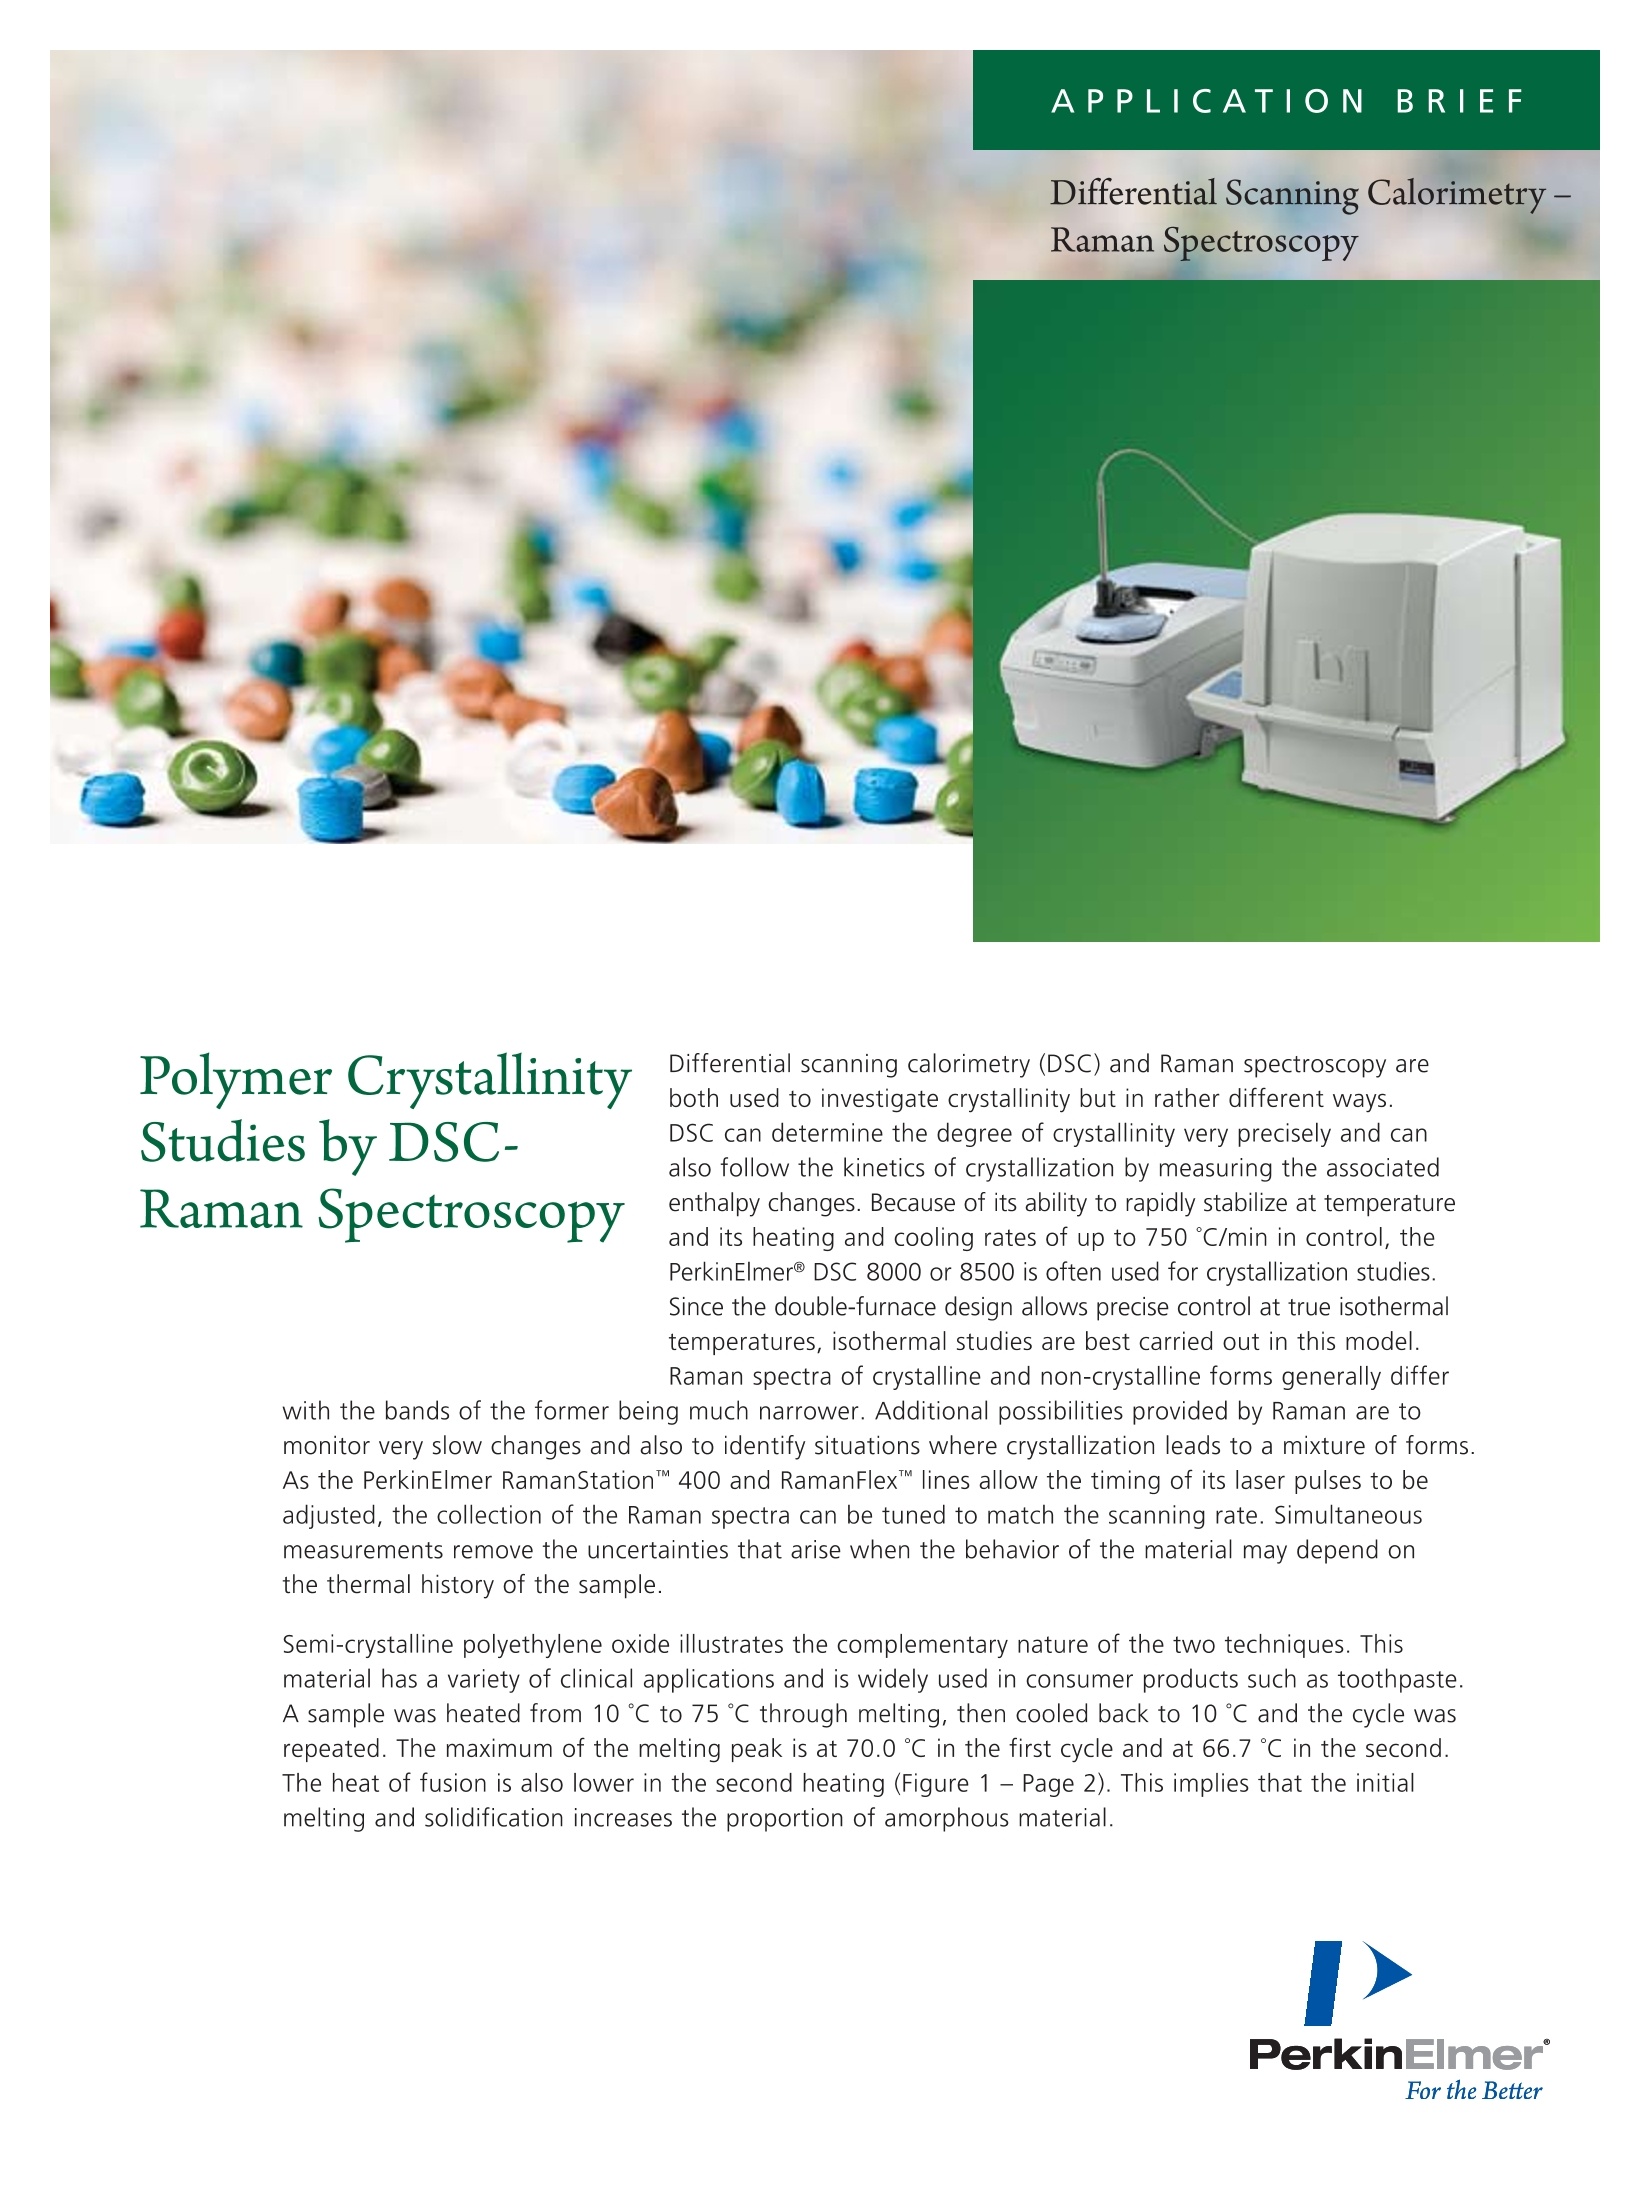
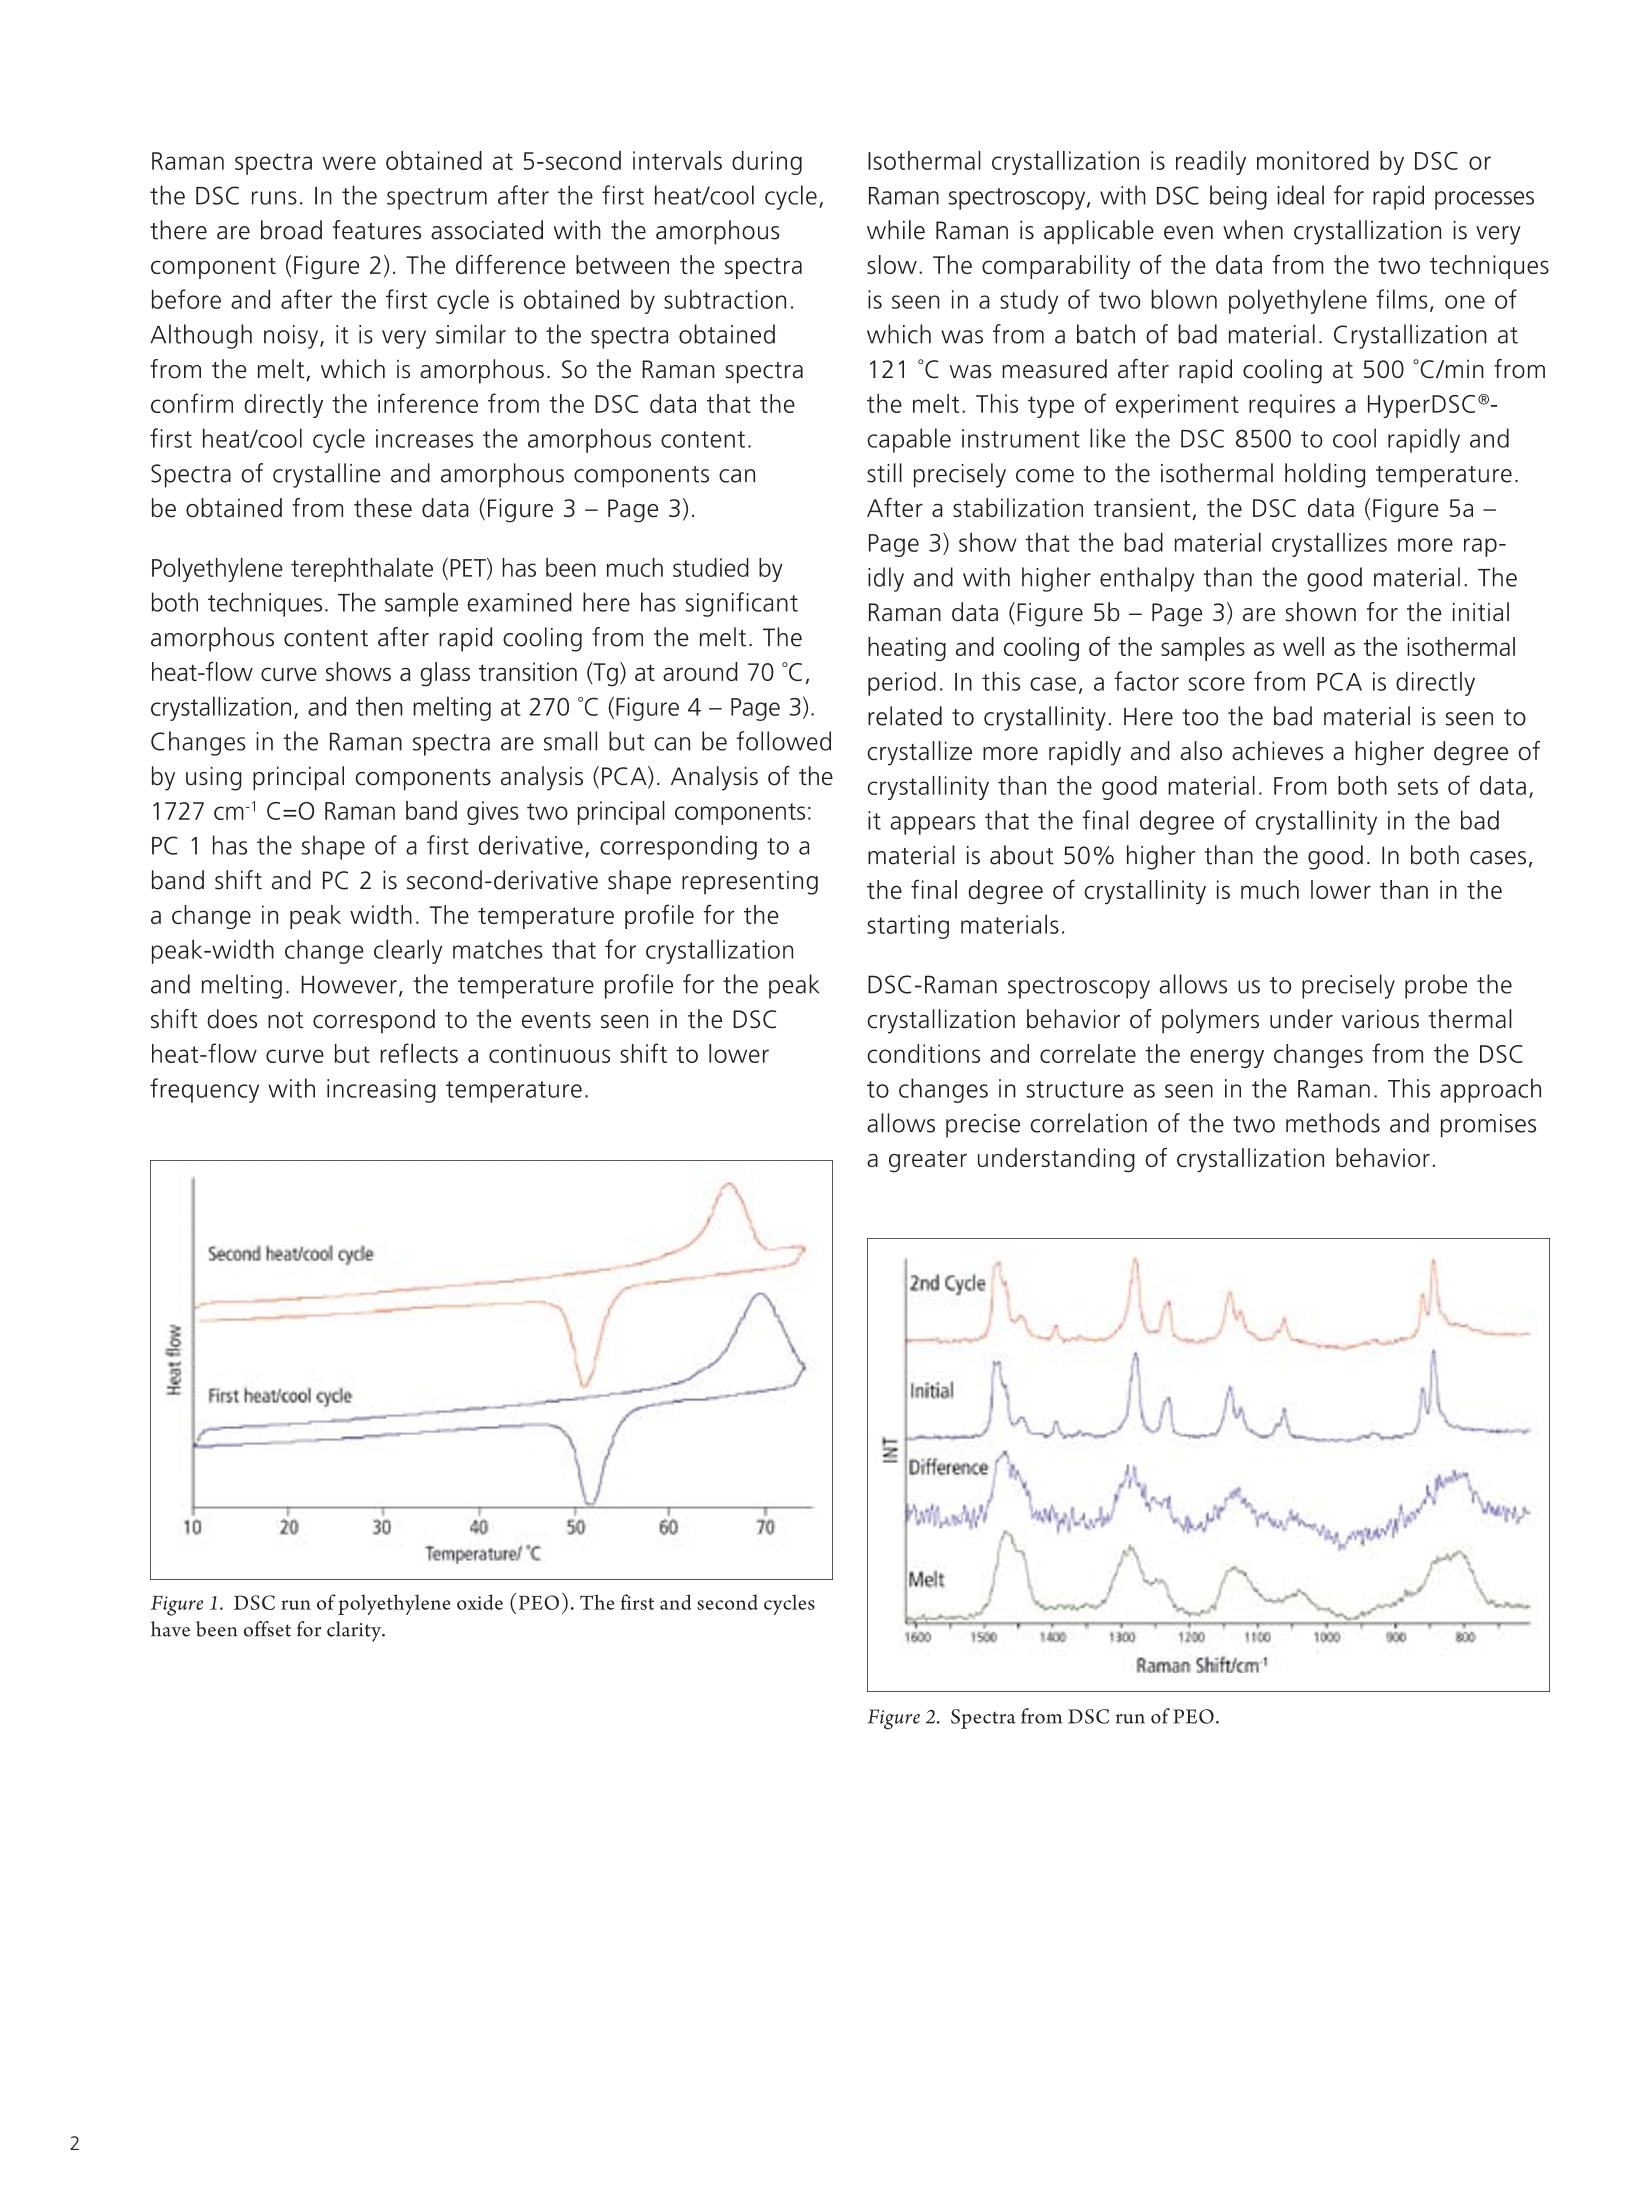
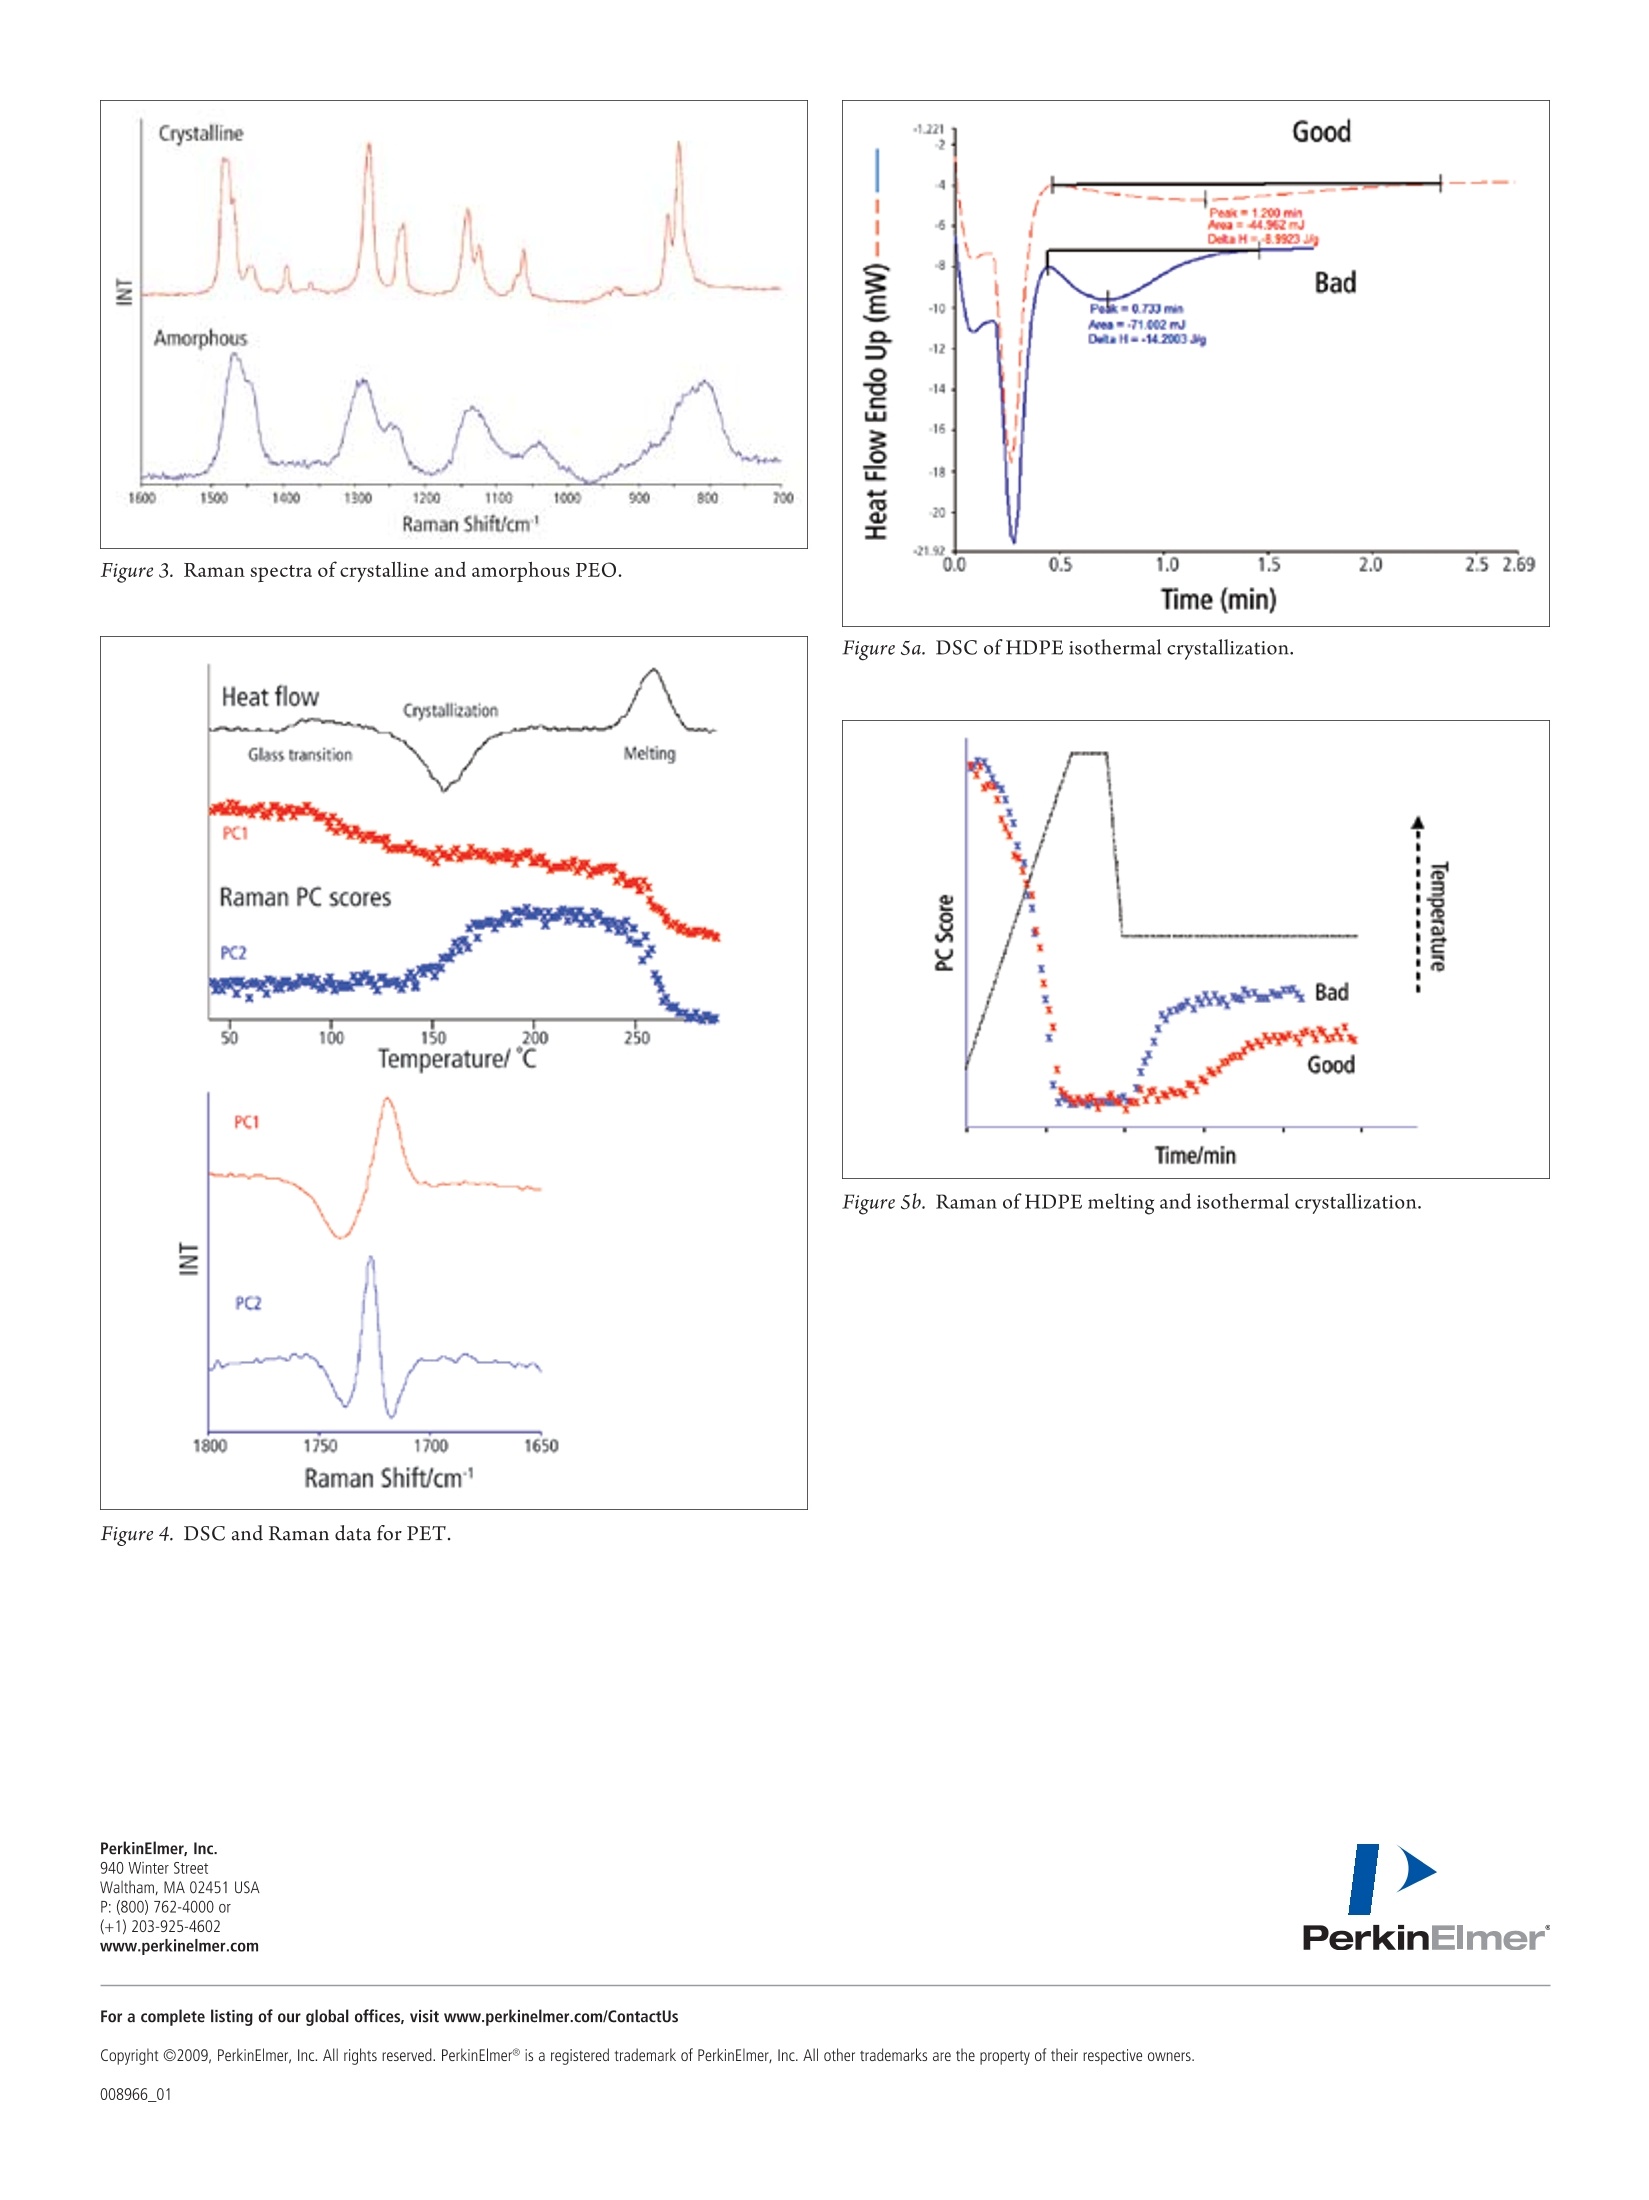
Polymer CrystallinityStudies by DSC-Raman Spectroscopy Differential scanning calorimetry (DSC) and Raman spectroscopy areboth used to investigate crystallinity but in rather different ways.DSC can determine the degree of crystallinity very precisely and canalso follow the kinetics of crystallization by measuring the associatedenthalpy changes. Because of its ability to rapidly stabilize at temperatureand its heating and cooling rates of up to 750 ℃/min in control, thePerkinElmer DSC 8000 or 8500 is often used for crystallization studies.Since the double-furnace design allows precise control at true isothermaltemperatures, isothermal studies are best carried out in this model.Raman spectra of crystalline and non-crystalline forms generally differ with the bands of the former being much narrower. Additional possibilities provided by Raman are tomonitor very slow changes and also to identify situations where crystallization leads to a mixture of forms.As the PerkinElmer RamanStation" 400 and RamanFlexlines allow the timing of its laser pulses to beadjusted, the collection of the Raman spectra can be tuned to match the scanning rate. Simultaneousmeasurements remove the uncertainties that arise when the behavior of the material may depend onthe thermal history of the sample. Semi-crystalline polyethylene oxide illustrates the complementary nature of the two techniques. Thismaterial has a variety of clinical applications and is widely used in consumer products such as toothpaste.A sample was heated from 10℃ to 75℃ through melting, then cooled back to 10℃ and the cycle wasrepeated. The maximum of the melting peak is at 70.0℃ in the first cycle and at 66.7C in the second.The heat of fusion is also lower in the second heating (Figure 1 -Page 2). This implies that the initialmelting and solidification increases the proportion of amorphous material. Raman spectra were obtained at 5-second intervals duringthe DSC runs. In the spectrum after the first heat/cool cycle,there are broad features associated with the amorphouscomponent (Figure 2). The difference between the spectrabefore and after the first cycle is obtained by subtraction.Although noisy, it is very similar to the spectra obtainedfrom the melt, which is amorphous. So the Raman spectraconfirm directly the inference from the DSC data that thefirst heat/cool cycle increases the amorphous content.Spectra of crystalline and amorphous components canbe obtained from these data (Figure 3 - Page 3). Polyethylene terephthalate (PET) has been much studied byboth techniques. The sample examined here has significantamorphous content after rapid cooling from the melt. Theheat-flow curve shows a glass transition (Tg) at around 70℃,crystallization, and then melting at 270℃ (Figure 4- Page 3).Changes in the Raman spectra are small but can be followedby using principal components analysis (PCA). Analysis of the1727 cmC=0 Raman band gives two principal components:PC 1 has the shape of a first derivative, corresponding to aband shift and PC 2 is second-derivative shape representinga change in peak width. The temperature profile for thepeak-width change clearly matches that for crystallizationand melting. However, the temperature profile for the peakshift does not correspond to the events seen in the DSCheat-flow curve but reflects a continuous shift to lowerfrequency with increasing temperature. Figure 1. DSC run of polyethylene oxide (PEO). The first and second cycleshave been offset for clarity. Isothermal crystallization is readily monitored by DSC orRaman spectroscopy, with DSC being ideal for rapid processeswhile Raman is applicable even when crystallization is veryslow. The comparability of the data from the two techniquesis seen in a study of two blown polyethylene films, one ofwhich was from a batch of bad material. Crystallization at121℃ was measured after rapid cooling at 500℃/min fromthe melt. This type of experiment requires a HyperDSC@_capable instrument like the DSC 8500 to cool rapidly andstill precisely come to the isothermal holding temperature.After a stabilization transient, the DSC data (Figure 5a -Page 3) show that the bad material crystallizes more rap-idly and with higher enthalpy than the good material. TheRaman data (Figure 5b - Page 3) are shown for the initialheating and cooling of the samples as well as the isothermalperiod. In this case, a factor score from PCA is directlyrelated to crystallinity. Here too the bad material is seen tocrystallize more rapidly and also achieves a higher degree ofcrystallinity than the good material. From both sets of data,it appears that the final degree of crystallinity in the badmaterial is about 50% higher than the good. In both cases,the final degree of crystallinity is much lower than in thestarting materials. DSC-Raman spectroscopy allows us to precisely probe thecrystallization behavior of polymers under various thermalconditions and correlate the energy changes from the DSCto changes in structure as seen in the Raman. This approachallows precise correlation of the two methods and promisesa greater understanding of crystallization behavior. Figure 2. Spectra from DSC run of PEO. Figure 3. Raman spectra of crystalline and amorphous PEO. Figure Sa. DSC of HDPE isothermal crystallization. Temperature/℃ Figure Sb. Raman of HDPE melting and isothermal crystallization. For a complete listing of our global offices, visit www.perkinelmer.com/ContactUs ( C opyright O 2009, Per k i nEl mer , Inc . A ll rig h t s rese r ved. Perk i nElme r@ is a re gist e red tradem a rk of Pe r ki n E l m e r, Inc . All o t h er tr a demar k s a re the p roperty of t h eir respect i ve o wne r s. )
确定
还剩1页未读,是否继续阅读?

珀金埃尔默企业管理(上海)有限公司为您提供《使用DSC-拉曼光谱仪对聚合物晶体的研究》,该方案主要用于其他中--检测,参考标准--,《使用DSC-拉曼光谱仪对聚合物晶体的研究》用到的仪器有
相关方案
更多
该厂商其他方案
更多