


This Application Note examines the analysis of dust samples using ICP-OES. There were a number of elements of interest, including the alkalis.
ICP-OES is a multi-element technique that allows for the fast analysis of more than 75 elements on the Periodic table.
方案详情

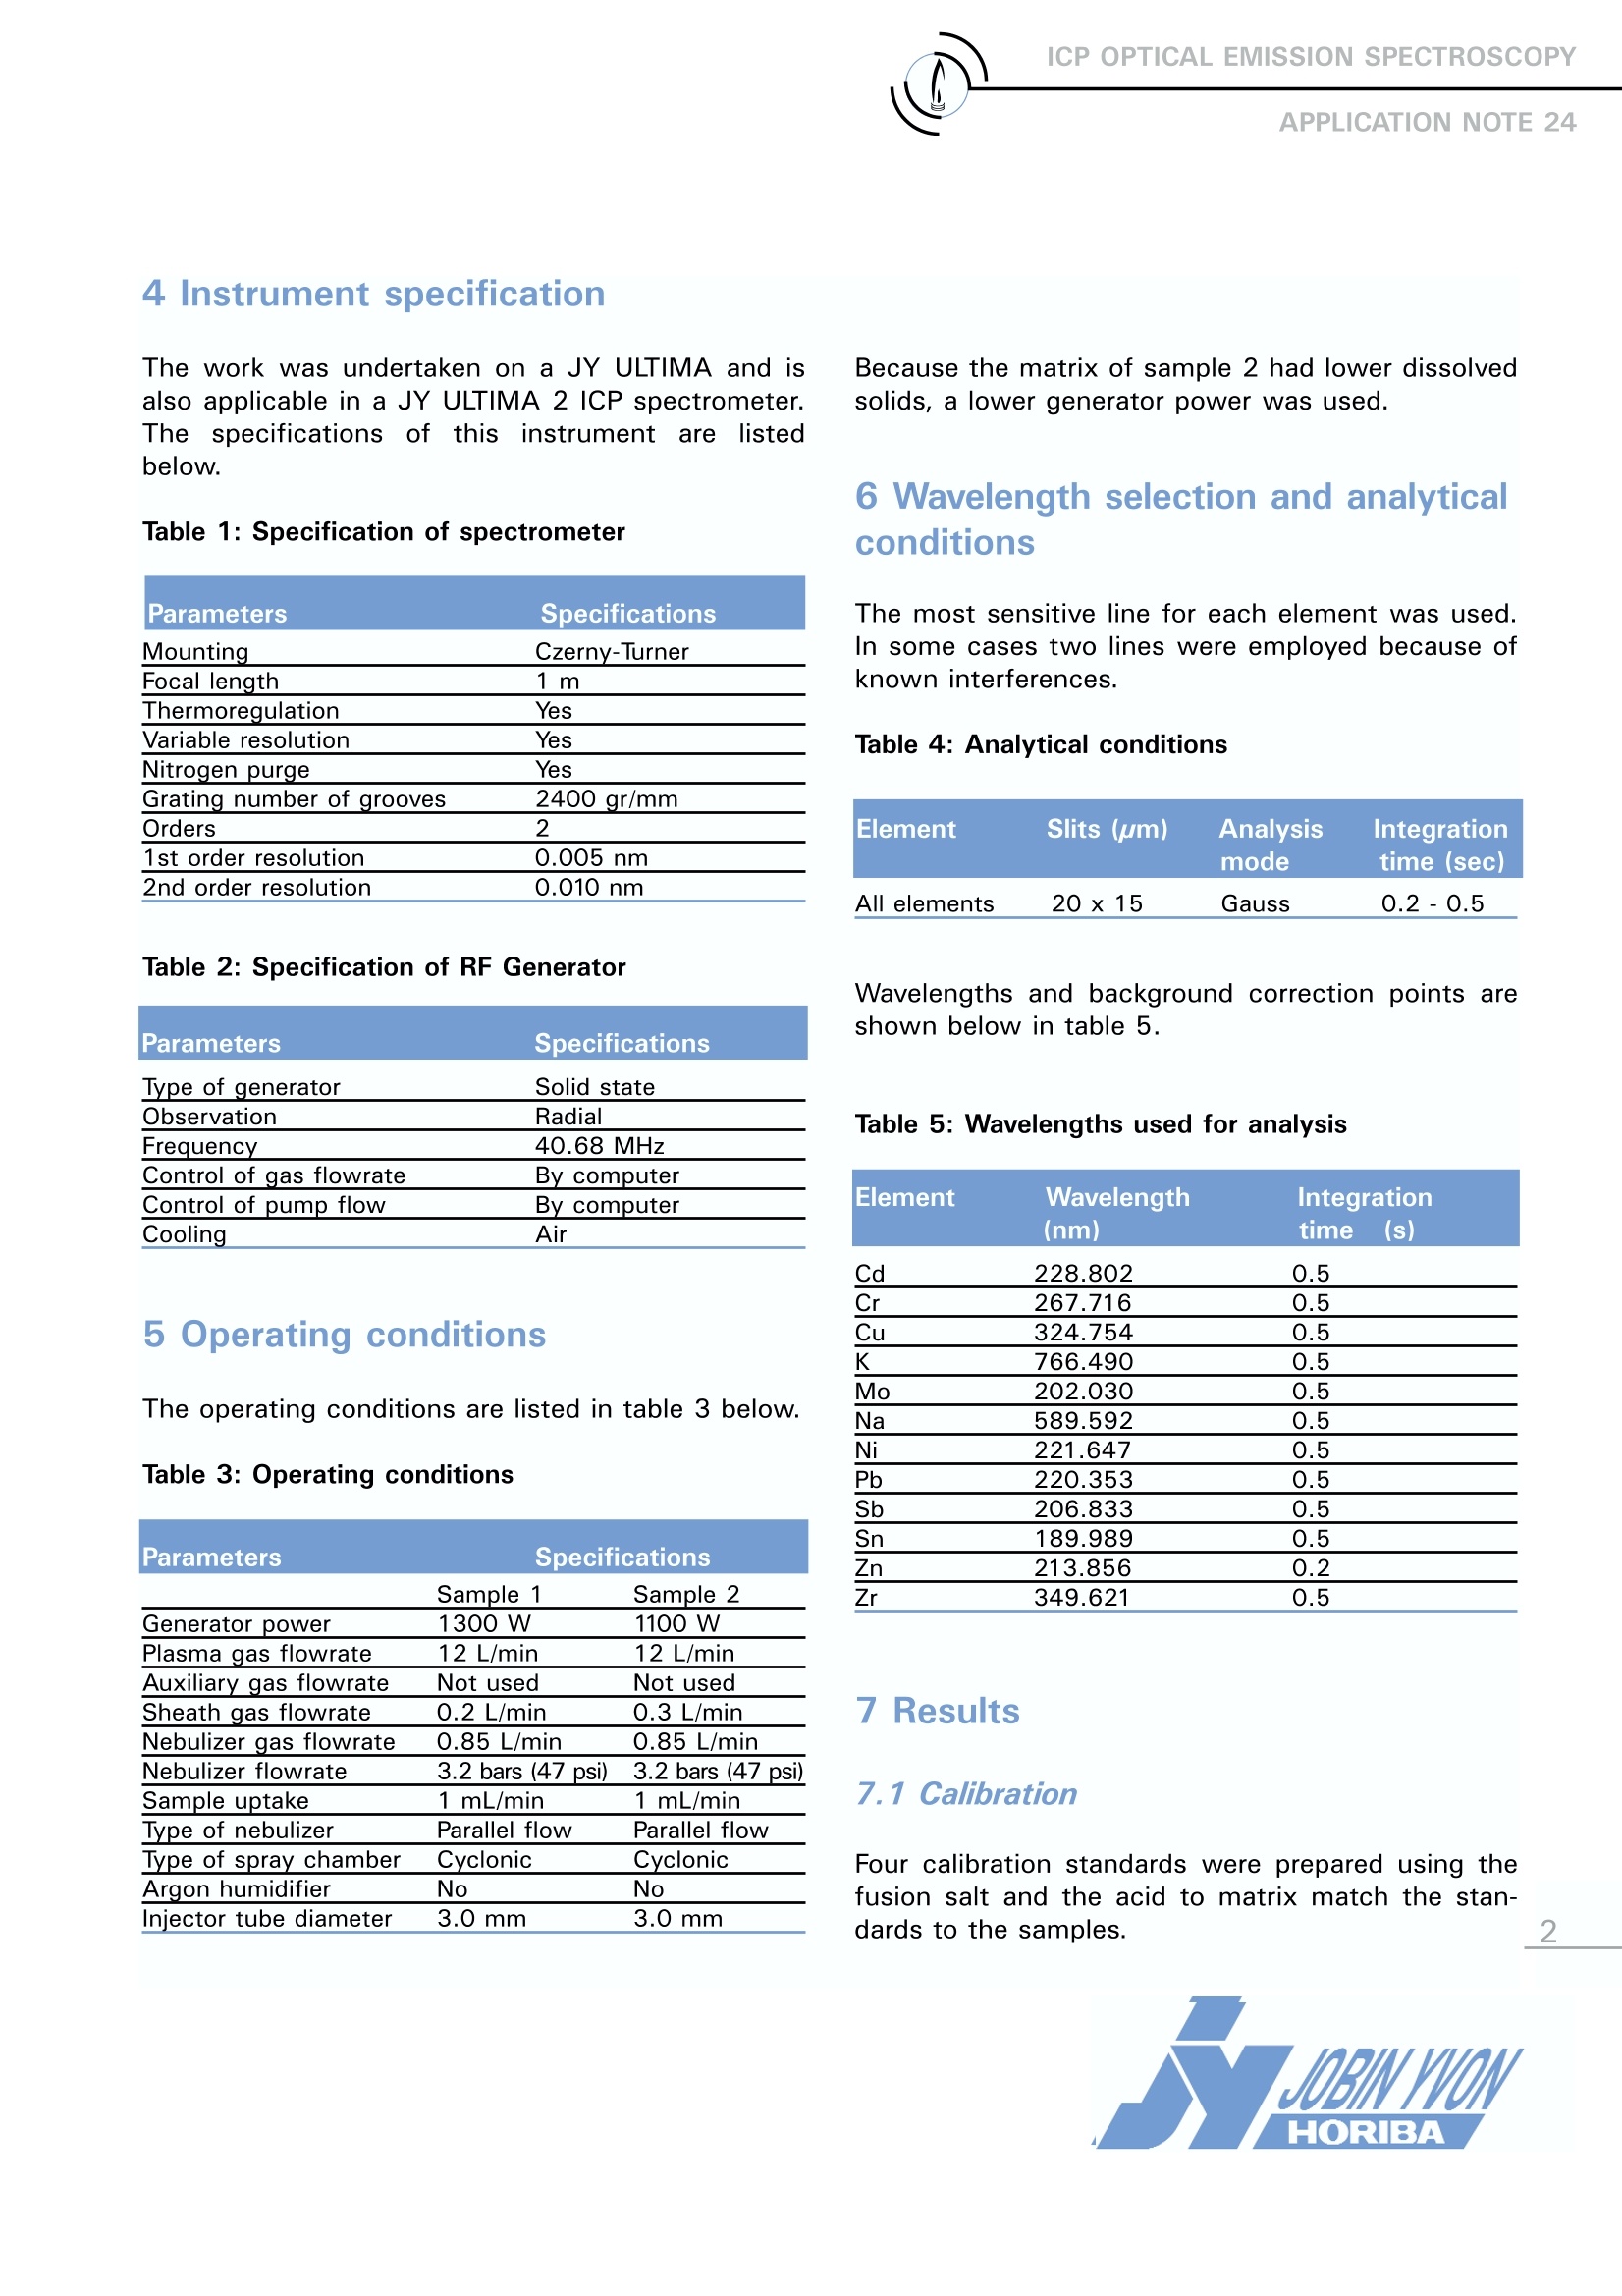
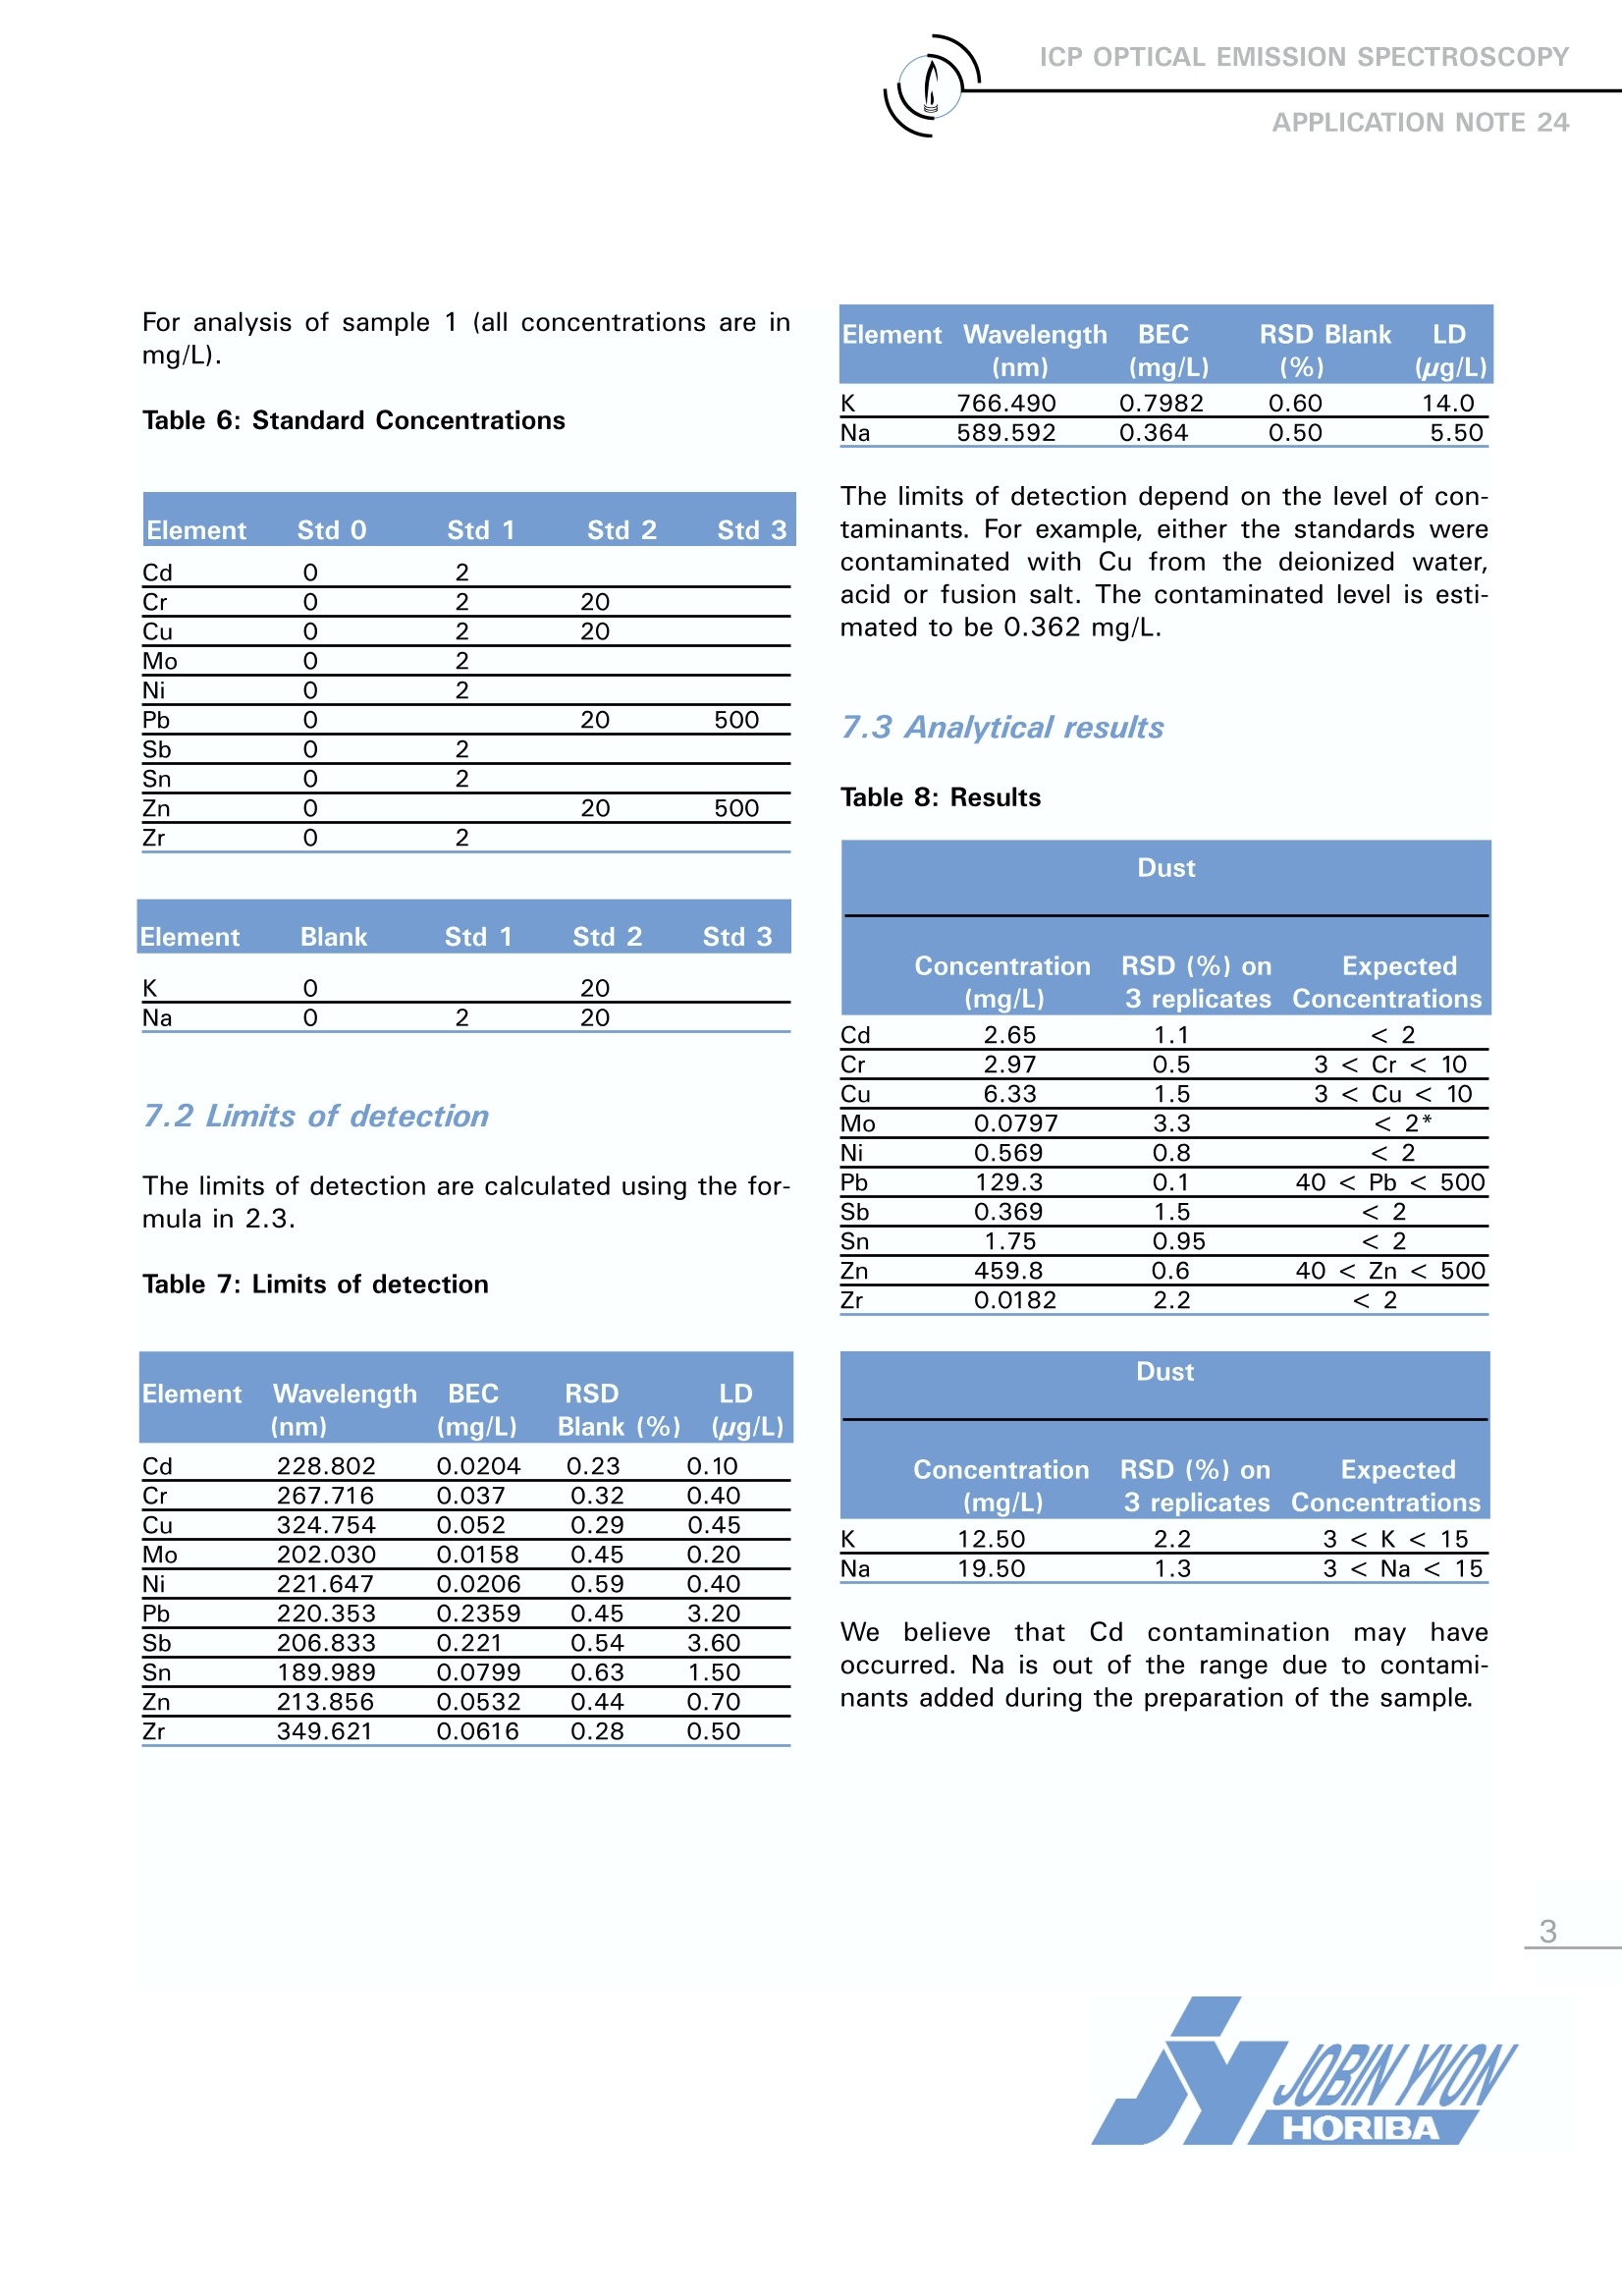
ICP OPTICAL EMISSION SPECTROSCOPYAPPLICATION NOTE 24 Analysis of Dust Samples Agnes COSNIER Jobin Yvon S.A.S., Horiba Group Longjumeau, France Keywords: environment Elements: Cd, Cr, Cu, K, Mo, Na, Ni, Pb, Sb, Sn, Zn, Zr This Application Note examines the analysis ofdust samples using ICP-OES. There were a num-ber of elements of interest, including the alkalis.ICP-OES is a multi-element technique that allowsfor the fast analysis of more than 75 elements onthe Periodic table. 2 Principle 2.1 Technique used The elemental analysis of dust samples wasundertaken by Inductively CoupledPlasmaOptical Emission Spectrometry (ICP-OES).TThesample is nebulized then transferred to an argonplasma. It is decomposed, atomized and ionizedwhereby the atoms and ions are excited. Wemeasure the intensity of the light emitted whenthe atoms or ions return to lower levels of ener-gy. Each element emits light at characteristicwavelengths and these lines can be used forquantitative analysis after a calibration. 2.2 Wavelength choice The choice of the wavelength in a given matrixcan be made using the profile function, or byusing Win-Image, which is rapid semi-quantitativeanalysis mode using multiple wavelengths. Theprinciple is the same in either case: record thescans of analytes at low concentration, and ofthe matrix. By superimposing the spectra, we seepossible interferences. LOD =k*BEC*RSDo The limits of detection are calculated using thefollowing formula: With: LOD limit of detection, k: equals to 3 for the normal 3-sigma values, BEC: Background equivalent concentration, RSDo: relative standard deviation of the blank. To calculate the LOD, a calibration curve is con-structed using two points,0 ppm and 5 ppm, orsome concentration where the calibration is lin-ear. This calibration provides the BEC. The RSDois evaluated by running the blank ten times. 3 Sample preparation Two types of sample preparation were examined.The first method was used for the analysis of Cd,Cr, Cu, Mo, Ni, Pb, Sb, Sn, Zn, and Zr and thesecond for Na and K. The composition of the prepared samples was:Sample 1: -2 g/L of dust salt -0.2g of fusion salt (H3BO3 + K2CO3) -100mL of 65% HNO3 Sample 2:-0.4 g/L of dust salt- 50 mL of 37% HCI The work was undertaken on a JY ULTIMA and isalso applicable in a JY ULTIMA 2 ICP spectrometer.The specifications of1this; instrument arelistedbelow. Table 1: Specification of spectrometer Parameters Specifications Mounting Czerny-Turner Focal length 1m Thermoregulation Yes Variable resolution Yes Nitrogen purge Yes Grating number of grooves 2400 gr/mm Orders 2 1st order resolution 0.005 nm 2nd order resolution 0.010 nm Table 2: Specification of RF Generator Parameters Specifications Type of generator Solid state Observation Radial Frequency 40.68 MHz Control of gas flowrate By computer Control of pump flow By computer Cooling Air 5 Operating conditions The operating conditions are listed in table 3 below. Table 3: Operating conditions Parameters Specifications Sample 1 Sample 2 Generator power 1300 W 1100 W Plasma gas flowrate 12 L/min 12 L/min Auxiliary gas flowrate Not used Not used Sheath gas flowrate 0.2 L/min 0.3 L/min Nebulizer gas flowrate 0.85 L/min 0.85 L/min Nebulizer flowrate 3.2 bars (47 psi) 3.2 bars (47 psi) Sample uptake 1 mL/min 1 mL/min Type of nebulizer Parallel flow Parallel flow Type of spray chamber Cyclonic Cyclonic Argon humidifier No No Injector tube diameter 3.0 mm 3.0 mm Because the matrix of sample 2 had lower dissolvedsolids, a lower generator power was used. 6 Wavelength selection and analyticalconditions The most sensitive line for each element was used.In some cases two lines were employed because ofknown interferences. Table 4: Analytical conditions Element Slits (um) Analysis mode Integration time (sec) All elements 20x 15 Gauss 0.2-0.5 Wavelengths and background correction points areshown below in table 5. Table 5: Wavelengths used for analysis Element Wavelength Integration (nm) time (s) Cd 228.802 0.5 Cr 267.716 0.5 Cu 324.754 0.5 K 766.490 0.5 Mo 202.030 0.5 Na 589.592 0.5 Ni 221.647 0.5 Pb 220.353 0.5 Sb 206.833 0.5 Sn 189.989 0.5 Zn 213.856 0.2 Zr 349.621 0.5 7 Results 7.1 Calibration Four calibration standards were prepared using thefusion salt and the acid to matrix match the stan-dards to the samples. For analysis of sample 1 (all concentrations are inmg/L). Table 6: Standard Concentrations Element Std O Std 1 Std 2 Std 3 Cd 0 2 Cr 0 2 20 Cu 0 2 20 Mo 2 Ni 2 Pb 20 500 Sb 0 2 Sn 0 2 Zn 0 20 500 Zr 0 2 Element Blank Std 1 Std 2 Std 3 K 0 20 Na 0 2 20 7.2 Limits of detection The limits of detection are calculated using the for-mula in 2.3. Table 7: Limits of detection Element Wavelength BEC RSD LD (nm) (mg/L) Blank (%) (wug/L) Cd 228.802 0.0204 0.23 0.10 Cr 267.716 0.037 0.32 0.40 Cu 324.754 0.052 0.29 0.45 Mo 202.030 0.0158 0.45 0.20 Ni 221.647 0.0206 0.59 0.40 Pb 220.353 0.2359 0.45 3.20 Sb 206.833 0.221 0.54 3.60 Sn 189.989 0.0799 0.63 1.50 Zn 213.856 0.0532 0.44 0.70 Zr 349.621 0.0616 0.28 0.50 Element VWavelength BEC RSD Blank LD (nm) (mg/L) (%) (ug/L) K 766.490 0.7982 0.60 14.0 Na 589.592 0.364 0.50 5.50 The limits of detection depend on the level of con-taminants. For example, either the standards werecontaminated with Cu from the deionized water,acid or fusion salt. The contaminated level is esti-mated to be 0.362 mg/L. 7.3 Analytical results Table 8: Results Concentration RSD (%) on Expected (mg/L) 3 replicates Concentrations Cd 2.65 1.1 <2 Cr 2.97 0.5 3
确定
还剩2页未读,是否继续阅读?

产品配置单

HORIBA(中国)为您提供《灰尘中(类)金属及其化合物检测方案 》,该方案主要用于空气中(类)金属及其化合物检测,参考标准--,《灰尘中(类)金属及其化合物检测方案 》用到的仪器有HORIBA Ultima Expert高性能ICP光谱仪
推荐专场
相关方案
更多
该厂商其他方案
更多