


方案详情
文
Dialysis is a method of removing toxic substances (impuritities or wastes) from the blood when the kidneys are unable to do so. ICP-OES
is particularly suitable to measure the dialysis solutions for the high accuracy analysis of Na, K,Ca, Mg and Cl. This Application Note presents the preparation and analysis results of two dialysis
samples.
方案详情

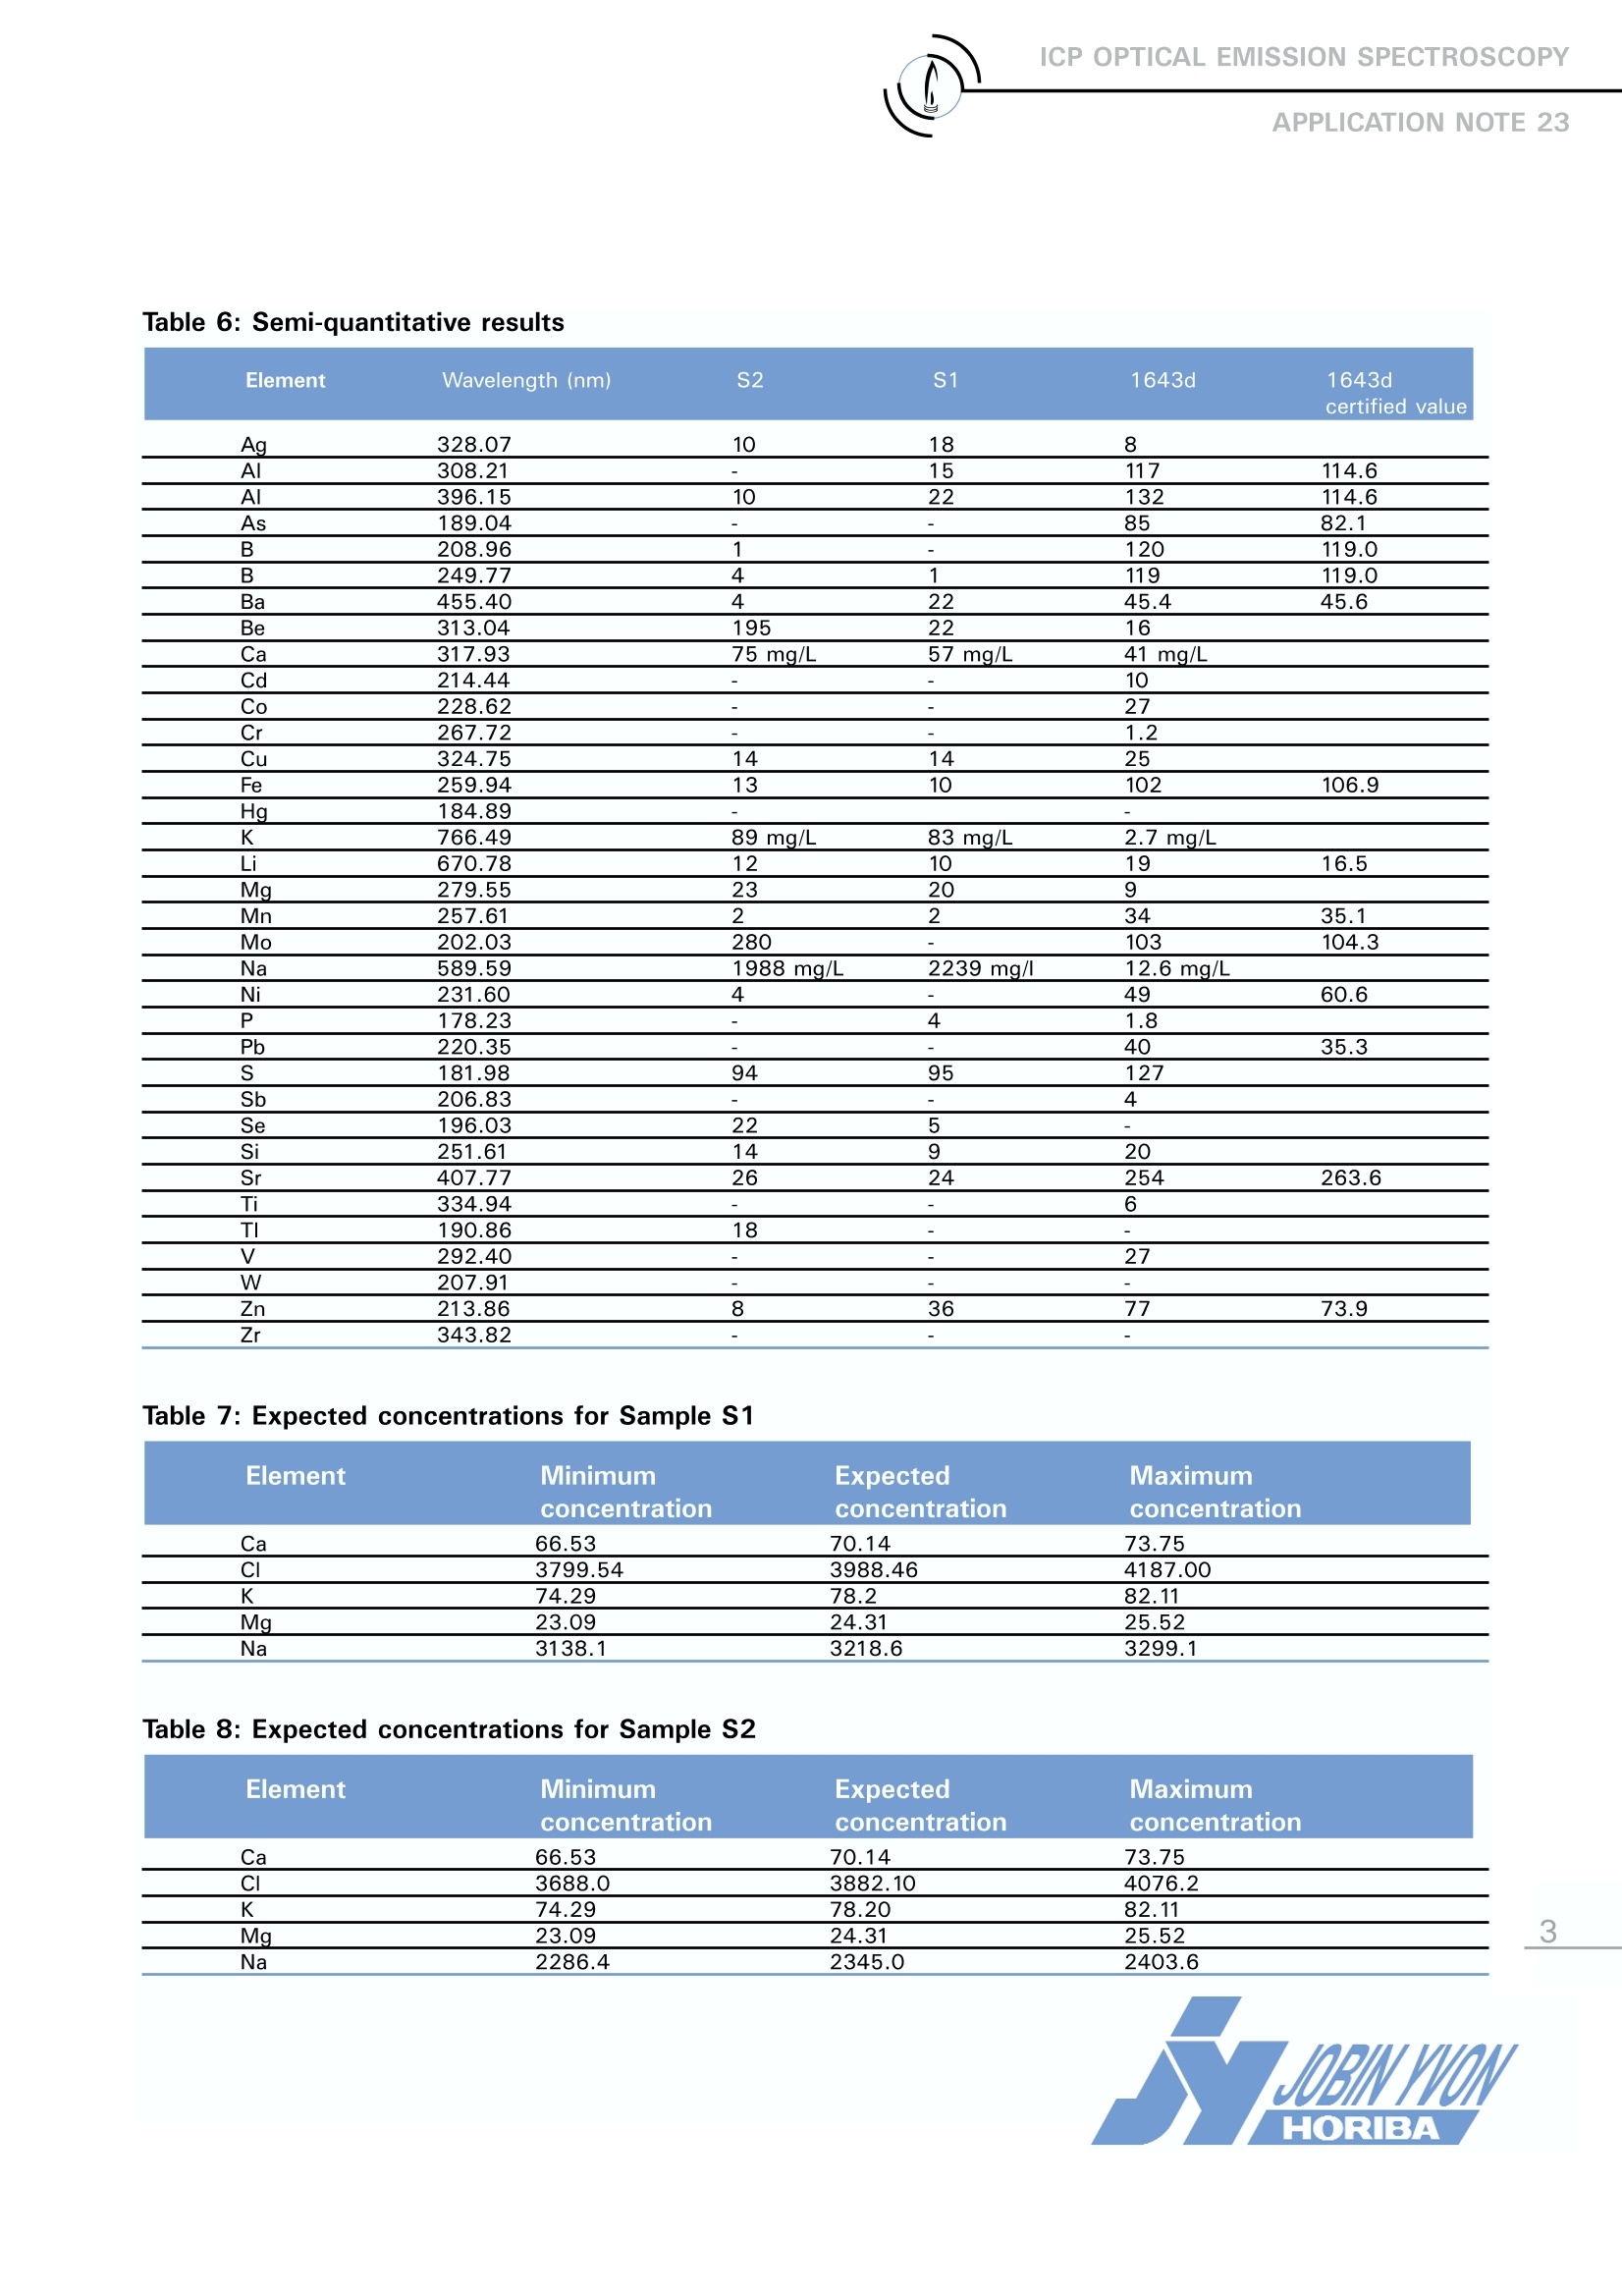
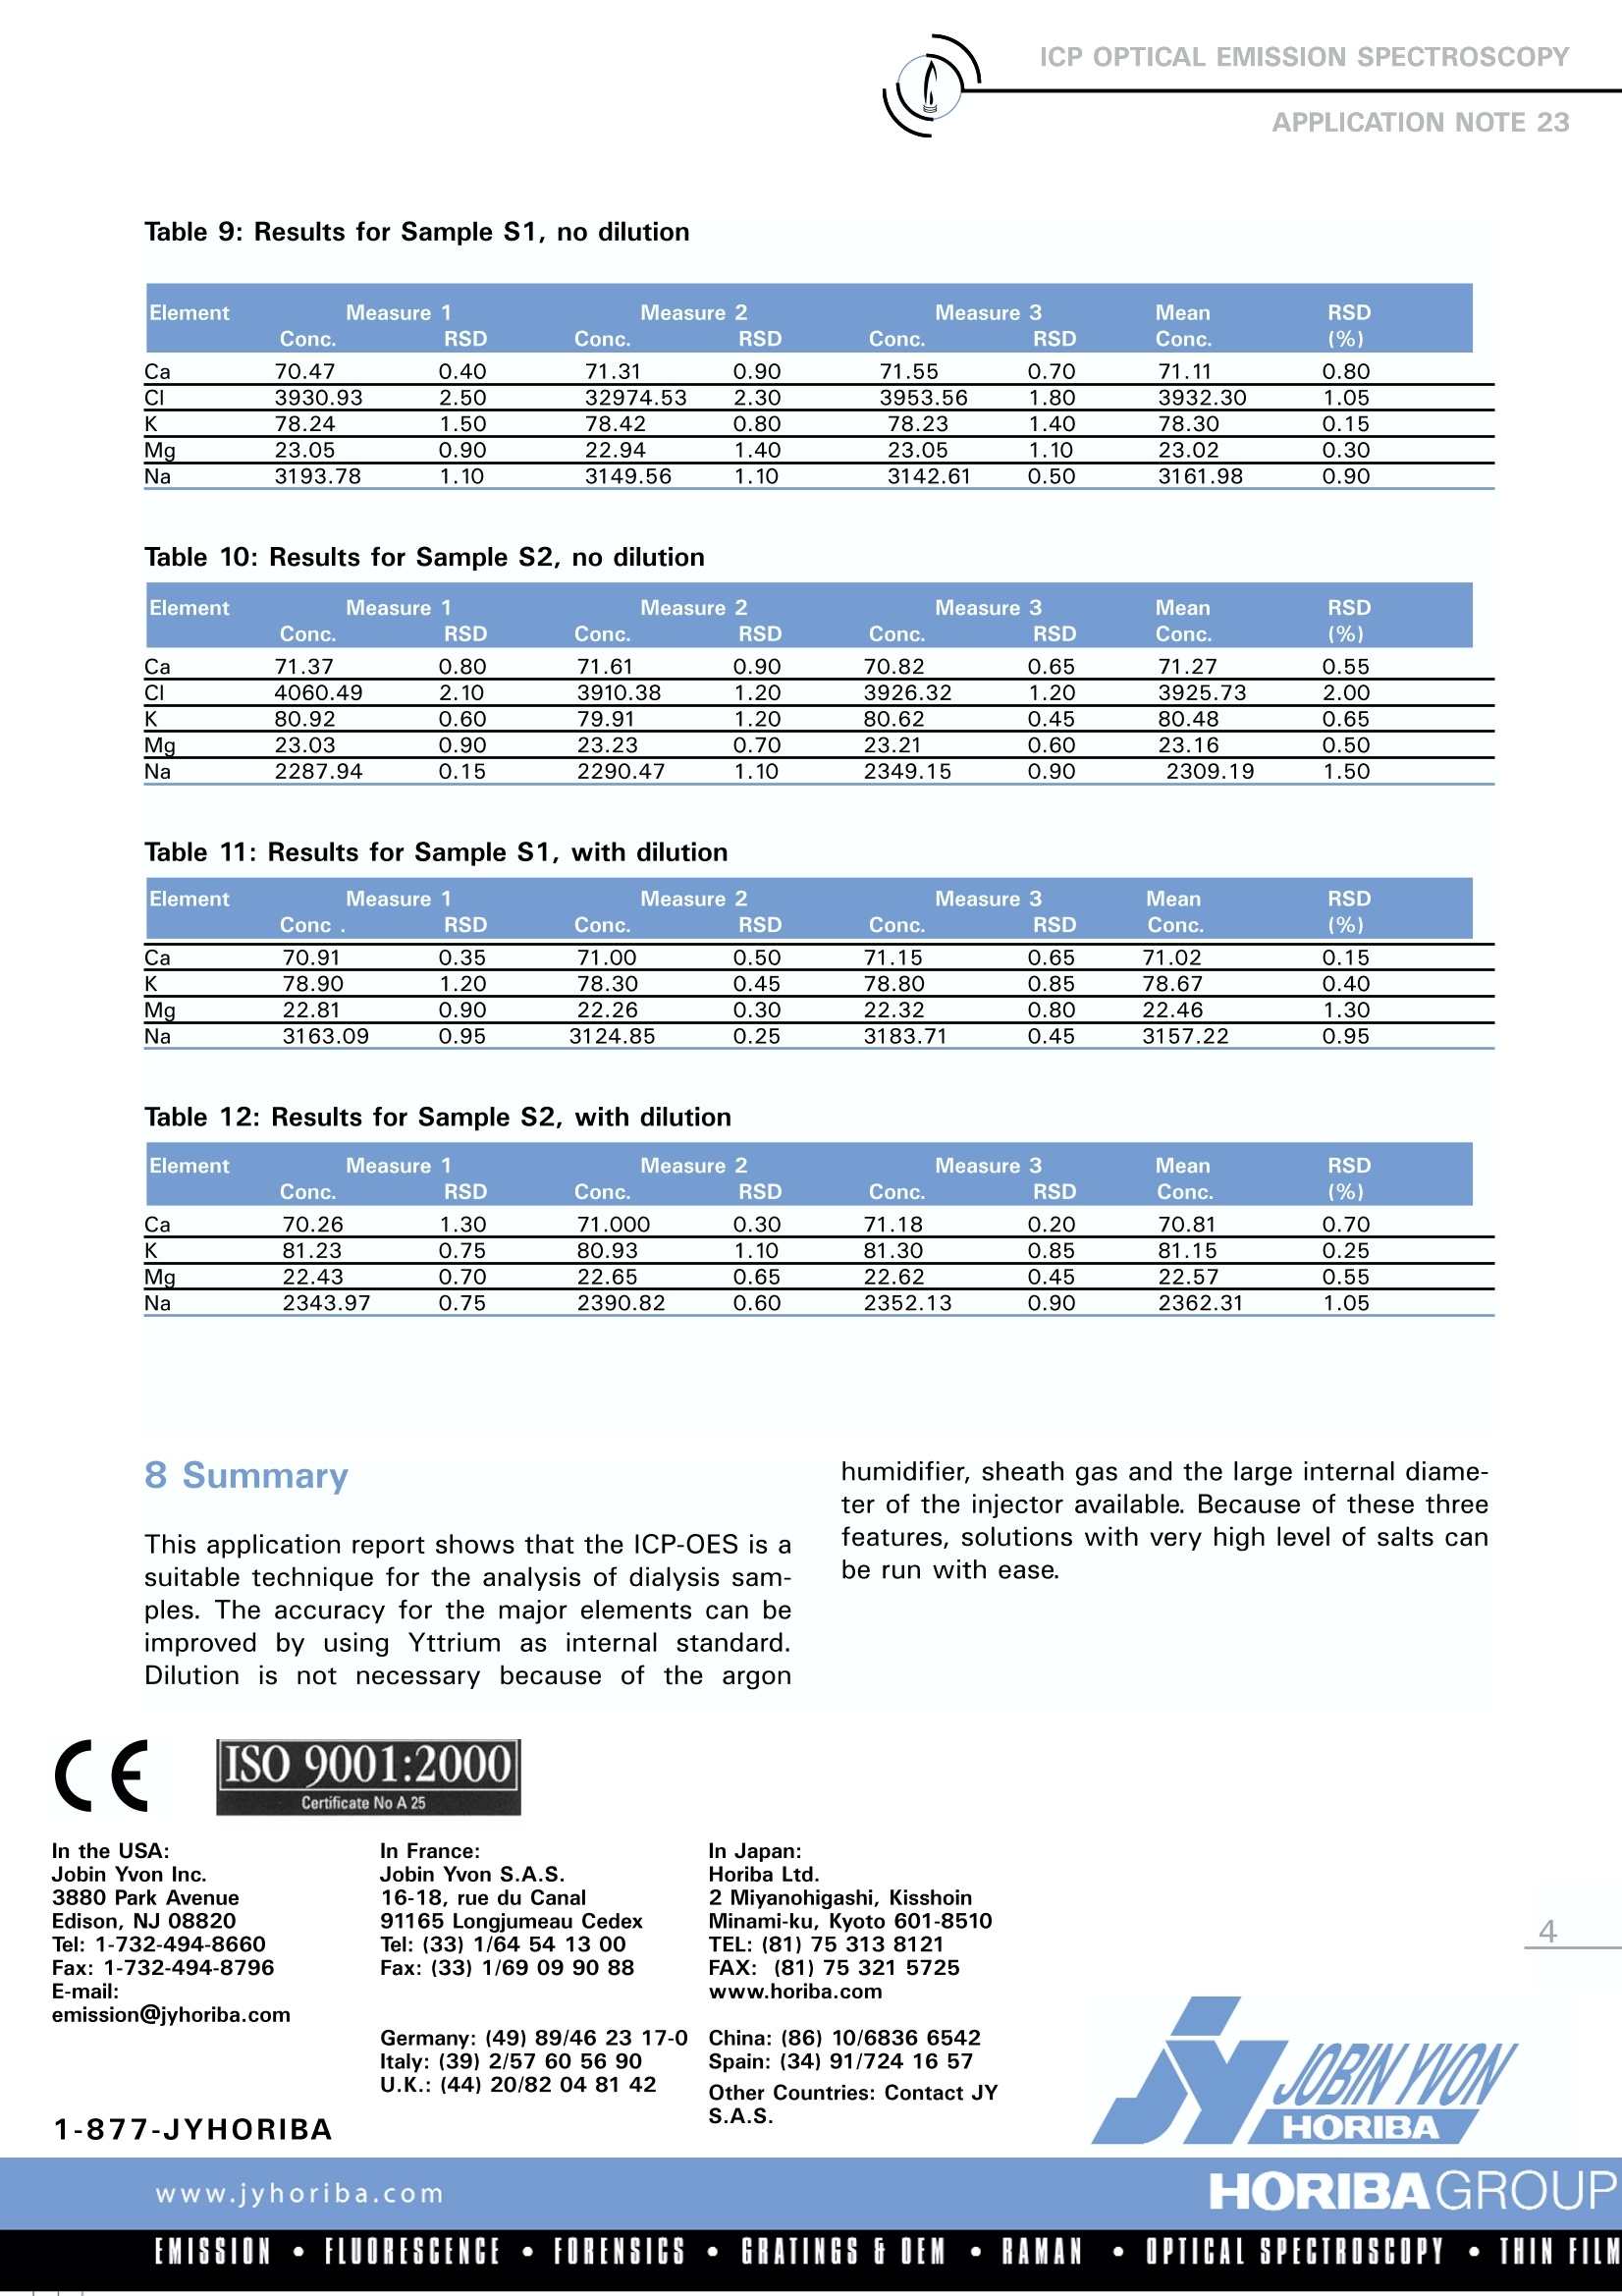
ICP OPTICAL EMISSION SPECTROSCOPY ICP OPTICAL EMISSION SPECTROSCOPY.APPLICATION NOTE 23 Analysis of Dialysis Agnes Cosnier Jobin Yvon S.A.S., Horiba Group Longjumeau, France Keywords: biology 1 Introduction Dialysis is a method of removing toxic sub-stances (impuritities or wastes) from the bloodwhen the kidneys are unable to do so. ICP-OESis particularly suitable to measure the dialysissolutions for the high accuracy analysis of Na, K,Ca, Mg and Cl. This Application Note presentsthe preparation and analysis results of two dialy-sis samples. 2 Principle 2.1 Technique used The elemental analysis of these samples wasundertakenby lnductively CoupledPlasmaOptical Emission Spectrometry (ICP-OES). Thesample is nebulized then transferred to an argonplasma. It is decomposed, atomized and ionizedwhereby the atoms and ions are excited. Wemeasure the intensity of the light emitted whenthe atoms or ions return to lower levels of ener-9y. Each element emits light at characteristicwavelengths and these lines can be used forquantitative analysis after a calibration. 2.2 Wavelength choice The choice of the wavelength in a given matrixcan be made using the "profile"function, or byusing Win-IMAGE, which is rapid semi-quantita-tive analysis mode using multiple wavelengths.The principle is the same in either case: recordthe scans of analytes at low concentration, andof the matrix. By superimposing the spectra, wesee possible interferences. 3 Sample preparation Two dialysis samples were analyzed, labeled S1and S2. These samples contain K, Ca, and Mg inthe chloride form. In sample S1, Na is present asa mixture of chloride and acetate. It is at a totalconcentration of 140 mmol/L, with the acetatecompound concentration of 35 mmol/L. In S2, the Na is present as the chloride and is at a con-centration of 102 mmol/L. As the level of acetate is considered as negligible,a solution of NaCl 6 g/L (105 mmoles/L) was pre-pared to matrix match the standards. Four stan-dards for K, Ca and Mg were prepared with 250ml of the Na solution and using 1,000 mg/LSpex Standards. Four standards were also pre-pared for Na and Cl at concentrations of 5, 6, 7and 8.2 g/L of NaCl. 4. Instrument specification The work in this Application Note was undertak-en on a JY 2000. The specifications of thisinstrument are listed in Tables 1 and 2. Table 1: Specification of spectrometer Parameters Specifications Mounting Czerny Turner Focal length 0.64 m Nitrogen purge Yes Variable resolution Yes Grating number of grooves 2400 gr/mm 1st order resolution 0.016 nm Table 2: Specification of RF Generator Parameters Specifications Type of generator Solid state Observation Radial Frequency 40.68 MHz Control of gas flowrate by computer Control of pump flow by computer air (*: SpexCertiprep www.certiprep.com) 5 Operating conditions Two series of analyses were made. The first was adirect analysis, without dilution and the second waswith a 1:10 dilution using deionized water.The operating conditions are listed in Table 3 below. Table 3: Operating conditions Parameter No dilution Dilution RF Generator power 1400 W 1400 W Plasma gas flowrate 13 L/min 13 L/min Auxiliary gas flowrate 0.4 L/min 0 L/min Sheath gas flowrate 0.35 L/min 0.2 L/min Nebulizer gas flowrate 0.67 L/min 0.67 L/min Nebulizer flowrate 2.8 bars (41 psi) 2.8 bars(41 psi) Sample uptake 1 mL/min 1mL/min Type of nebulizer Concentric Concentric Type of spray chamber Cyclonic Cyclonic Argon humidifier Yes Yes Injector tube diameter 3.0 mm 3.0 mm 6 Wavelength selection and analyti-cal conditions The line with the highest sensitivity was used foranalysis of each element, as there were no prob-lems with interferences. The analysis conditionswere the same for all elements. Table 4: Analytical conditions Element Slits Analysis Integration (um) mode time (sec) All elements 20 x 15 Gaussian 2 Table 5: Background correction Element Wavelength (nm) Background correction (nm) Ca 317.933 0.0325 CI 725.665 0.0233 K 769.898 0.0372 Mg 279.806 0.0349 Na 588.995 0.0381 .7.1 Semi-quantitative analysis The semi-quantitative method allows for the deter-mination of 36 elements in less than three minutes.Background correction is used for each element tocompensate for background shifts caused by matrixor acidity differences. Table 6 on the following pagegives the result, expressed in ug/L (except whereindicated) obtained for the semi-quantitative analy-sis and for a certified sample (NBS 1643d). An alternative to the semi-quantitative method is anoption called Win-IMAGE, which offers full spec-trum acquisition within 2 minutes. Full spectrumacquisition gives the capability to undertake a semi-quantitative analysis, to perform retrospectiveanalysis and to use multiple wavelengths for ananalysis of an element to improve accuracy. 7.2 Results The two samples were measured three times eachwith three replicates for each measurement, bothdirectly and with a dilution of 1:10. The results arepresented in Tables 7 to 12, with the concentra-tions given in mg/l and the RSD in % The Cl was not measured in the diluted samplesbecause the 725 nm CI line was not sufficientlysensitive. In the diluted samples, the far UV optionwould be necessaryto measure the Cl at the 134nm line. This is the most sensitive line for Cl andgives an LOD < 1000 ppb on the JY 2000, and <200 ppb for the ULTIMA Table 6: Semi-quantitative results Table 7: Expected concentrations for Sample S1 Element Minimum Expected Maximum concentration concentration concentration Ca 66.53 70.14 73.75 CI 3799.54 3988.46 4187.00 K 74.29 78.2 82.11 Mg 23.09 24.31 25.52 Na 3138.1 3218.6 3299.1 Table 8: Expected concentrations for Sample S2 Element Minimum Expected Maximum concentration concentration concentration Ca 66.53 70.14 73.75 CI 3688.0 3882.10 4076.2 K 74.29 78.20 82.11 Mg 23.09 24.31 25.52 Na 2286.4 2345.0 2403.6 WBNWON HORIBA Element Measure 1 Measure 2 Measure 3 Mean RSD Conc. RSD Conc. RSD Conc. RSD Conc. (%) Ca 70.47 0.40 71.31 0.90 71.55 0.70 71.11 0.80 CI 3930.93 2.50 32974.53 2.30 3953.56 1.80 3932.30 1.05 K 78.24 1.50 78.42 0.80 78.23 1.40 78.30 0.15 Mg 23.05 0.90 22.94 1.40 23.05 1.10 23.02 0.30 Na 3193.78 1.10 3149.56 1.10 3142.61 0.50 3161.98 0.90 Table 10: Results for Sample S2, no dilution Element Measure 1 Measure 2 Measure 3 Mean RSD Conc. RSD Conc. RSD Conc. RSD Conc. (%) Ca 71.37 0.80 71.61 0.90 70.82 0.65 71.27 0.55 CI 4060.49 2.10 3910.38 1.20 3926.32 1.20 3925.73 2.00 K 80.92 0.60 79.91 1.20 80.62 0.45 80.48 0.65 Mg 23.03 0.90 23.23 0.70 23.21 0.60 23.16 0.50 Na 2287.94 0.15 2290.47 1.10 2349.15 0.90 2309.19 1.50 Table 11: Results for Sample S1, with dilution Element Measure 1 Measure 2 Measure 3 Mean RSD Conc. RSD Conc. RSD Conc. RSD Conc. (%) Ca 70.91 0.35 71.00 0.50 71.15 0.65 71.02 0.15 K 78.90 1.20 78.30 0.45 78.80 0.85 78.67 0.40 Mg 22.81 0.90 22.26 0.30 22.32 0.80 22.46 1.30 Na 3163.09 0.95 3124.85 0.25 3183.71 0.45 3157.22 0.95 Table 12: Results for Sample S2, with dilution Element Measure 1 Measure 2 Measure 3 Mean RSD Conc. RSD Conc. RSD Conc. RSD Conc. (%) Ca 70.26 1.30 71.000 0.30 71.18 0.20 70.81 0.70 K 81.23 0.75 80.93 1.10 81.30 0.85 81.15 0.25 Mg 22.43 0.70 22.65 0.65 22.62 0.45 22.57 0.55 Na 2343.97 0.75 2390.82 0.60 2352.13 0.90 2362.31 1.05 8 Summary This application report shows that the ICP-OES is asuitable technique for the analysis of dialysis sam-ples. The accuracy for the major elements can beimproved by using Yttrium as internal standard.Dilution is not necessary because of the argon humidifier, sheath gas and the large internal diame-ter of the injector available. Because of these threefeatures, solutions with very high level of salts canbe run with ease.
确定

还剩2页未读,是否继续阅读?

产品配置单

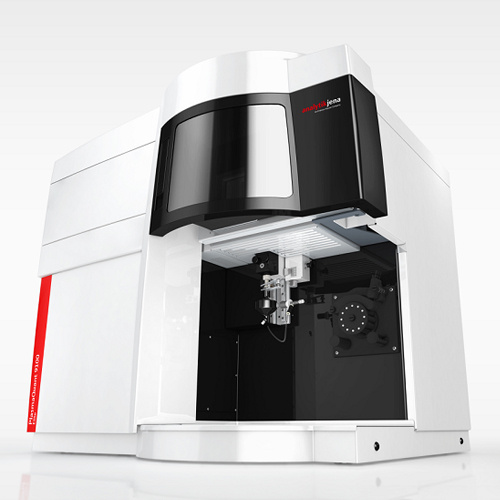
HORIBA(中国)为您提供《渗析液中主要成分分析检测方案(ICP-AES)》,该方案主要用于其他中主要成分分析检测,参考标准--,《渗析液中主要成分分析检测方案(ICP-AES)》用到的仪器有HORIBA Ultima Expert高性能ICP光谱仪
推荐专场
相关方案
更多
该厂商其他方案
更多