


方案详情
文
虽然目前的程序相对简单,但目的是确定香豆素在相关油中的浓度。本应用说明介绍了一个高灵敏度的系统,将浓度检测限提高到1%以下,并减少了定量限。
关键词:FP-6300,荧光,材料,滤波器组
方案详情

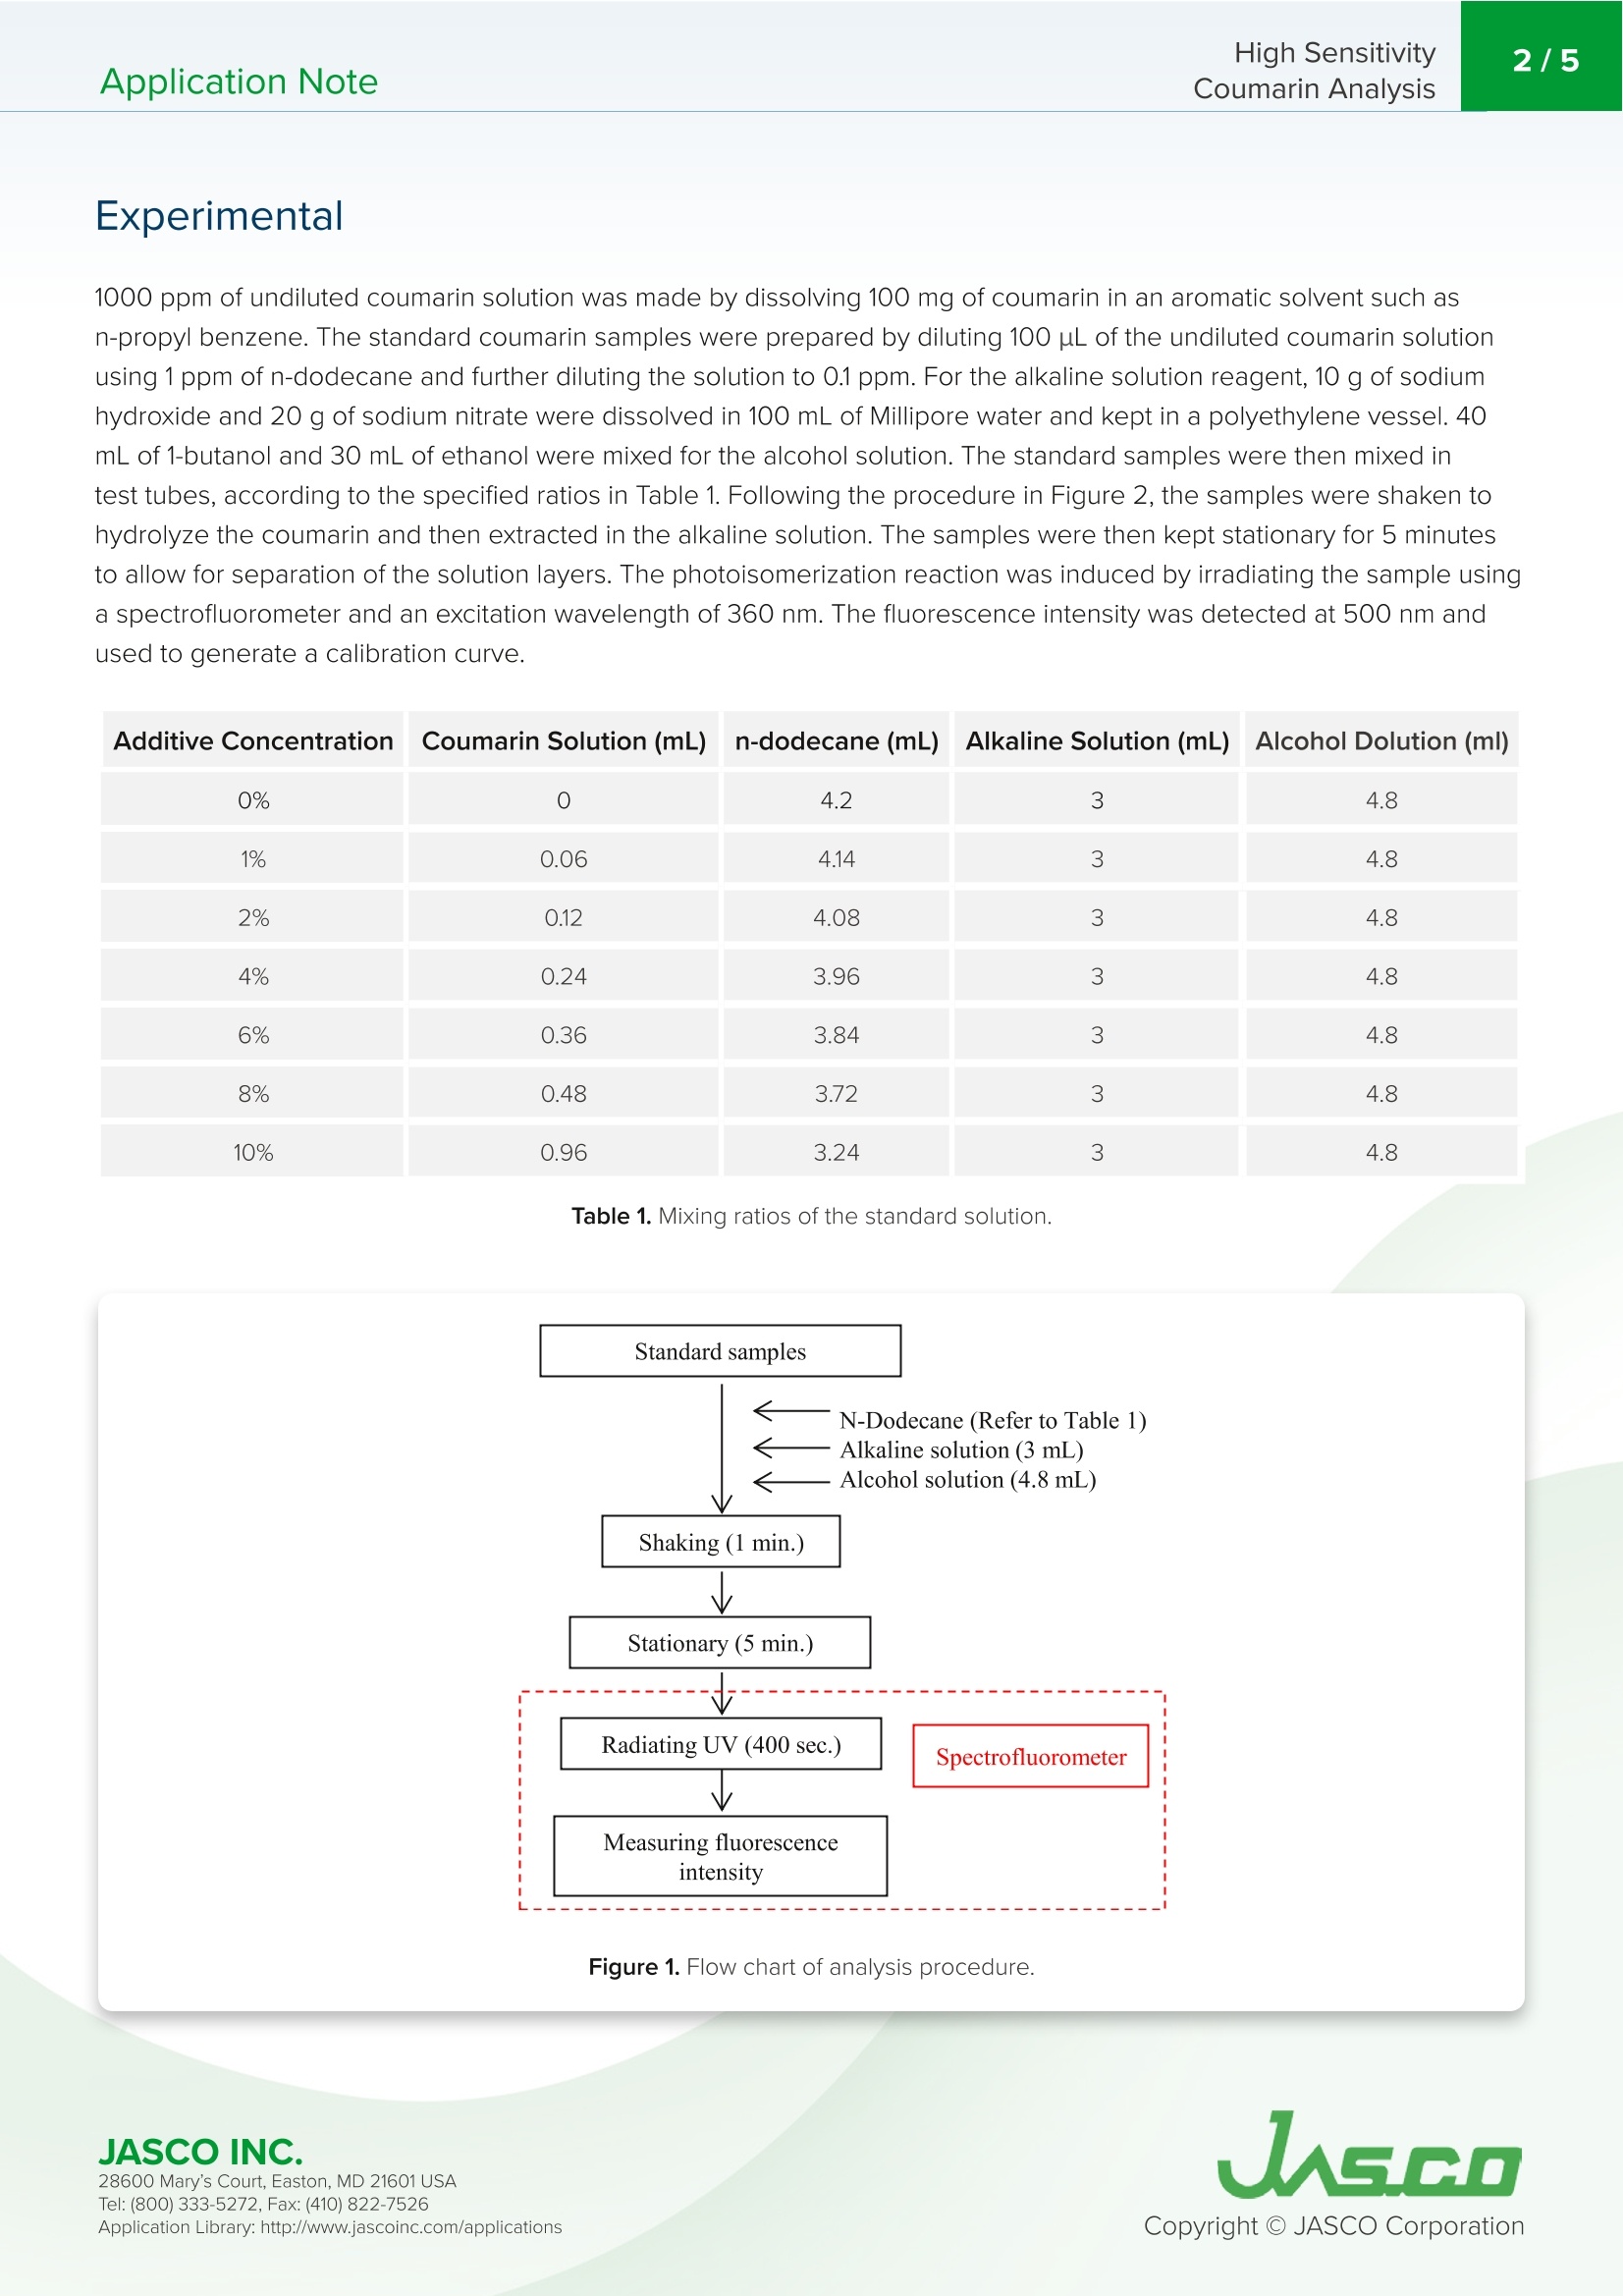
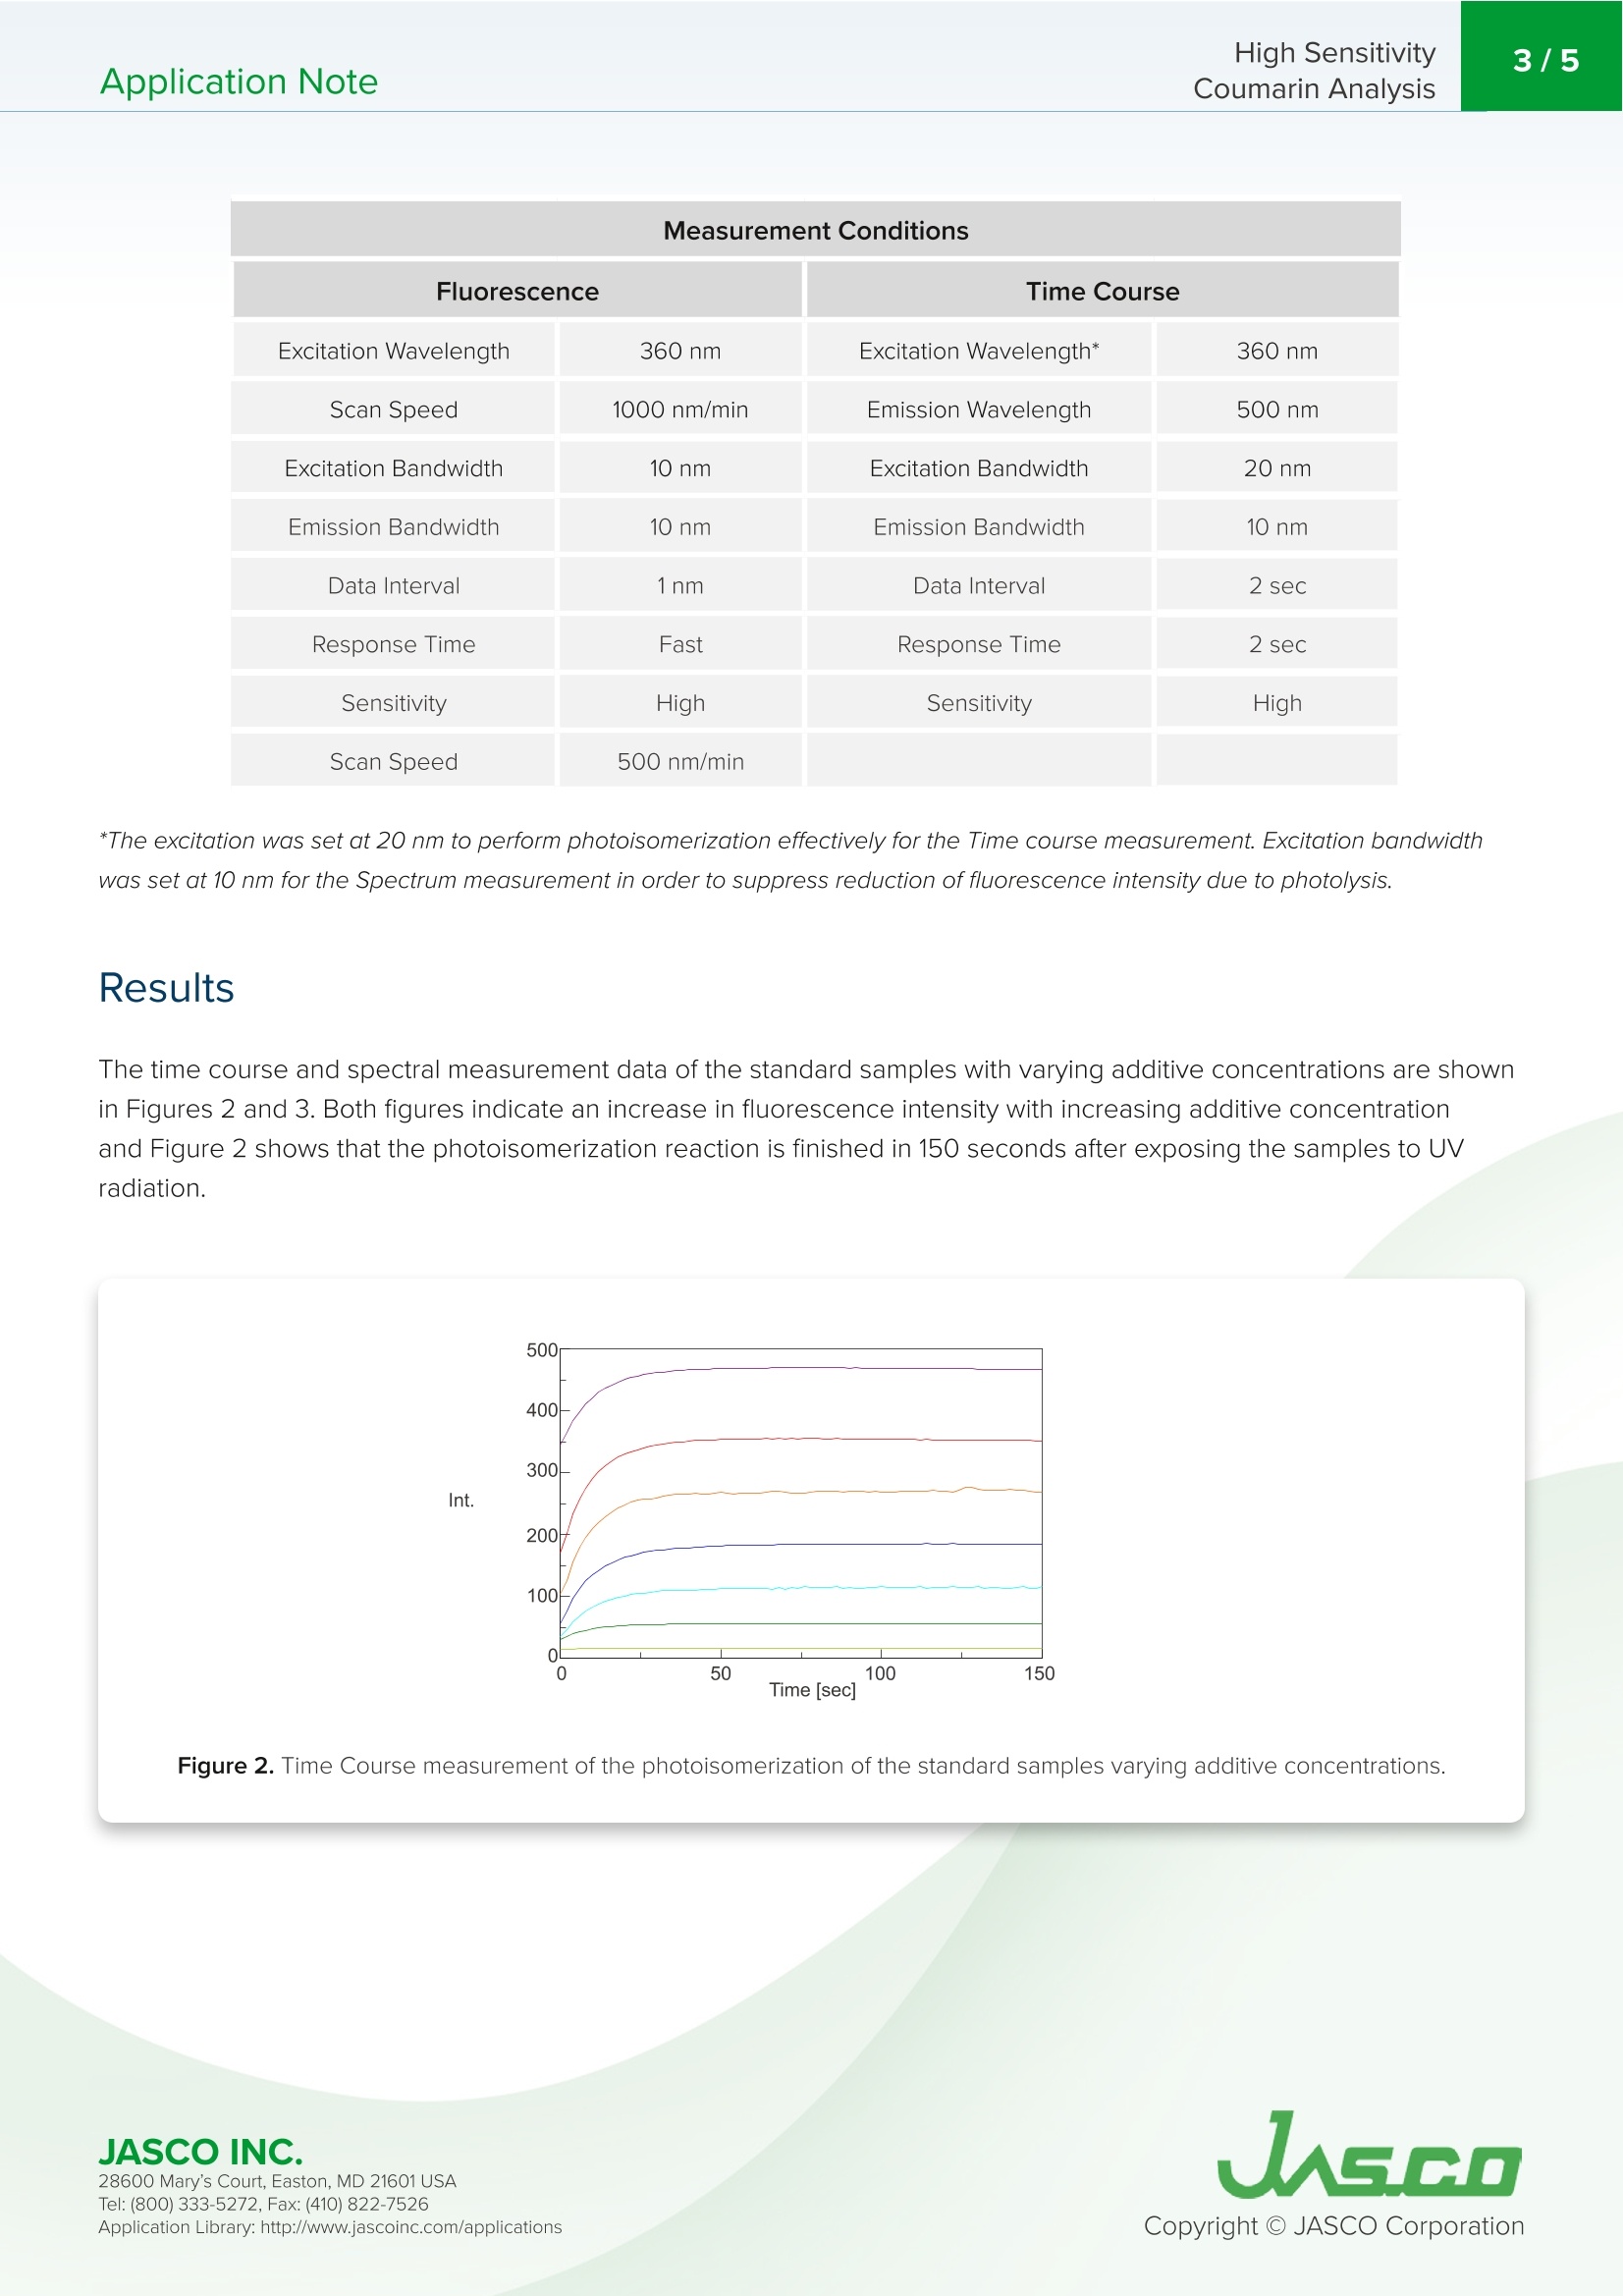
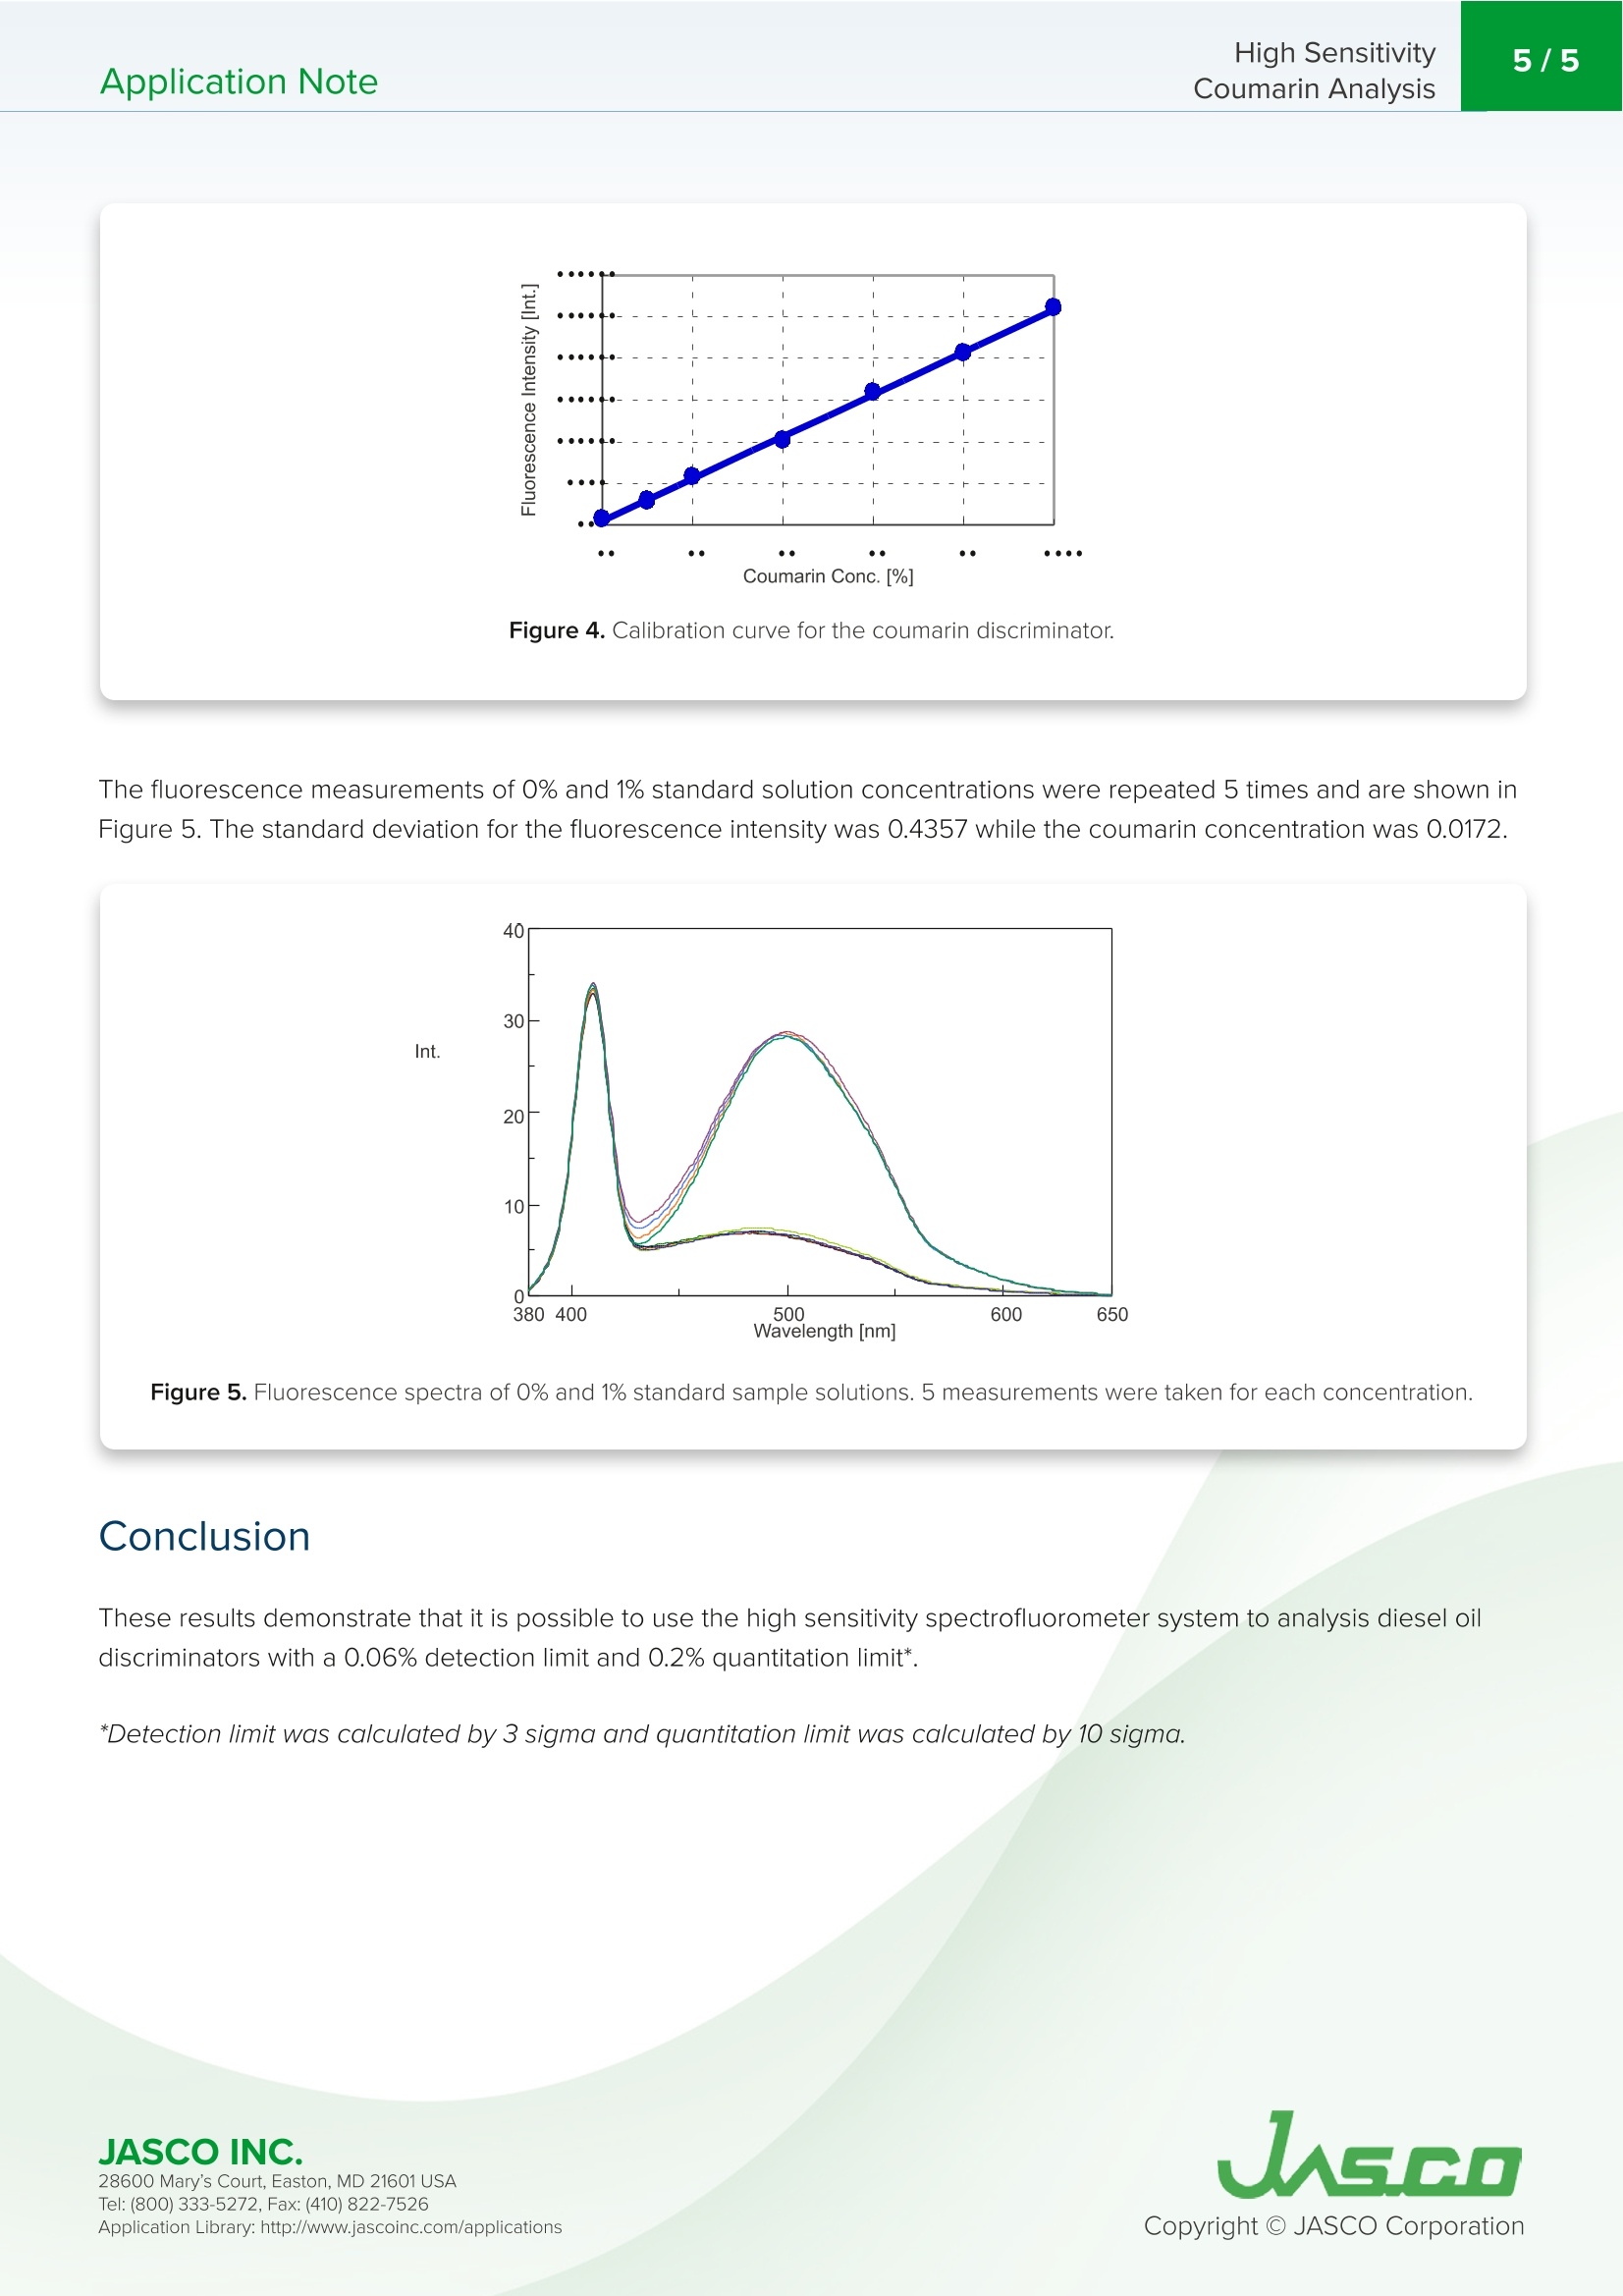
为防止非法生产含有煤油或重油的轻质柴油,在煤油或重油中添加1 ppm的香豆素作为鉴别剂。确定鉴别器及其混合浓度的分析程序由国家石油经销商协会标准化,并使用荧光分光谱计来测定浓度。本应用结果表明,利用高灵敏度荧光光谱仪系统对具有0.06%检测限和0.2%定量限的柴油鉴别器进行分析是可能的。Application NoteFP-0002 High SensitivityCoumarin Analysis2/5Application Note High Sensitivity Coumarin Analysis Introductio n To prevent the production of illegal li g h t diesel oil, which contains kerosene or heavy oil,1 ppm of coumarin is added to either the kerosene or a heavy oil as a discriminator. The analysis procedure for determ i n in g the discr i m i nator and its m i x i ng concen tr ation is standard i zed by t he National Pet r oleum Dealers Associa t ion and uses a spect r ofluorometer to dete r mine conce n tration. Coumarin is h ydrolyzed in alkal in e solut i on and becomes cis-O-hydroxycinnamic acid. The cis-O-hyd r oxycinnamic ac i d is then i s omer i zed by ultraviolet radiation and converted to t r ans-O- hydroxycinnam i c acid. Since trans-O-hyd r oxyci n namic ac i d fluo r esces, the product can be quantified using fluorescence spectroscopy. Wh i le t h e current proced u re i s relatively simple, the purpose i s to determine t h e co u marin concent r atio n withi n more than a cou p le percent of the r ela t ed oils. This appl i cat i on n ote int r odu c es a h ig h sensit i vity system to i mprove the concentration detec t ion li m it to less than 1 percent a n d reduce t h e quant i ta ti o n l imi t . Keyword s FP -6300, F l uor e sc e nc e, Mat e rials , F i lt er s e t 28600 Ma r y 's C ou r t, Easton, M D 21601 US A E xp eri mental 1000 p pm o f undi l u ted coumar in solut i on was made by dissolving 100 mg of coumar in i n a n a r o m atic solv e nt suc h as n-propyl ben z ene. T h e sta n da r d coumar i n sam pl es were prepar e d by diluting 100 pL of th e undiluted couma r i n solut i on usi n g 1 p p m of n-dodeca n e and fur th er dilut i ng t h e solut i o n to 0.1 ppm. For the al k aline solu t io n r e agent , 10 g of sod i um hyd r ox i de and 20 g of sodium n itra t e we r e dissolv e d in 100 mL of Mill i pore water and k e pt i n a polye t hyl e ne vesse l . 40mL of 1-butanol and 30 mL o f e t h anol were mixed for the alcohol so l ution . The standard samples were th e n m i xed in test tu b es, according to t h e speci fi ed rat i os i n T able 1. Following t h e procedure in F i gure 2, the samples were s h ake n to hydrolyze t he coumari n and the n extracted in the al k aline solution. The samples we r e t h e n kept stationary f or 5 minu t es to allow for separat i o n of the solution layers. The photoisomerizatio n reaction was induced by irrad i a tin g the sample us i ng a spectrofluoromete r a n d an excitat i on wave l ength of 360 nm. T he fluoresce n ce inte n sity was detected at 500 nm and used to generate a calibration curve . Additive Concentration Coumarin Solution (mL) n-dodecane (mL) Alkaline Solution (mL) Alcohol Dolution (ml) 0% 0 4.2 3 4.8 1% 0.06 4.14 3 4.8 2% 0.12 4.08 3 4.8 4% 0.24 3.96 3 4.8 6% 0.36 3.84 3 4.8 8% 0.48 3.72 3 4.8 10% 0.96 3.24 3 4.8 Table 1. M ix ing r a tios of t h e s t an d ard solu t ion . Figure 1. Flo w c h art o f a nal y sis proc e du r e 28600 Mary's Cour t , E a s to n , M D 21601US A Fluorescence Time Course Excitation Wavelength 360nm Excitation Wavelength* 360nm Scan Speed 1000 nm/min Emission Wavelength 500nm Excitation Bandwidth 10nm Excitation Bandwidth 20 nm Emission Bandwidth 10nm Emission Bandwidth 10nm Data Interval 1nm Data Interval 2 sec Response Time Fast Response Time 2 sec Sensitivity High Sensitivity High Scan Speed 500 nm/min *The exc i tat i o n was set at 20 nm to per f orm photoisomer iz at i on effec t ively for the Time c ourse measurement . Ex c it a t i on bandwi d th was set at 10 nm for the Spec t rum measurement in order to suppres s redu c t ion of fluores c ence intens i ty du e to p hotolys is . Resul t s The time cou r se and spec tr al measurement data of t h e standa r d samples with va r ying additive concentrations are shown in Figu r es 2 and 3. Bot h f igures i n dicate an increase i n f l u orescence i ntensity wi th increasi n g additive concent r ation and F i gu r e 2 shows that the photo i somerizatio n reaction is fi n ished i n 150 seconds after expos i n g the samples to UV radiation. Figure 2. T i me Co u r s e mea s ur e men t o f t h e p hoto i some r izat i o n o f t h e stan d ard sa m p l es v a ryi ng add i t i v e con ce n tr atio n s . JASCO INC. 28600 Mary's Cour t , E a s to n , M D 21601US A UAGE O Figure 3. F l uor e sc e nc e sp e c t ra a ft e r the ph o toiso m er i z a tion r e a c t ion f o r vary ing add i t i ve con ce nt r at i o n s . A cal i brat i o n curve plot t ing the f luoresc e nce i n tensity at 500 nm as a func t io n of the additive coumarin con c e n tration i s s h own in F i gure 4 and t h e corr e spo n ding values in T able 2. T h e co r r e lation coe ffi ci e nt obtai n ed for t h e cal i brat i on cu r ve wa s 0.9993, i n dicating good lin e arity. Additive Concentration Fluorescence Intensity (at 500 nm) 0% 6.7077 1% 28.7548 2% 57.3873 4% 101.829 6% 158.903 8% 205.882 10% 260.236 Table 2. The ad d it i ve cou mar i n c o n cen t r ations w i th th ei r co r r e s p on d ing fl u o resc e nce i n tens i t ie s at 500 nm . JASCO INC. 28600 Mary's Cour t , E a s to n , M D 21601US A Figure 4. C ali b rati o n c ur v e f o r t h e cou m a ri n d i s c r i mi n a tor . The fluor e sc e nce m e asureme n ts of 0% a n d 1% standard sol u tion conce n tra ti o n s wer e r e p eat e d 5 t i mes and ar e shown in Figure 5. The standa r d devi a t i on for the f lu o rescence inte n si t y was 0.4357 while t h e coumar i n con c en t ration was 0.0172. Int . Figure 5. Fl uor e sc e nc e s pe c tr a of 0% a n d 1% stand ar d s am p l e so l u ti o n s. 5 me a sur e men t s w er e t a k en f or e a c h conc e n tr at i o n . Conclusion These results demonstrate tha t it i s possi b le to use the h i g h sensi t ivity spect r of l uorometer system to analysis diesel oi l disc ri minators with a 0.06% detection l i mit and 0.2% quantitat i on limit *. *Detection l imit was calculated by 3 sigma and quantitation limit was calculated by 10 sigma. JASCO INC. T el : (800) 333-5272, Fa x : (410) 822-7526 A ppli c a tio n Lib r ary: htt p://www.jas co in c .c o m/a pp l icatio n s
确定
还剩3页未读,是否继续阅读?

产品配置单

佳士科商贸有限公司为您提供《高灵敏度香豆素分析》,该方案主要用于柴油中高灵敏度、浓度、石油、荧光检测,参考标准--,《高灵敏度香豆素分析》用到的仪器有JASCOFP-8000系列荧光光谱仪
推荐专场
相关方案
更多
该厂商其他方案
更多