The determination of different mineral phases through
backscattered electron (BSE) detectors is a common task
in mineralogy. This approach however has limitations. If
minerals with different composition but similar average
atomic number are viewed with a BSE detector there is very
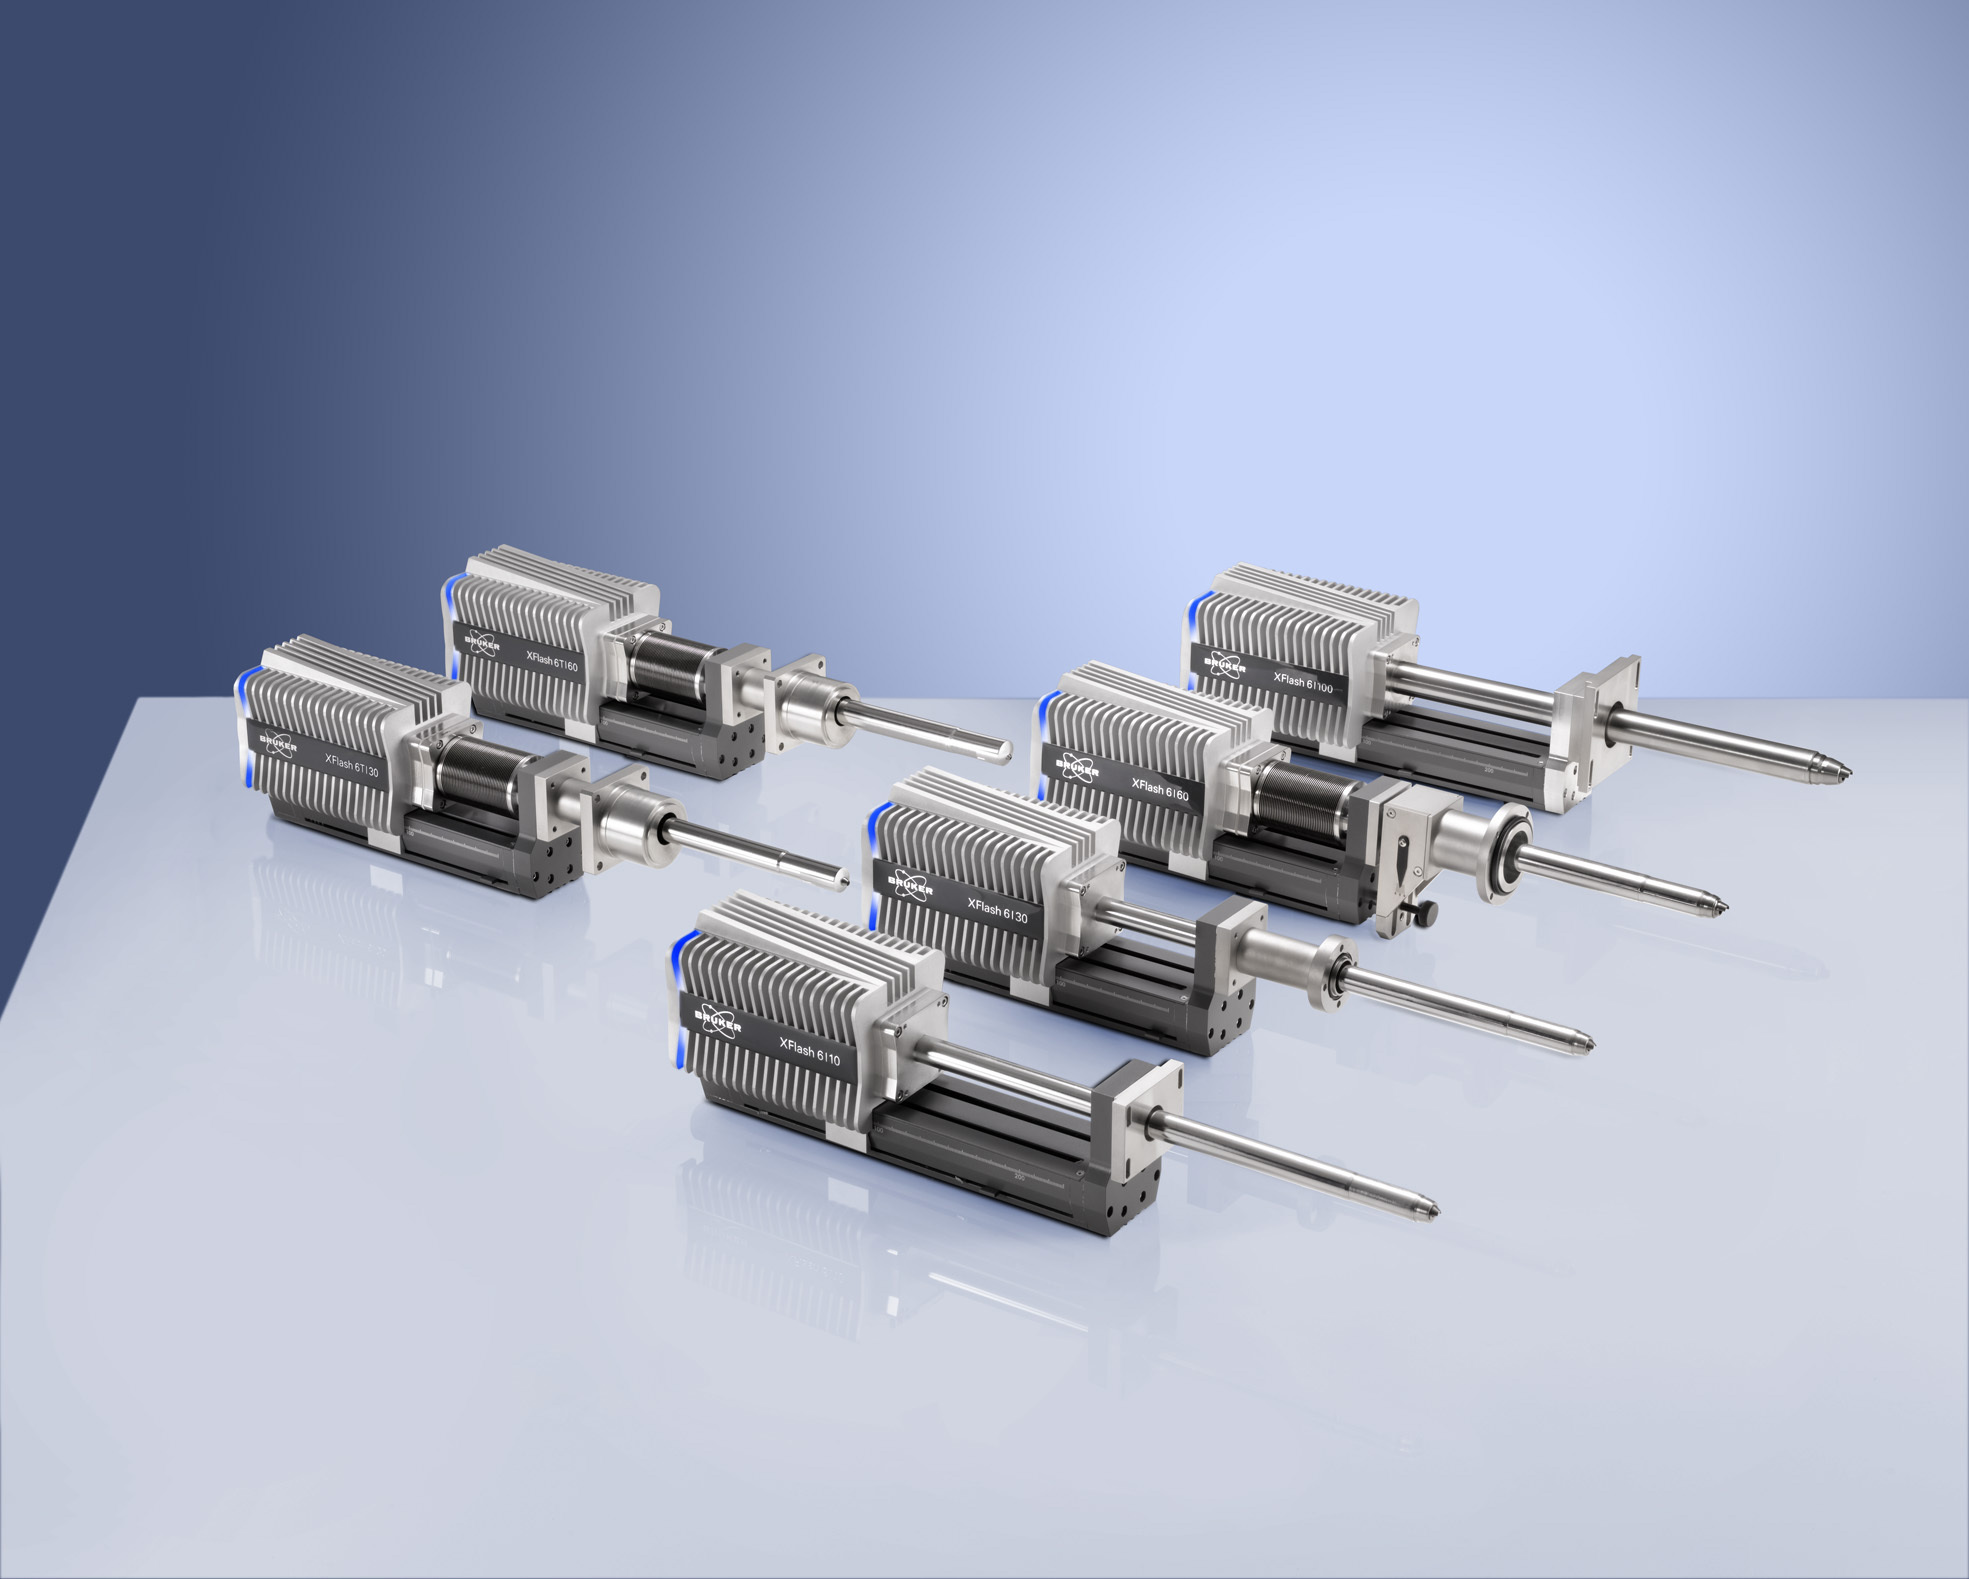
little if no material contrast to be observed. This shortfall can be overcome through use of X-ray elemental maps. The innovative XFlash® 4010 SDD allows extremely high input and output count rates, hence elemental maps can be performed in about one tenth of the time required by conventional Si(Li) detectors.
方案详情

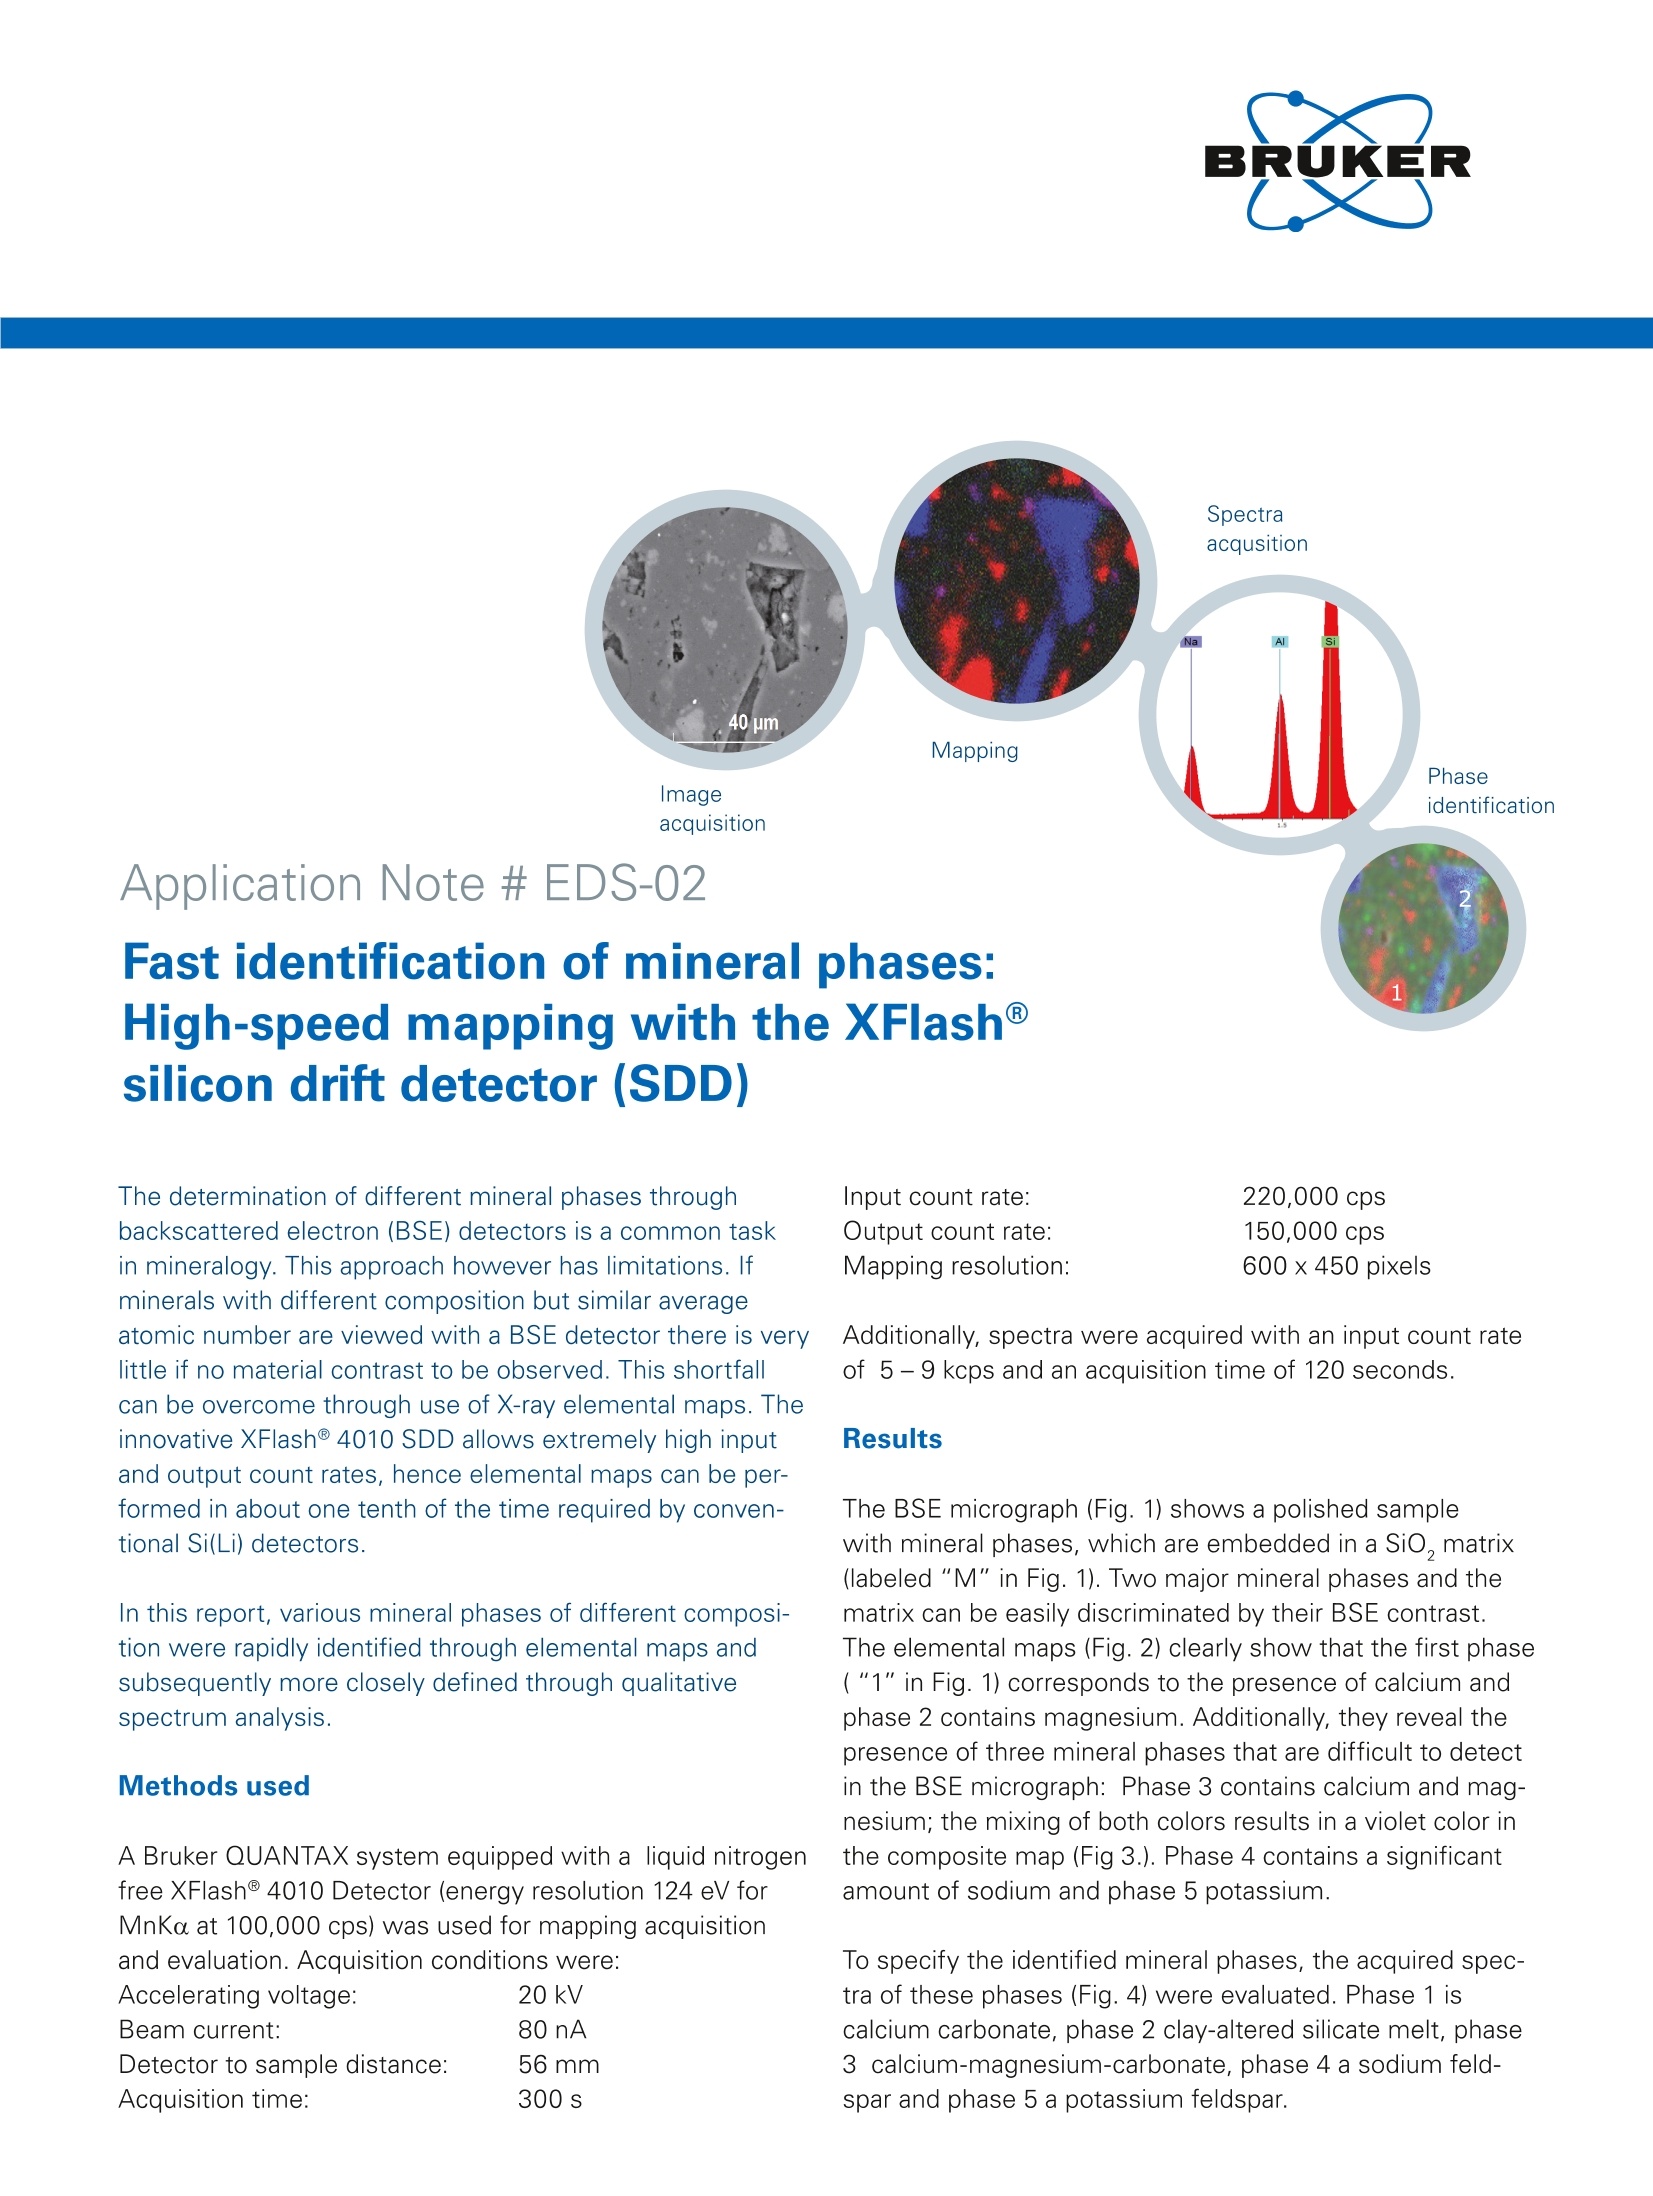
lmageacquisition Application Note # EDS-02 Fast identification of mineral phases:High-speed mapping with the XFlashh@silicon drift detector (SDD) Input count rate:220,000 cpsOutput count rate:150,000 cpsMapping resolution:600x450 pixels The determination of different mineral phases throughbackscattered electron (BSE) detectors is a common taskin mineralogy. This approach however has limitations. Ifminerals with different composition but similar averageatomic number are viewed with a BSE detector there is verylittle if no material contrast to be observed. This shortfallcan be overcome through use of X-ray elemental maps. Theinnovative XFlash@ 4010 SDD allows extremely high inputand output count rates, hence elemental maps can be per-formed in about one tenth of the time required by conven-tional Si(Li) detectors. ln this report, various mineral phases of different composi-tion were rapidly identified through elemental maps andsubsequently more closely defined through qualitativespectrum analysis. Methods used A Bruker QUANTAX system equipped with a liquid nitrogenfree XFlash@ 4010 Detector (energy resolution 124 eV forMnKo at 100,000 cps) was used for mapping acquisitionand evaluation. Acquisition conditions were:Accelerating voltage: 20 kVBeam current: 80 nADetector to sample distance: 56mmAcquisition time: 300 s Additionally, spectra were acquired with an input count rateof 5-9 kcps and an acquisition time of 120 seconds. Results The BSE micrograph (Fig. 1) shows a polished samplewith mineral phases,which are embedded in a SiO, matrix(labeled"M"in Fig. 1). Two major mineral phases and thematrix can be easily discriminated by their BSE contrast.The elemental maps (Fig. 2) clearly show that the first phase("1" in Fig.1) corresponds to the presence of calcium andphase 2 contains magnesium. Additionally, they reveal thepresence of three mineral phases that are difficult to detectin the BSE micrograph: Phase 3 contains calcium and mag-nesium; the mixing of both colors results in a violet color inthe composite map (Fig3.). Phase 4 contains a significantamount of sodium and phase 5 potassium. To specify the identified mineral phases, the acquired spec-tra of these phases (Fig. 4) were evaluated. Phase 1 iscalcium carbonate, phase 2 clay-altered silicate melt, phase3 calcium-magnesium-carbonate, phase 4 a sodium feld-spar and phase 5 a potassium feldspar. Fig. 1 BSE image of the polished mineral section analyzed.Thematrix and phases (visible and determined through the mapping) arelabeled in yellow. Refer to the text for details. Fig. 2 Maps of specific elements, calcium (Ca) is shown in red, mag.nesium (Mg) in blue, sodium (Na) in yellow, potassium (K) in green. Conclusions Results show that EDS maps have an advantage over BSEimages: latter fail to distinguish some mineral phases dueto their similar average atomic number contrast. The mapspermit to discriminate the minerals quartz [SiO,], dolomite Fig. 4 Spectra overlay of all phases determined qualitatively in themapping. [(Ca,Mg)CO,] and sodium feldspar [NaAISi,Og] as well ascalcite [CaCO,] and potassium feldspar [KAISi,O,]- and sodisplay a wealth of data that electron images simply cannotprovide. Author Dr. Tobias Salge, application scientist EDS, Results show that EDS maps have an advantage over BSEimages: latter fail to distinguish some mineral phases dueto their similar average atomic number contrast. The mapspermit to discriminate the minerals quartz [SiO2], dolomite[(Ca,Mg)CO3] and sodium feldspar [NaAlSi3O8] as well ascalcite [CaCO3] and potassium feldspar [KAlSi3O8] – and sodisplay a wealth of data that electron images simply cannotprovide.
确定

还剩1页未读,是否继续阅读?
布鲁克电子显微纳米分析仪器部为您提供《矿物中元素含量检测方案(X射线能谱仪)》,该方案主要用于非金属矿产中痕量元素检测,参考标准--,《矿物中元素含量检测方案(X射线能谱仪)》用到的仪器有布鲁克 , EDS, 能谱仪, SEM, TEM、布鲁克 QUANTAX EDS 能谱仪(TEM)、布鲁克3D EDS/EBSD重构软件QUBE
推荐专场
相关方案
更多
