


方案详情
文
近期,新加坡国立大学同步辐射光源线站的科学家们和新加坡刑事调查局刑侦部门共同合作开发出了一种新的红外检测手段,即使用基于新型光热红外(Optical- Photothermal InfraRed,O-PTIR)技术的非接触亚微米分辨红外拉曼同步测量系统-mIRage,来分析指纹中含有的痕量易爆炸物微粒。
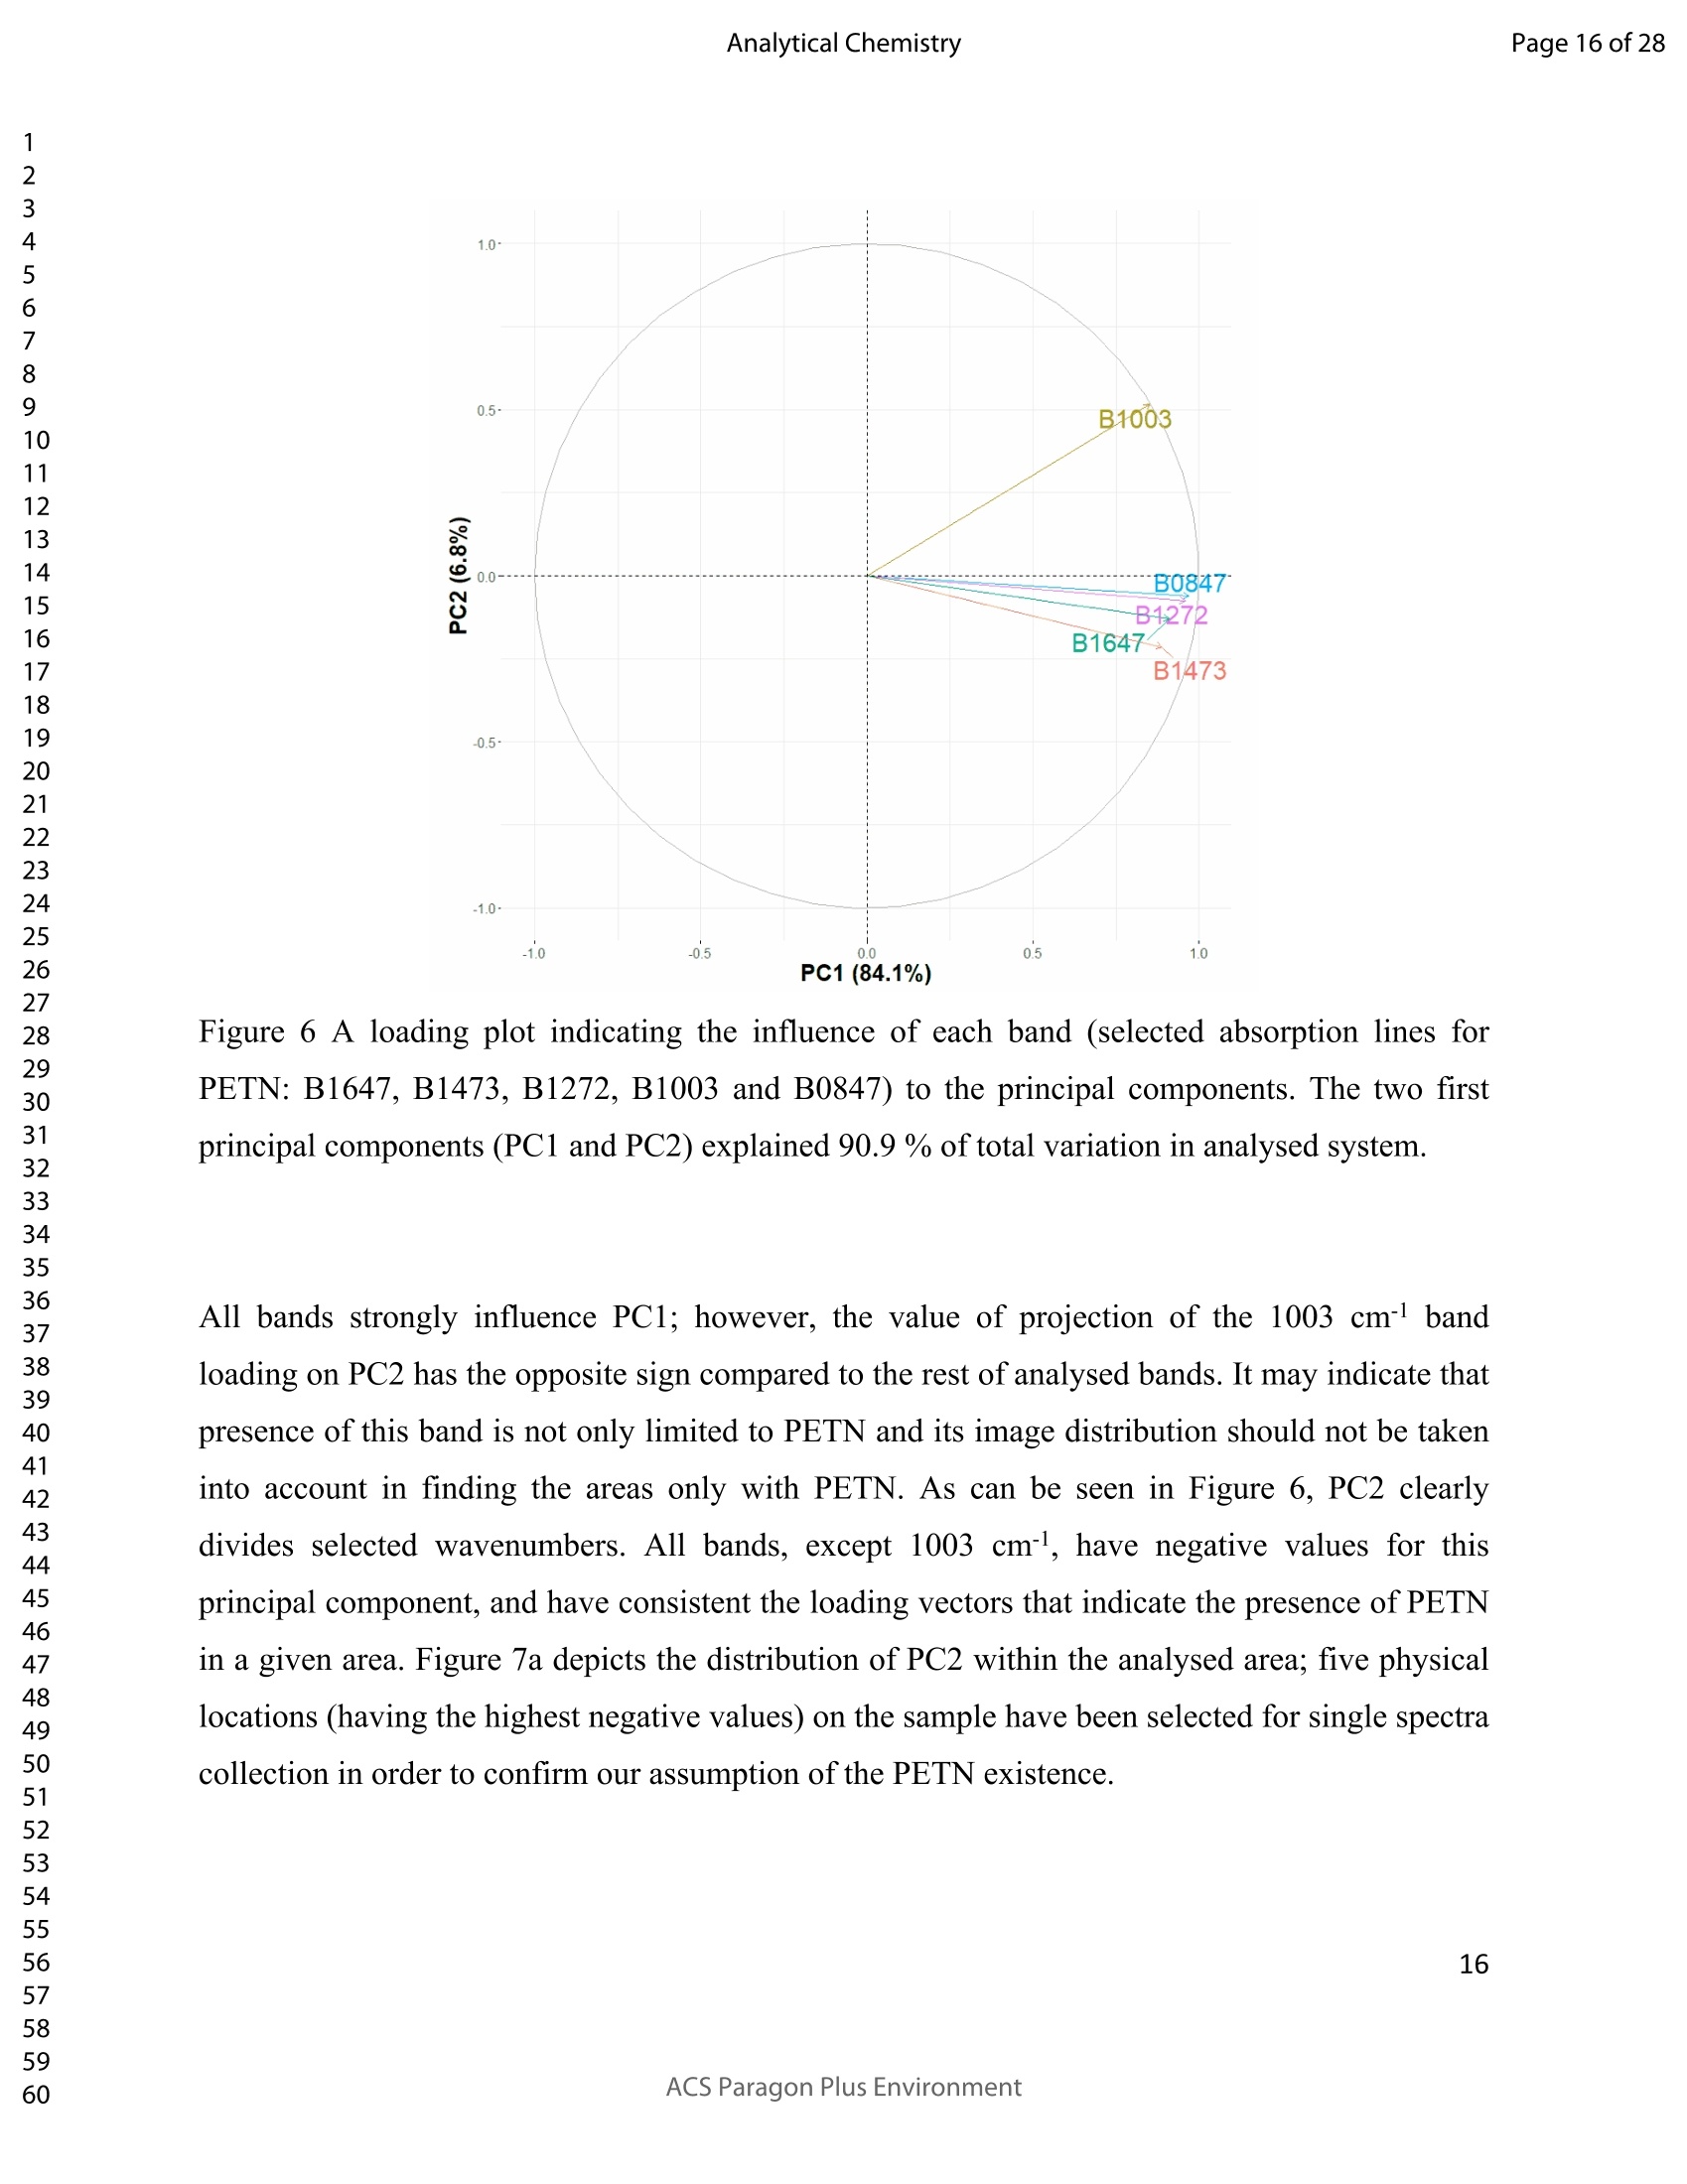
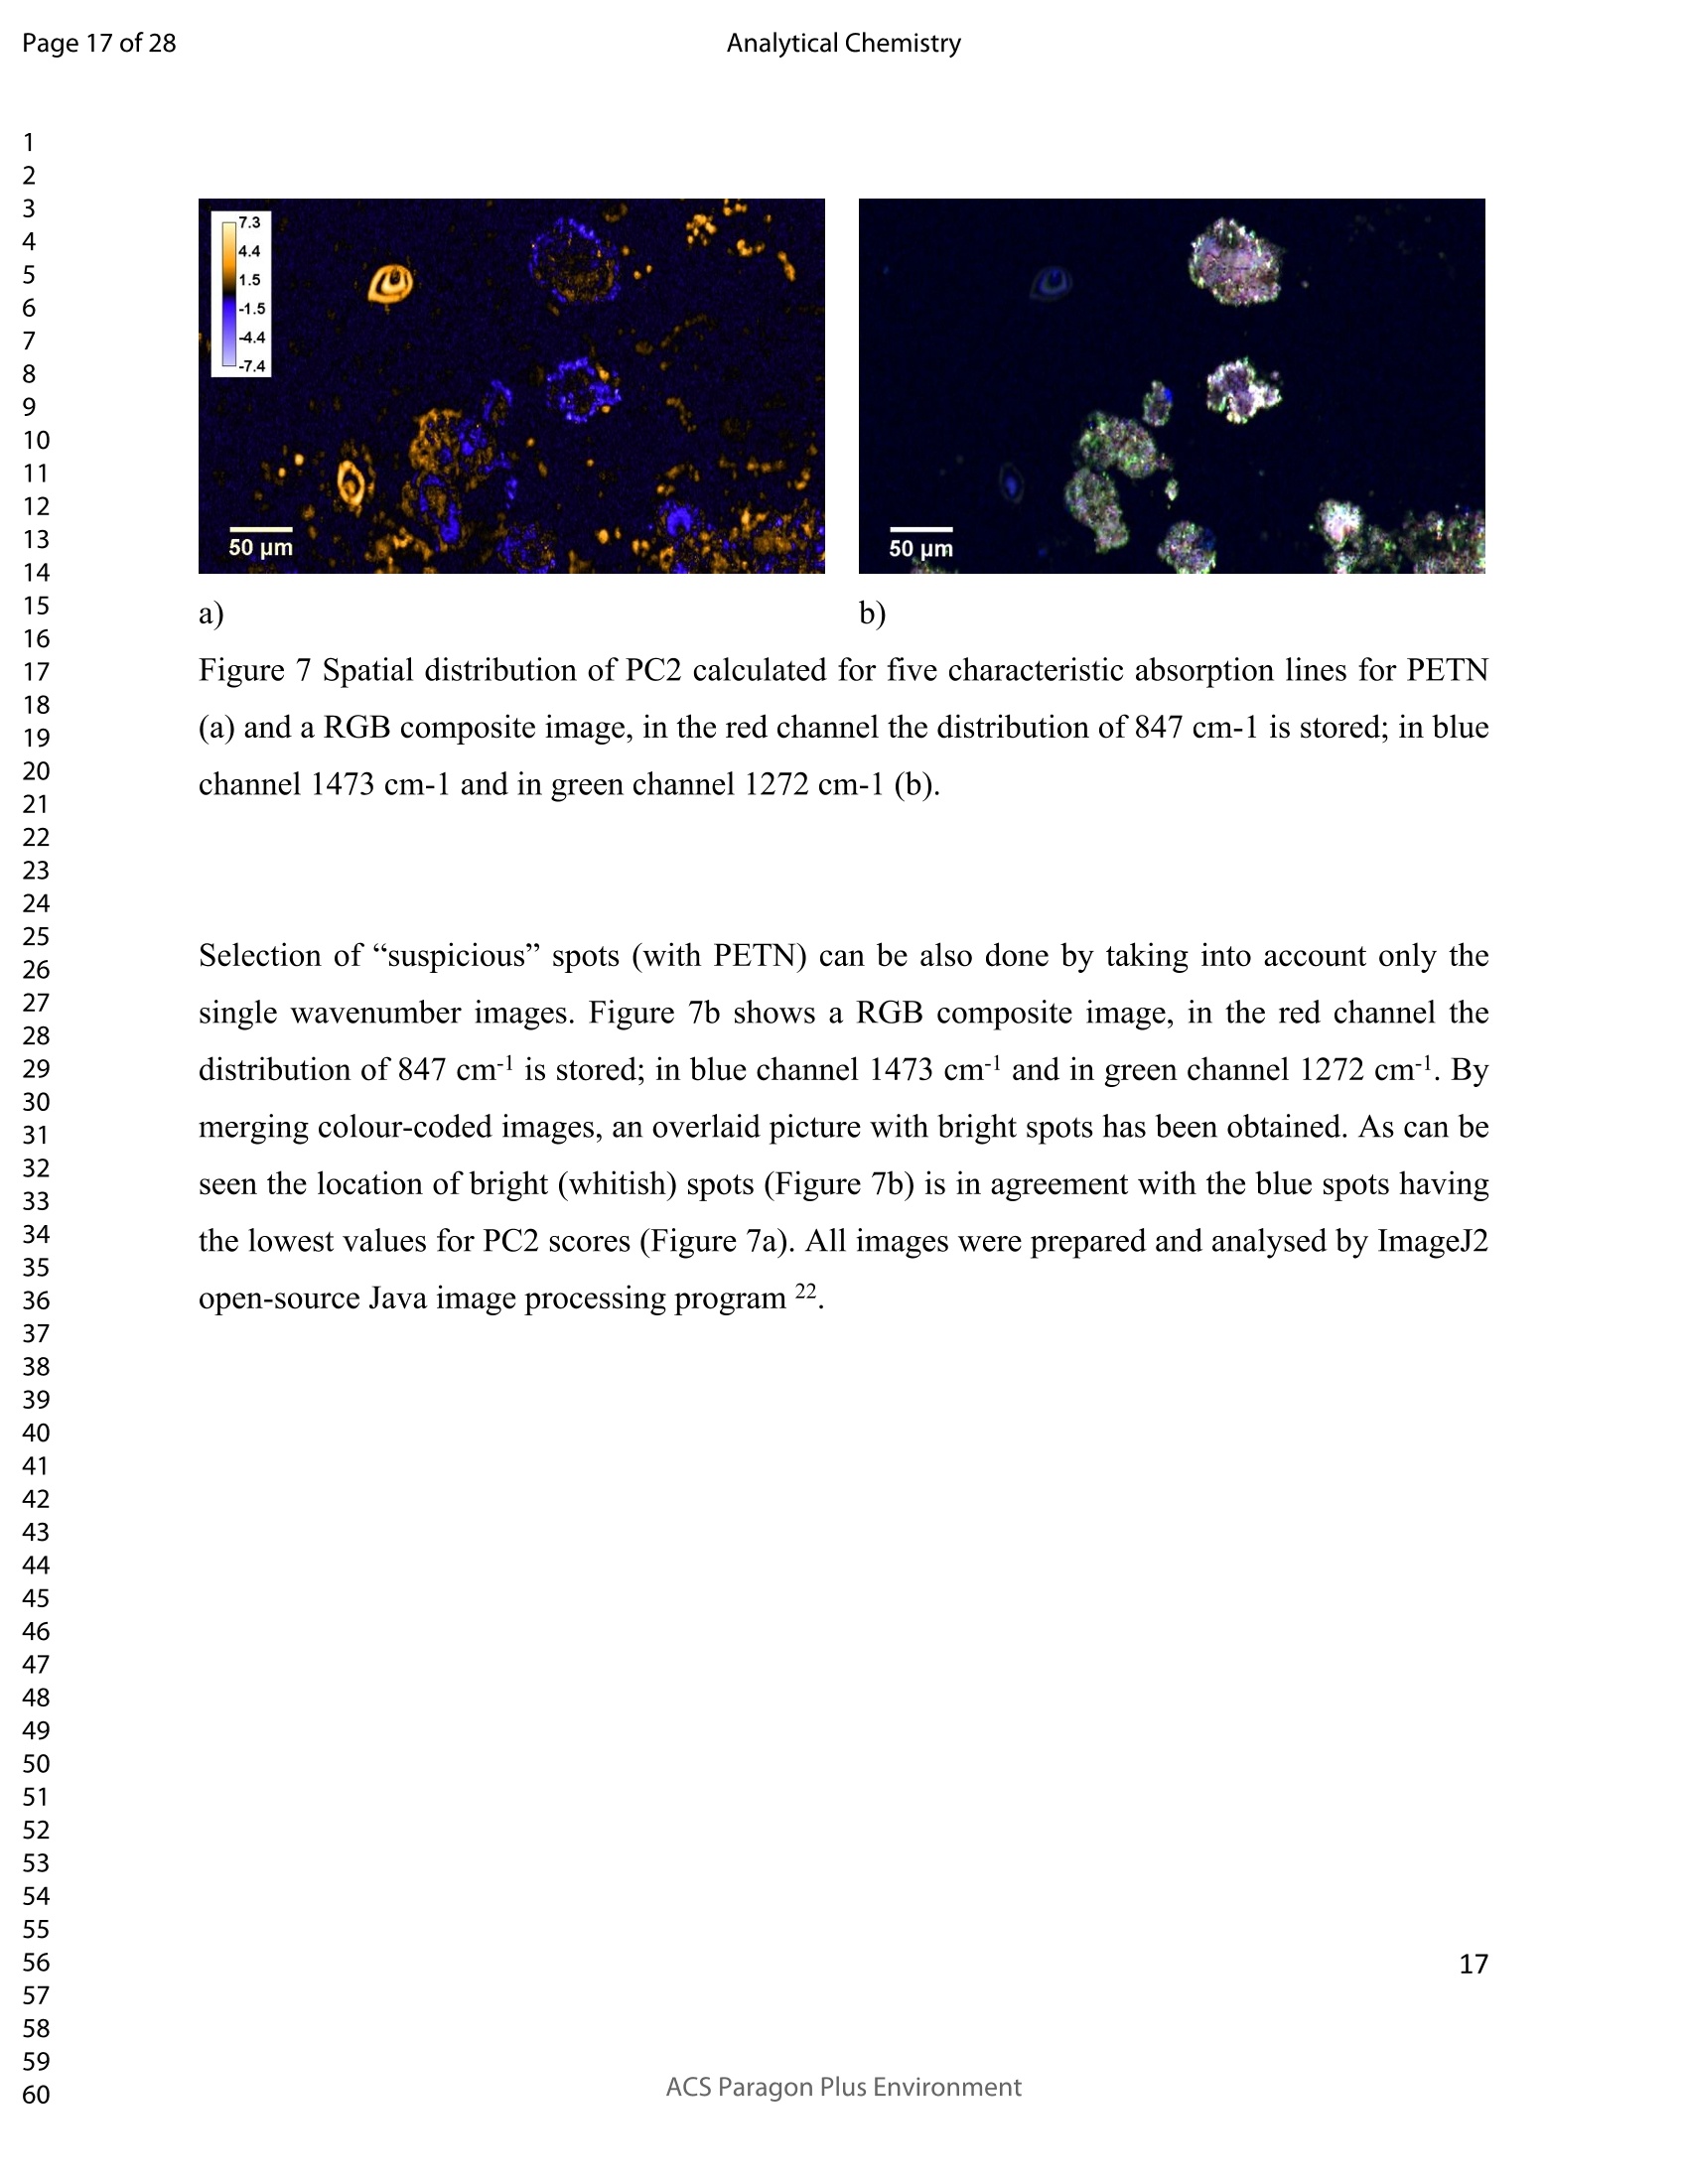
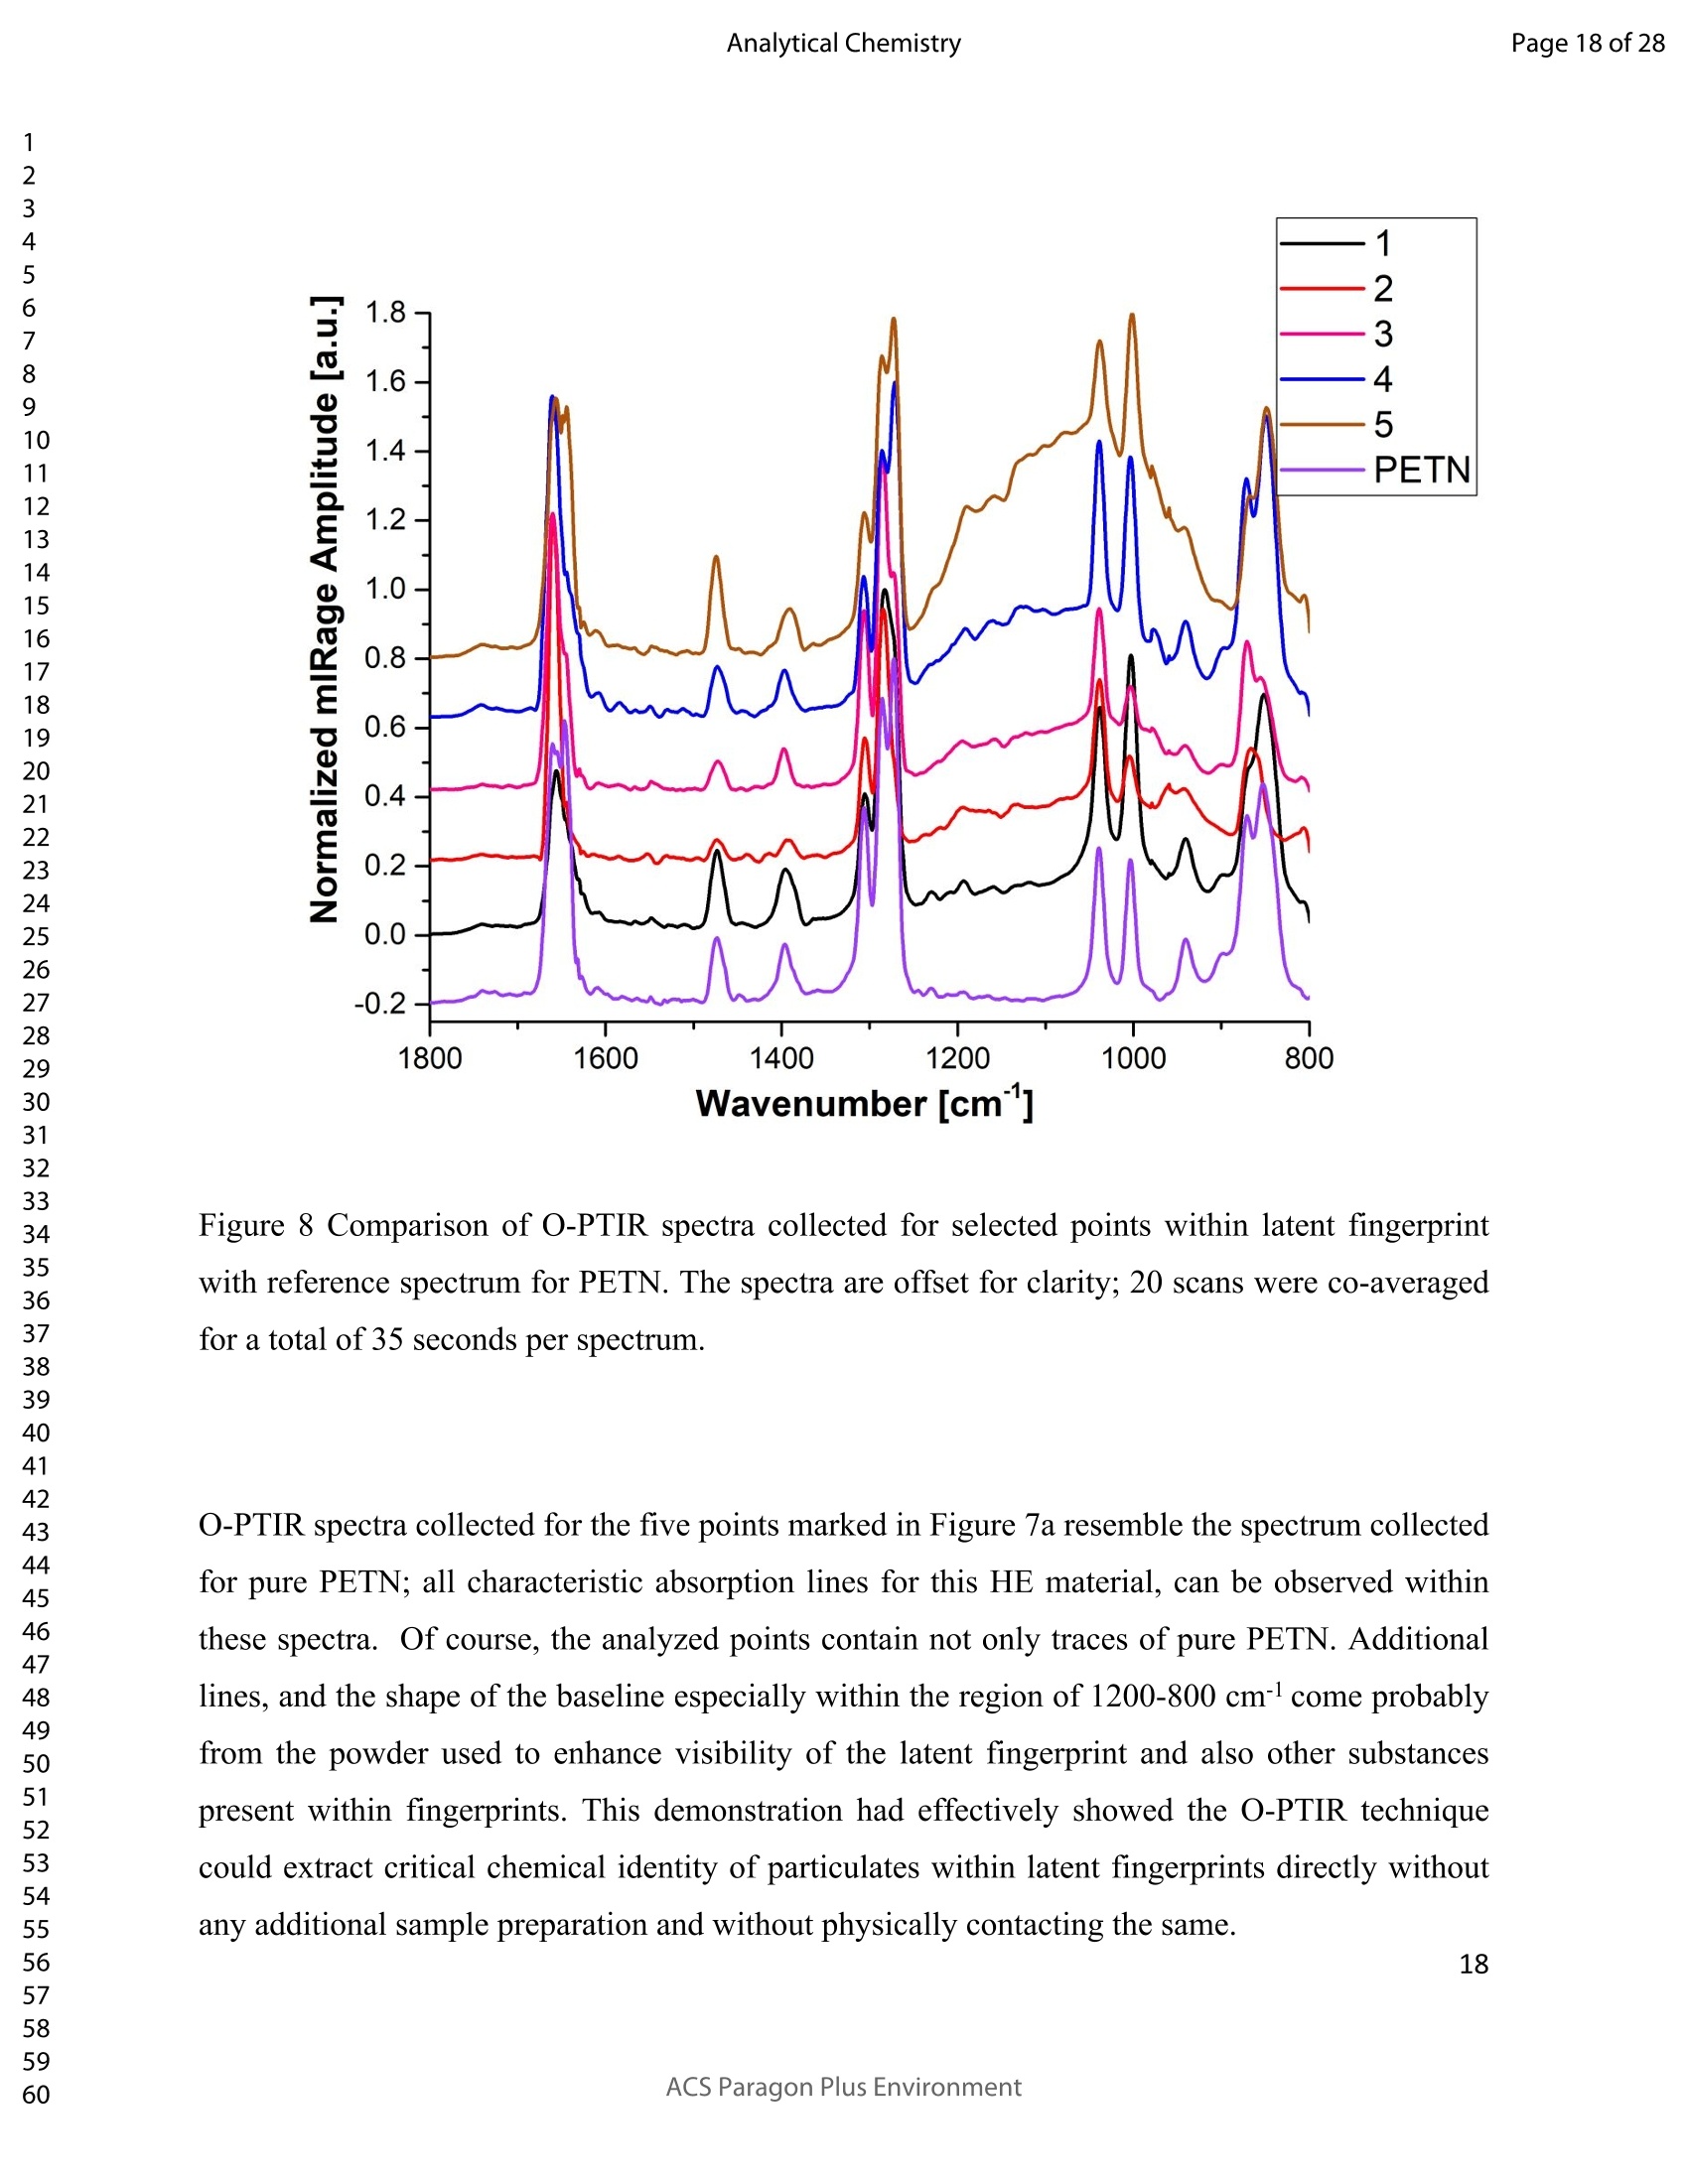
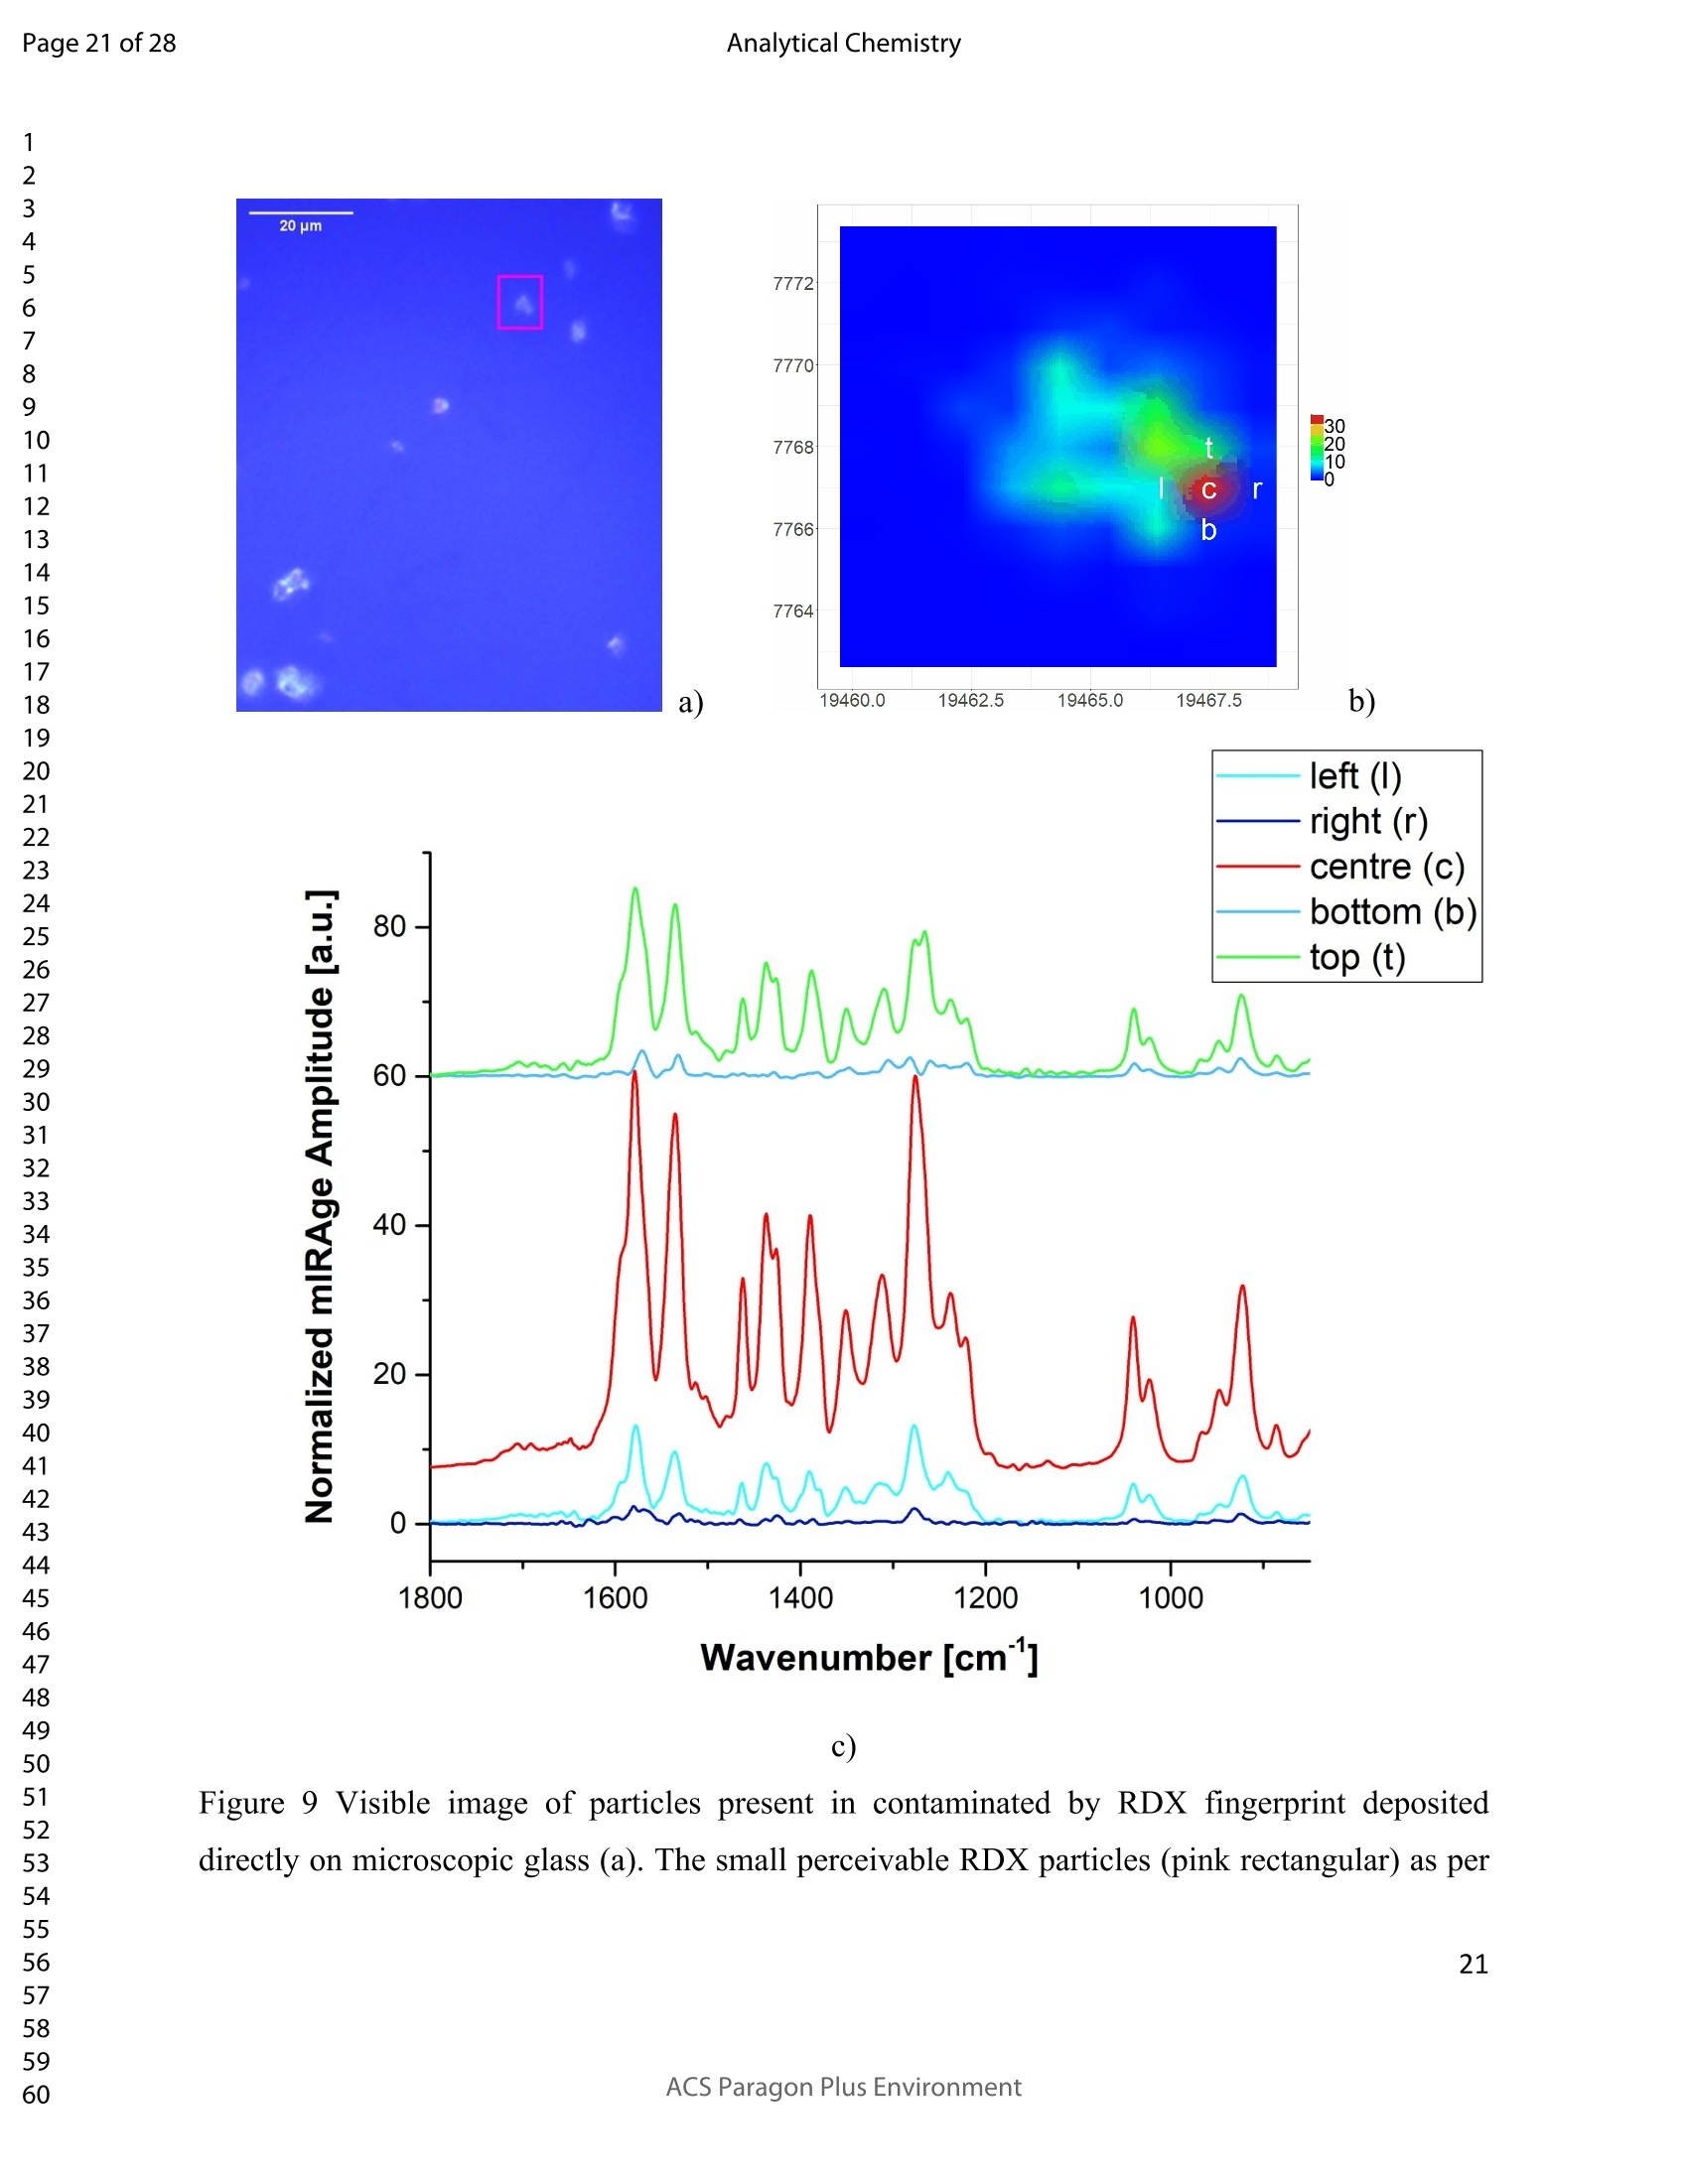
方案详情

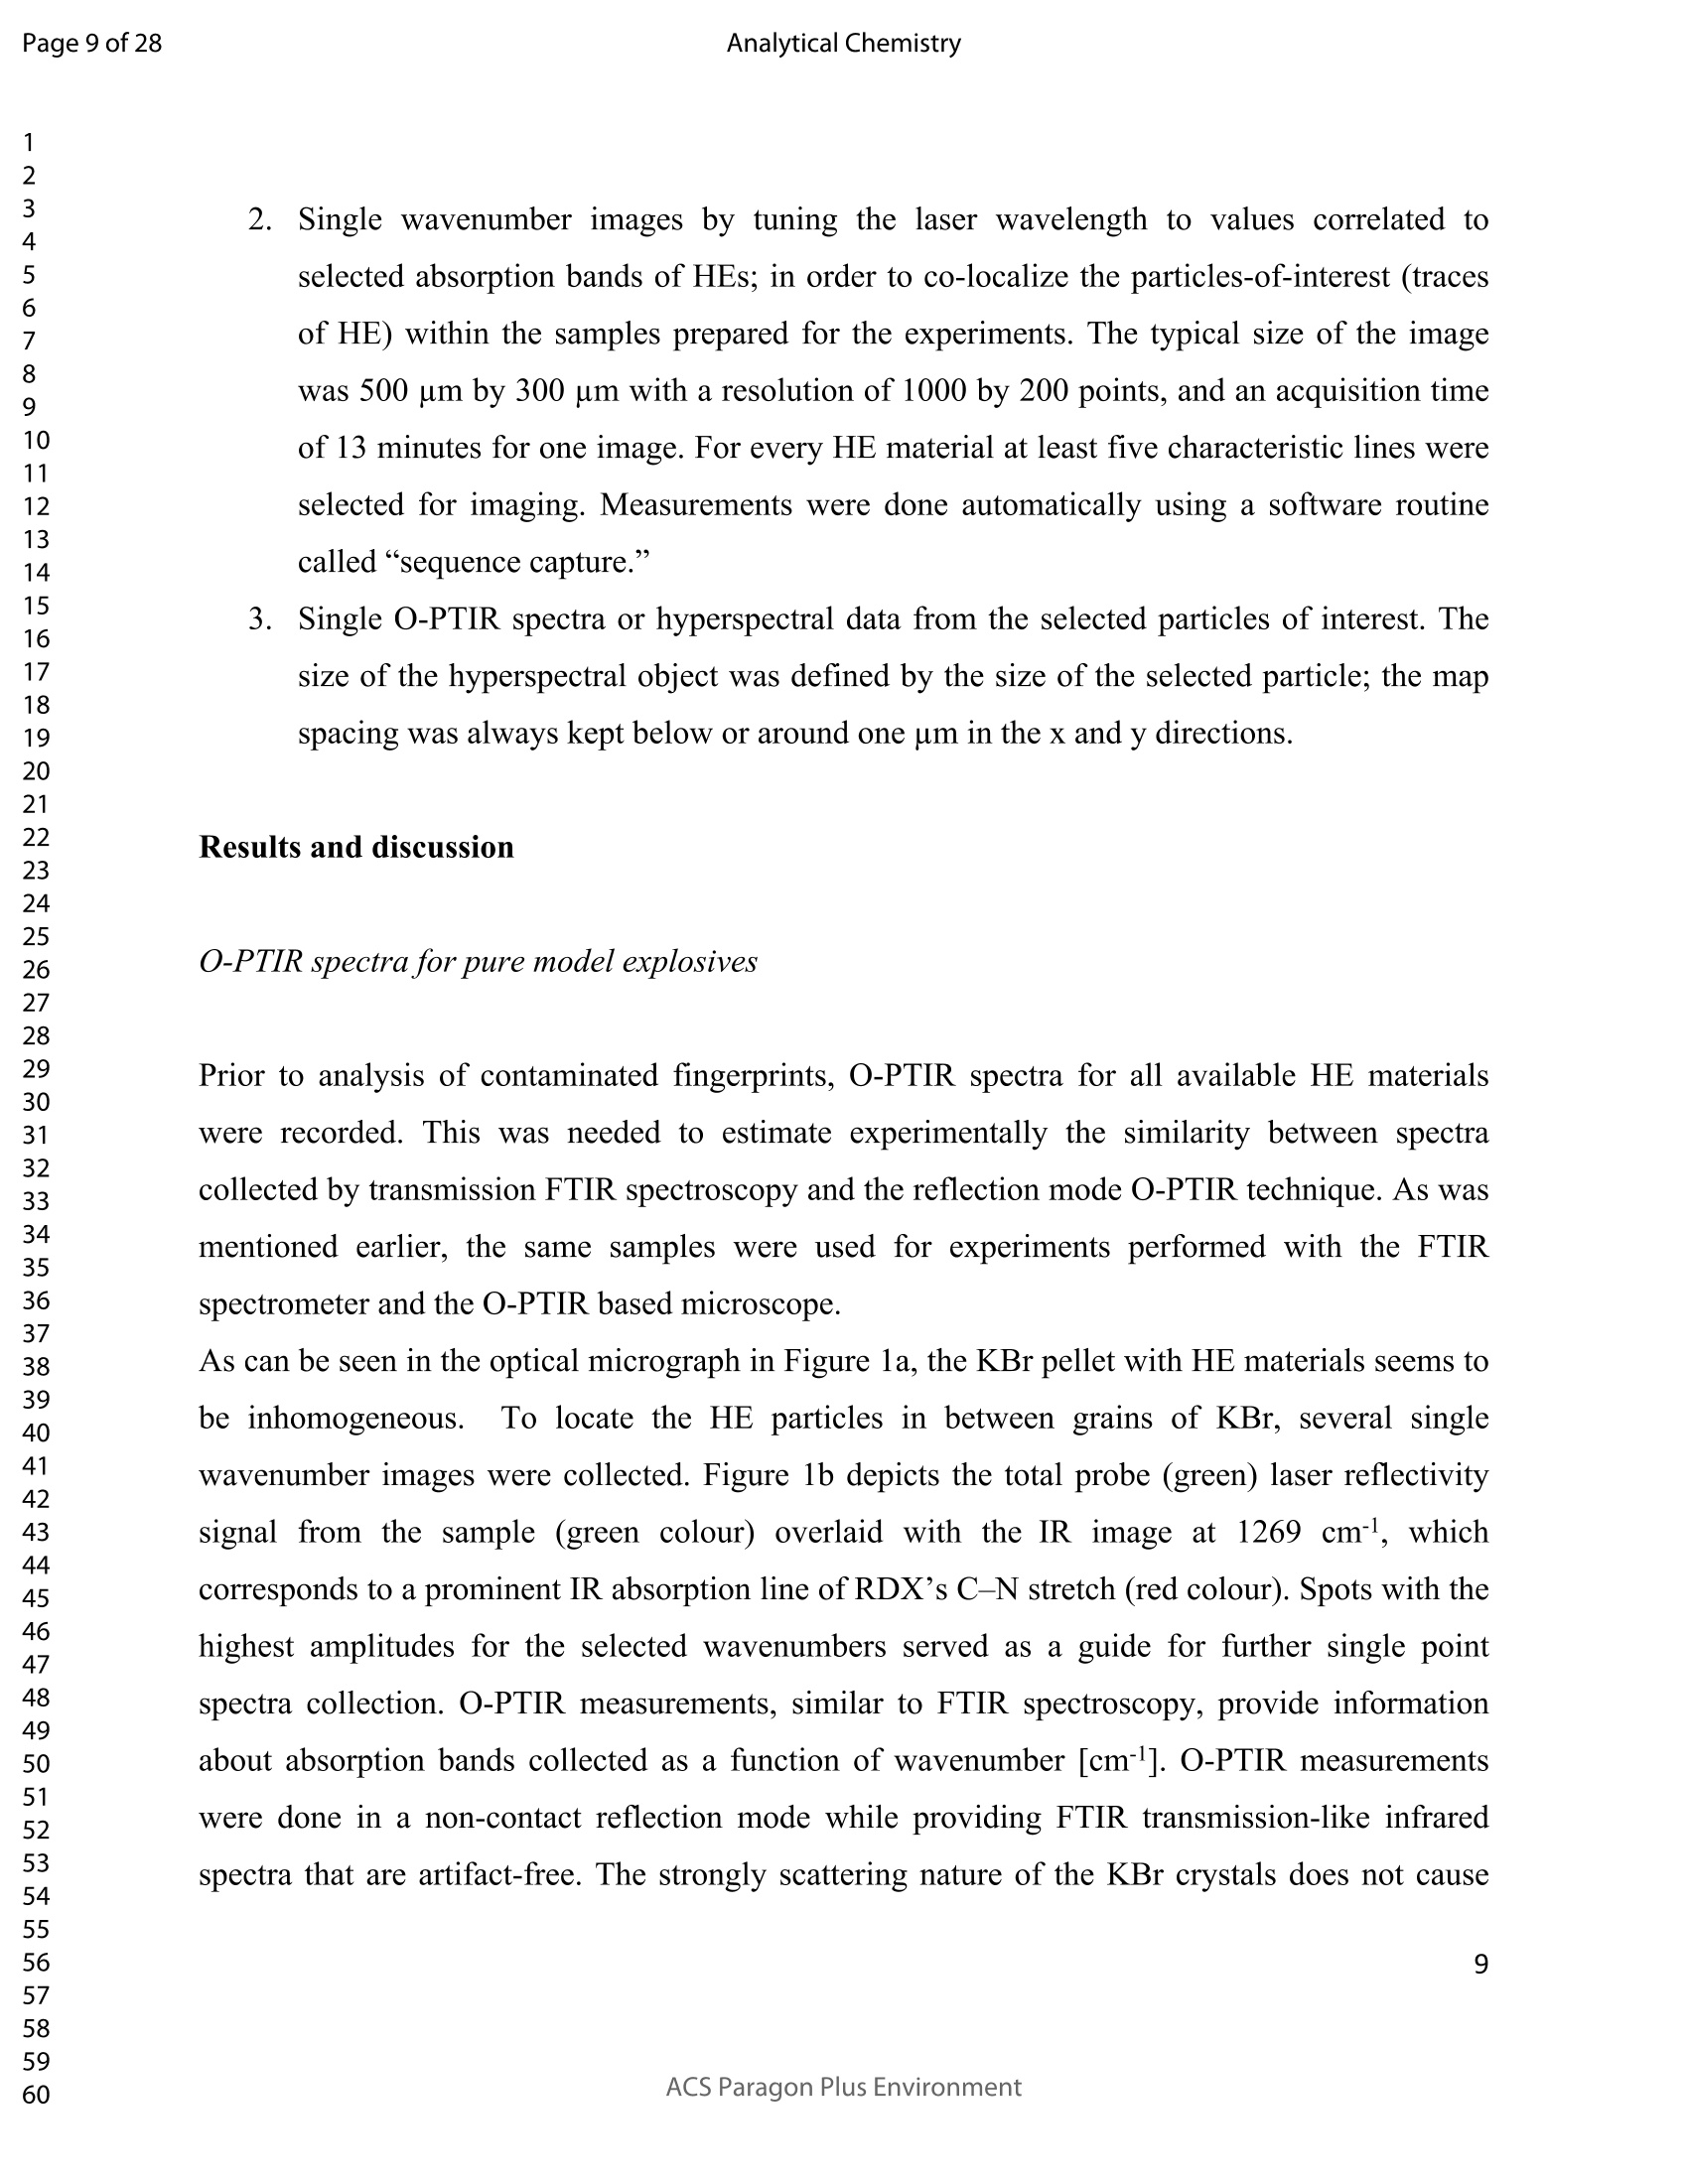
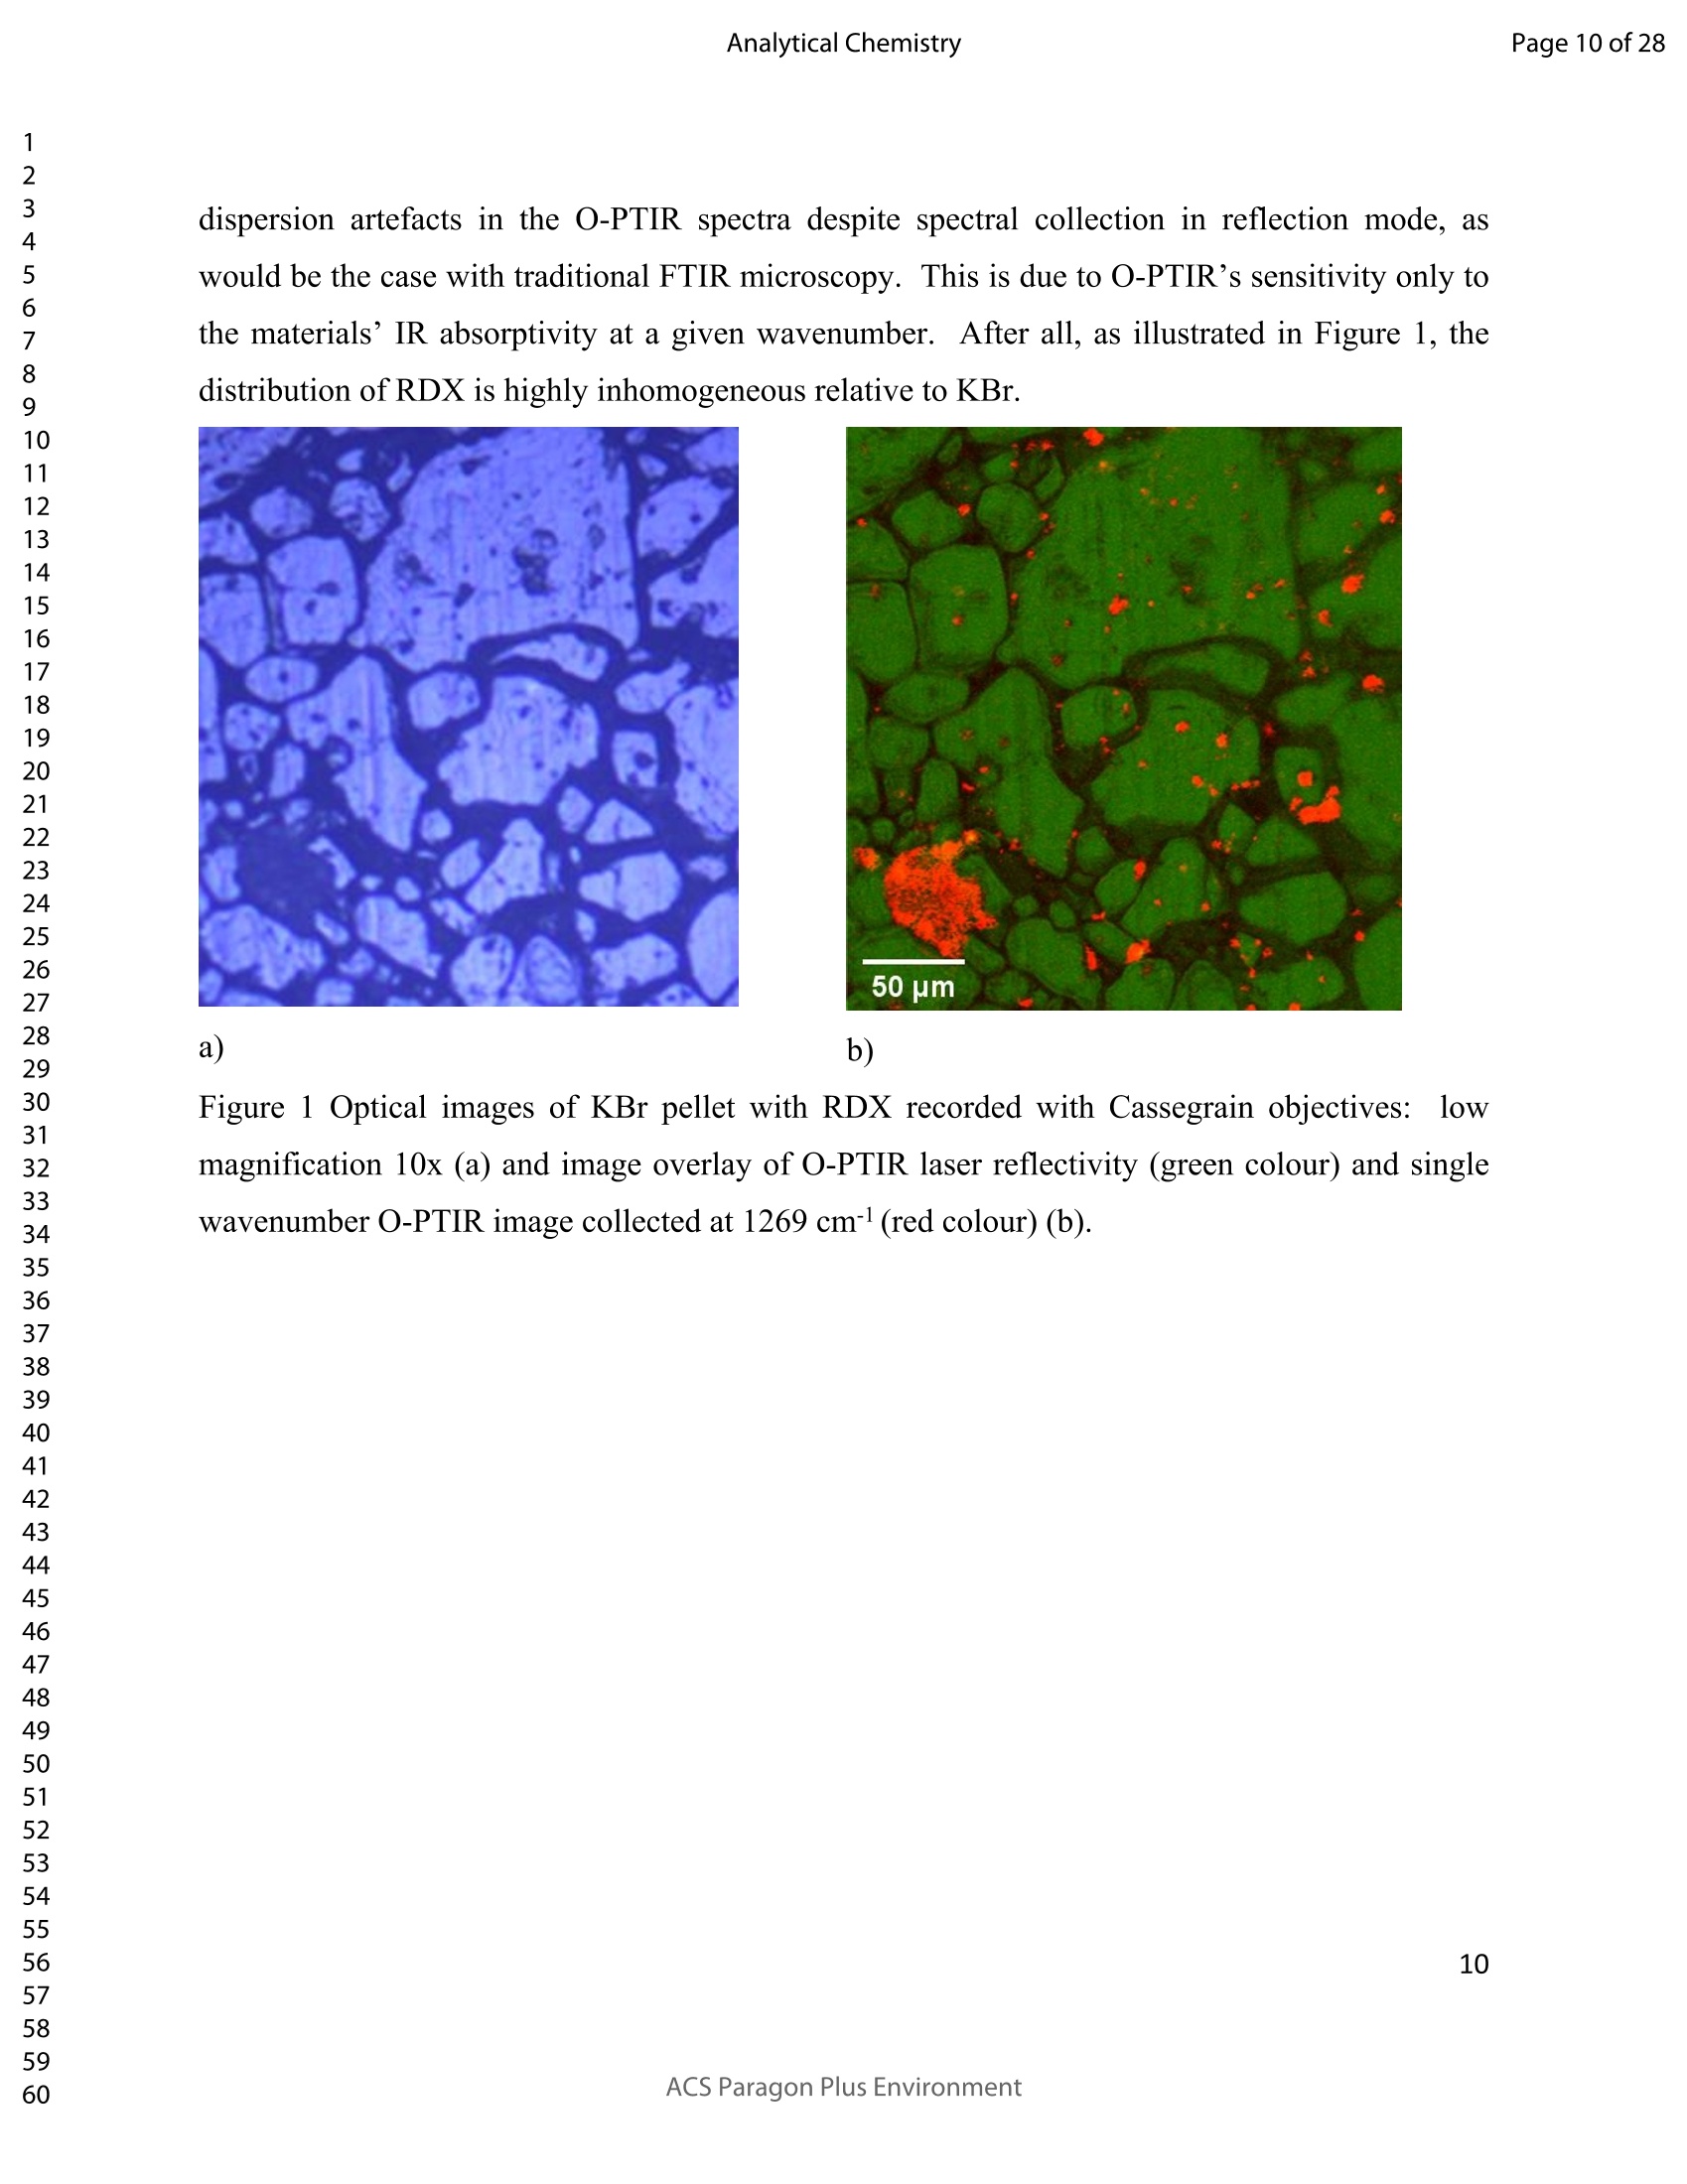
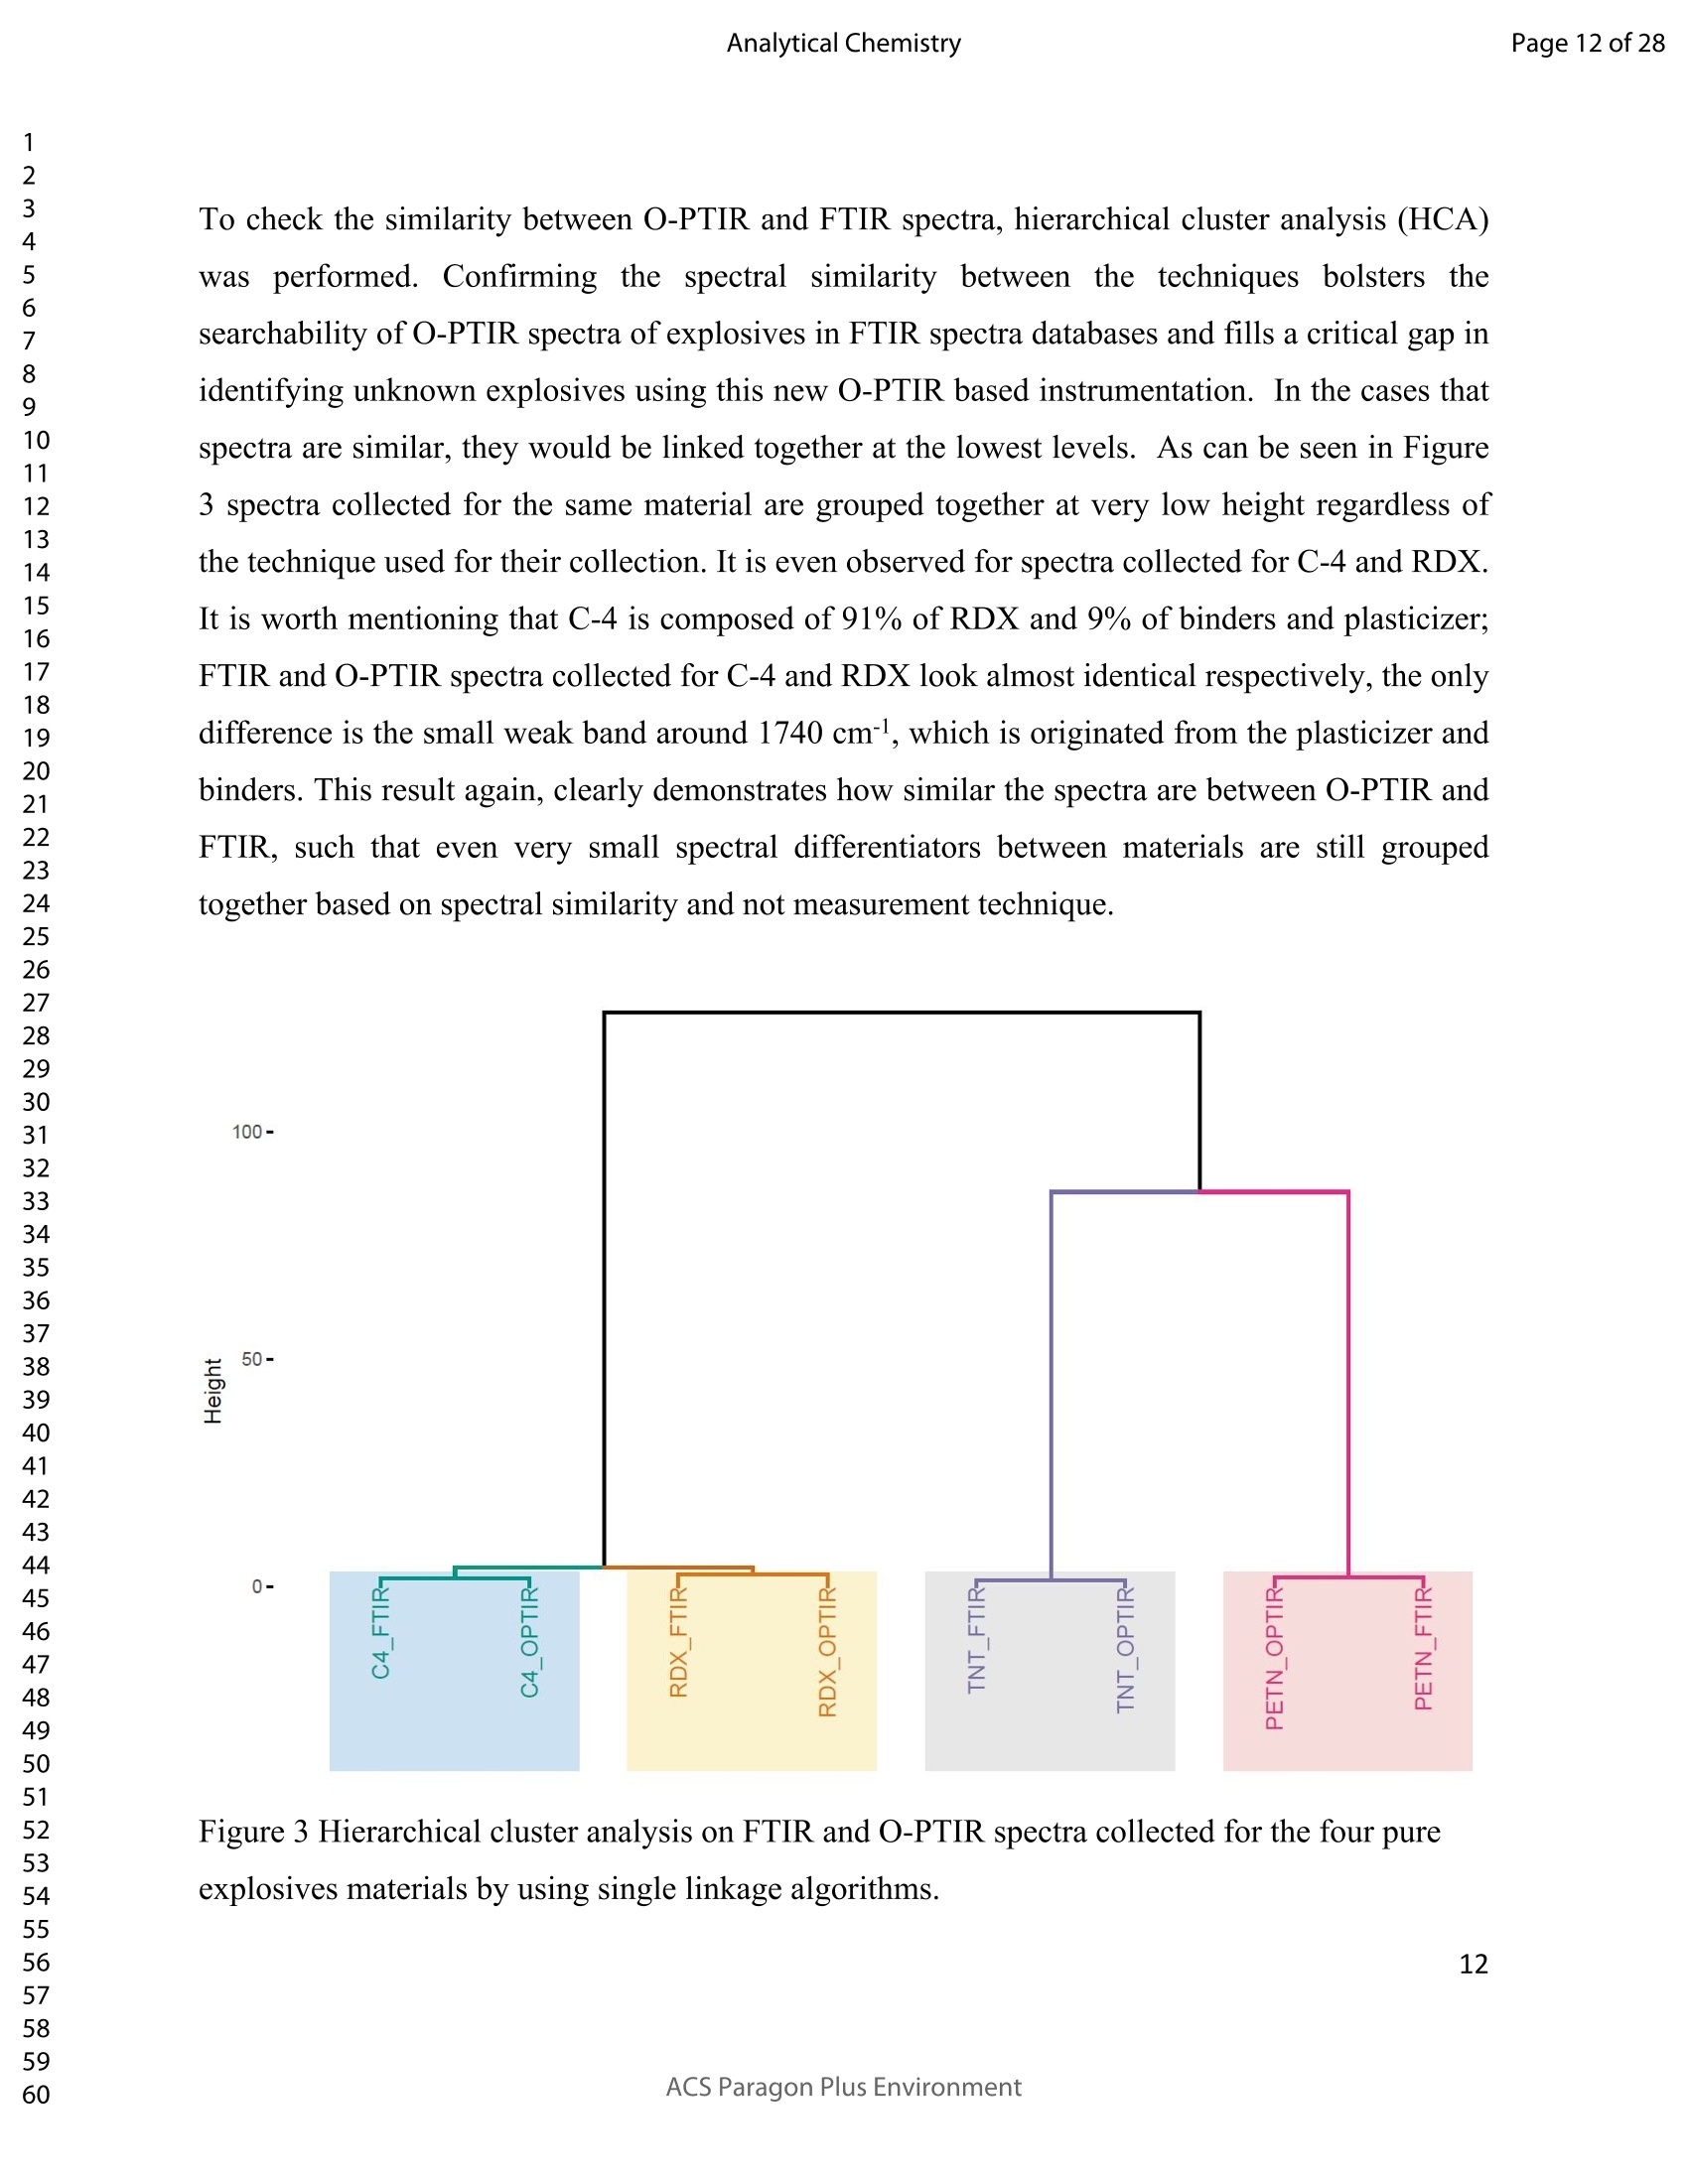
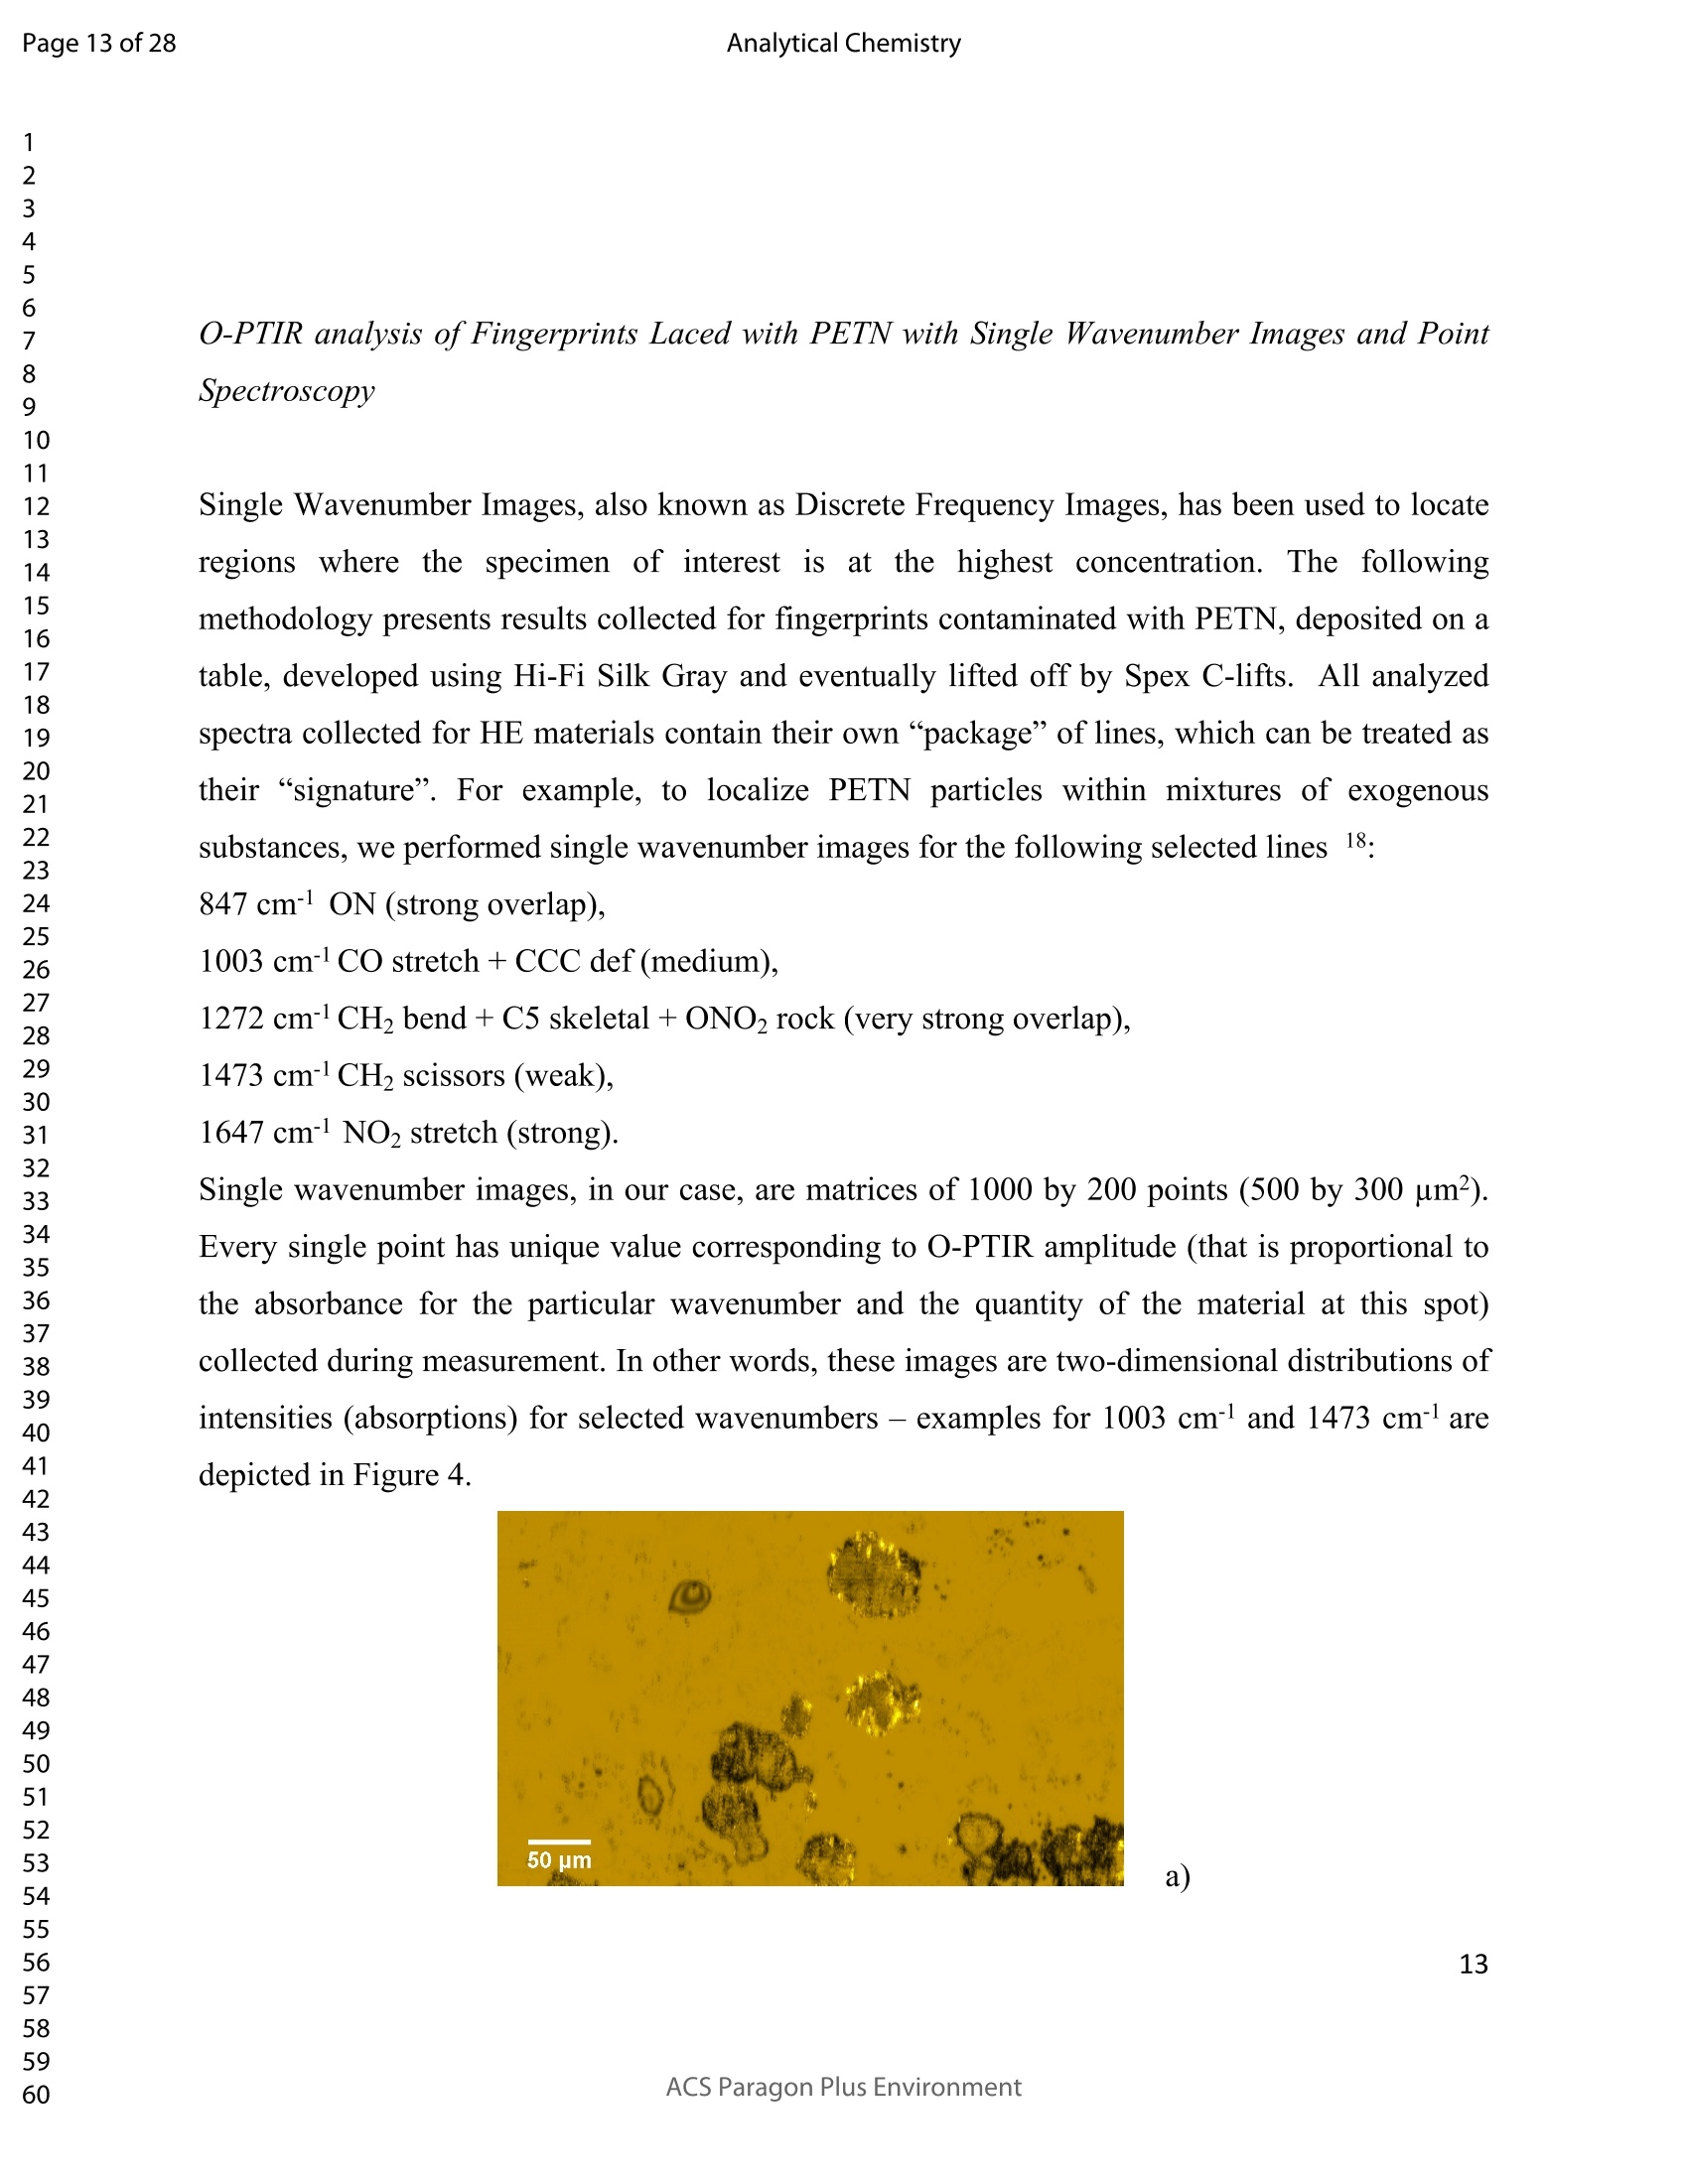
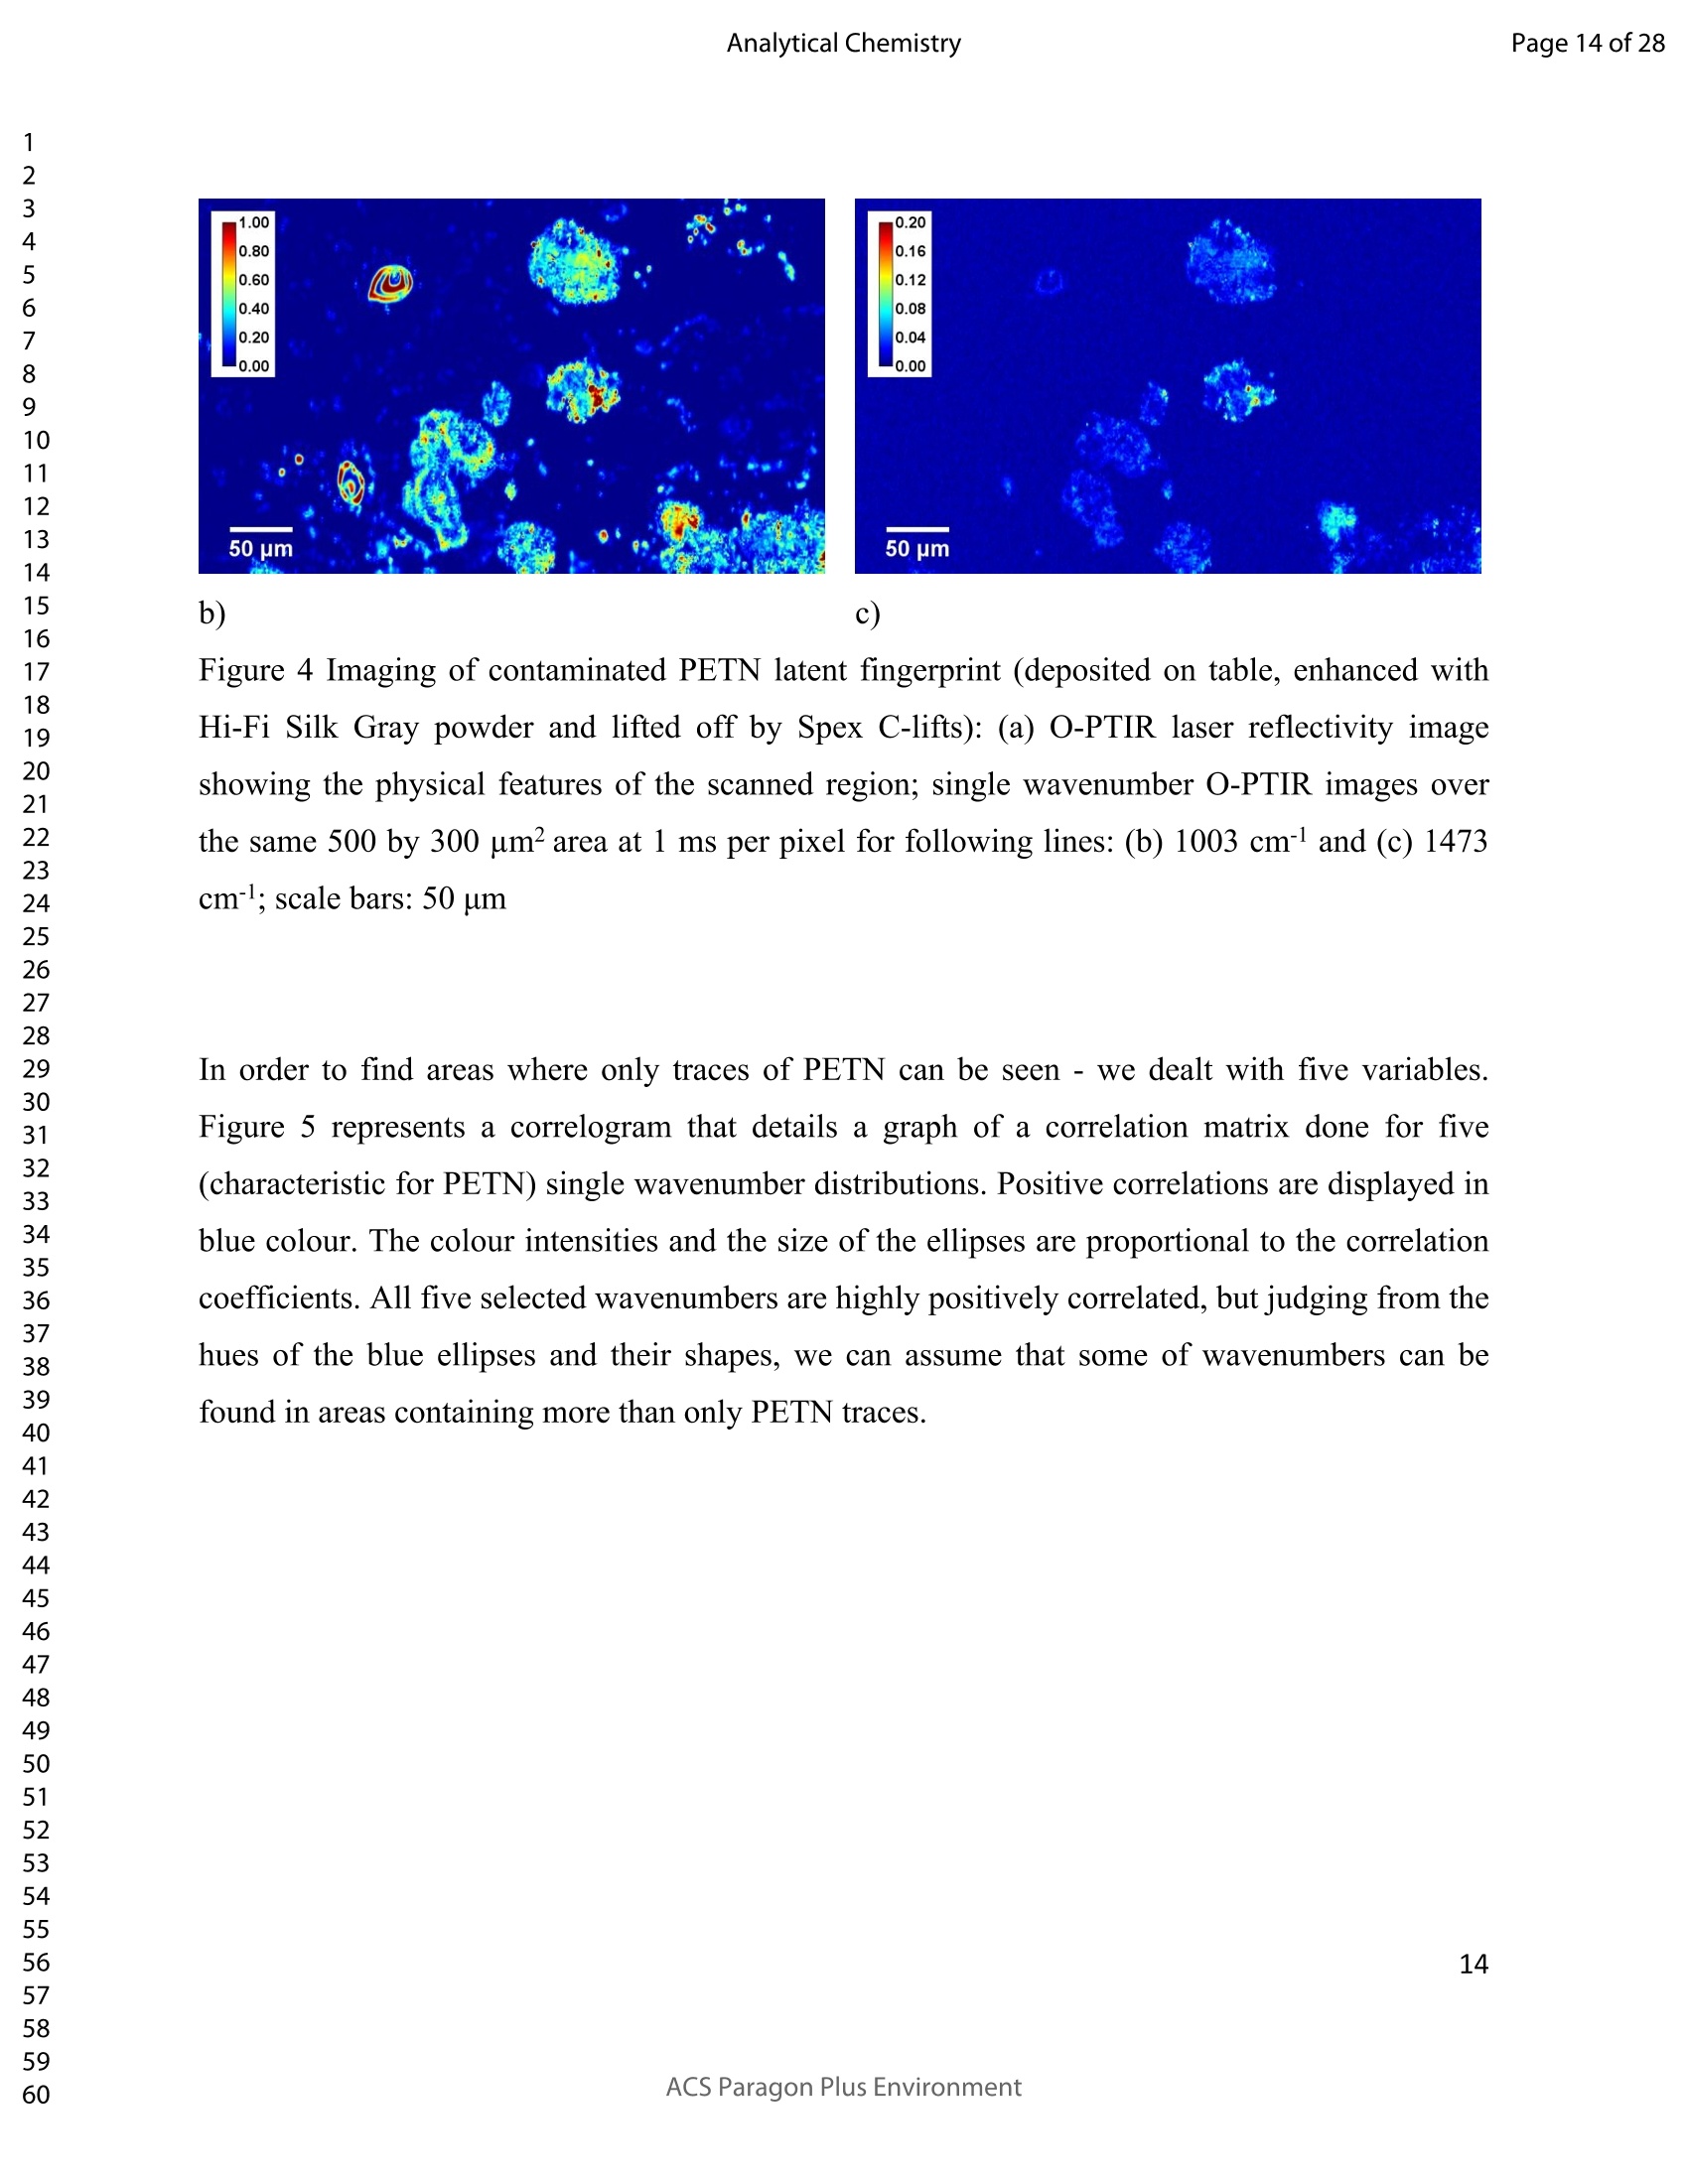
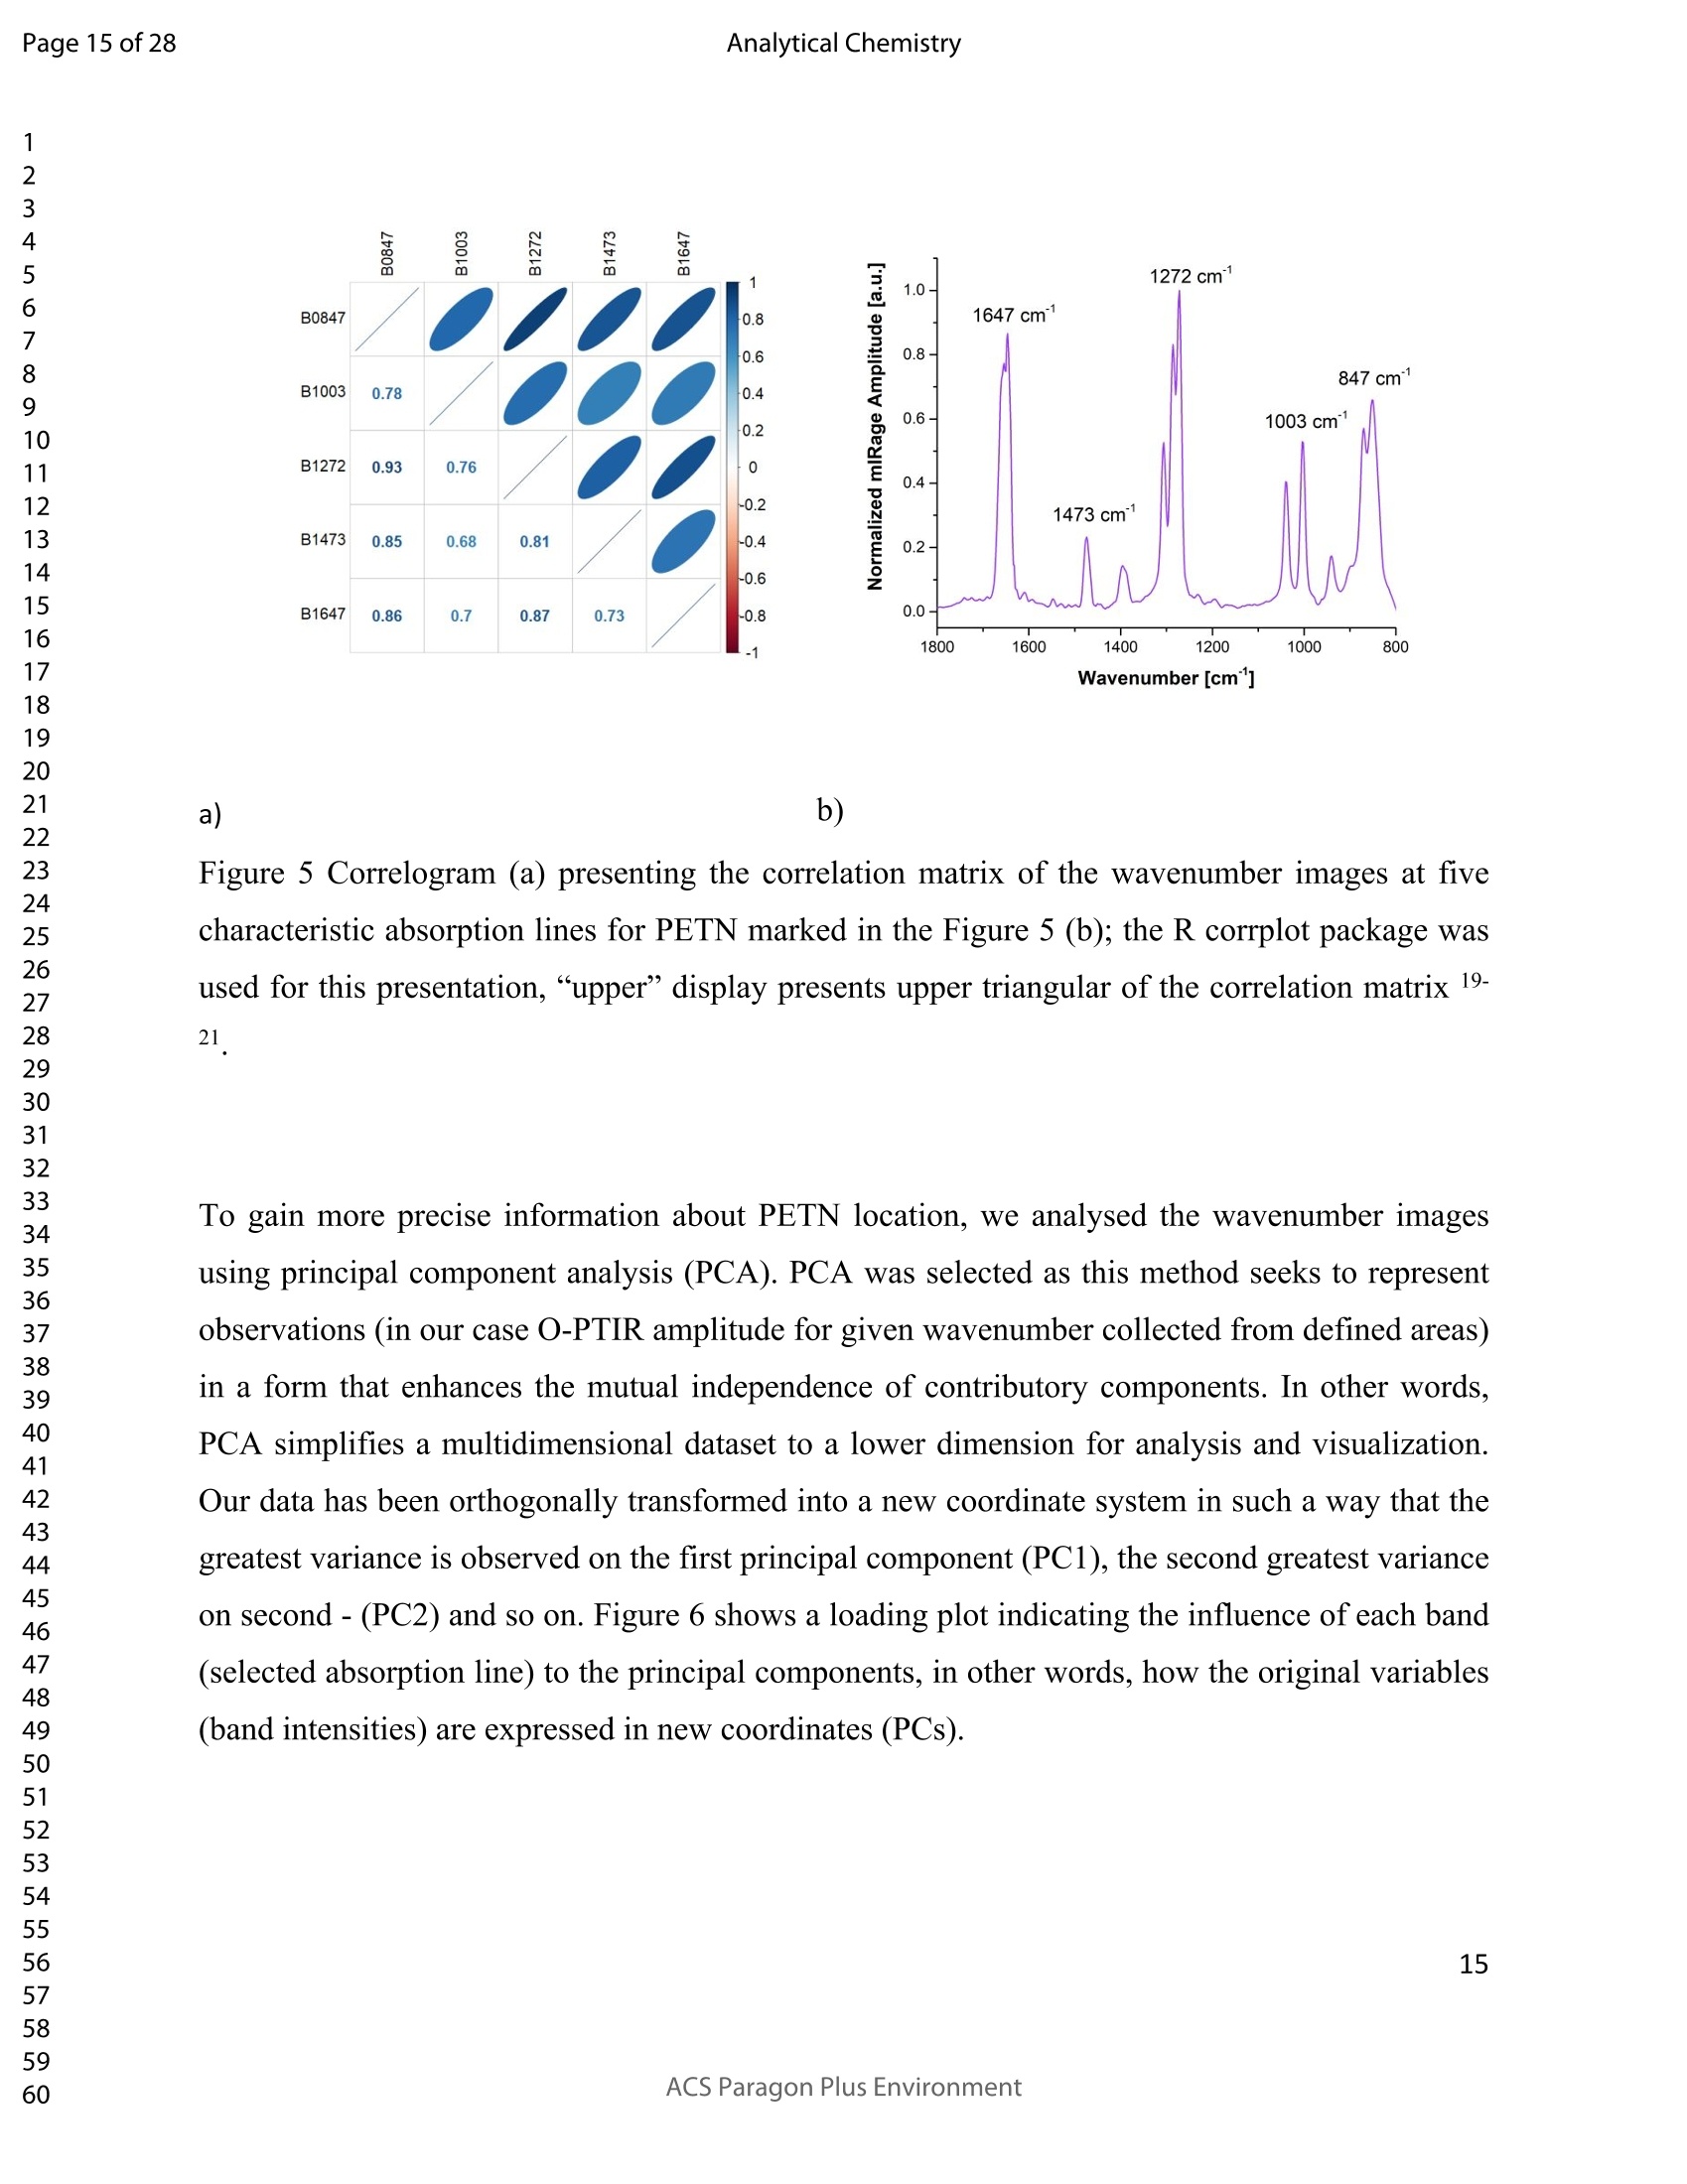
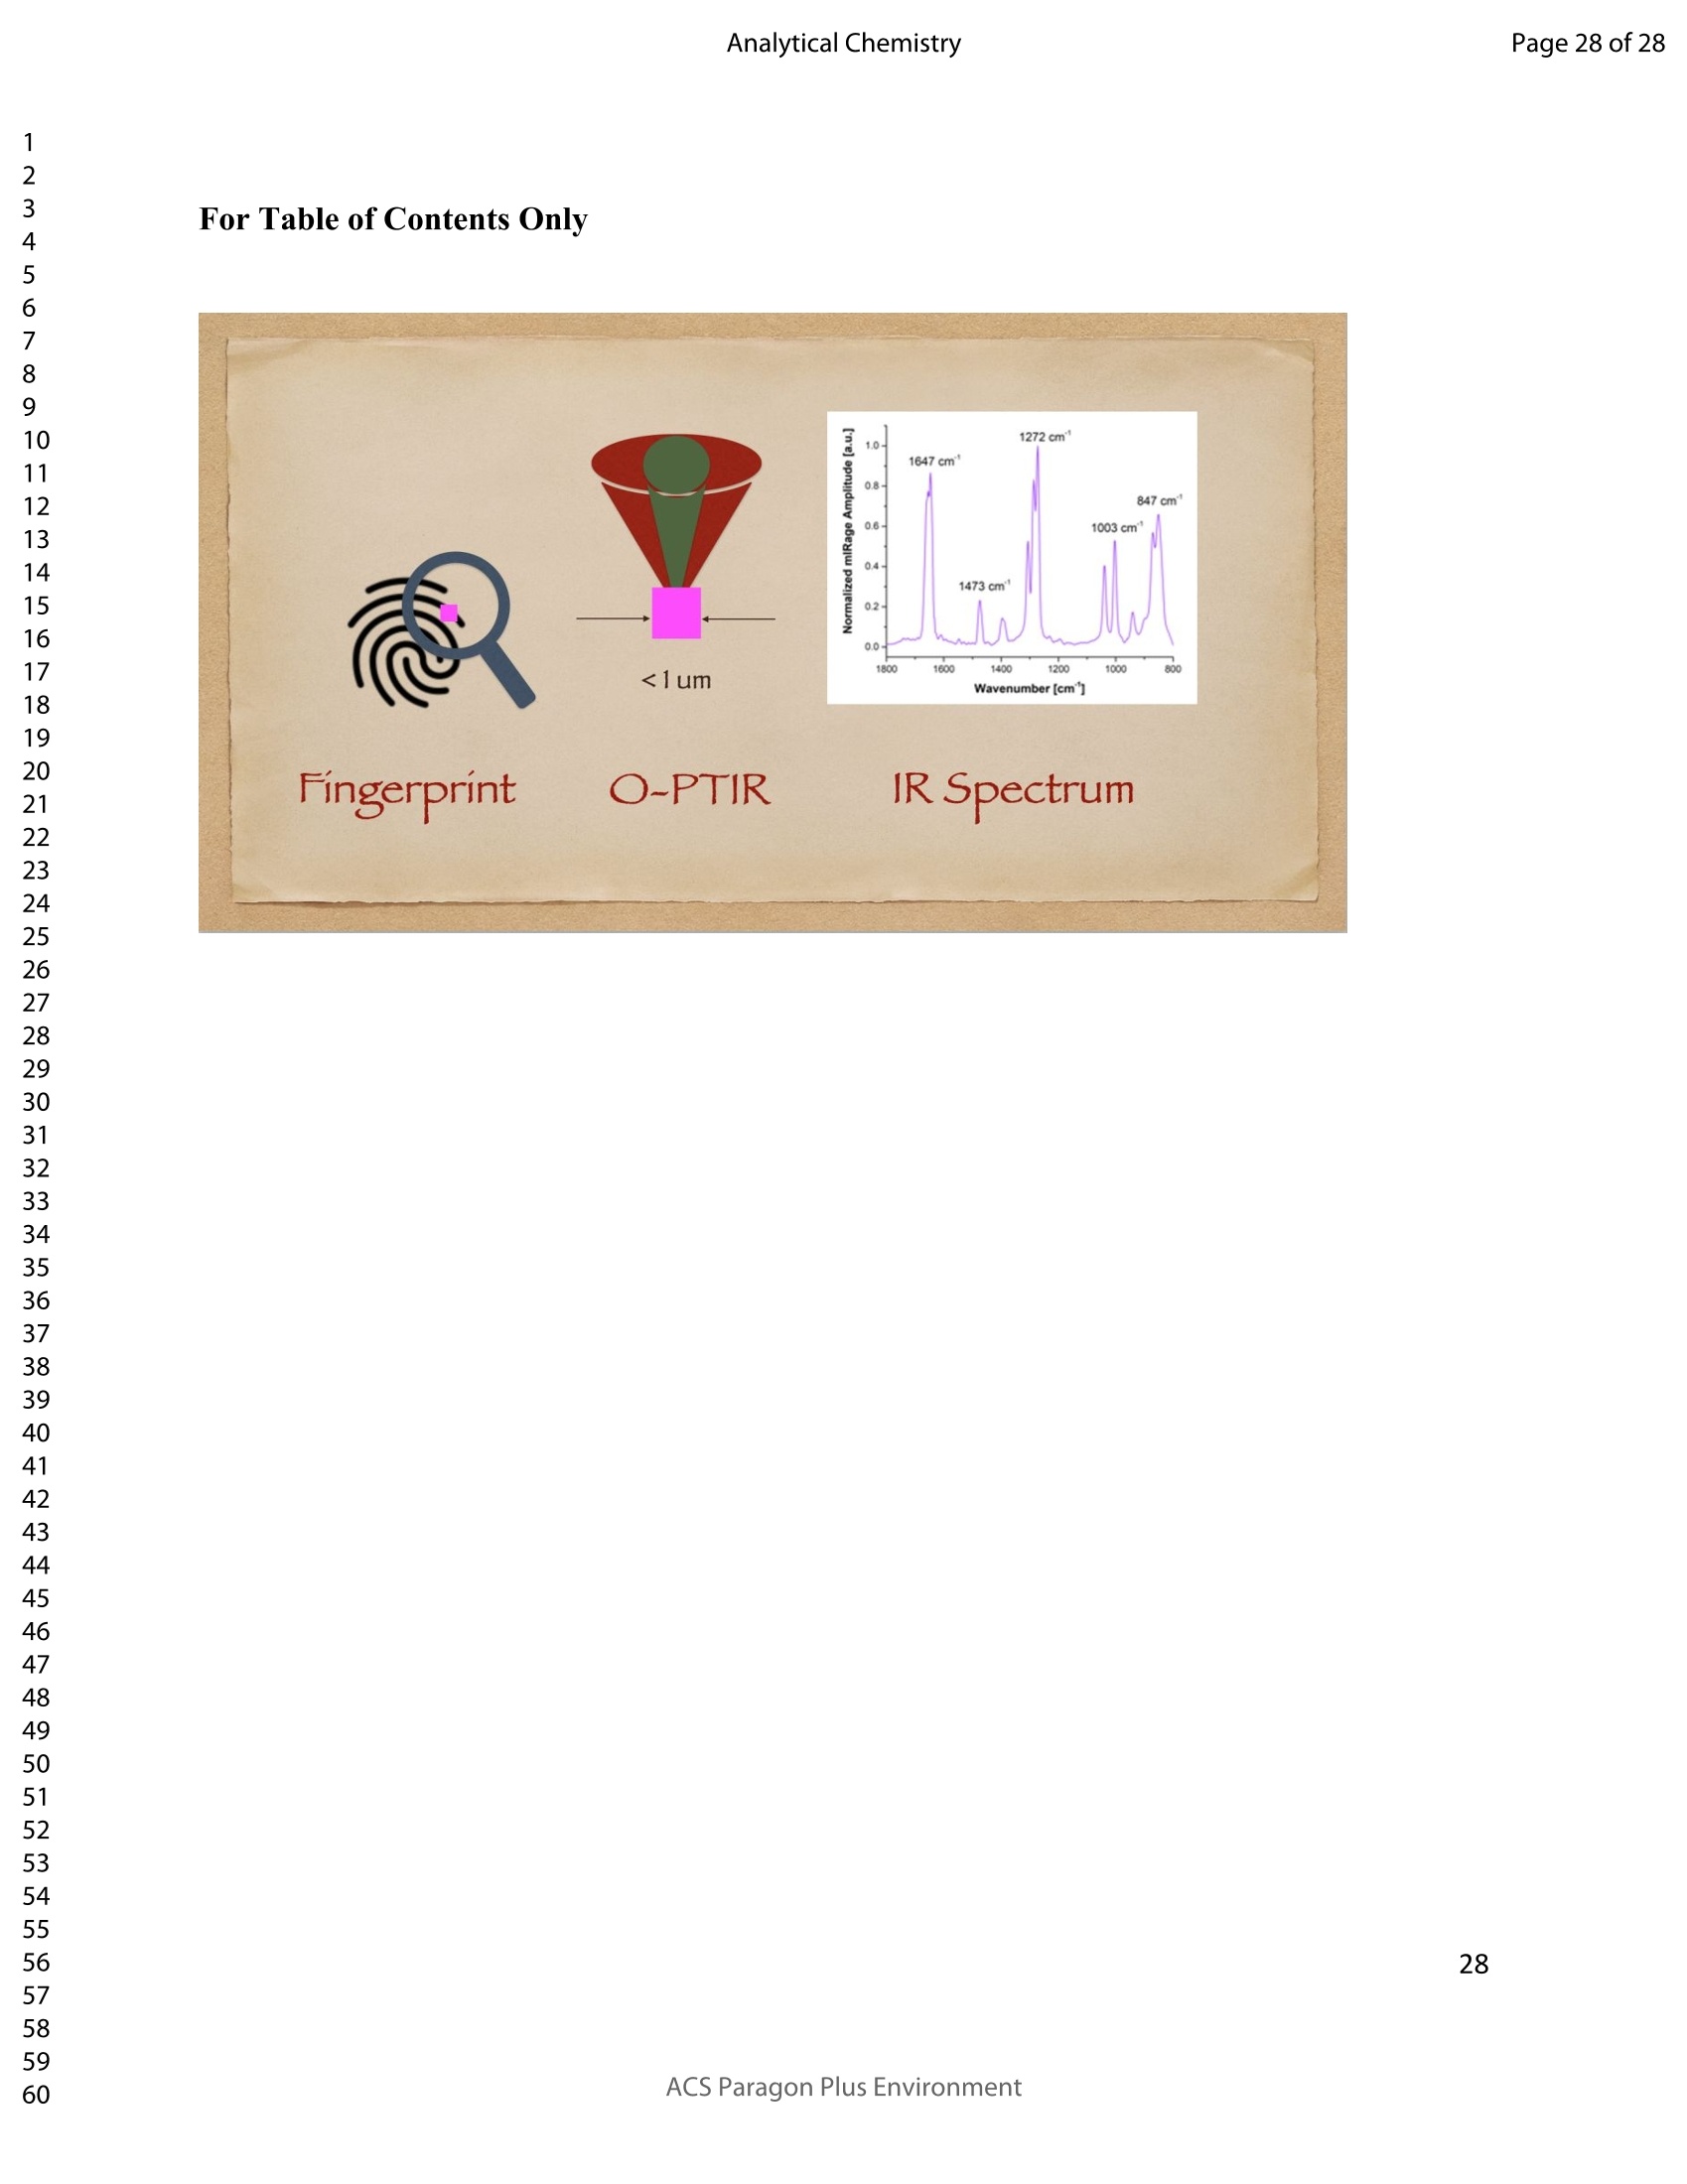
Subscriber access provided by University of Rochester |River Campus &; Miner LibrariesArticle Analytical ChemistryPage 1 of 28 Detection of high explosive materials within fingerprints bymeans of optical-photothermal infrared spectromicroscopy Agnieszka Maria Banas, Krzysztof Banas, Michael Kwun Fung LO, Mustafa Kansiz, Shenbaga Manogara Pandian Kalaiselvi, Seng Kim LIM,Jason LOKE, and Mark Brian Howell Breese Anal. Chem., Just Accepted Manuscript·DOI: 10.1021/acs.analchem.0c00938·Publication Date (Web): 22 Jun 2020 Downloaded from pubs.acs.org on June 22, 2020 Just Accepted “Just Accepted”manuscripts have been peer-reviewed and accepted for publication. They are postedonline prior to technical editing, formatting for publication and author proofing. The American ChemicalSociety provides “Just Accepted" as a service to the research community to expedite the disseminationof scientific material as soon as possible after acceptance. “Just Accepted”manuscripts appear infull in PDF format accompanied by an HTML abstract. “Just Accepted”manuscripts have been fullypeer reviewed, but should not be considered the official version of record. They are citable by theDigital Object Identifier (DOIQ). “Just Accepted”is an optional service offered to authors. Therefore,the “Just Accepted” Web site may not include all articles that will be published in the journal. Aftera manuscript is technically edited and formatted, it will be removed from the “Just Accepted” Website and published as an ASAP article. Note that technical editing may introduce minor changesto the manuscript text and/or graphics which could affect content, and all legal disclaimers andethical guidelines that apply to the journal pertain. ACS cannot be held responsible for errors orconsequences arising from the use of information contained in these “Just Accepted”manuscripts. ( i s published by the American Chemical S o ciety. 1155 Sixteenth S t reet N.W.,Washington, DC 20036 ) Published by American Chemical Society. Copyright C American Chemical Society. ( However, n o copyright claim is made to original U.S. Government works, or worksproduced by employees o f any Commonwealth rea l m Crown government in the cou r se of their duties. ) 1 Detection of high explosive materials within fingerprints by means of optical-photothermal infrared spectromicroscopy Agnieszka Banasl*, Krzysztof Banas, Michael Kwun Fung LO?, Mustafa Kansiz²,Shenbaga Manogara Pandian Kalaiselvil, Seng Kim LIM, Jason LOKE and MarkBrian Howell Breesel,4 I Singapore Synchrotron Light Source, National University of Singapore, 5 Research Link,Singapore 117603 2Photothermal Spectroscopy Corp, 325 Chapala Street, Santa Barbara, CA 93101 3Forensic Division, Criminal Investigation Department, Police Cantonment Complex 391 NewBridge Road 20-04, CID Tower Block C, Singapore 088762 4Physics Department, National University of Singapore, 2 Science Drive 3, Singapore 117542 *Corresponding author: Agnieszka Banas slsba@nus.edu.sg Abstract As we live today under a constant threat of global terrorism, effective detection of highlyenergetic materials is one of the critical procedures needed at a variety of locations includingairports, border checkpoints, and entrances to high security buildings.In this work, theapplication of O-PTIR (Optical- Photothermal InfraRed) spectromicroscopy for the detection ofhigh explosive materials within fingerprints is described. High explosive (HE) materials (PETN,RDX, C-4, TNT) were used to prepare contaminated fingerprints. These were subsequentlydeposited on various objects including microscopic glass slides, a table, a mug, etc. Samplesdeposited on glass slides were directly sent for analysis; for other samples, adhesive tapes wereused to lift off fingermarks. In cases of difficulty in locating fingerprints, additional powderswere used to enhance their visibility. Experiments were performed with the mIRage IRmicroscope working in non-contact, far-field reflection mode and offering submicron IRspectroscopy and imaging. Fast imaging (several characteristic absorbances were selected forevery substance of interest) was used to locate “suspicious”particles among various residuespresent in fingerprints. Subsequently spectra were collected for those particles. Reflection modeO-PTIR spectra taken from powdered and non-enhanced fingerprints were of comparable qualityto transmission mode FTIR spectra collected for pure HEs. Based on the performed experimentswe consider that O-PTIR spectromicroscopy opens a new avenue for non-destructive, efficientand reliable analysis of exogenous substancesdeposited within fingerprints. The realsignificance of O-PTIR is in its ability to deliver high quality spatially resolved FTIRtransmission-like spectra below the diffraction limit of infrared wavelengths, whilst doing so ineasy-to-use reflection (far-field) mode. Collected spectra are also searchable and interpretable inboth commercial and institutional IR databases without mathematical modelling. Keywords: O-PTIR (Optical- Photothermal InfraRed), FTIR (Fourier Transform InfraRed), highexplosive materials, latent fingerprint, submicron resolution, forensics, optical photothermalinfrared spectroscopy Introduction Non-invasive chemical analysis of minute traces of explosives and illicit materials is the holygrail of identifying potential threats. Human fingerprints are a kind of “photograph”left by thepattern of the friction ridge skin of human fingers. These imprints are possible due to the fact,that each ridge is connected to sweat glands; every finger’s contact with any surfaces stimulatesthe perspiration to be transferred from the gland to that surface. For many years (since the 19thcentury), analysis of fingerprints has been restricted only to the identification of person involvedin a crime scene. However, fingerprints represent not only a collection of the very individual andunique human features that remain unchanged during person’s life, but they also createtemporary stories about human lifestyle, habits, and occupation. It is very likely that residues ofmany things touched by the person, for example tablets taken every day, coffee scattered on thetable, etcetera, can be found within a complex mixture of natural secretions and contaminantsfrom environments deposited together with the ridges of fingerprints. From the forensic point ofview, finding traces of drugs or HE materials within fingerprints constitutes strong evidenceneeded to indict and convict a suspect. There is plethora of methods used to visualize those fingerprints which are invisible to the nakedeye (known as latent fingerprints) found at a crime scene. The most popular techniques arepowdering, ninhydrin fuming 1-3 and vacuum metal deposition 4. Unfortunately, these methodscan only reconstruct the fingerprint patterns and additionally can be destructive for somechemicals present within the ridges. Recently, many techniques have been also employed toanalyze traces of exogenous materials found within fingerprint ridges. For example, DesorptionElectrospray Ionization Mass Spectroscopy (DESI-MS) offers chemical imaging capabilitiesthrough mass spectra recorded without sample preparation from ordinary samples in their nativeenvironment. However, to perform this technique, a special solvent must first be electrosprayedonto the surface. This method has rather poor spatial resolution of 150 um 5. Another chemicalmethod, Liquid Chromatography- Mass Spectroscopy (LC-MS), offers undoubted separation,identification and quantification of species present in a fingerprint 6. However, its maindrawback is the complete destruction of the very same fingerprint during the analytical process. Fourier Transform InfraRed (FTIR) spectromicroscopy probes intrinsic molecular vibrations ofbonds between molecules present in a sample, providing rich chemical information. Nowadays,FTIR is widely used in many applications as a fast, label-free and non-destructive samplecharacterization method. As a versatile and sensitive technique, FTIR has also become anincreasingly valuable forensic tool in recent decades. For example, it has been successfully usedto analyze exogenous materials present in fingerprints. In all available papers 7-9 fingerprintscontaminated by exogenous material were deposited onto dedicated substrates. For transmissionmode experiments IR transparent materials were chosen silicon 9, mylar foil 10 for reflectionmode experiments- aluminum-coated glass substrates 7,9, 11 were used. Often analyses of fingerprints are limited to the collection of two-dimensional distributions ofselected wavenumbers. There is literature that has explored IR imaging as a tool for studyingboth the spatial distribution of the component materials and the identification of individualconstituents. 11-13 In some papers 8, 10 analysis of contaminated fingerprints has been done by means of an ATRobjective, especially when samples were deposited on substrates which were neither transparentnor reflective for IR radiation. In such cases, the use of an ATR objective seems to be the onlyway to analyze the sample. Unfortunately, ATR experiments often are not ideal for forensicanalysis because those experiments require an intimate contact between the analyzed sample andthe ATR crystal, which often lead to a sample deformation or even destruction of the lastremaining evidence.. This is equally true for the ATR crystal itself, which can be scratchedand/or broken over time, leading to the need for costly replacement.The crystal must bethoroughly cleaned after each experiment to avoid cross-contaminating subsequent specimens.Finally, to perform such experiments, it is necessary first to locate the “suspicious”particle.FTIR spectromicroscopy allows analysis of exogenous materials without a priori knowledge ofthe sample, but the diffraction limit of mid-IR wavelengths (2.5-25 um) constrains the lateralresolution of this method. Therefore, only the chemical and structural information of objects withlimited sizes (usually greater than 10 um) can be revealed. The amount of light absorbed in theIR light entering the detector from minute samples is small,leading to noisy spectra. The lack of sensitivity and resolution drastically reduces the likelihood of detecting even the smallest hint ofthreat. To analyze small particles with FTIR microscope, one typically needs to employ apertures tomask out unwanted IR radiation from areas outside the sample. Whilst this is common and aneffective method to target smaller particles, the use of apertures limits the light throughput andhence degrades spectral signal-to-noise (sensitivity) significantly, as well as adding furthercomplexity to the measurement workflow. Higher-end FTIR microscopes are more commonlyequipped with a 2D Focal Plane Array (FPA) detector, which removes the need for apertures,with each detector pixel measuring from a defined spot on the sample. Nevertheless, bothaperture-based and FPA-based FTIR microspectroscopy techniques are further hampered by theneed for cryogenic cooling (liquid nitrogen) of the detectors, which again adds complexity andcost. Effective detection of the smallest amounts of highly energetic materials is still one of the mostimportant procedures needed at a variety of locations including airports, border checkpoints, andentrances to high security buildings. As mentioned earlier, fingerprints can be treated as a mineof information providing both an unambiguous form of identification and a “history”of recentactivities in which person has been directly involved. Keeping in mind Dr Edmond Locard’swords:“Every contact leaves a trace... Only human failure to find it, study and understand it,can diminish its value”, it seems that non-destructive approaches (without any sample alteration)to analyze even the tiniest traces of suspected materials hidden in the plethora of exogenousmaterials present in fingerprints is fundamental. This method could deliver exhaustive chemicalsample identification, ipso facto helping in a crime prevention. This work describes the first application of the newly emerging O-PTIR technique for analysis ofHE particles in fingerprints, bringing advantages that includes submicron resolution for IRimaging and spectroscopy,whilst operating in an easy-to-use far-field, non-contact microscopymode and offering significantly higher sensitivity than FTIR spectromicroscopy. This samplingarrangement represents a unique opportunity to capture and identify threats without physicallycontacting the high explosives while preserving the original state of the evidences.The stillpristine specimen could be further analyzed by other analytical methods for confirmatory purposes. Here, the model high explosive materials include PETN, RDX, C-4, and TNTdispersed within fingerprints deposited on various substances without any sample preparation.The specimens were only enhanced by powder dusting and were lifted with adhesive tapes asdescribed per previous analysis using classic FTIR spectromicroscopy 10, 14. The experimentalresults suggest the O-PTIR-based microscope could open a new avenue for non-destructive,efficient and reliable analysis of exogenous substances deposited within fingerprints. Combininghigh lateral resolution with excellent spectral quality, O-PTIR is essential analytical tool toforensic sciences as a new investigation modality with sub-micron spatial resolution. 1 Materials and methods HE materials, powders and tapes were obtained from Forensic Management Branch of theCriminal Investigation Department in Singapore Police Force. These are classified as secondaryhigh explosives 15-16 and were used to contaminate fingerprints in preliminary experiments withthe O-PTIR based microscope.The four representative high explosives (HEs) were listed asbelow: RDX (Cyclonite or Hexogen, the IUPAC name is 1,3,5-trinitro-1,3,5-triazinane); C-4 (composed of 91% by weight of RDX with the remainder composed of plasticizerand a few percent binder (polyisobutylene); PETN (pentaerythritol tetranitrate. IUPAC name: 3-nitrooxy-2,2-bis(nitrooxymethyl)propyl nitrate); TNT (2,4,6-trinitrotoluene, IUPAC name: 2-methyl-1,3,5-trinitrobenzene). Two kind of samples were prepared for the experiments: ‘direct’and “indirect”fingerprintscontaminated with four HEs. 1. In order to prepare the first type of samples (“direct"), clean volunteer’s finger enhancedby the sebaceous secretions from the forehead touched the selected HE, any excesssubstances were brushed away with the other hand. Subsequently, the fingermark hasbeen deposited onto microscopic glass. 2.“Indirect”fingerprints - in this case contaminated fingerprints, were deposited on varioussubstrates (including table, mug, door). Afterward they were developed using powders(Hi-Fi Silk Gray, Hi-Fi Silk Black, Hi-Fi Indestructible White) and lifted off by means ofthree types of tapes (Sirchie hinge lifter, Spex C-lifts, and BVDA black Gellifter). All experiments were performed at the branch of the upgraded ISMI beamline (at the SingaporeSynchrotron Light Source) for the sub-micron Infrared characterization using mIRagemicroscope by the Photothermal Spectroscopy Corp (PSC). Detailed information regarding thistechnique is presented by M. Kansiz and co-workers 1. During experiments, a tunable pulsed mid-IR Quantum Cascade Laser (QCL) illuminated thesample, causing small photothermal responses (rapid conversion of photon energy into heatoccurs within a few picoseconds). This effect was sensed by the second (green 532 nm) laserradiation co-located with the IR light, allowing IR absorption to be detected and collected. Thespatial resolution is now defined by the wavelength and the spot size of the short wavelengthgreen laser and not the long wavelength IR source. The QCL was operated in pulsed mode, with500 ns pulses at a repetition rate of up to 100 kHz, corresponding to a maximum duty cycle of5% The focused spot size of the probe green laser was about 500 - 1000 nm to deliver submicronspatial resolution. Spectra were collected within the region of 1800 - 800 cm; the number of co-added scans per spectrum was optimized during the study. The laser powers of the IR and probewere each set to approximately 1 -5 mW per spectrum. Before spectra collection, optical images of the samples were recorded using Cassegrainobjectives:low magnification 10x, 0.3NA (working distance of about 15 mm) and highmagnification 40x, 0.78NA (working distance of about 8 mm). The latter was also used for O-PTIR spectra collection, which were saved and processed in PTIRStudio 4.0 software suppliedwith the instrument. Prior to analysis of contaminated fingerprints, the instrument waswavenumber calibrated against a polystyrene standard. The effective spectral resolution was setapproximately to 4 cm. Prepared samples were placed on the automated scanning stage withoutany further preparation. The sample chamber has been purged with dried nitrogen during allexperiments in order to eliminate water vapor absorption. Before each experimental session, the background signal was recorded (at the same experimentalconditions) to take into account influence of the IR laser power distribution on final spectrum. For this study, we focused on the collection of: 1. O-PTIR spectra for pure explosives. For that purpose, previously measured samples bymeans of transmission FTIR spectroscopy were used. The samples were in form of thin,transparent pellets (diameter 13 mm, thickness less than 1 mm), prepared by mixingaround 1 mg of HE material with less than 100 mg KBr. The mixture was subsequentlycompressed in a hydraulic press. 1 2.. Single wavenumber images by tuning the laser wavelength to values correlated toselected absorption bands of HEs; in order to co-localize the particles-of-interest (tracesof HE) within the samples prepared for the experiments. The typical size of the imagewas 500 um by 300 um with a resolution of 1000 by 200 points, and an acquisition timeof 13 minutes for one image. For every HE material at least five characteristic lines wereselected for imaging. Measurements were done automatically using a software routinecalled“sequence capture." 3.Single O-PTIR spectra or hyperspectral data from the selected particles of interest. Thesize of the hyperspectral object was defined by the size of the selected particle; the mapspacing was always kept below or around one um in the x and y directions. Results and discussion O-PTIR spectra for pure model explosives Prior to analysis of contaminated fingerprints, O-PTIR spectra for all available HE materialswere recorded. This was needed to estimate experimentally the similarity between spectracollected by transmission FTIR spectroscopy and the reflection mode O-PTIR technique. As wasmentioned earlier, the same samples were used for experiments performed with the FTIRspectrometer and the O-PTIR based microscope. As can be seen in the optical micrograph in Figure 1a, the KBr pellet with HE materials seems tobe inhomogeneous.To locate the HE particles in between grains of KBr, several singlewavenumber images were collected. Figure 1b depicts the total probe (green) laser reflectivitysignal from the sample (green colour) overlaid with the IR image at 1269 cm, whichcorresponds to a prominent IR absorption line of RDX’s C-N stretch (red colour). Spots with thehighest amplitudes for the selected wavenumbers served as a guide for further single pointspectra collection. O-PTIR measurements, similar to FTIR spectroscopy, provide informationabout absorption bands collected as a function of wavenumber [cm]. O-PTIR measurementswere done in a non-contact reflection mode while providing FTIR transmission-like infraredspectra that are artifact-free. The strongly scattering nature of the KBr crystals does not cause dispersion artefacts in the O-PTIR spectra despite spectral collection in reflection mode, aswould be the case with traditional FTIR microscopy. This is due to O-PTIR’s sensitivity only tothe materials’IR absorptivity at a given wavenumber. After all, as illustrated in Figure 1, thedistribution of RDX is highly inhomogeneous relative to KBr. a) b) Figure 1 Optical images of KBr pellet with RDX recorded with Cassegrain objectives:lowmagnification 10x (a) and image overlay of O-PTIR laser reflectivity (green colour) and singlewavenumber O-PTIR image collected at 1269 cm (redcolour) (b). 1 Technique OPTIR Figure 2 FTIR (black) and O-PTIR spectra (pink) collected for reference samples containingpure HE materials (C-4, RDX, PETN and TNT). Figure 2 presents a comparison of spectra collected for C-4, RDX, PETN and TNT by means ofO-PTIR and FTIR spectroscopy. Despite being collected in a non-contact (far-field), reflectionmode, O-PTIR spectra still very closely match FTIR absorption spectra measured in transmissionmode, which are linearly related with concentration through Beer’s law. Major absorbance peaks in the analyzed substances are virtually identical between O-PTIR andFTIR spectra. Of course, some differences are visible because FTIR spectroscopy depends notonly on the samples’ infrared absorption characteristics, but also on refractive index, scatteringand dispersion artefacts as the IR radiation goes through the sample. Thus, in some respects, O-PTIR spectra deliver more “pure" IR spectra. In the case of the O-PTIR technique, we areoptically sensing the localized thermal lens effect of the photothermally excited material with amonochromatic probe in the visible range. To check the similarity between O-PTIR and FTIR spectra, hierarchical cluster analysis (HCA)wasperformed. Confirming the spectral similarity between the techniques bolsterssearchability of O-PTIR spectra of explosives in FTIR spectra databases and fills a critical gap inidentifying unknown explosives using this new O-PTIR based instrumentation. In the cases thatspectra are similar, they would be linked together at the lowest levels. As can be seen in Figure3 spectra collected for the same material are grouped together at very low height regardless ofthe technique used for their collection. It is even observed for spectra collected for C-4 and RDX.It is worth mentioning that C-4 is composed of 91% of RDX and 9% of binders and plasticizer;FTIR and O-PTIR spectra collected for C-4 and RDX look almost identical respectively, the onlydifference is the small weak band around 1740 cm-l, which is originated from the plasticizer andbinders. This result again, clearly demonstrates how similar the spectra are between O-PTIR andFTIR, such that even very small spectral differentiators between materials are still groupedtogether based on spectral similarity and not measurement technique. Figure 3 Hierarchical cluster analysis on FTIR and O-PTIR spectra collected for the four pureexplosives materials by using single linkage algorithms. 1 O-PTIR analysis of Fingerprints Laced with PETN with Single Wavenumber Images and PointSpectroscopy Single Wavenumber Images, also known as Discrete Frequency Images, has been used to locateregionswhere the specimen of interest: 1isat the highest concentration. The followingmethodology presents results collected for fingerprints contaminated with PETN, deposited on atable, developed using Hi-Fi Silk Gray and eventually lifted off by Spex C-lifts. All analyzedspectra collected for HE materials contain their own “package”of lines, which can be treated astheir “signature". For example, to localize PETN particles within mixtures of exogenoussubstances, we performed single wavenumber images for the following selected lines, 18.847 cm-ON (strong overlap), 1003 cm²CO stretch +CCC def (medium), 1272 cmCH bend+ C5 skeletal +ONO2 rock (very strong overlap), 1473 cmCH2 scissors (weak), 1647 cmNO2 stretch (strong). Single wavenumber images, in our case, are matrices of 1000 by 200 points (500 by 300 um?).Every single point has unique value corresponding to O-PTIR amplitude (that is proportional tothe absorbance for the particular wavenumber and the quantity of the material at this spot)collected during measurement. In other words, these images are two-dimensional distributions ofintensities (absorptions) for selected wavenumbers- examples for 1003 cm and 1473 cmaredepicted in Figure 4. a) 1 b ) C) Figure 4 Imaging of contaminated PETN latent fingerprint (deposited on table, enhanced withHi-Fi Silk Gray powder and lifted off by Spex C-lifts): (a) O-PTIR laser reflectivity imageshowing the physical features of the scanned region; single wavenumber O-PTIR images overthe same 500 by 300 um? area at 1 ms per pixel for following lines: (b) 1003 cm and (c) 1473cm-l; scale bars: 50 um In order to find areas where only traces of PETN can be seen- we dealt with five variables.Figure 5 represents a correlogram that details a graph of a correlation matrix done for five(characteristic for PETN) single wavenumber distributions. Positive correlations are displayed inblue colour. The colour intensities and the size of the ellipses are proportional to the correlationcoefficients. All five selected wavenumbers are highly positively correlated, but judging from thehues of the blue ellipses and their shapes, we can assume that some of wavenumbers can befound in areas containing more than only PETN traces. 1 Figure 5 Correlogram (a) presenting the correlation matrix of the wavenumber images at fivecharacteristic absorption lines for PETN marked in the Figure 5 (b); the R corrplot package wasused for this presentation,“upper”display presents upper triangular of the correlation matrix 19-21 To gain more precise information about PETN location, we analysed the wavenumber imagesusing principal component analysis (PCA). PCA was selected as this method seeks to representobservations (in our case O-PTIR amplitude for given wavenumber collected from defined areas)in a form that enhances the mutual independence of contributory components. In other words,PCA simplifies a multidimensional dataset to a lower dimension for analysis and visualization.Our data has been orthogonally transformed into a new coordinate system in such a way that thegreatest variance is observed on the first principal component (PC1), the second greatest varianceon second -(PC2) and so on. Figure 6 shows a loading plot indicating the influence of each band(selected absorption line) to the principal components, in other words, how the original variables(band intensities) are expressed in new coordinates (PCs). Figure 6 A loading plot indicating the influence of each band (selected absorption lines forPETN: B1647,B1473, B1272, B1003 and B0847) to the principal components. The two firstprincipal components (PC1 and PC2) explained 90.9 % of total variation in analysed system. All bands strongly influence PC1; however, the value of projection of the 1003 cm bandloading on PC2 has the opposite sign compared to the rest of analysed bands. It may indicate thatpresence of this band is not only limited to PETN and its image distribution should not be takeninto account in finding the areas only with PETN. As can be seen in Figure 6, PC2 clearlydivides selected wavenumbers. All bands, except 1003 cm, have negative values for thisprincipal component, and have consistent the loading vectors that indicate the presence of PETNin a given area. Figure 7a depicts the distribution of PC2 within the analysed area; five physicallocations (having the highest negative values) on the sample have been selected for single spectracollection in order to confirm our assumption of the PETN existence. 1 a) b) Figure 7 Spatial distribution of PC2 calculated for five characteristic absorption lines for PETN(a) and a RGB composite image, in the red channel the distribution of 847 cm-1 is stored; in bluechannel 1473 cm-1 and in green channel 1272 cm-1 (b). Selection of“suspicious”spots (with PETN) can be also done by taking into account only thesingle wavenumber images. Figure 7b shows a RGB composite image, in the red channel thedistribution of 847 cm is stored; in blue channel 1473 cm- and in green channel 1272 cm. Bymerging colour-coded images, an overlaid picture with bright spots has been obtained. As can beseen the location of bright (whitish) spots (Figure 7b) is in agreement with the blue spots havingthe lowest values for PC2 scores (Figure 7a). All images were prepared and analysed by ImageJ2open-source Java image processing program 22. 1 Figure 8 Comparison of O-PTIR spectra collected for selected points within latent fingerprintwith reference spectrum for PETN. The spectra are offset for clarity; 20 scans were co-averagedfor a total of 35 seconds per spectrum. O-PTIR spectra collected for the five points marked in Figure 7a resemble the spectrum collectedfor pure PETN; all characteristic absorption lines for this HE material, can be observed withinthese spectra. Of course, the analyzed points contain not only traces of pure PETN. Additionallines, and the shape of the baseline especially within the region of 1200-800 cmcome probablyfrom the powder used to enhance visibility of the latent fingerprint and also other substancespresent within fingerprints. This demonstration had effectively showed the O-PTIR techniquecould extract critical chemical identity of particulates within latent fingerprints directly withoutany additional sample preparation and without physically contacting the same. O-PTIR Hyperspectral Analysis of RDX Traces in Fingerprints deposited directly on themicroscopic glass As was mentioned earlier, the O-PTIR method enables collection of spectra at submicronresolution. As an example, hyperspectral data was taken covering the surrounding materials (areaselected in Figure 9a by pink rectangular) including the small perceivable RDX particles as percaptured IR images taken for five characteristic absorption lines for RDX: 1594,1392,1269,1040 and 924 cm(data not shown). The size of the hyperspectral object was set to 8.16 by 9.78um?, 99 spectra were collected with a spacing of 1.02 um in x and 0.98 um in y directions. Thisset of parameters ensures taking full advantage of the wavenumber-independent sub-micronspatial resolution of the O-PTIR technique. Figure 9b presents the distribution of the integralcalculated for the strongest absorption bands for RDX (1269 cm). It is worth pointing out herethat this hyperspectral approach isis very similar to experiments performed by meansS o1conventional FTIR microscope with a FPA (focal plane array) detector (when thousands ofspectra are collected from the area defined by the size of detector). However, in a conventionalFTIR microscope, the pixel resolution depends on the type of objective mounted on the IRmicroscope (15x and 36x), which would typically yield pixel sizes of 2.7 um² and 1.1 um?respectively (transmission or reflection mode). However, the true spatial resolution of aconventional FPA-based FTIR will still be diffraction limited to approximately 7.5 - 17 umacross the fingerprint IR spectral region, corresponding to 1800-800 cm²(5.6-12.5 microns),irrespective of the stated pixel sizes. It is also noteworthy, that in conventional FTIR imagingspatial resolution is highly wavenumber (wavelength) dependent with low wavenumbers (higherwavelengths)providing for significantly worsespatial resolution compared to higherwavenumbers (shorter wavelengths). This is in stark contrast to the O-PTIR technique whichprovides for constant, submicron spatial resolution across the entire IR spectrum.Figure 9c depicts raw spectra (without any normalization) collected from five neighbouring spots (marked in Figure 9b). The O-PTIR spectrum taken from the “centre”(c), where the highestamplitude of integral for 1269 cm- wavenumber is observed (Figure 9b), resembles the spectrumobtained for pure RDX (Figure 2). The same conclusion is also true for the spectra registered from the top (t) and left (1) to the centre, but the amplitudes of the absorption lines areprofoundly decreased. As shown in this example, with the O-PTIR instrument it is possible to detect a single particulateof a high explosive in a low concentration environment. It is worth stressing that the quality ofspectrum collected from the centre- the area around 1 um for ca. 7 picograms, is outstandingand based on our experience, it is impossible for the FPA-based FTIR to produce spectra of forthis quantity of mass. 1 c) Figure 9 Visible image of particles present in contaminated by RDX fingerprint depositeddirectly on microscopic glass (a). The small perceivable RDX particles (pink rectangular) as per captured IR images (taken for five characteristic absorption lines for RDX: 1594, 1392, 1269,1040 and 924 cm-1) have been selected for hyperspectral imaging. Distribution of the integralcalculated for the strongest absorption bands for RDX (1269 cm-1) (b); spectra taken from 5spots (l-left, c-centre, r-right, t-top, b-bottom) are presented in (c). Conclusions Based on the presented results we conclude that the O-PTIR technique is an ideal choice foranalyzing very challenging samples, such as latent fingerprints, offering chemical informationabout tiny (submicron) particles hidden in a plethora of exogenous materials with no samplepreparation. This information can be obtained in the form of single wavenumber imaging andspectra at submicron spatial resolution level; the latter capability is not possible even with FTIRspectromicroscopy. This analysis was done in a simple, non-destructive approach, without the need for contact-basedtechniques such as ATR spectroscopy. Sample integrity is completely preserved during theexperiment. The non-invasive nature of this technique is very important especially in forensicapplications, as it enables analysis of the same sample by means of other complimentarytechniques or to present the sample as a legal evidence. Furthermore, in recent instrumentationdevelopments, O-PTIR can now be coupled with Raman microscopy to provide true submicronsimultaneous IR+Raman microscopy to provide for complementary and confirmatory analysis inone measurement on one instrument. We hope to explore these new capabilities in subsequentstudies. It is worth stressing that quality of O-PTIR spectra is high. Artifacts caused by wavelength-dependent IR scattering are negligible due to the fact that absorption is probed by a second laserbeam at a fixed wavelength. High quality spectra of unknown identity can be searched in an IRdatabase in order to find the best match.Analyzed particles can be smaller than 1 um indiameter (~7 pg) -and the resulting spectra are of high quality that would not have beenachievable for this kind of sample using classical FTIR spectromicroscopy. In addition, the sample preparation requirement was greatly relaxed, excellent results could stillbe achieved with fingerprints lifted off from various surfaces with standard forensic techniques.These improvements save significant amount of time and also maintain the integrity of preciousforensic evidence. With such a non-destructive technique trace amounts of evidence wouldprovide sufficient information to convict or discharge suspects. Like a conventional fingerprintimaging tool, the patterns resembling adult fingermark of the high explosive traces can also becollected at the 1016 cm asymmetric O-C-C stretch (ester) or 1740 cm carbonyl stretchingmode (ester) and compared to fingerprint databases in a coordinated physical and chemicalefforts in locking down the suspect of interest. Of course, performing these images for wholefingerprint will take time, but it can be done automatically via hyperspectral data collection. Theresulting image can completely profile and paint a detailed picture about the recent chemicalhistory of the suspect. The above report portrays confidence in the O-PTIR-based infrared microscope for deploymentin forensic science and judicial applications. The O-PTIR technique, is an invaluable tool foranalyzing exogenous materials present in latent fingerprints, and can be safely treated as a“gamechanger”in contemporary IR spectroscopy. This sensitive and selective technique could be ofgreat benefits for many national security applications. Acknowledgements The authors gratefully acknowledge the financial support from NUS Core Support C-380-003-003-001, A*STAR/MOE RP 3979908M and A*STAR 12 105 0038 grants. ( References ) 1. Forensic Science Handbook, 2nd ed.; Saferstein, R., Ed.; Upper Saddle River, NJ:,2002. 2.Sodhi, G. S.; Kaur, J. Powder Method for Detecting Latent Fingerprints: A Review.Forensic Sci. Int.2001, 120 (3),172-176. ( 3. Jelly, R.; Patton, E. L. T.; Lennard, C.; Lewis, S. W.; L im, K. F . The Detection ofLatent Fingermarks on P orous Surfaces U s ing Amino Acid Sensitive Reagents: AReview. Analytica Chimica Acta. 2009,652(1-2), 128-142. ) ( 4. Kent, T.; Thomas, G. L.; Reynoldson , T . E.; Eas t , H. W. A Vacuum CoatingTechnique for the Development of Latent Fingerprints on Polythene. J. Forensic Sci.Soc.1976,16(2),93-101. ) ( 5. I fa, D. R.; Manicke, N. E .; Dill, A. L.; Cooks, R. G. Latent Fingerprint ChemicalImaging by Mass Spectrometry. Science. 2008,321(5890),805 . ) ( 6. Goucher, E.; Kicman, A.; Smith, N.; Jickells, S. The Det e ction and Quantification ofLorazepam a n d Its 3-O-Glucuronide in Fingerprint D e posits b y L C -MS/MS. J. S e p.Sci. 2009,32(13),2266-2272. ) ( 7. Bhargava, R . ; Schwartz Perlman, R.; Fe r nandez, D. C.; Levin, I. W . ; Bartick, E. G.Non-Invasive Detection o f Superimposed Lat e nt Fingerprints and Inter-Ridge Trac e Evidence by I nfrared Spectroscopic Imaging. Anal . Bioanal . Chem.2009, 394 ( 8),2069-2075. ) 8. Mou, Y.; Rabalais, J. W. Detection and Identification of Explosive Particles inFingerprintsUsing Attenuated Total Reflection-Fourier Transform InfraredSpectromicroscopy.J. Forensic Sci. 2009, 54 (4),846-850. 9.Ng, P. H.R.; Walker, S.; Tahtouh, M.; Reedy, B. Detection of Illicit Substances inFingerprints by Infrared Spectral Imaging. Anal. Bioanal. Chem. 2009, 394 (8),2039-2048. 10. Banas, A.; Banas, K.; Breese, M. B. H.; Loke, J.; Heng Teo, B.; Lim, S. K. Detectionof Microscopic Particles Present as Contaminants in Latent Fingerprints by Means ofSynchrotron Radiation-Based Fourier Transform Infra-Red Micro-Imaging. Analyst2012,137(15),3459-3465. 11. Tahtouh, M.; Despland, P.; Shimmon, R.; Kalman, J. R.; Reedy, B. J. TheApplication of Infrared Chemical Imaging to the Detection and Enhancement of 1 Latent Fingerprints: Method Optimization and Further Findings. J. Forensic Sci.2007,52(5),1089-1096. 12. Crane, N. J.; Bartick, E. G.; Perlman, R. S.; Huffman, S. Infrared SpectroscopicImaging for Noninvasive Detection of Latent Fingerprints. J. Forensic Sci. 2007, 52(1),48-53. 13. Bartick, E. G.; Schwartz,R. L.; Bhargava, R.; Schaeberle, M.; Fernande, D.; Levin, I.Spectrochemical Analysis and Hyperspectral Imaging of Latent Fingerprints. InProceedings of the 16th Meeting of the International Association of ForensicSciences; Monduzzi Editore: Montpellier, 2002; pp 61-64. 14. Banas, A.; Banas, K.; Breese, M. B. H.; Loke, J.; Lim, S. K. Spectroscopic Detectionof Exogenous Materials in Latent Fingerprints Treated with Powders and Lifted offwith Adhesive Tapes.Anal. Bioanal. Chem. 2014,406(17),4173-4181. 15.Murray, S. G. EXPLOSIVES| Military. In Encyclopedia of Forensic Sciences;Siegel, J. A., Saukko,P.J., Knupfer, G. C., Eds.; Elsevier, 2000; pp 764-771. ( 16. Forensic Investigation of E xplosives; B everidge, A., Ed . ; Taylor and Fran c is: London, 1998. ) ( 17. Kansiz, M.; P rater, C.; Dillon, E.; Lo, M.; Anderson, J.; Marcott, C.; Demissie, A.;Chen, Y.; K u nkel, G. Optical Photothermal Inf r ared Mic r ospectroscopy withSimultaneous Raman - A Ne w Non - Contact Failure Ana l ysis Tec h nique forIdentification of <;10 Mm Organic Contamination i n the Hard D rive a nd OtherElectronics I ndustries. Micros. T oday 2020, 28 (3), 2 6 -36. ) ( 18. Perger, W. F.; Zhao, J.; Winey, J . M .; Gupta, Y. M . Fi r st-Principles S t udy ofPentaerythrito l Tetranitrate Single Crystalsunder High hPressure: Vibrational Properties. Chem. Phys. Lett. 2006,428(4-6), 3 94-399. ) 19. Huang, J.; Kumar, S. R.; Mitra, M.; Zhu, W. J.; Zabih, R. Image Indexing UsingColor Correlograms. In Proceedings of the IEEE Computer Society Conference onComputer Vision and Pattern Recognition; 1997; pp 762-768. 20. Wei, T.; Simko., V. R Package“Corrplot": Visualization of a Correlation Matrix.2017. 21.Friendly, M. Corrgrams: Exploratory Displays for Correlatigon Matrices. Am. Stat.2002,56(4),316-324. 22. Rueden, C. T.; Schindelin, J.; Hiner, M. C.; DeZonia, B. E.; Walter, A. E.; Arena, E.T.; Eliceiri, K. W. ImageJ2: ImageJ for the next Generation of Scientific Image Data.BMC Bioinformatics 2017, 18(1). Figure captions Figure 1 Optical images of KBr pellet with RDX recorded with Cassegrain objectives:lOWmagnification 10x (a) and image overlay of O-PTIR laser reflectivity (green colour) and singlewavenumber O-PTIR image collected at 1269 cm(red colour) (b). Figure 2 FTIR (black) and O-PTIR spectra (pink) collected for reference samples containingpure HE materials (C-4, RDX, PETN and TNT). Figure 3 Hierarchical cluster analysis on FTIR and O-PTIR spectra collected for the four pureexplosives materials by using single linkage algorithms. Figure 4 Imaging of contaminated PETN latent fingerprint (deposited on table, enhanced withHi-Fi Silk Gray powder and lifted off by Spex C-lifts):(a) O-PTIR laser reflectivity imageshowing the physical features of the scanned region; single wavenumber O-PTIR images overthe same 500 by 300 um? area at 1 ms per pixel for following lines: (b) 1003 cm and (c) 1473cm-; scale bars: 50 um Figure 5 Correlogram (a) presenting the correlation matrix of the wavenumber images at fivecharacteristic absorption lines for PETN marked in the Figure 5 (b); the R corrplot package wasused for this presentation,“upper”display presents upper triangular of the correlation matrix 19-21 Figure 6 A loading plot indicating the influence of each band (selected absorption lines forPETN: B1647, B1473, B1272, B1003 and B0847) to the principal components. The two firstprincipal components (PC1 and PC2) explained 90.9 % of total variation in analysed system. Figure 7 Spatial distribution of PC2 calculated for five characteristic absorption lines for PETN(a) and a RGB composite image, in the red channel the distribution of 847 cm-1 is stored; in bluechannel 1473 cm-1 and in green channel 1272 cm-1 (b). Figure 8 Comparison of O-PTIR spectra collected for selected points within latent fingerprintwith reference spectrum for PETN. The spectra are offset for clarity; 20 scans were co-averagedfor a total of 35 seconds per spectrum. Figure 9 Visible image of particles present in contaminated by RDX fingerprint depositeddirectly on microscopic glass (a). The small perceivable RDX particles (pink rectangular) as percaptured IR images (taken for five characteristic absorption lines for RDX: 1594,1392, 1269,1040 and 924 cm-1) have been selected for hyperspectral imaging. Distribution of the integralcalculated for the strongest absorption bands for RDX (1269 cm-1) (b); spectra taken from 5spots (l-left, c-centre, r-right, t-top, b-bottom) are presented in (C). For Table of Contents Only CS Paragon Plus Environment 在全球恐怖主义不断威胁下的今天,有效的易爆炸物检测已经成为众多重要区域需要进行的关键程序之一,包括机场,边境检查站,以及高安全建筑的入口等。指纹作为人类留下痕迹的一种“照片”——手指的摩擦脊皮肤的图案,自19世纪以来已经成为犯罪现场鉴定当事人身份的一种常规手段。另外,许多被人接触过的东西都会残留在指纹的自然分泌物和污染物的复杂混合物中,如每天服用的药片,咖啡,或刑侦领域常见的毒品和易爆炸物等。传统的可视化指纹检测手段,如扑粉,茚三酮熏蒸,真空金属沉积等,尽管可以重建指纹图案,但其同时可能对一些指纹脊状突起中含有的化学物质造成破坏。近年来,许多技术被用于指纹中痕量外源物质的分析鉴定,如解吸电喷雾电离质谱(DESI-MS),液相色谱-质谱(LC-MS),但通常需要额外的溶剂喷雾处理,且空间分辨率不足(~150 μm),或者分析过程会对指纹造成破坏。傅里叶变换红外(FTIR)光谱显微镜,可以探测样品中分子间化学键的固有分子振动,并提供丰富的化学信息, 已成为一种快速、无需标记、无损的样品表征方法,被广泛应用于包括刑侦在内的众多领域。FTIR透射模式测试通常选用红外光透明的材料,而反射模式则选用硅片,聚酯薄膜或铝覆盖的玻璃基底,但两者在指纹分析上多局限于收集在选定波数下指纹中组分物质的二维分布信息。另外对于那些沉积在既不透明也不反射红外的基底上的样品,衰减全反射法(Attenuated total reflectance,ATR)似乎成为唯一的选择,但ATR通常不是法医鉴定的一种理想方法,因为ATR要求被分析的样品和ATR晶体紧密接触,往往会导致样品变形甚至最后破坏剩余的证据。 图1. 光热红外光谱显微技术用于检测指纹中的易爆炸物基于以上考虑,新加坡国立大学同步辐射光源线站的科学家们和新加坡刑事调查局刑侦部门共同合作开发出了一种新的红外检测手段(图1),即使用基于新型光热红外(Optical- Photothermal InfraRed,O-PTIR)技术的非接触亚微米分辨红外拉曼同步测量系统mIRage来分析指纹中含有的痕量易爆炸物微粒,该技术带来了一系列的优势,如亚微米级的红外光谱和成像分辨率,易操作的远场、非接触显微镜工作模式和明显高于FTIR光谱显微镜的灵敏度。在实验过程中,四种代表性易爆材料,包括PETN(季戊四醇四硝酸酯)、RDX(黑索今炸药)、C-4 (塑料炸药,黑索今炸药和塑化剂,粘结剂的混合物)和TNT(2,4,6-三硝基甲苯),可直接被分散在指纹内(“直接”指纹)或沉积在基底物质上 (间接”指纹)进行检测,无需任何复杂的样品制备过程。而传统红外样品制备时通常会使用KBr,混合后在一定压力下进行薄片的压制。从光学显微照片2a中可以看出,薄片中KBr颗粒与RDX的混合是不均匀的,肉眼无法准确识别出目标物质RDX。为了定位混在KBr颗粒之间的易爆物,作者采集了单一波长1269 cm-1下的O-PTIR图像, 对应于RDX分子的C-N拉伸振动的显著红外吸收线(红色),清晰显示了RDX分子在混合物中的分布情况。另外,类似于FTIR光谱技术,光热红外技术可以提供样品红外吸收带相对于波数[cm-1]的谱图函数信息。如图2c所示, 作者采集了C-4, RDX,PETN和TNT四种物质的O-PTIR图像和FTIR光谱,通过对比可知所有分析的光谱都包含易爆物自身的特征红外吸收峰,可以视为他们的“签名”。值得注意的是,尽管基于O-PTIR的非接触亚微米分辨红外拉曼同步测量系统mIRage使用非接触(远场),反射模式,其光谱质量仍然非常接近于透射测量模式下的FTIR吸收光谱,且红外吸收带强度和浓度之间遵照比尔定律成线性关系。图2. (a) Cassegrain显微物镜记录的混有RDX的KBr薄片的10倍放大光学图像,(b) O-PTIR激光反射(绿色)和在1269 cm-1波长下采集的单波数O-PTIR图像(红色)叠加后的照片, (c) 含有四种高爆炸物的参照物的FTIR(黑色)和O-PTIR(红色)谱图对比,(C-4, RDX, PETN 和 TNT)。单波数图像,又称为离散频率图像,已被广泛用于高倍率下样品感兴趣区域的定位。图3a展示了作者收集到的被PETN污染的指纹光学图像,该指纹沉积在桌面上,是通过使用粉末(Hi-Fi Silk Gray)显影, 胶带(Spex C-lifts)分离后获取到的。在该例子中,单波数的图像为1000×200点组成的矩阵(500×300 μm2),每一个单点都对应于该位置O-PTIR振幅的唯一值(即与特定波数下(1003 cm-1和1473 cm-1,该点处材料的红外吸收和数量成正比),换句话说,这些图像是所选波数下红外吸收强度的二维分布(吸收)图。图3. (a) 被易爆物PETN污染的指纹的光学照片,(b)指纹中五个不同位置收集的O-PTIR光谱与PETN的标准参考红外谱图的对比;(c, d)在同样的500 * 300平方英寸的面积下采集的单波数下O-PTIR图像,每像素约1毫秒,(c) 1003 cm-1和 (d) 1473 cm –1。综上所述,作者认为O-PTIR技术是一种分析具有挑战性样品的理想手段,如隐藏的指纹,提供隐藏在大量外源物质中的微小(亚微米)粒子的化学信息(如易爆物)且不需要复杂的样品制备过程。这些信息可以通过单波数红外成像和亚微米空间分辨率的红外光谱获得,后者使用目前的FTIR光谱显微镜是无法做到的(分辨率受限于红外波长,约10-20 μm)。另外,该分析手段非常简单快捷,无破坏性,且不需要基于接触的方法(例如ATR光谱技术),使得样品的完整性被完全的保持。特别指出的是,该技术的非破坏性非常重要,尤其是在法医领域,因为它可以允许同时使用其他技术对相同样本进行互补和比对分析,并作为法律证据。此外,随着技术的发展,O-PTIR现在可以与拉曼显微镜相结合,以提供真正的亚微米同步的红外拉曼测试,使得在一个仪器上通过一次测量即可进行互补和验证分析。 技术支持:Quantum Design中国结合红外光谱的应用和尖端科技的需求,专注先进红外光谱技术的引进, 近期QD中国引进了美国PSC公司的非接触亚微米分辨红外&拉曼同步测量系统mIRage(图4)。它是全球科技创新R&D100大奖的获奖者,基于O-PTIR技术,克服了传统红外光谱仪空间分辨率受限于红外光波长的问题,将分辨率从原来的10-20微米提升到了0.5微米,并且可以实现同时、同样品区域、相同分辨率的红外光谱和拉曼光谱测试,测量过程更简单、便捷。目前该样机安装于Quantum Design中国北京实验室,更多的应用仍在不断开发和探索中,我们期待与您早日合作,共同进步!图4. Quantum Design中国北京mIRage样机实验室及仪器工程师合影
确定
还剩27页未读,是否继续阅读?

产品配置单

QUANTUM量子科学仪器贸易(北京)有限公司为您提供《指纹中易爆材料中红外光谱信息和成像信息检测方案(红外光谱仪)》,该方案主要用于刑侦中红外光谱信息和成像信息检测,参考标准--,《指纹中易爆材料中红外光谱信息和成像信息检测方案(红外光谱仪)》用到的仪器有非接触式亚微米分辨红外拉曼同步测量系统
推荐专场

相关方案
更多