


方案详情
文
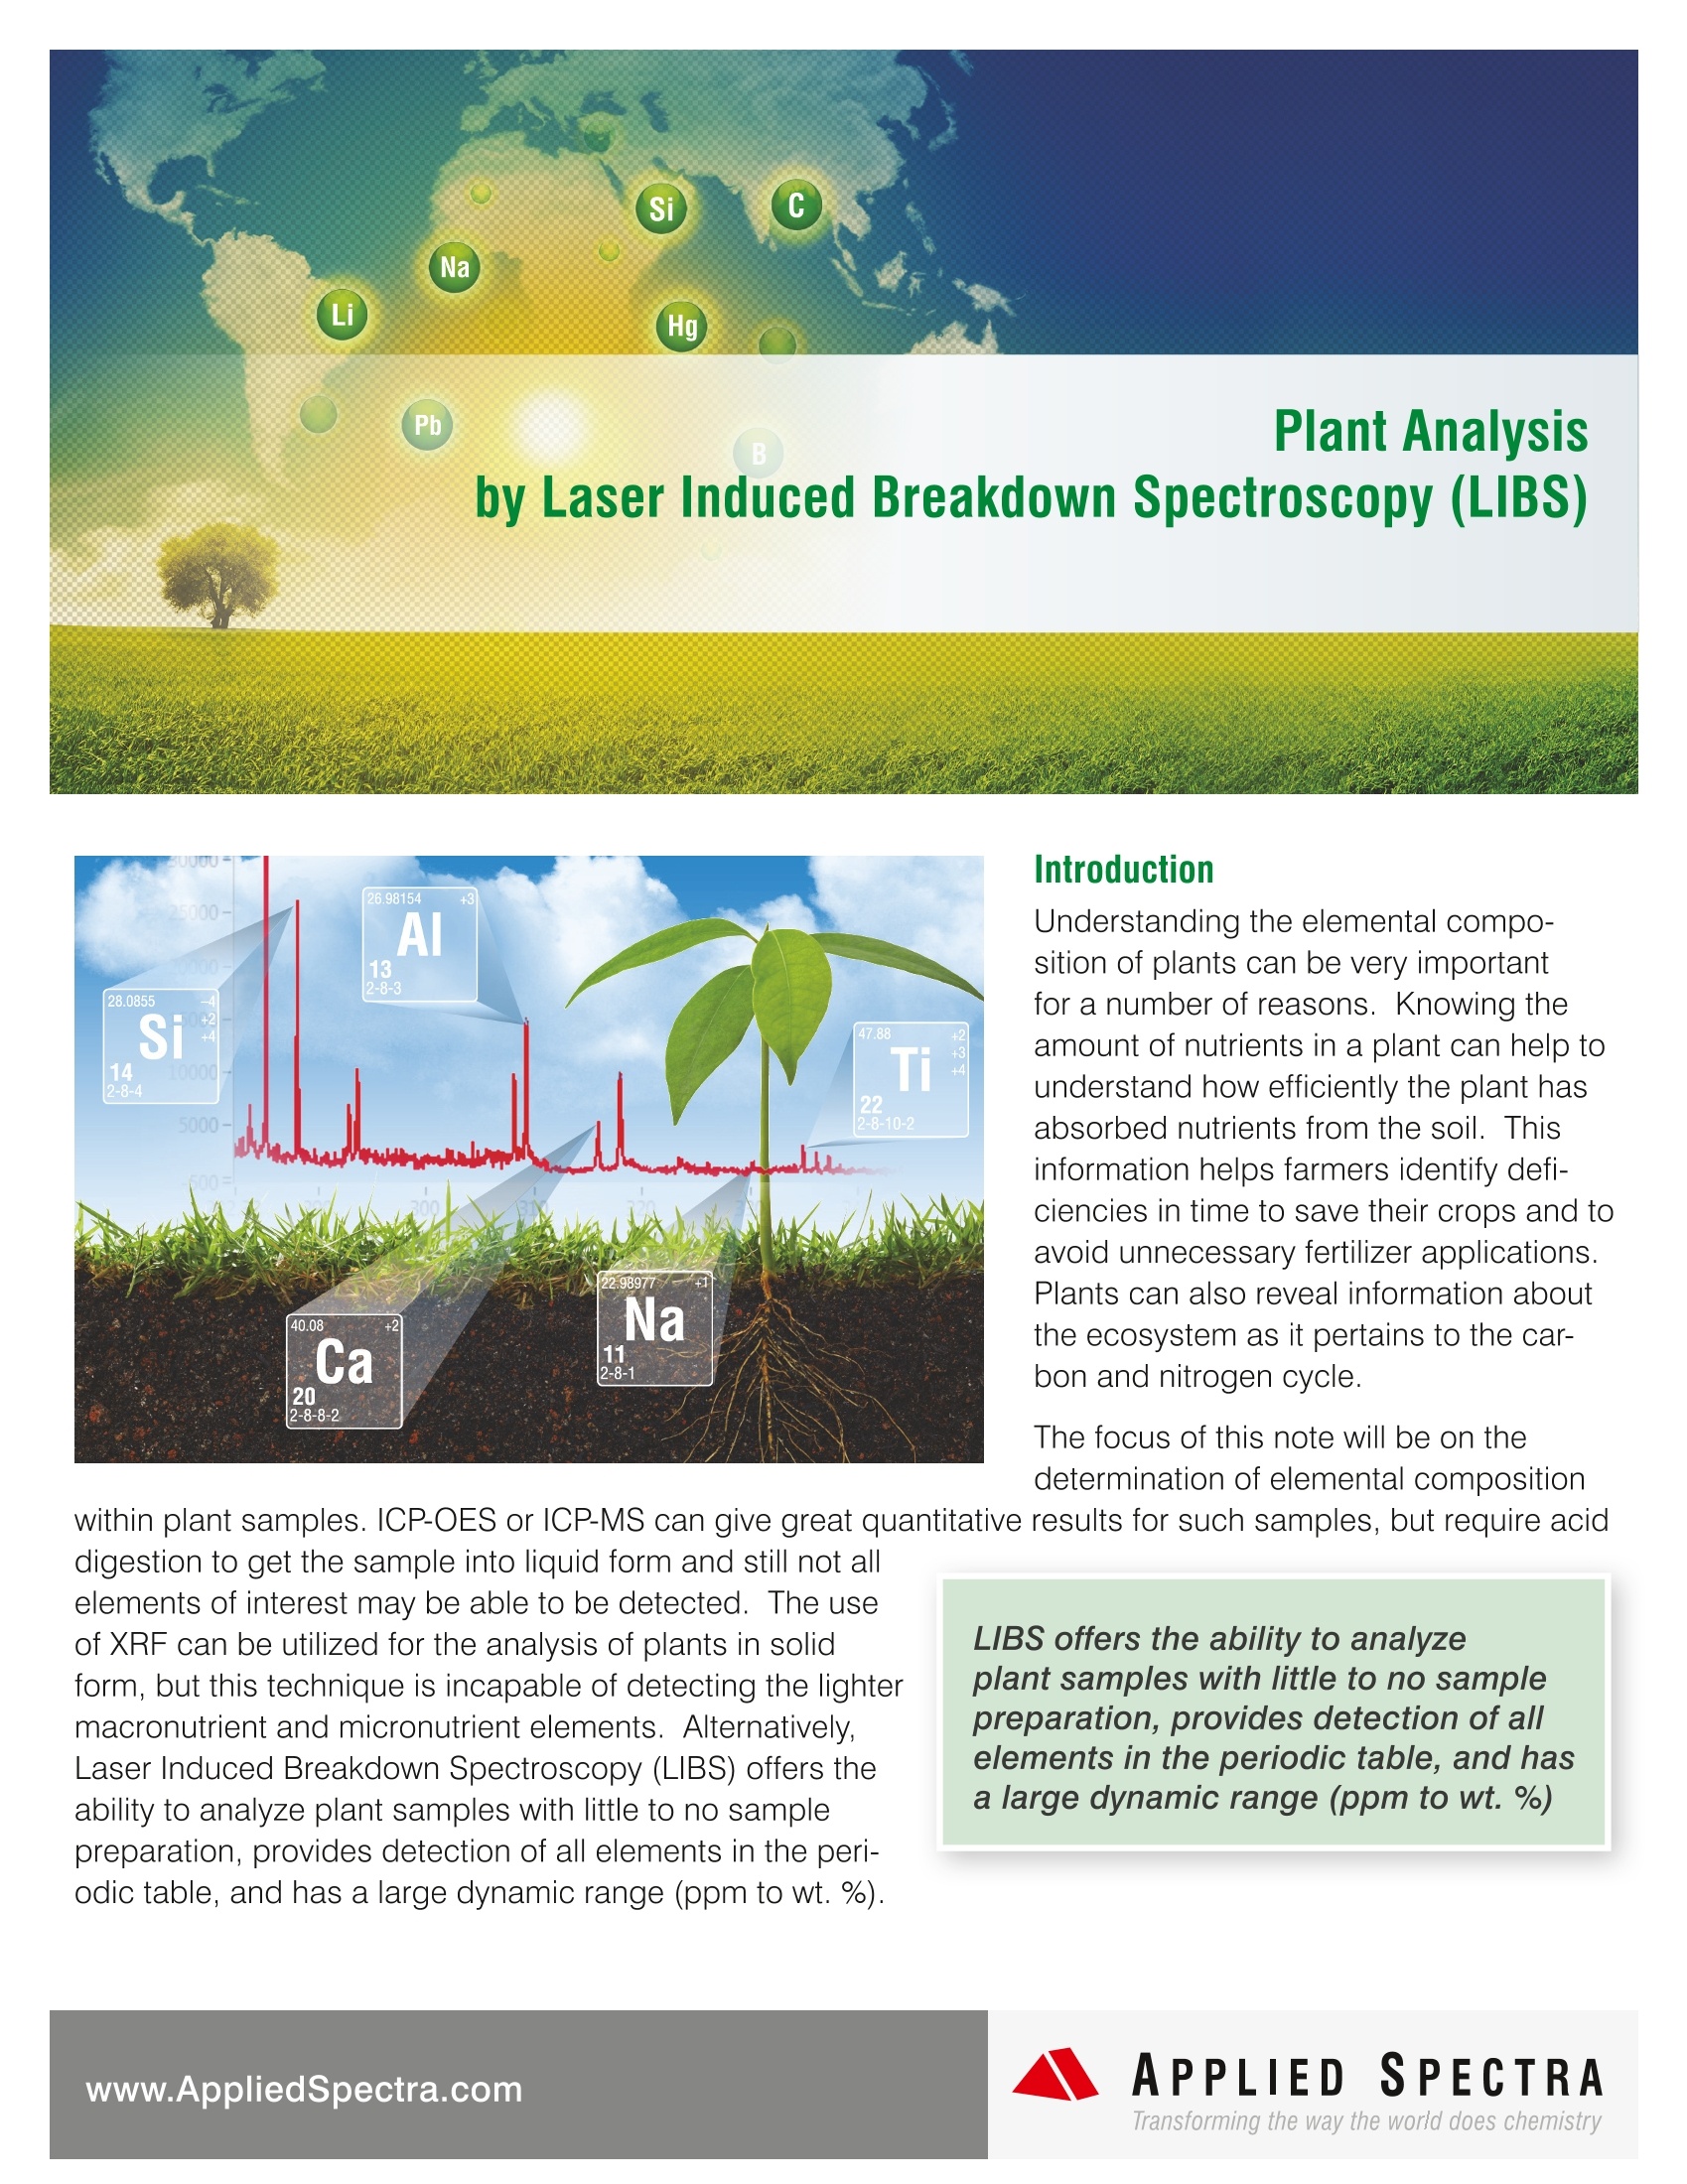
本案例关注植物样品的元素组成测定。当前,电感耦合等离子原子发射光谱(ICP-OES)、电感耦合等离子体质谱(ICP-MS)等技术能提供植物样品精确的定量分析结果,但这些分析方法需要通过强酸将样品消解为液态来进行分析,不仅污染环境,且酸解过程中容易引入误差,另外这些方法也不能完全测定所有感兴趣的元素。X 射线荧光法(XRF)可以用于植物样品的固体测量,但这种方法无法测量常量元素和微量元素中的轻元素部分。激光诱导击穿光谱技术(Laser Induced Breakdown Spectroscopy 简称 LIBS 技术)是近年新兴的一种更为先进的元素分析技术。LIBS 技术可直接测量植物固体样品,不需或仅需极少的样品前处理过程,能实现对元素周期表上所有元素的测量,且检测动态范围极大(ppm至 wt. %)。
方案详情

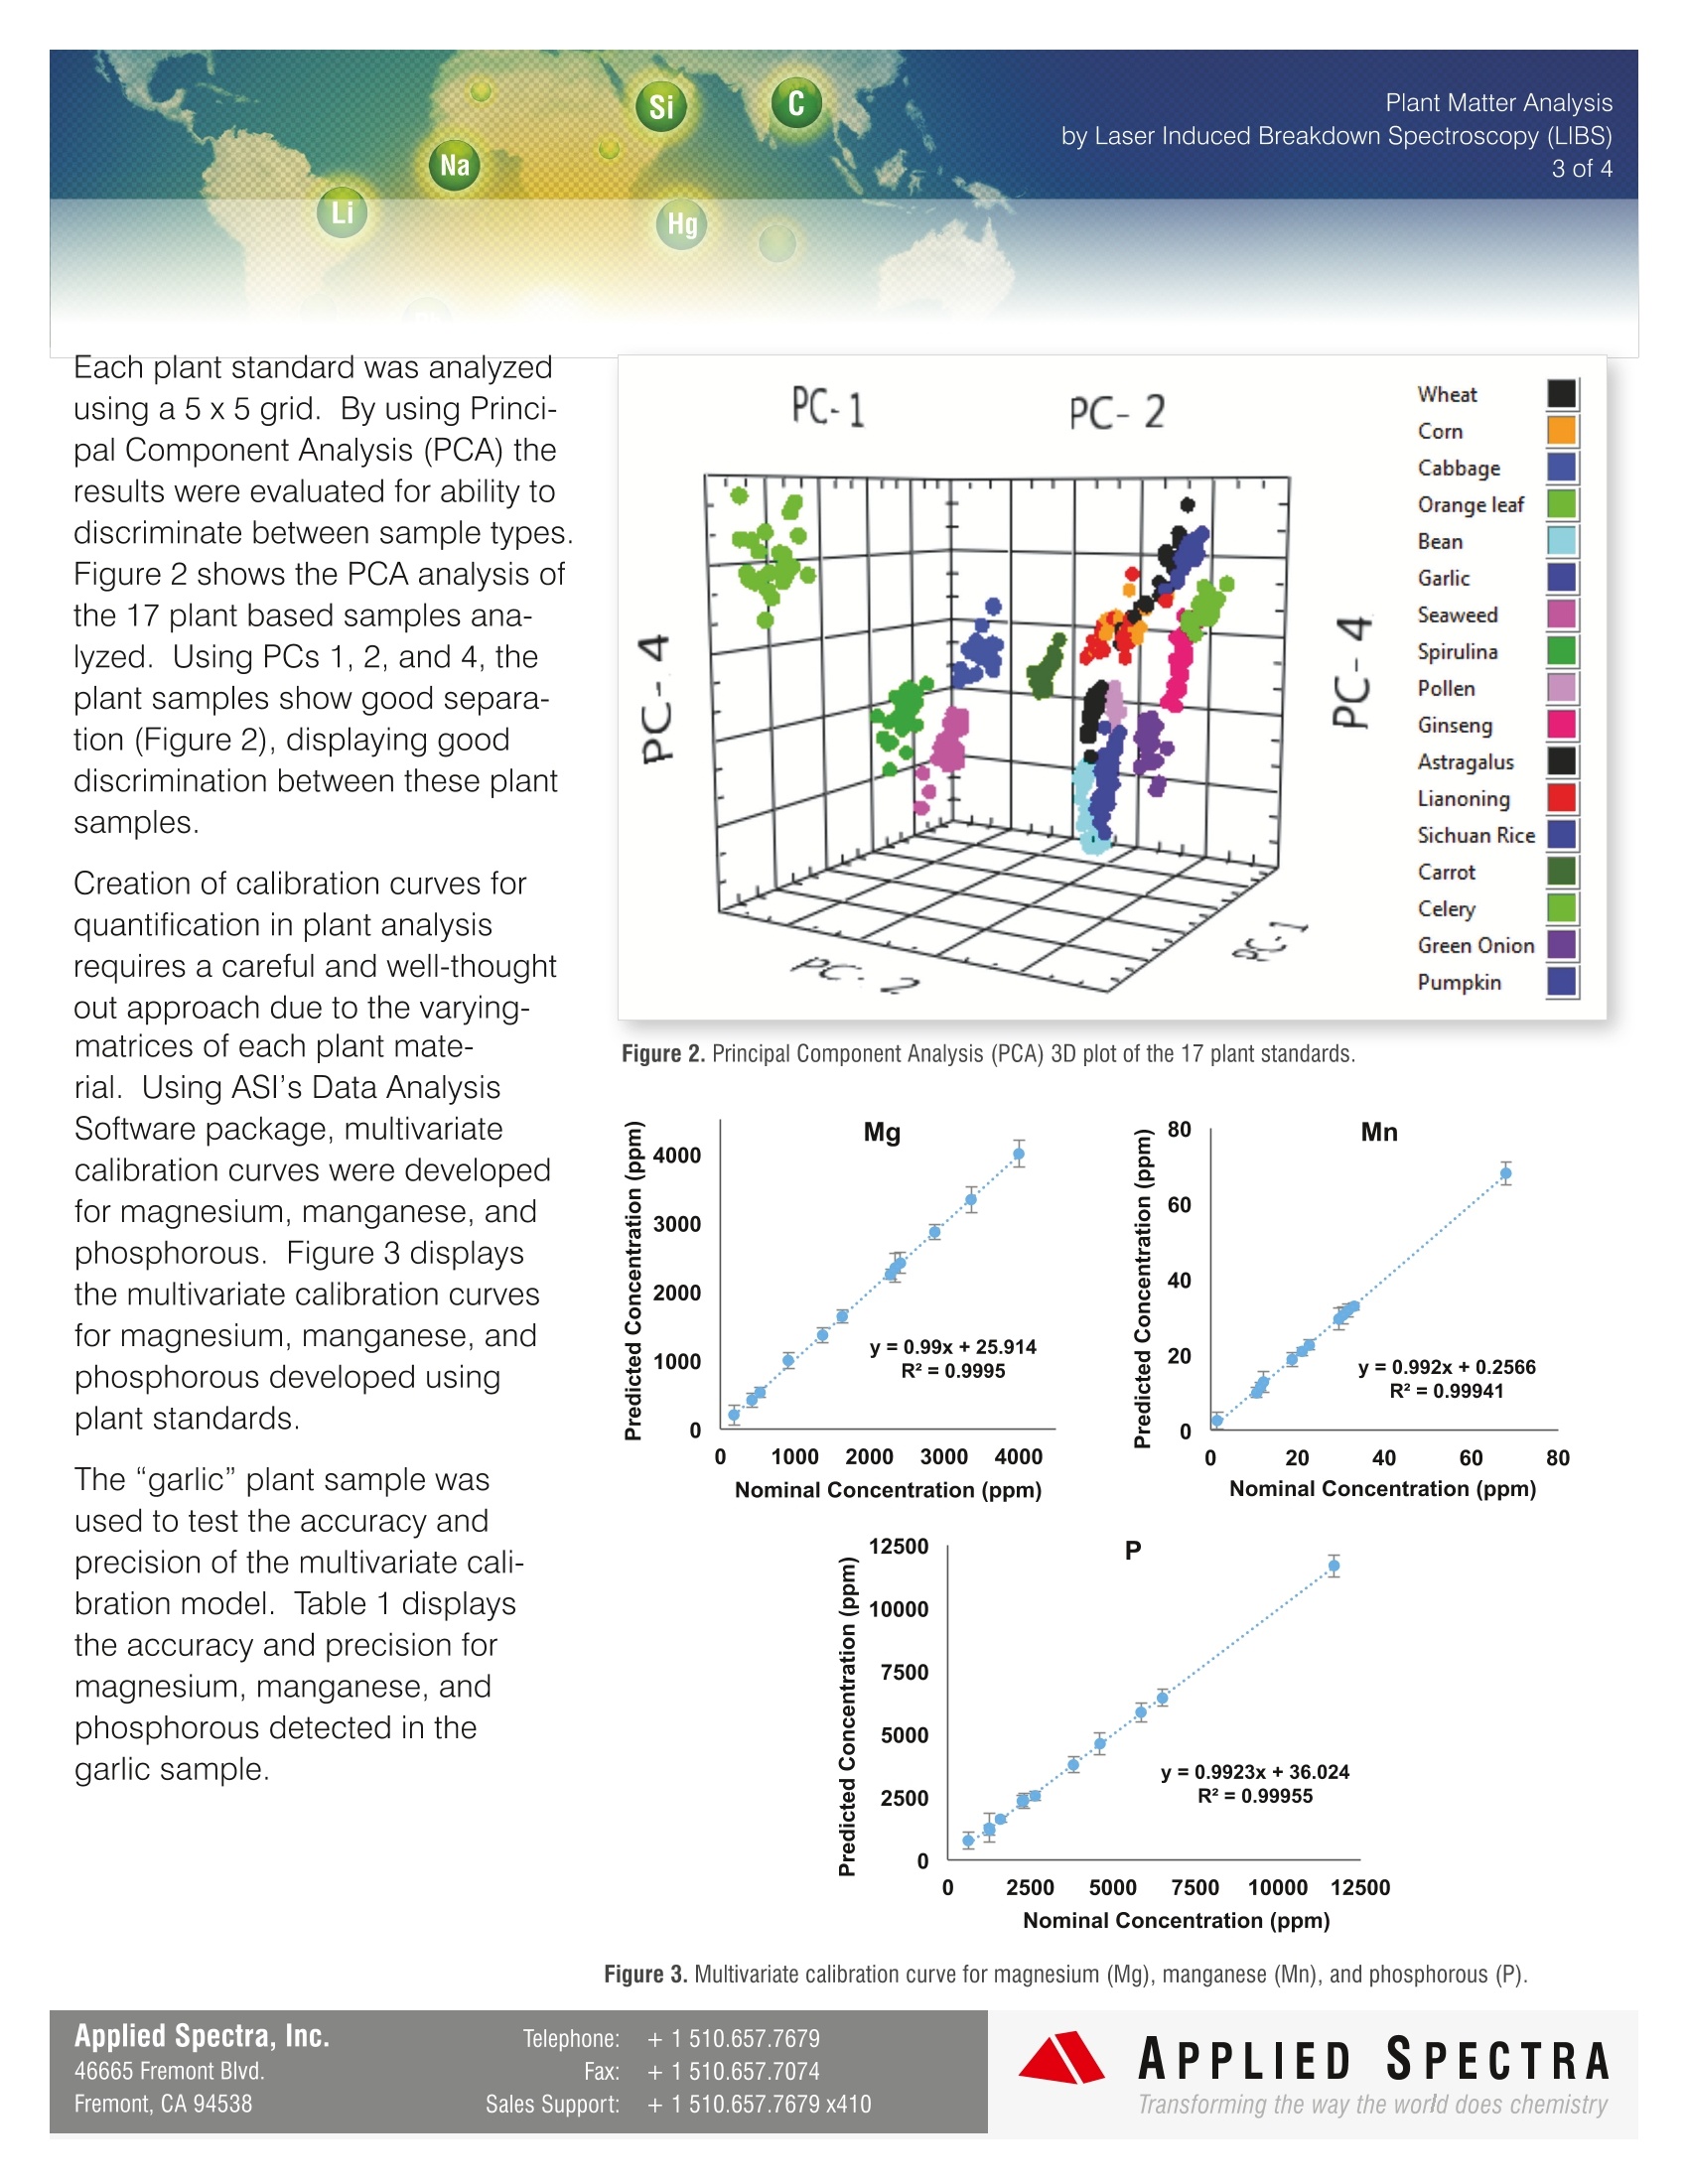
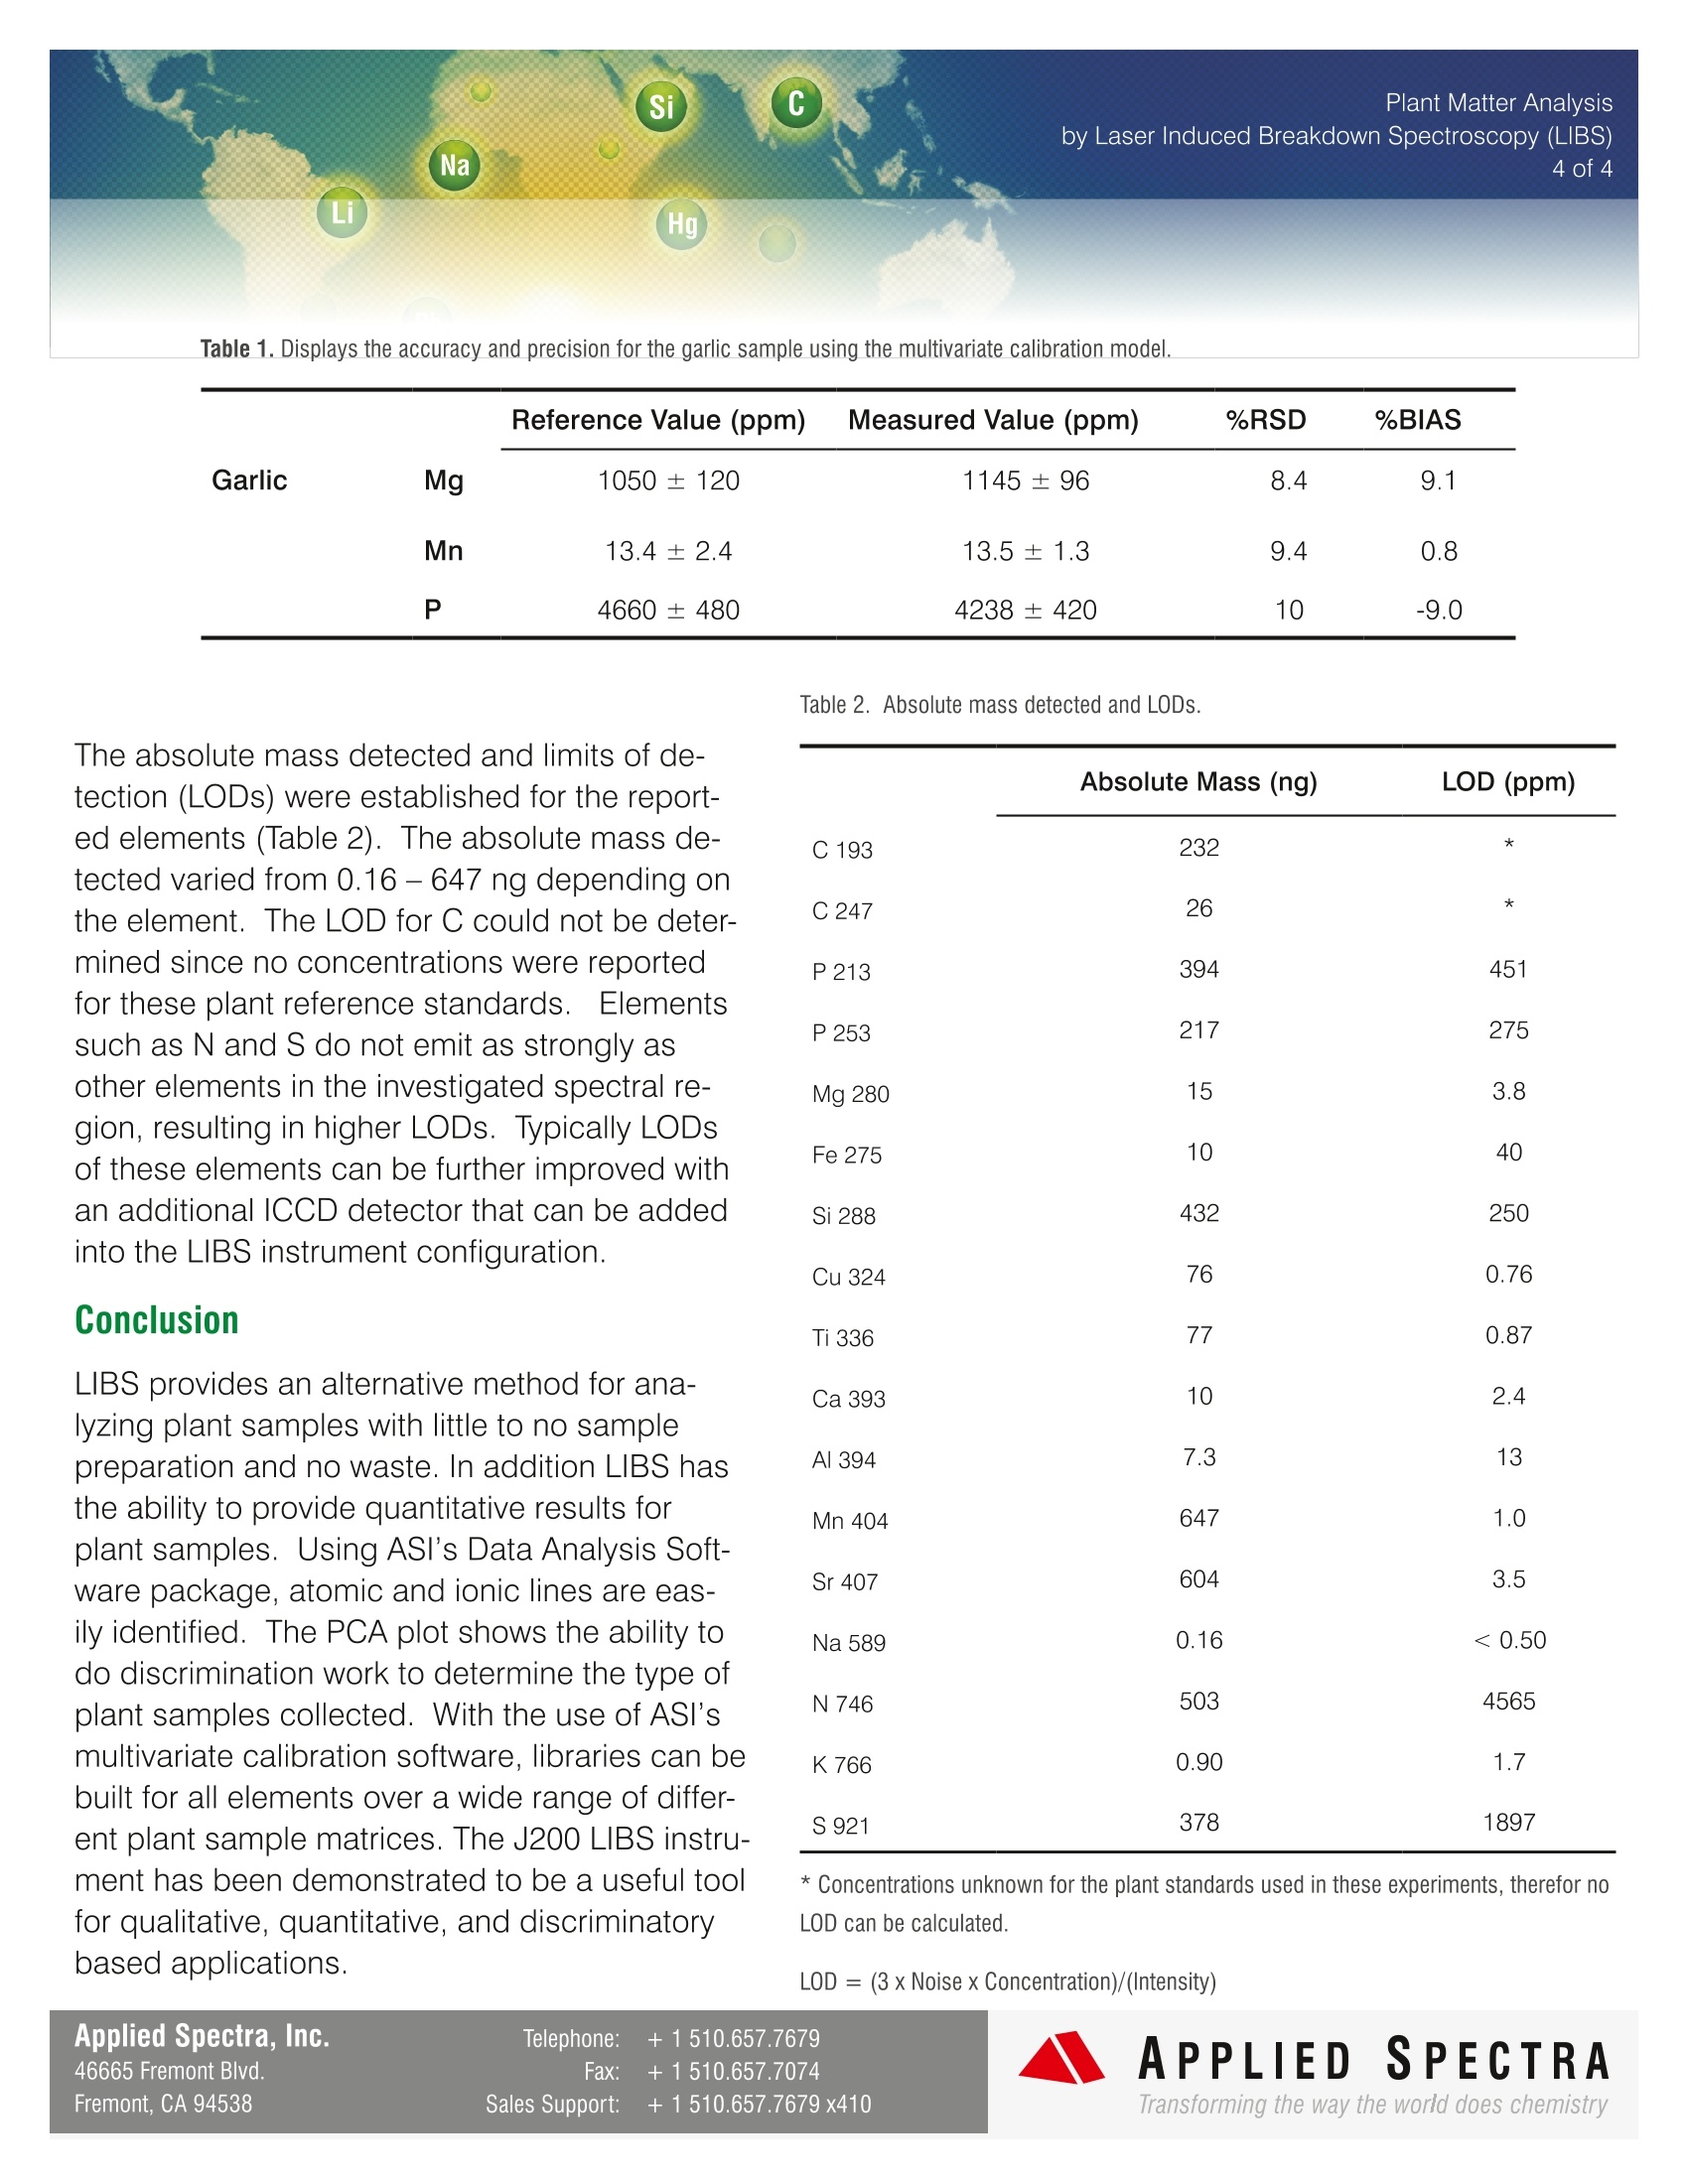
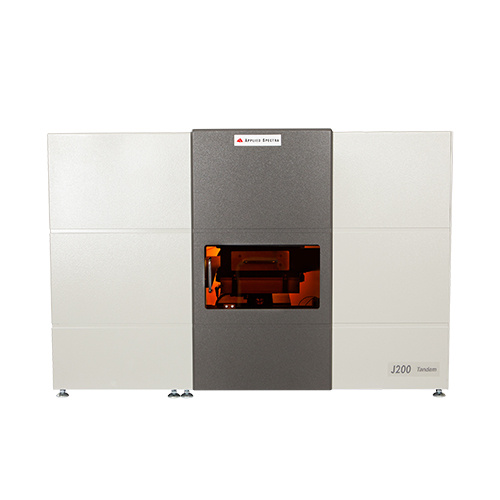
Plant Matter Analysis2 of4 Si Na Li Hg Pb B Plant Analysis by Laser Induced Breakdown Spectroscopy (LIBS) Introduction Understanding the elemental compo-sition of plants can be very importantfor a number ofreasons. Knowing theamount of nutrients in a plant can help tounderstand how efficiently the plant hasabsorbed nutrients from the soil. Thisinformation helps farmers identify defi-ciencies in time to save their crops and toavoid unnecessary fertilizer applications.Plants can also reveal information aboutthe ecosystem as it pertains to the car-bon and nitrogen cycle. The focus of this note will be on thedetermination of elemental composition within plant samples. ICP-OES or ICP-MS can give great quantitative results for such samples, but require aciddigestion to get the sample into liquid form and still not allelements of interest may be able to be detected. The useof XRF can be utilized for the analysis of plants in solidform, but this technique is incapable of detecting the lightermacronutrient and micronutrient elements. Alternatively,Laser Induced Breakdown Spectroscopy (LIBS) offers theability to analyze plant samples with little to no samplepreparation, provides detection of all elements in the peri-odic table, and has a large dynamic range (ppm to wt. %). LIBS offers the ability to analyzeplant samples with little to no samplepreparation,provides detection of allelements in the periodic table, and hasa large dynamic range (ppm to wt.%) by Laser Induced Breakdown Spectroscopy (LIBS) Operating Parameters Applied Spectra Inc.’s J200 LIBS Instrument 266 nm Nd:YAG laser (ns) and broadband spectrometercontrolled using Applied Spectra Axiom Software Sample chamber with helium or argon gas flow Plant samples were pressed into pellets LIBS data analyzed with Applied Spectra Data AnalysisSoftware package Sample Analysis Plant standards were obtained from around the world andpressed into pellets for analysis. These analyses were intendedto demonstrate the ability to use Applied Spectra's J200 LIBS Applied Spectra Inc.'s J200 LIBS System instrument to determine elemental composition of the samples, discriminate between different plant samples,and establish figures of merit for this plant sample set. Figure 1 shows an example LIBS spectrum from oneof the plant standards with the atomic lines identified and labeled using Applied Spectra's Data Analysis Software package. Important macronutrient (N, P, S, Ca, Mg, and K) and micronutrient (C, B, Cu, Fe, Mn, Mo, and Zn) elements were the 80000- study. Figure 1. Broadband spectrum collected from a plant standard using the J200 LIBS instrument. Peaks were identified and labeled using the AppliedSpectra’s Data Analysis Software package. Applied Spectra, Inc. Telephone: +1510.657.7679 46665 Fremont Blvd. Fax: +1510.657.7074 Fremont, CA 94538 Sales Support: +1510.657.7679 x410 by Laser Induced Breakdown Spectroscopy (LIBS) 3 of 4 Each plant standard was analyzedusing a 5 x 5 grid. By using Princi-pal Component Analysis (PCA) theresults were evaluated for ability todiscriminate between sample types.Figure 2 shows the PCA analysis ofthe 17 plant based samples ana-lyzed. Using PCs 1, 2, and 4, theplant samples show good separa-tion (Figure 2), displaying gooddiscrimination between these plantsamples. Creation of calibration curves forquantification in plant analysisrequires a careful and well-thoughtout approach due to the varying-matrices of each plant mate-rial. Using ASI’s Data AnalysisSoftware package, multivariatecalibration curves were developedfor magnesium, manganese, andphosphorous. Figure 3 displaysthe multivariate calibration curvesfor magnesium, manganese, andphosphorous developed usingplant standards. The “garlic” plant sample wasused to test the accuracy andprecision of the multivariate cali-bration model. Table 1 displaysthe accuracy and precision formagnesium, manganese, andphosphorous detected in thegarlic sample. Figure 2. Principal Component Analysis (PCA) 3D plot of the 17 plant standards. Nominal Concentration (ppm) N ominal Concentration (ppm) Figure 3. Multivariate calibration curve for magnesium (Mg), manganese (Mn), and phosphorous (P). Si C by Laser Induced Breakdown Spectroscopy (LIBS) Na 4 of 4 Li Hg Table 1. Displays the accuracy and precision for the garlic sample using the multivariate calibration model. Reference Value (ppm) Measured Value(ppm) %RSD %BIAS Garlic Mg 1050±120 1145±96 8.4 9.1 Mn 13.4±2.4 13.5±1.3 9.4 0.8 P 4660±480 4238±420 10 -9.0 The absolute mass detected and limits of de-tection (LODs) were established for the report-ed elements (Table 2). The absolute mass de-tected varied from 0.16- 647 ng depending onthe element. The LOD for C could not be deter-mined since no concentrations were reportedfor these plant reference standards. Elementssuch as N and S do not emit as strongly asother elements in the investigated spectral re-gion, resulting in higher LODs. Typically LOCof these elements can be further improved withan additional ICCD detector that can be addedinto the LIBS instrument configuration. LIBS provides an alternative method for ana-lyzing plant samples with little to no samplepreparation and no waste. In addition LIBS hasthe ability to provide quantitative results forplant samples. Using ASI's Data Analysis Soft-ware package, atomic and ionic lines are eas-ily identified. The PCA plot shows the ability todo discrimination work to determine the type ofplant samples collected. With the use of ASI’smultivariate calibration software, libraries can bebuilt for all elements over a wide range of differ-ent plant sample matrices. The J200 LIBS instru-ment has been demonstrated to be a useful toolfor qualitative, quantitative, and discriminatorybased applications. Table 2. Absolute mass detected and LODs. Absolute Mass (ng) LOD (ppm) 232 * 26 * 394 451 217 275 Mg 280 15 3.8 Fe 275 10 40 432 250 Cu 324 76 0.76 Ti 336 77 0.87 Ca 393 10 2.4 Al 394 7.3 13 Mn 404 647 1.0 Sr 407 604 3.5 Na 589 0.16 <0.50 N 746 503 4565 K 766 0.90 1.7 S921 378 1897 * Concentrations unknown for the plant standards used in these experiments, therefor noLOD can be calculated. APPLIED SPECTRAwww.AppliedSpectra.comTransforming the way the world does chemistry APPLIED SPECTR ATransforming the way the world does chemistry ASI 的 J200 提供了一种全新的植物样品分析方法,此方法仅需极少样品前处理,不会产生有害环 境的废弃物,并能提供较为精确的定量分析结果。采用 ASI 的数据分析软件包,能轻易辨识、标注激 光采样产生的原子或离子发射光谱,软件的 PCA 分析及三维图像显示展示了强大的样品分类、样品来 源判别功能,采用多变量标准曲线,可建立植物样品的所有元素的数据库,ASI 公司的 J200 激光光谱 元素分析仪是植物样品定性分析、定量分析、类型/来源判别的有力工具。将不同来源的 17 个植物标准样品进行压片前处理。使用 ASI 公司的 J200 LIBS 设备进行检测分析。 本案例的目的是验证 J200 对植物样品元素组成、样品类型判别的能力,并建立该组样品的分类图谱。 图 1 为其中一个植物标准样品的 LIBS 原子发射光谱图,采用 ASI 公司专业的分析软件包对光谱图中的 峰值进行了识别和标注。本案例关注的重点是植物样品中的常量元素(N、P、S、Ca、Mg、K)和微量 元素(C、B、Cu、Fe、Mn、Mo、Zn)
确定

还剩2页未读,是否继续阅读?

产品配置单

北京富尔邦科技发展有限责任公司为您提供《植物中多元素检测方案(激光诱导击穿)》,该方案主要用于林产品中理化分析检测,参考标准--,《植物中多元素检测方案(激光诱导击穿)》用到的仪器有美国ASI 激光诱导击穿光谱仪(LIBS)
推荐专场
相关方案
更多