


方案详情
文
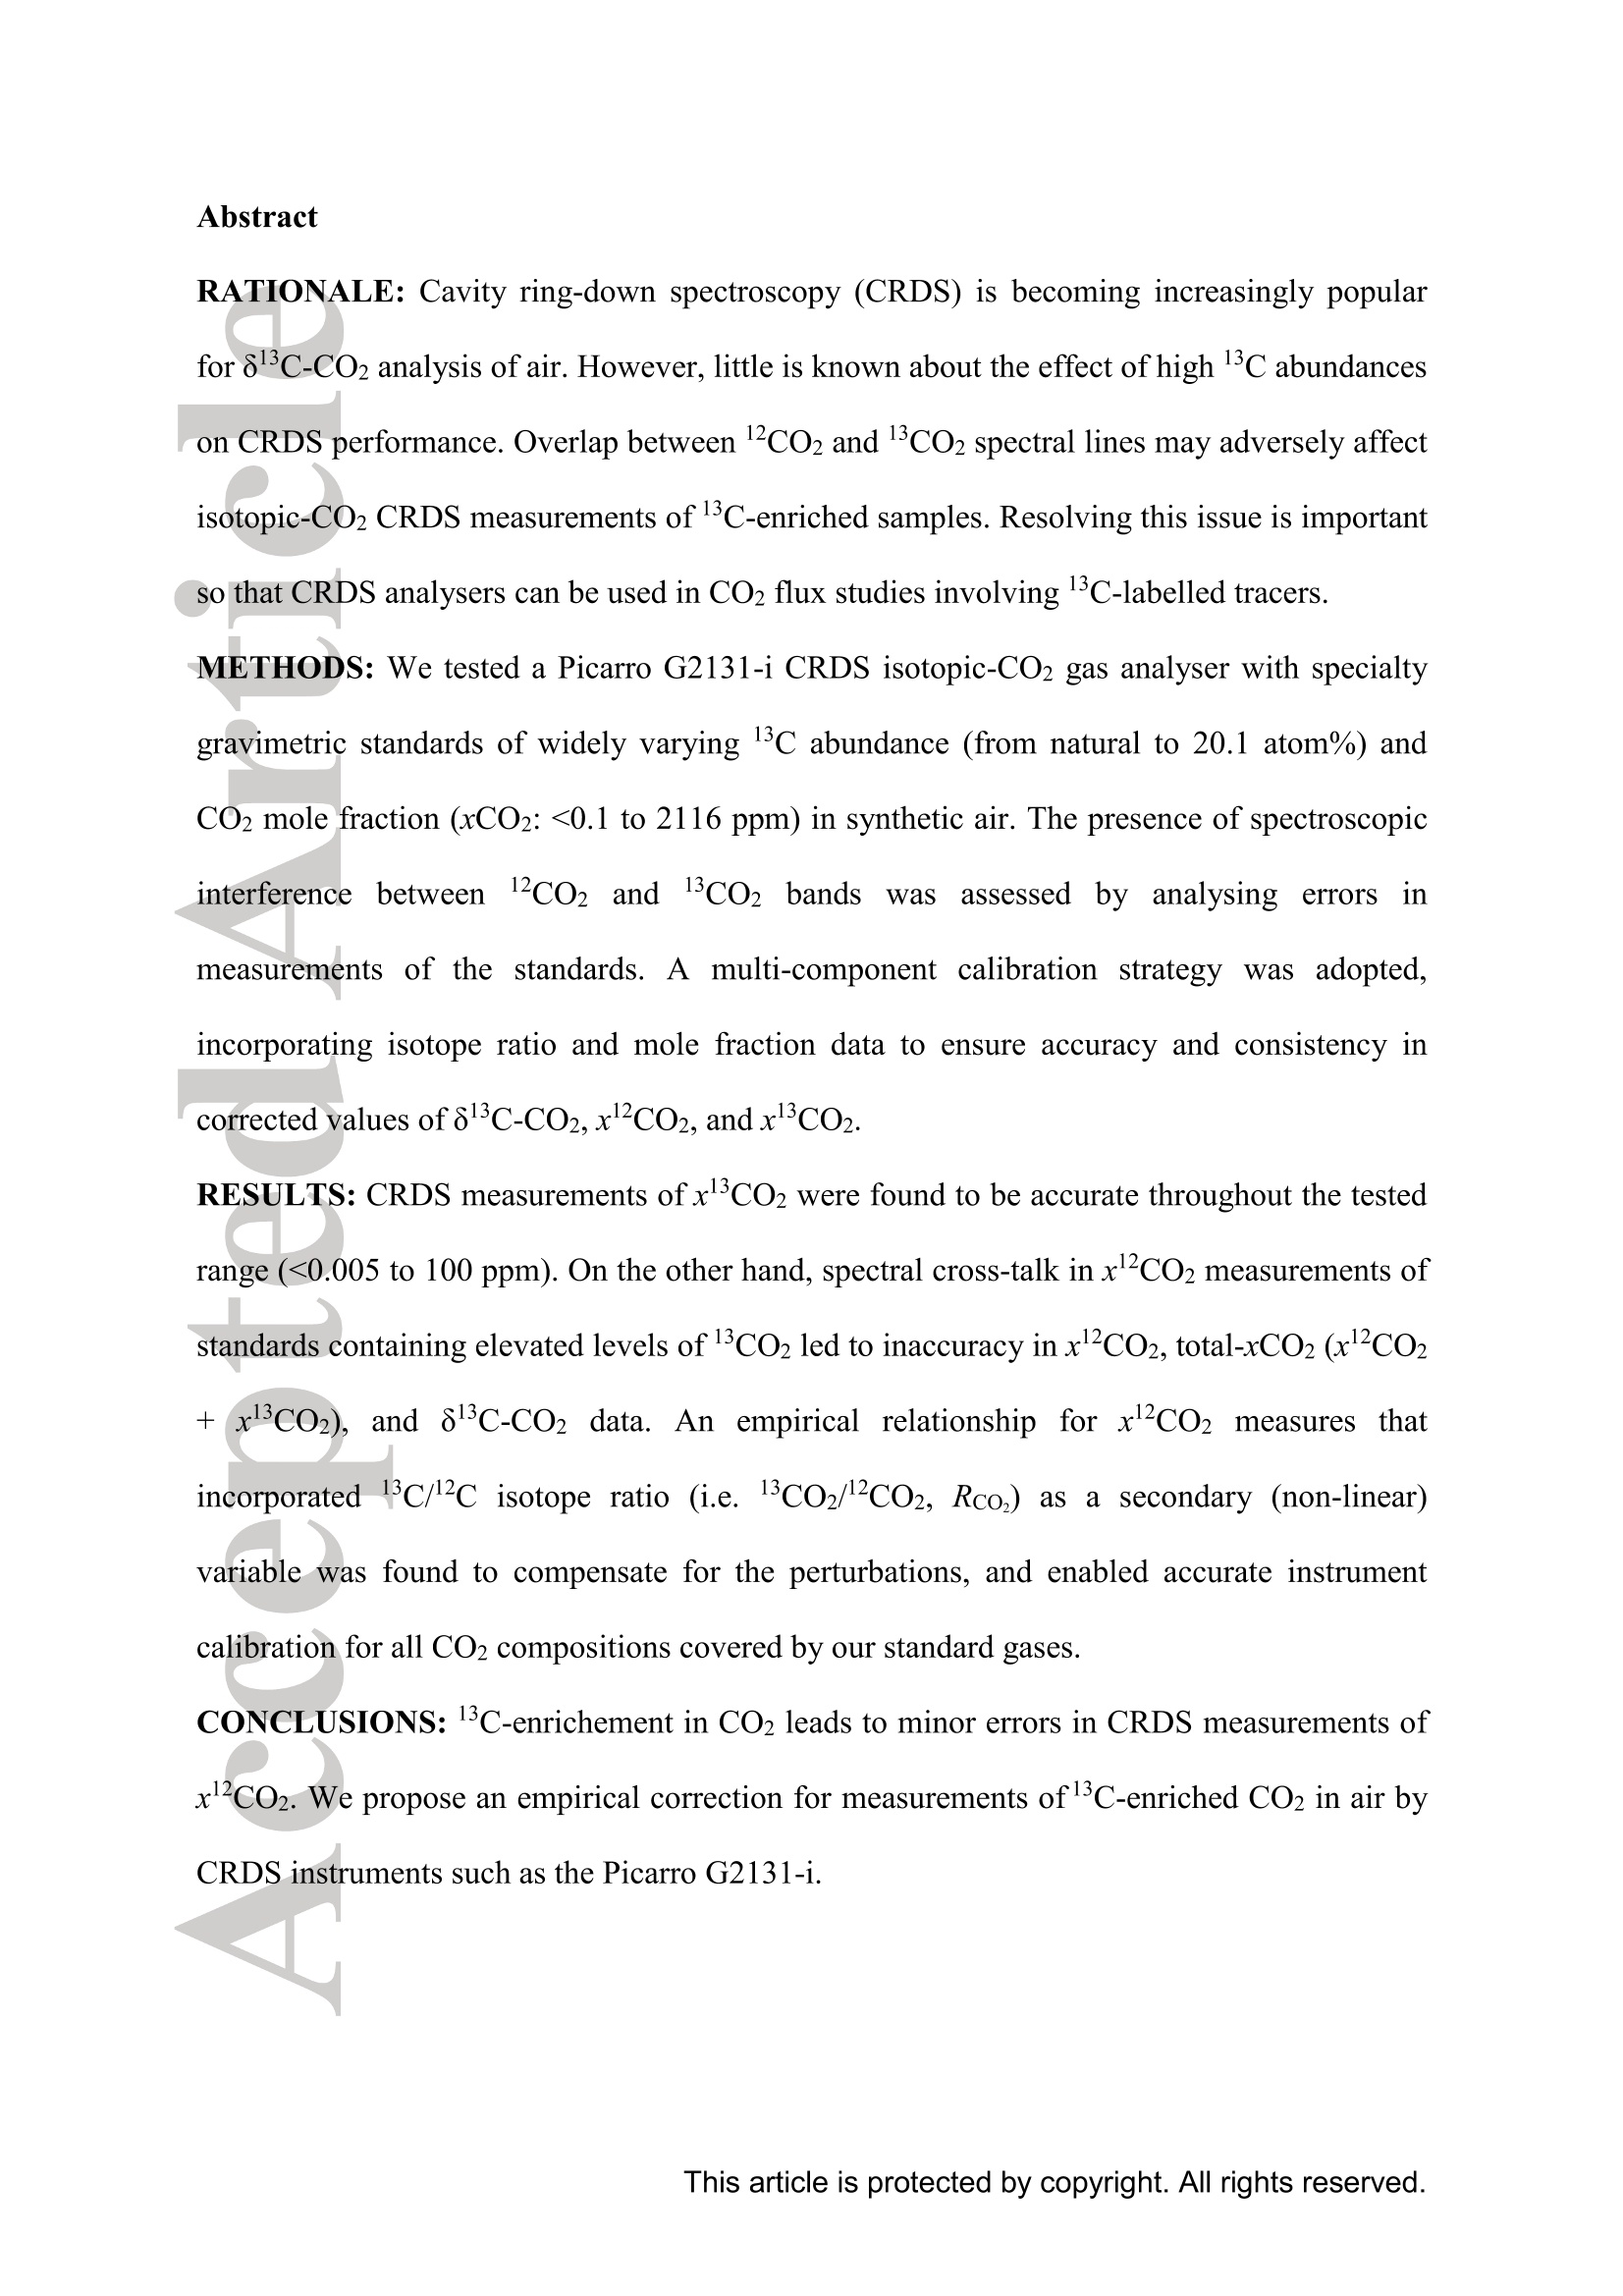
使用光腔衰荡光谱法(CRDS)对空气中的δ13C CO2分析越来越普遍。然而,对于高13C丰度对CRDS测量性能的影响知之甚少。12CO2和13CO2谱线之间的重叠可能对13C富集样品CO2同位素使用CRDS方法测量,产生不利影响。CO2中13C富集可以导致进行x12CO2测量的CRDS仪器(如G2131-i)出现微小误差,文章提出了一个经验修正的测量二氧化碳在空气中13C富集的简单方法。
文章使用Picarro G2131-I CRDS同位素- CO2气体分析仪,在合成空气中测试了具有广泛变化的13C丰度(从天然原子到20.1原子)和CO2摩尔分数(x CO2:<0.1到2116ppm)的特殊重量标准。通过分析标准的测量误差,评估了12CO2和13CO2谱线之间光谱干扰的存在。采用多组分校准策略,结合同位素比值和摩尔分数数据,确保了 δ13C CO2、x12CO2和x13CO2校正值的准确性与一致性。
在整个测试范围(<0.005至100 ppm)内,CRDS技术对x13CO2的测量均准确无误。另一方面,对x12CO2测量中的光谱串扰导致x12CO2、总x CO2(x12CO2+x13CO2)和δ13C CO2数据不准确。x12CO2测量的经验关系将13C /12C同位素比值(即13CO2/12CO2,RCO2)作为一个二次(非线性)变量来补偿干扰,并使我们的标准气体能够准确校准进行所有CO2成分测量的仪器。
方案详情

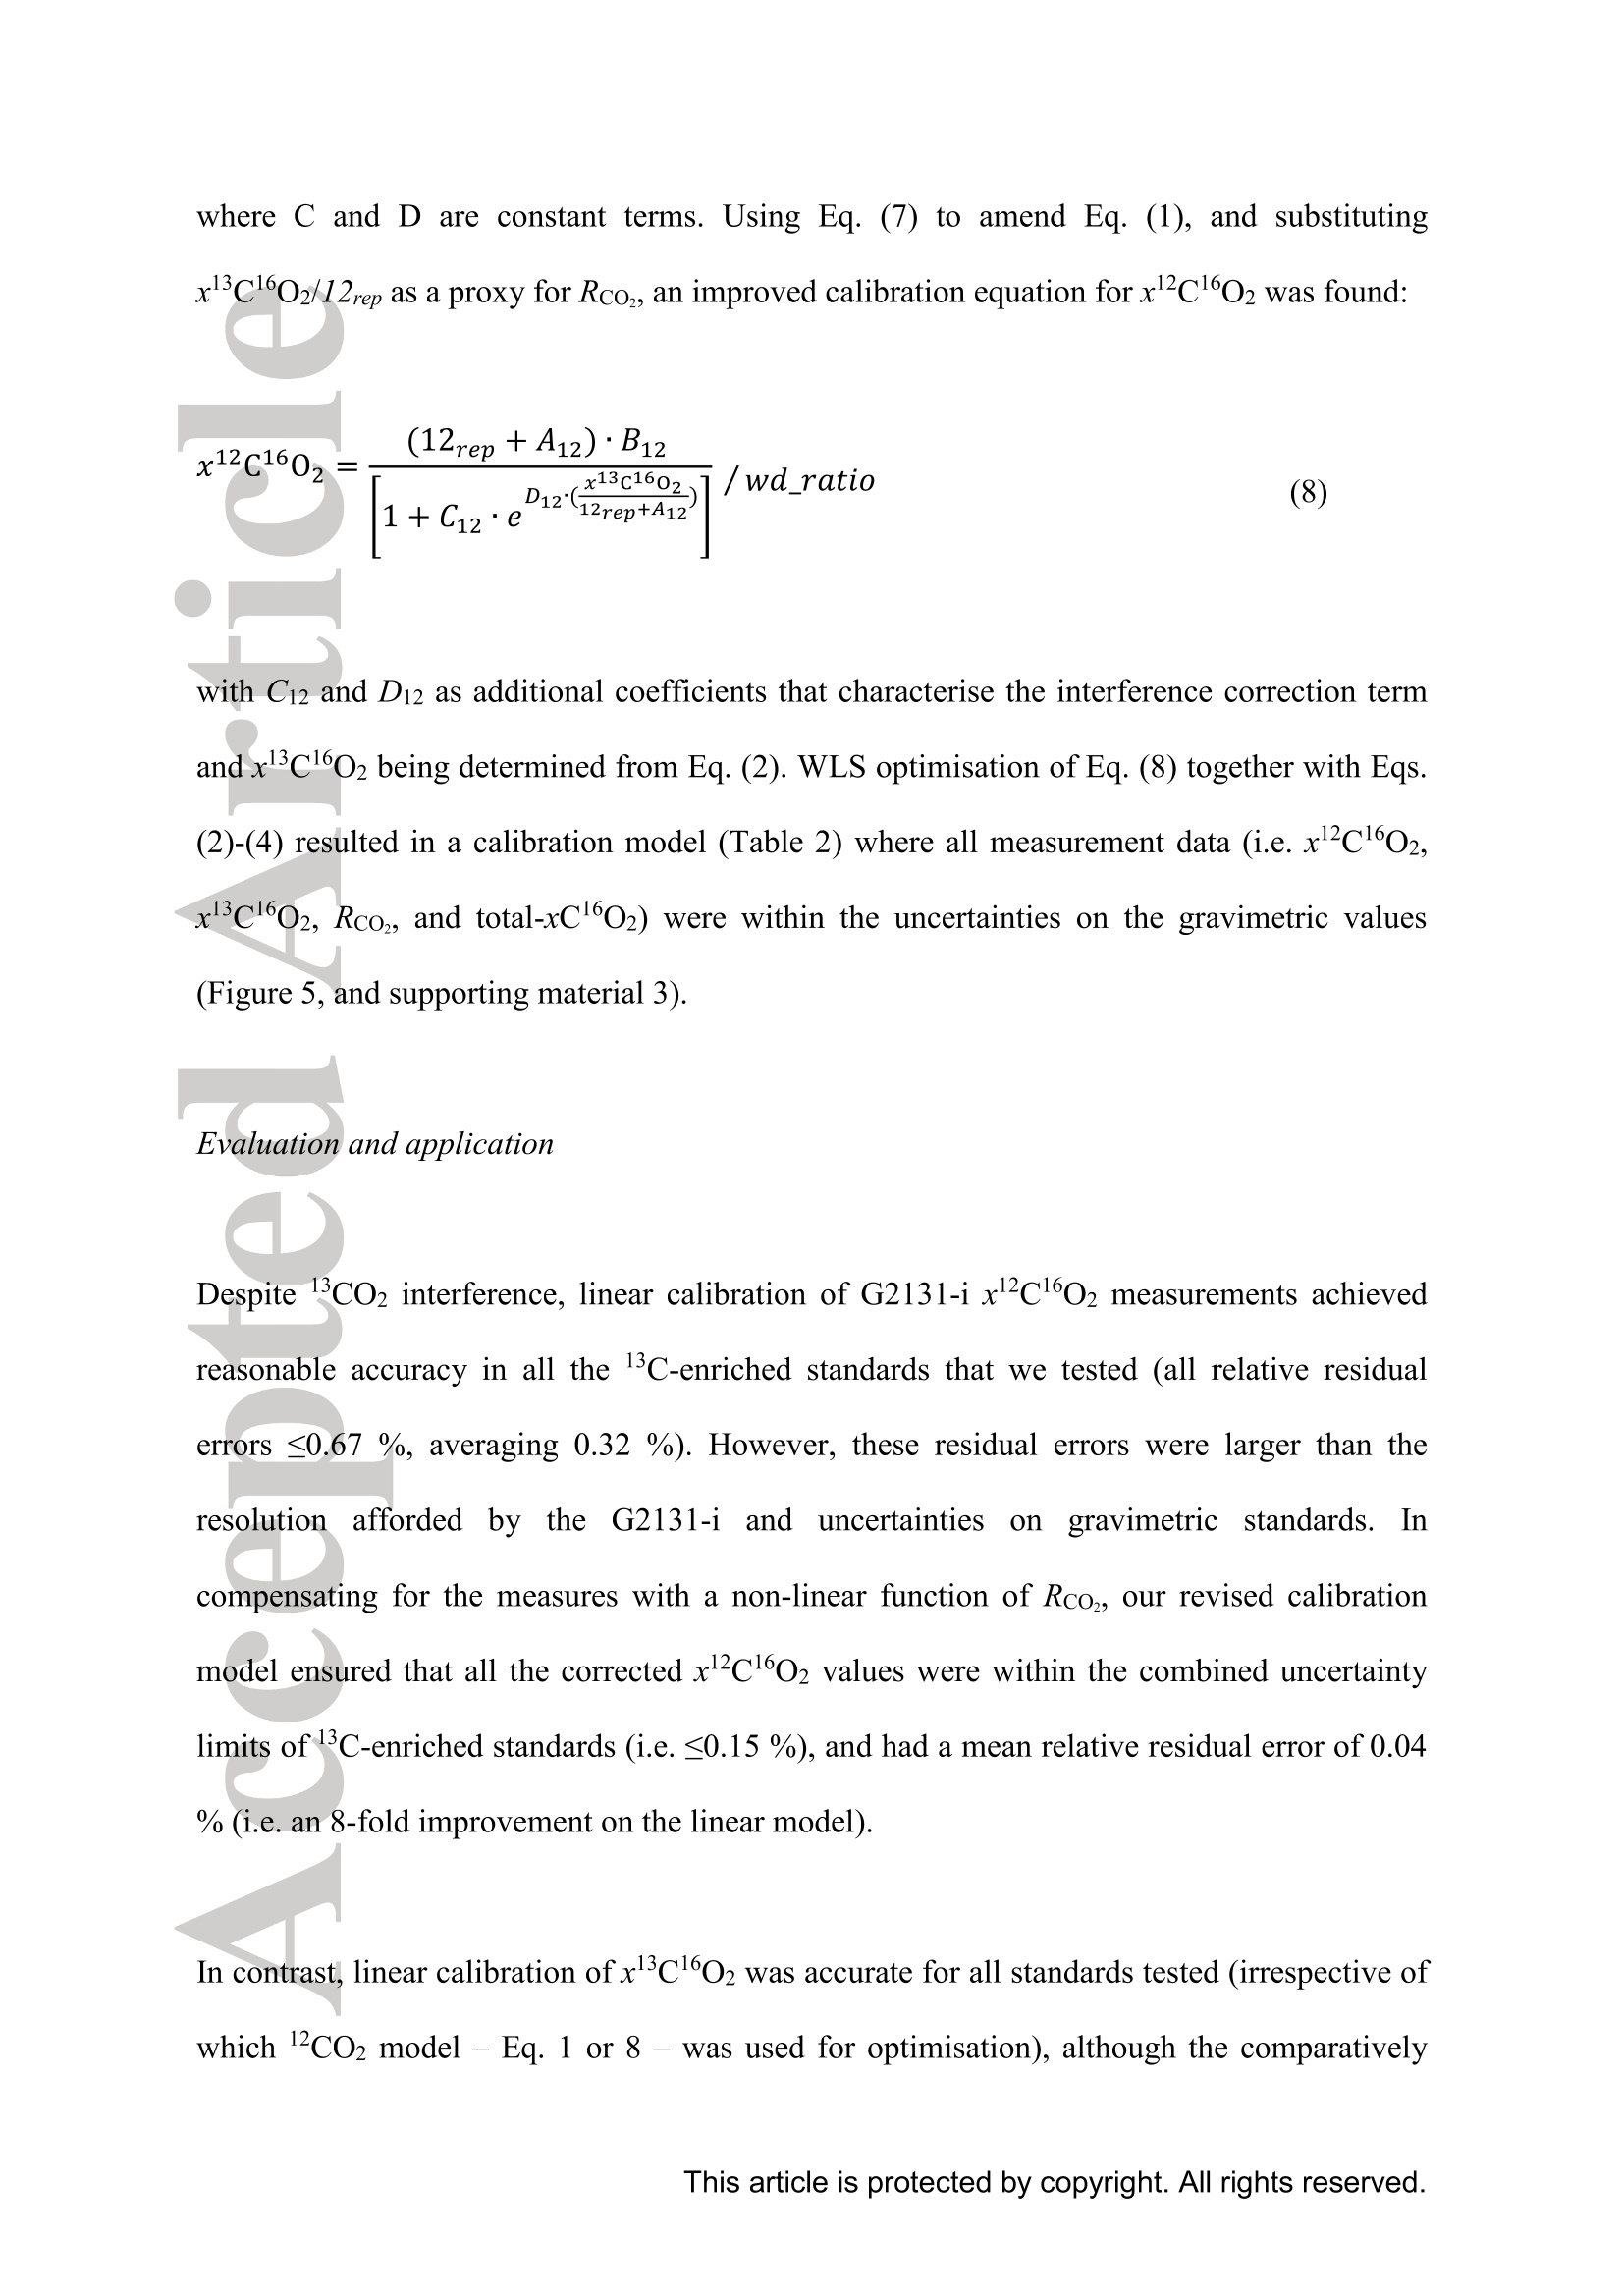
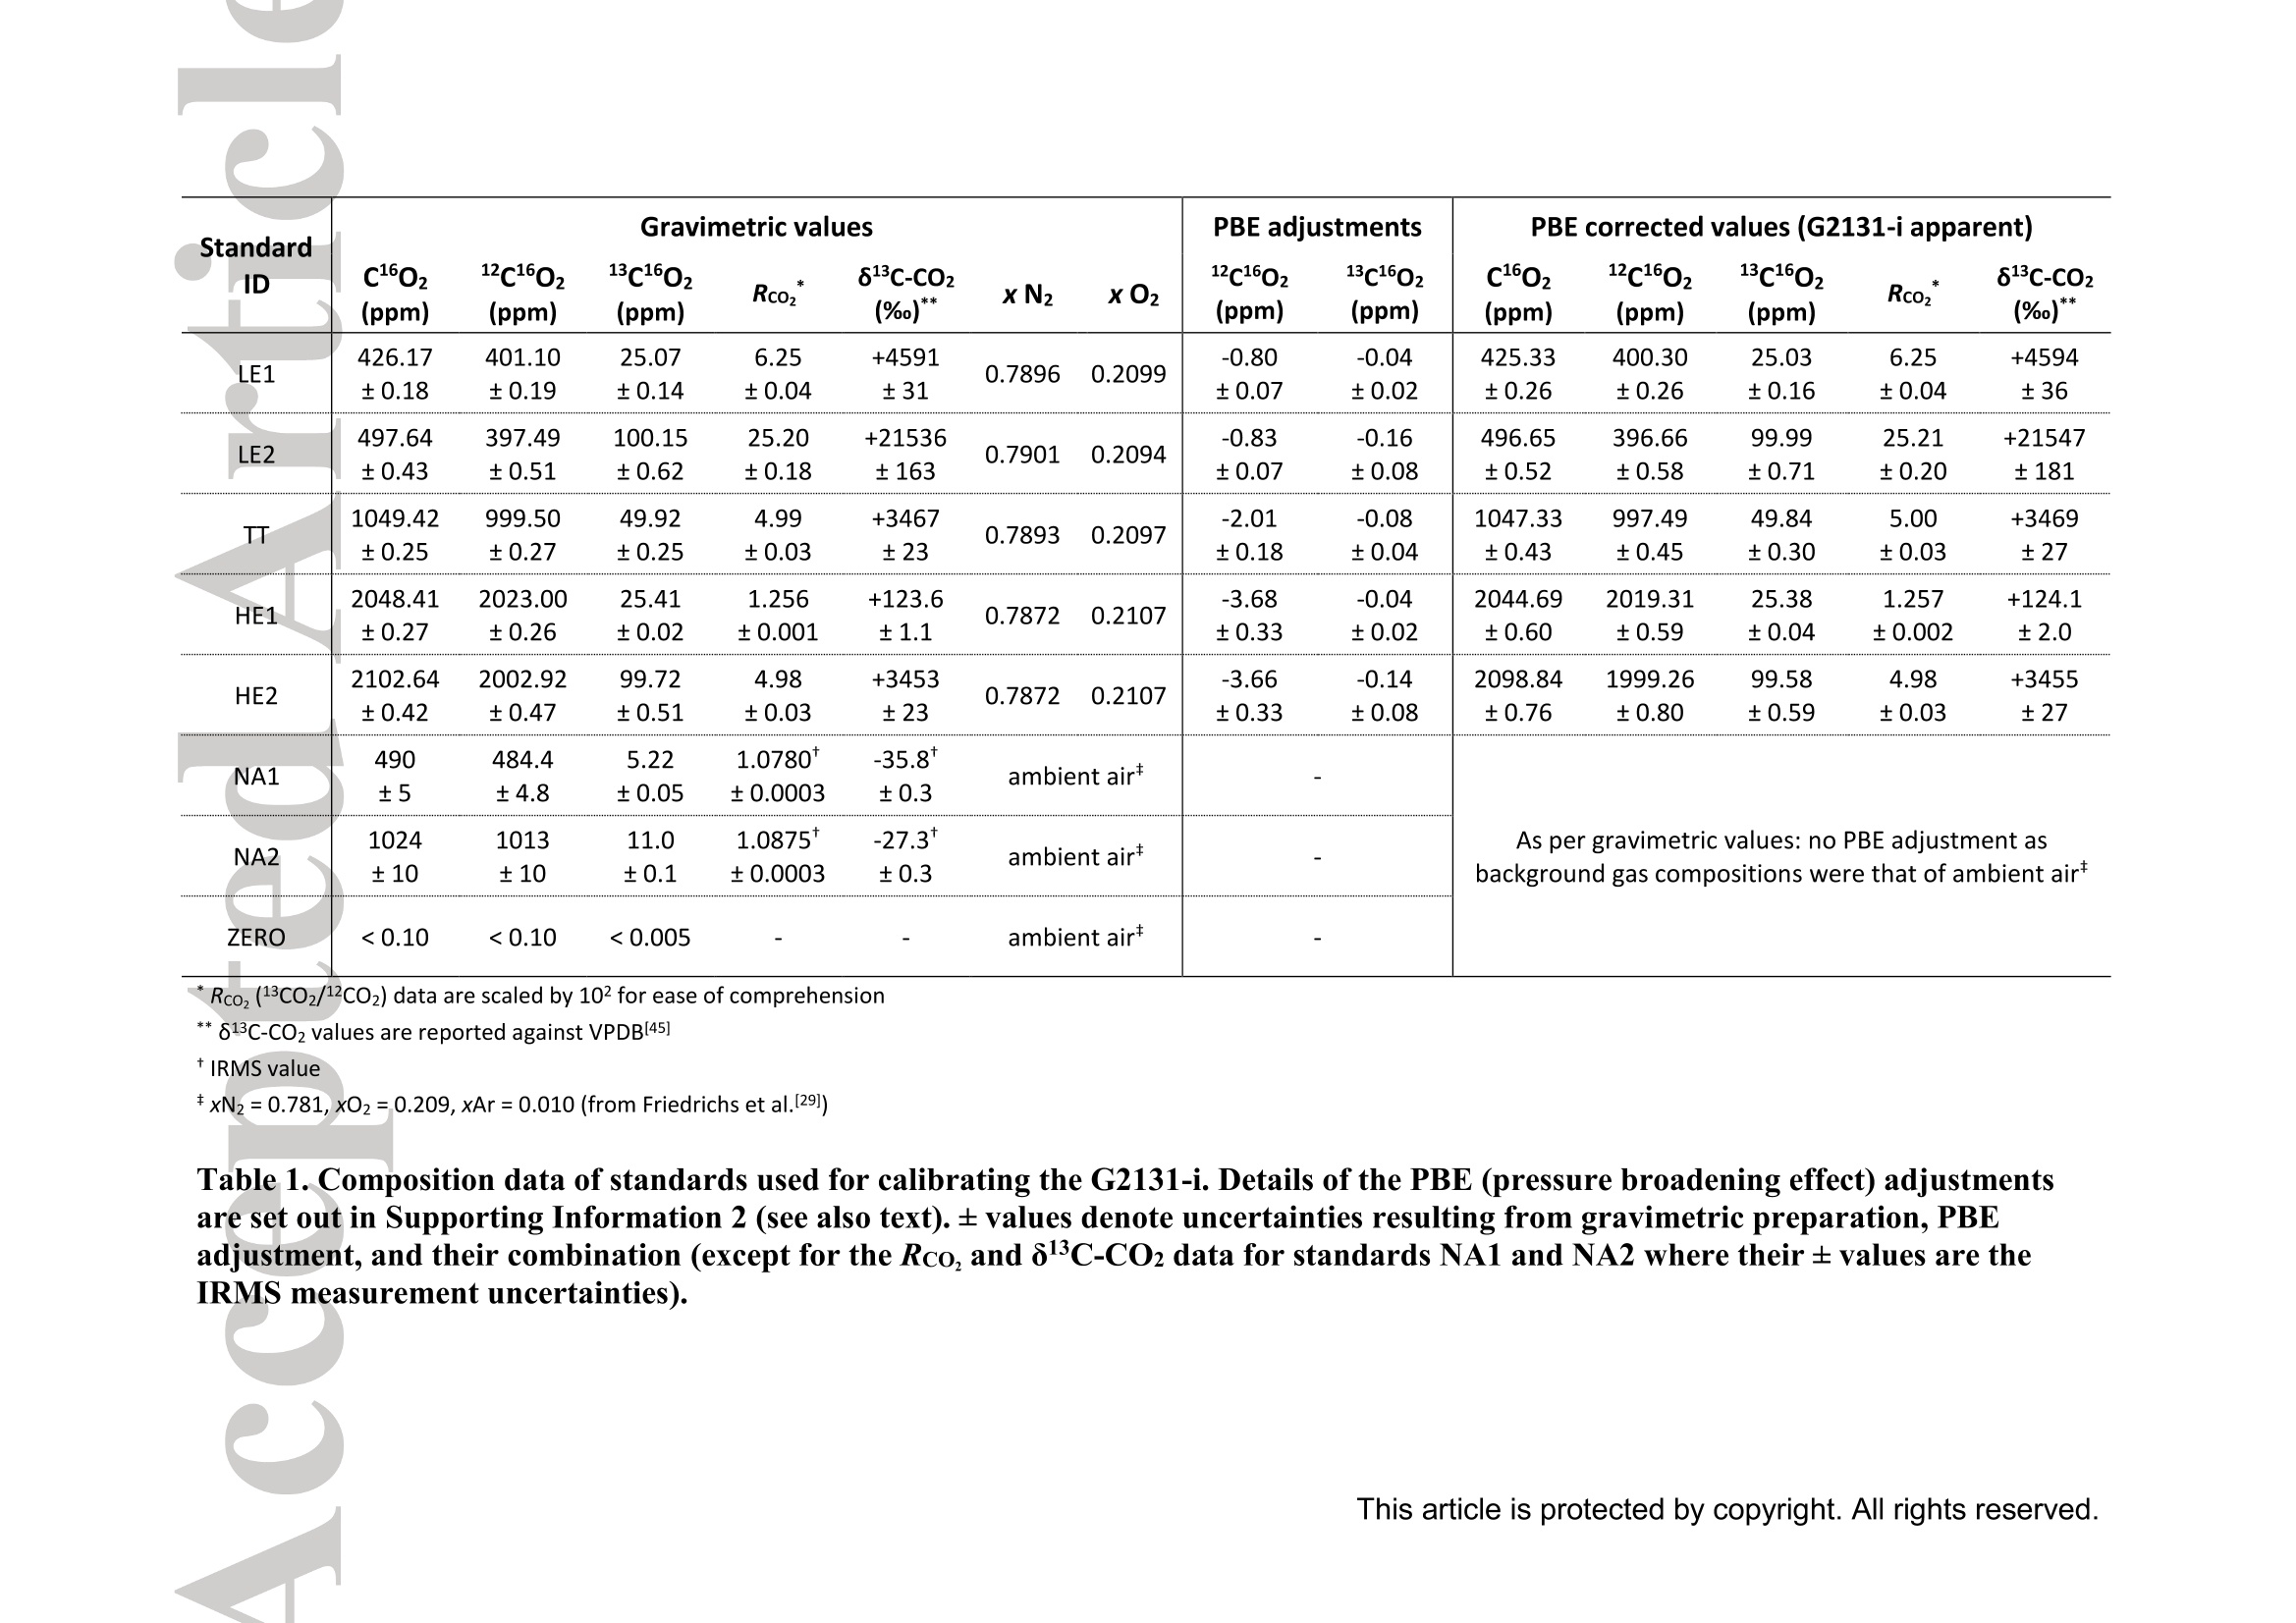
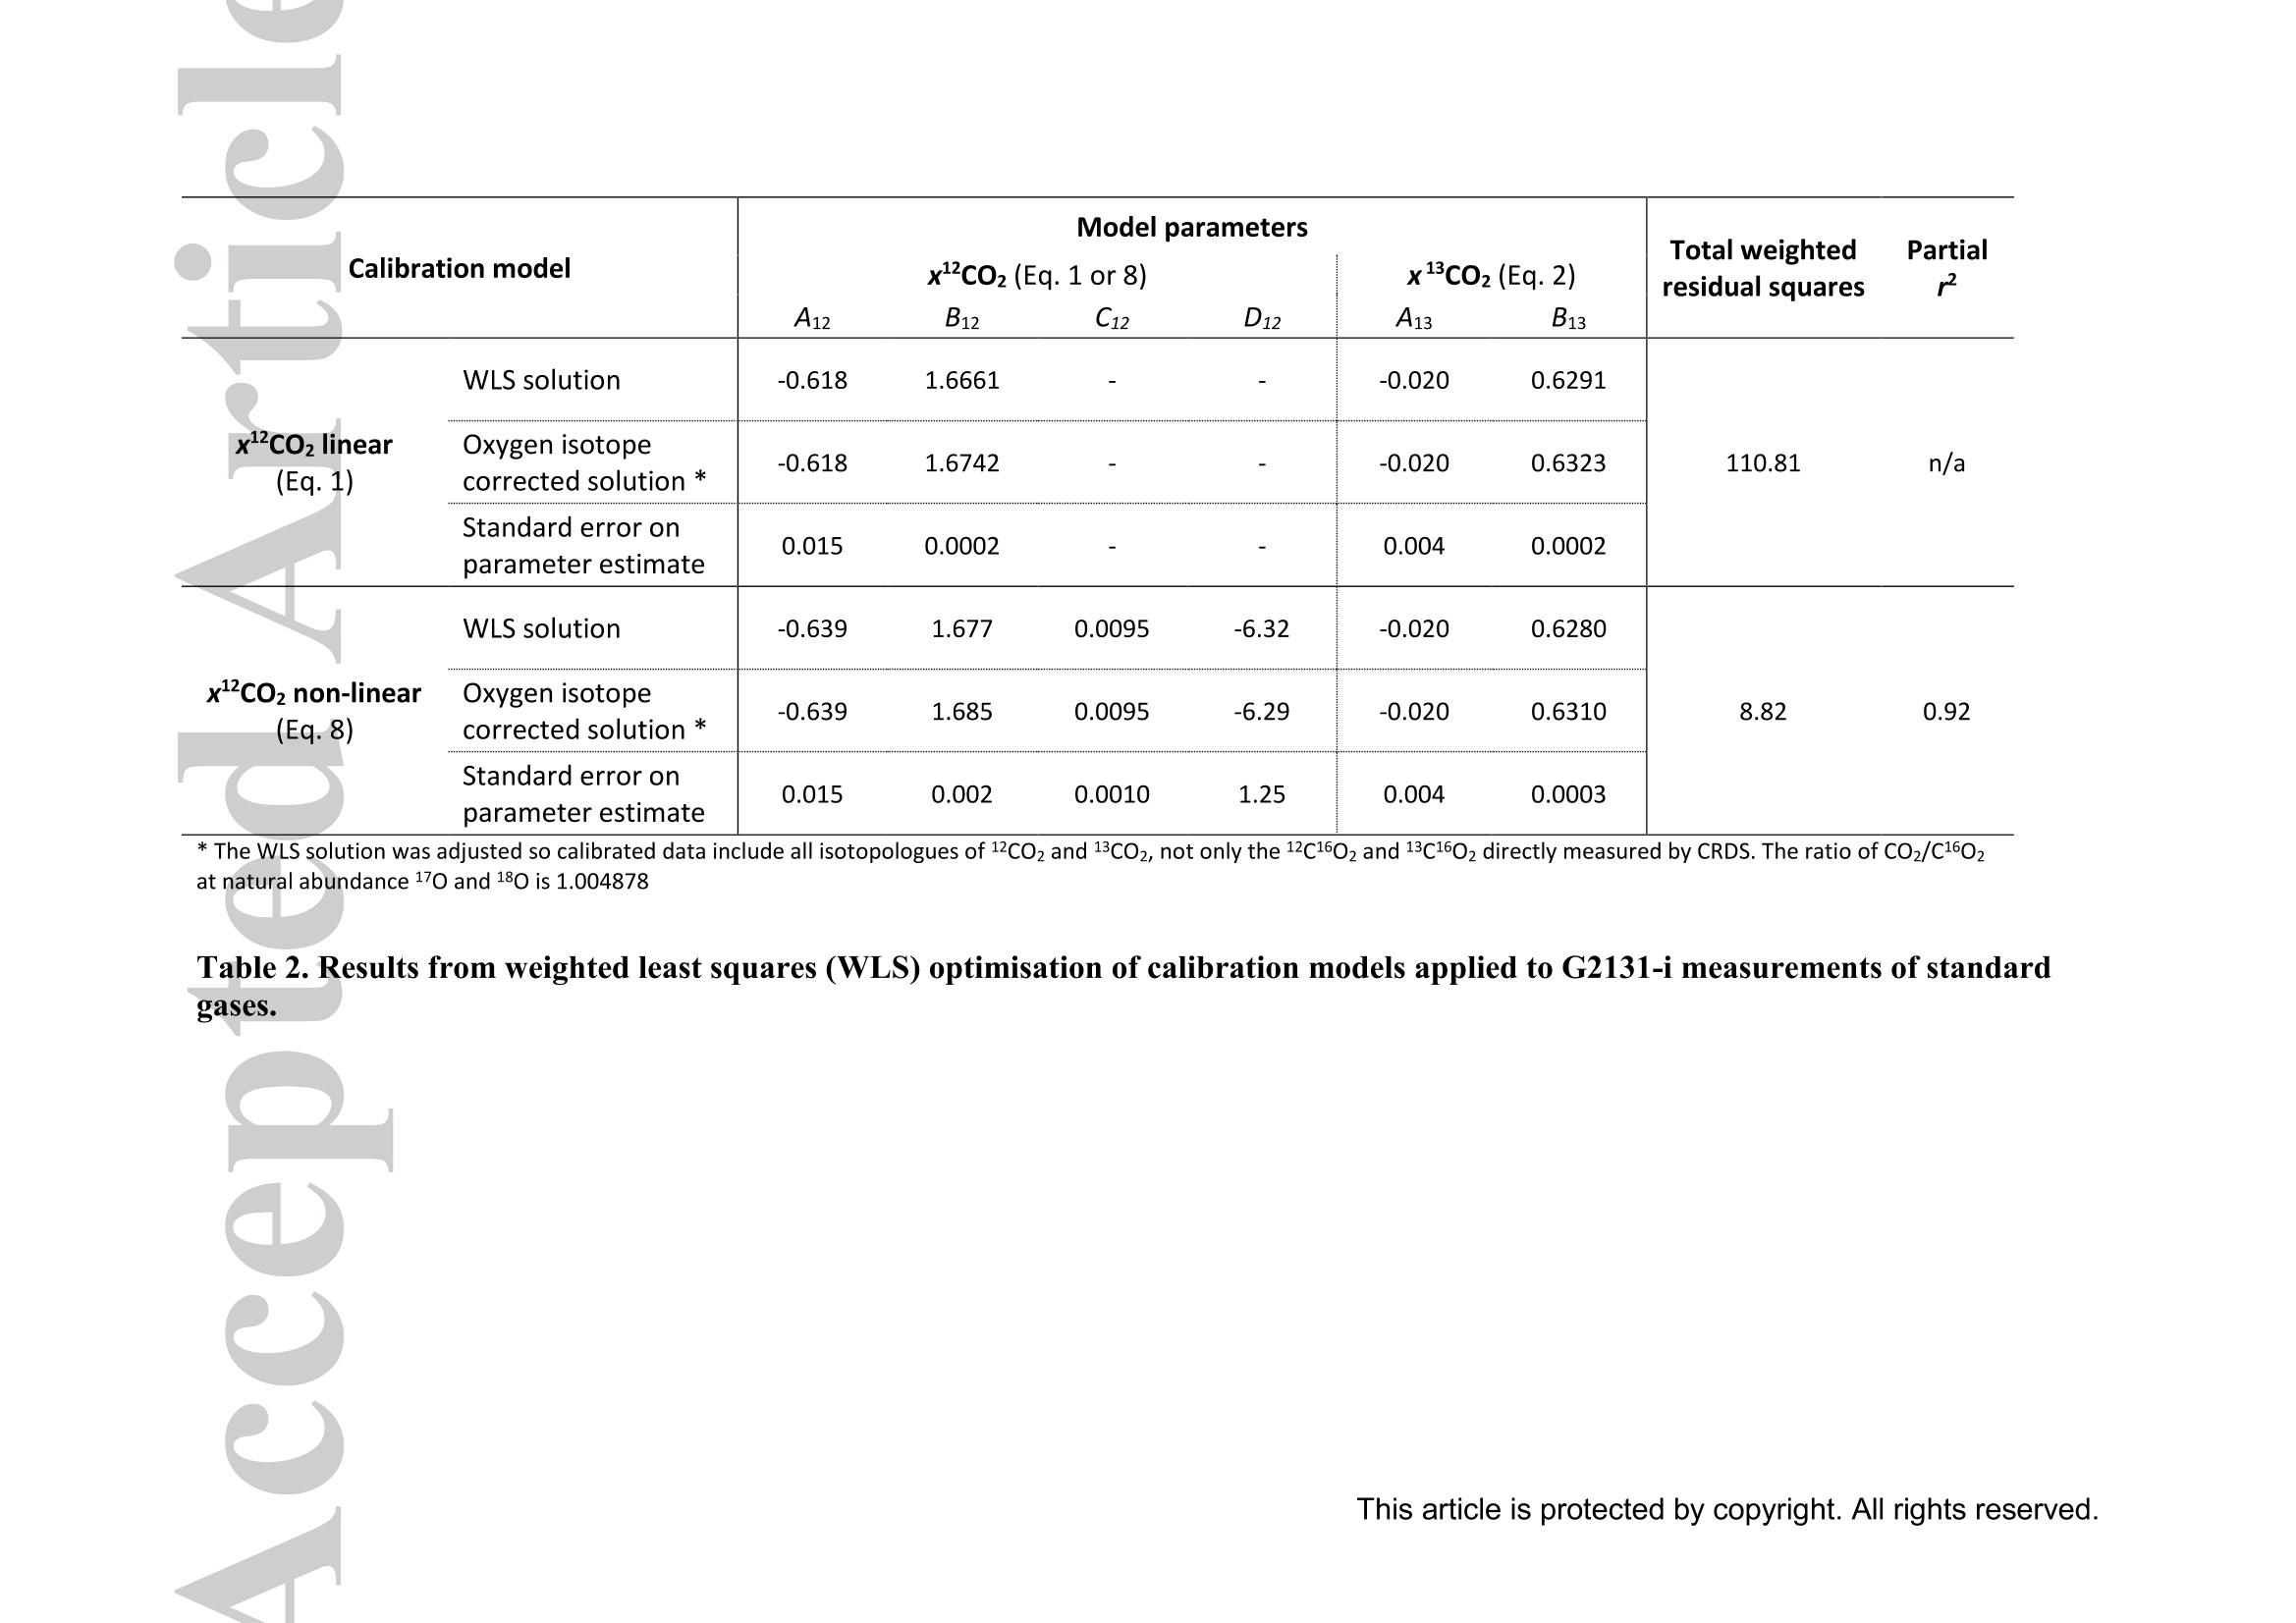
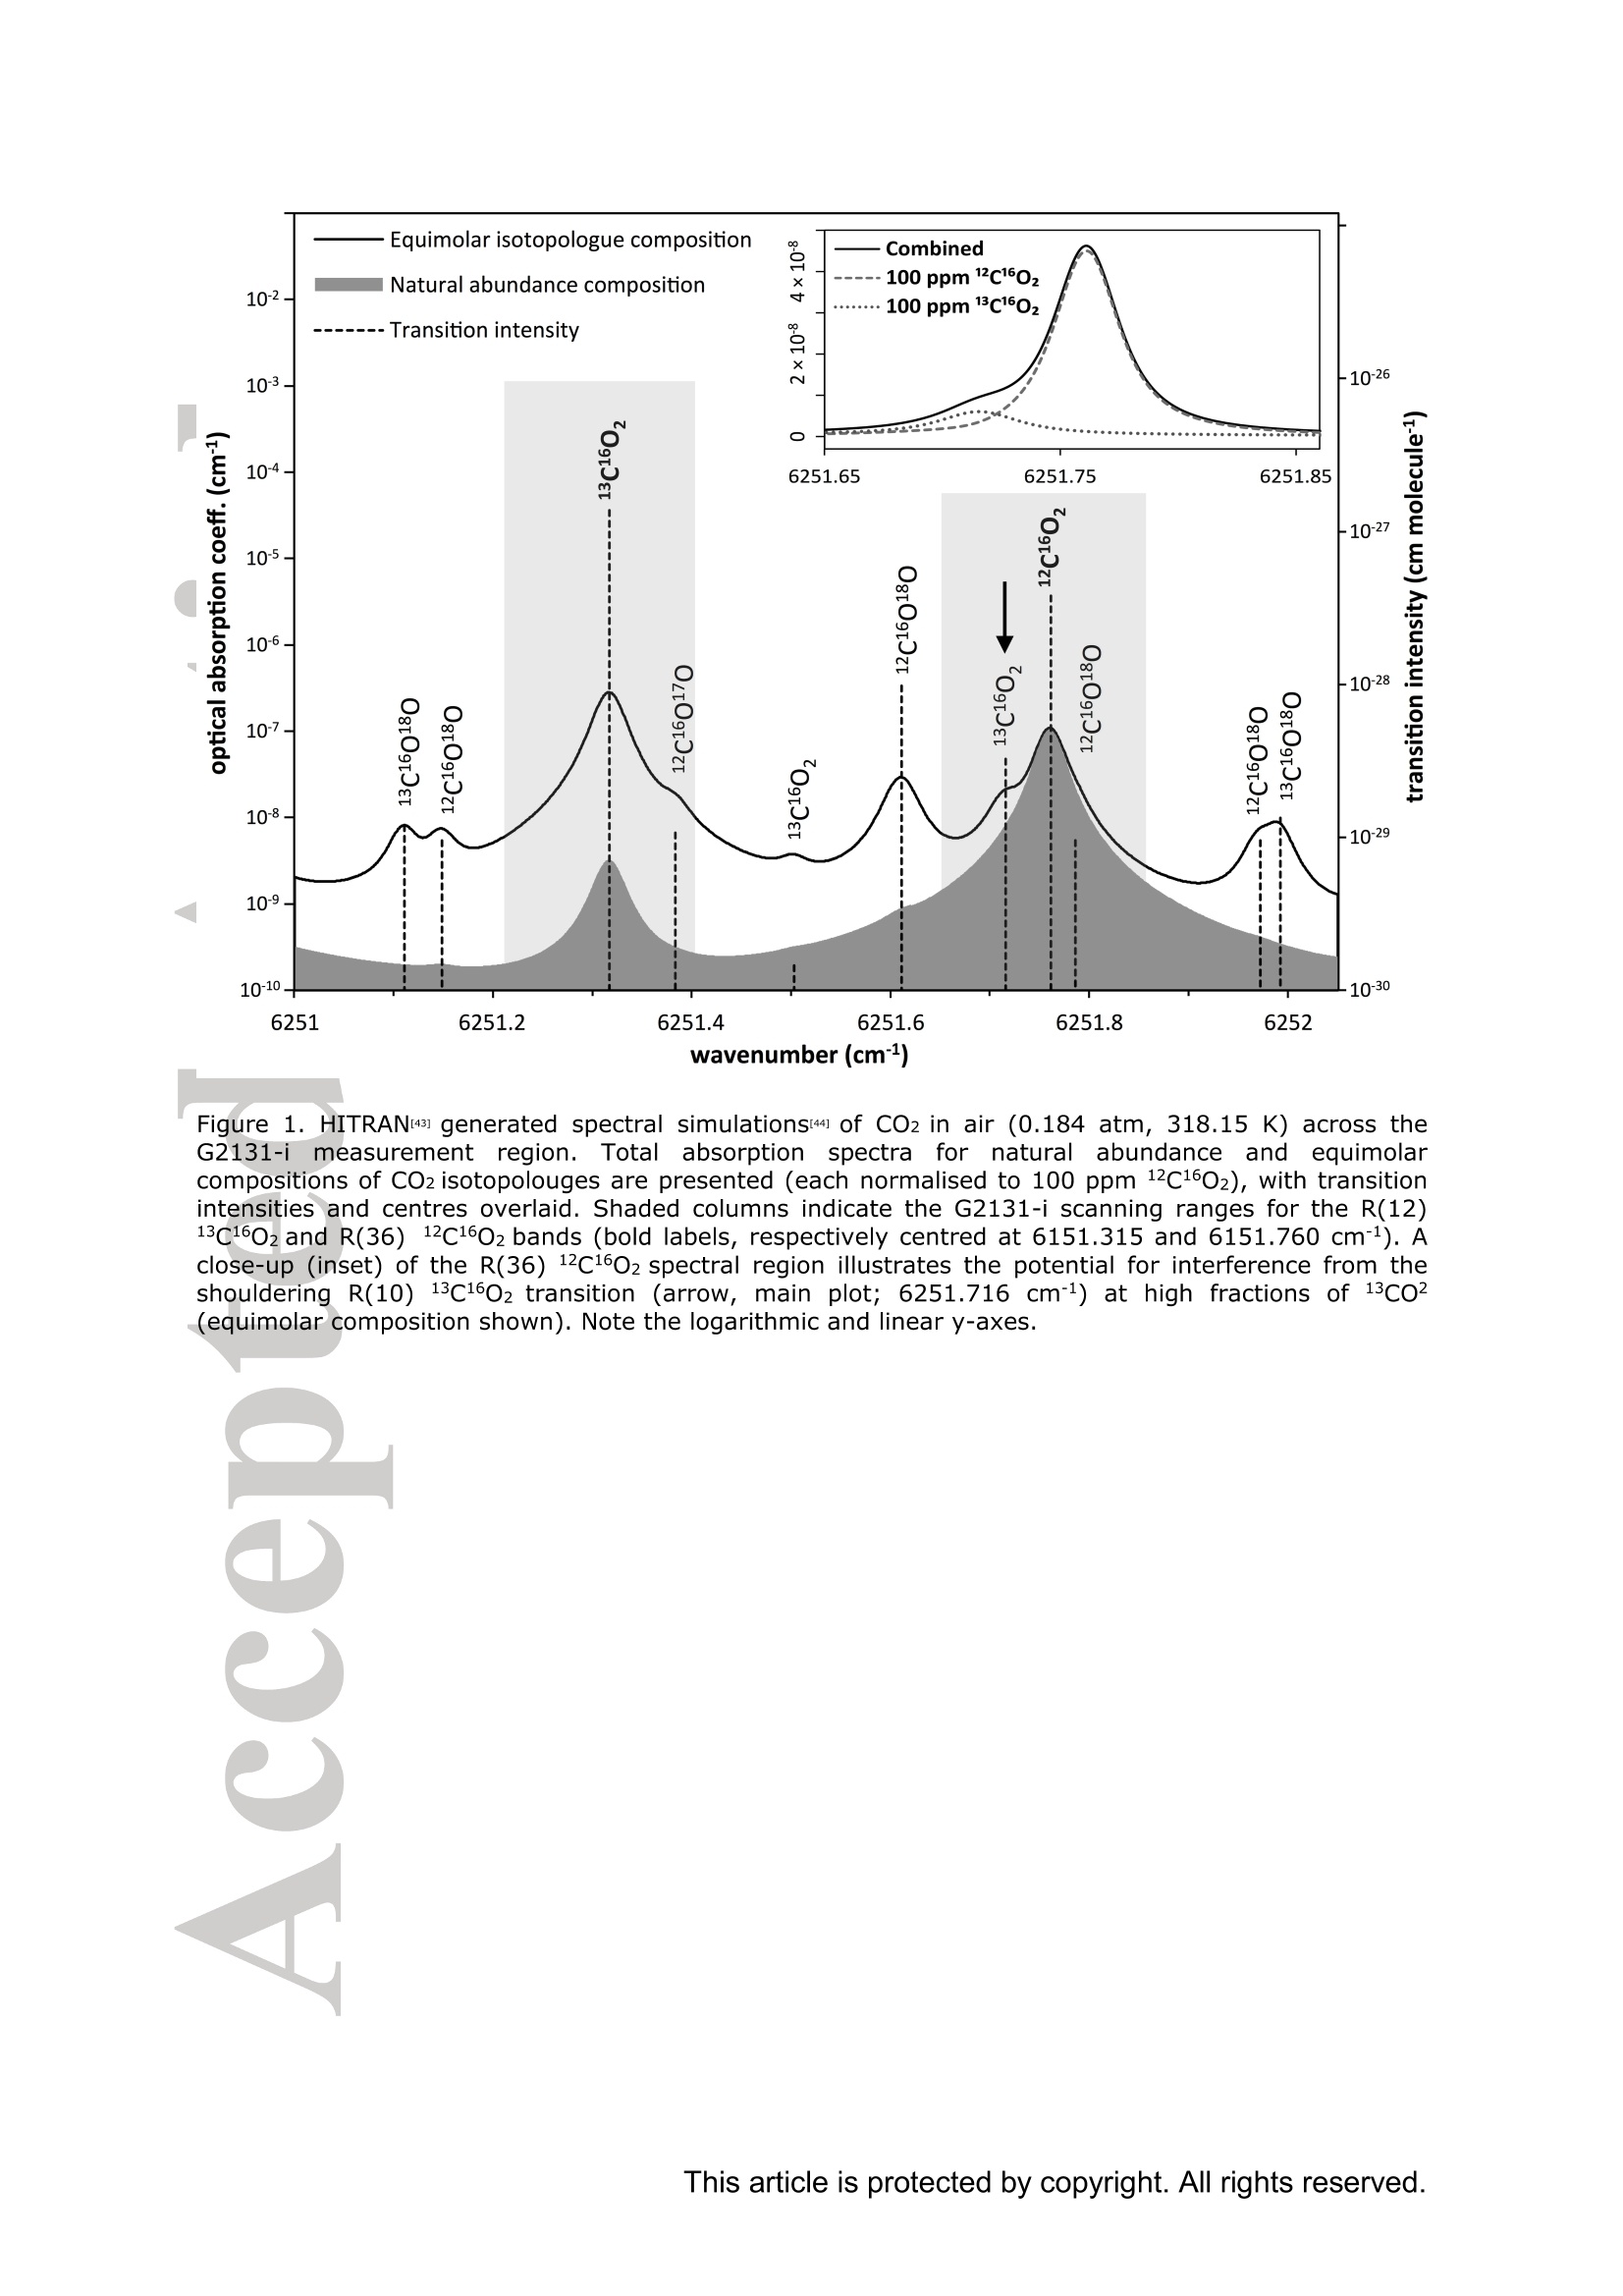
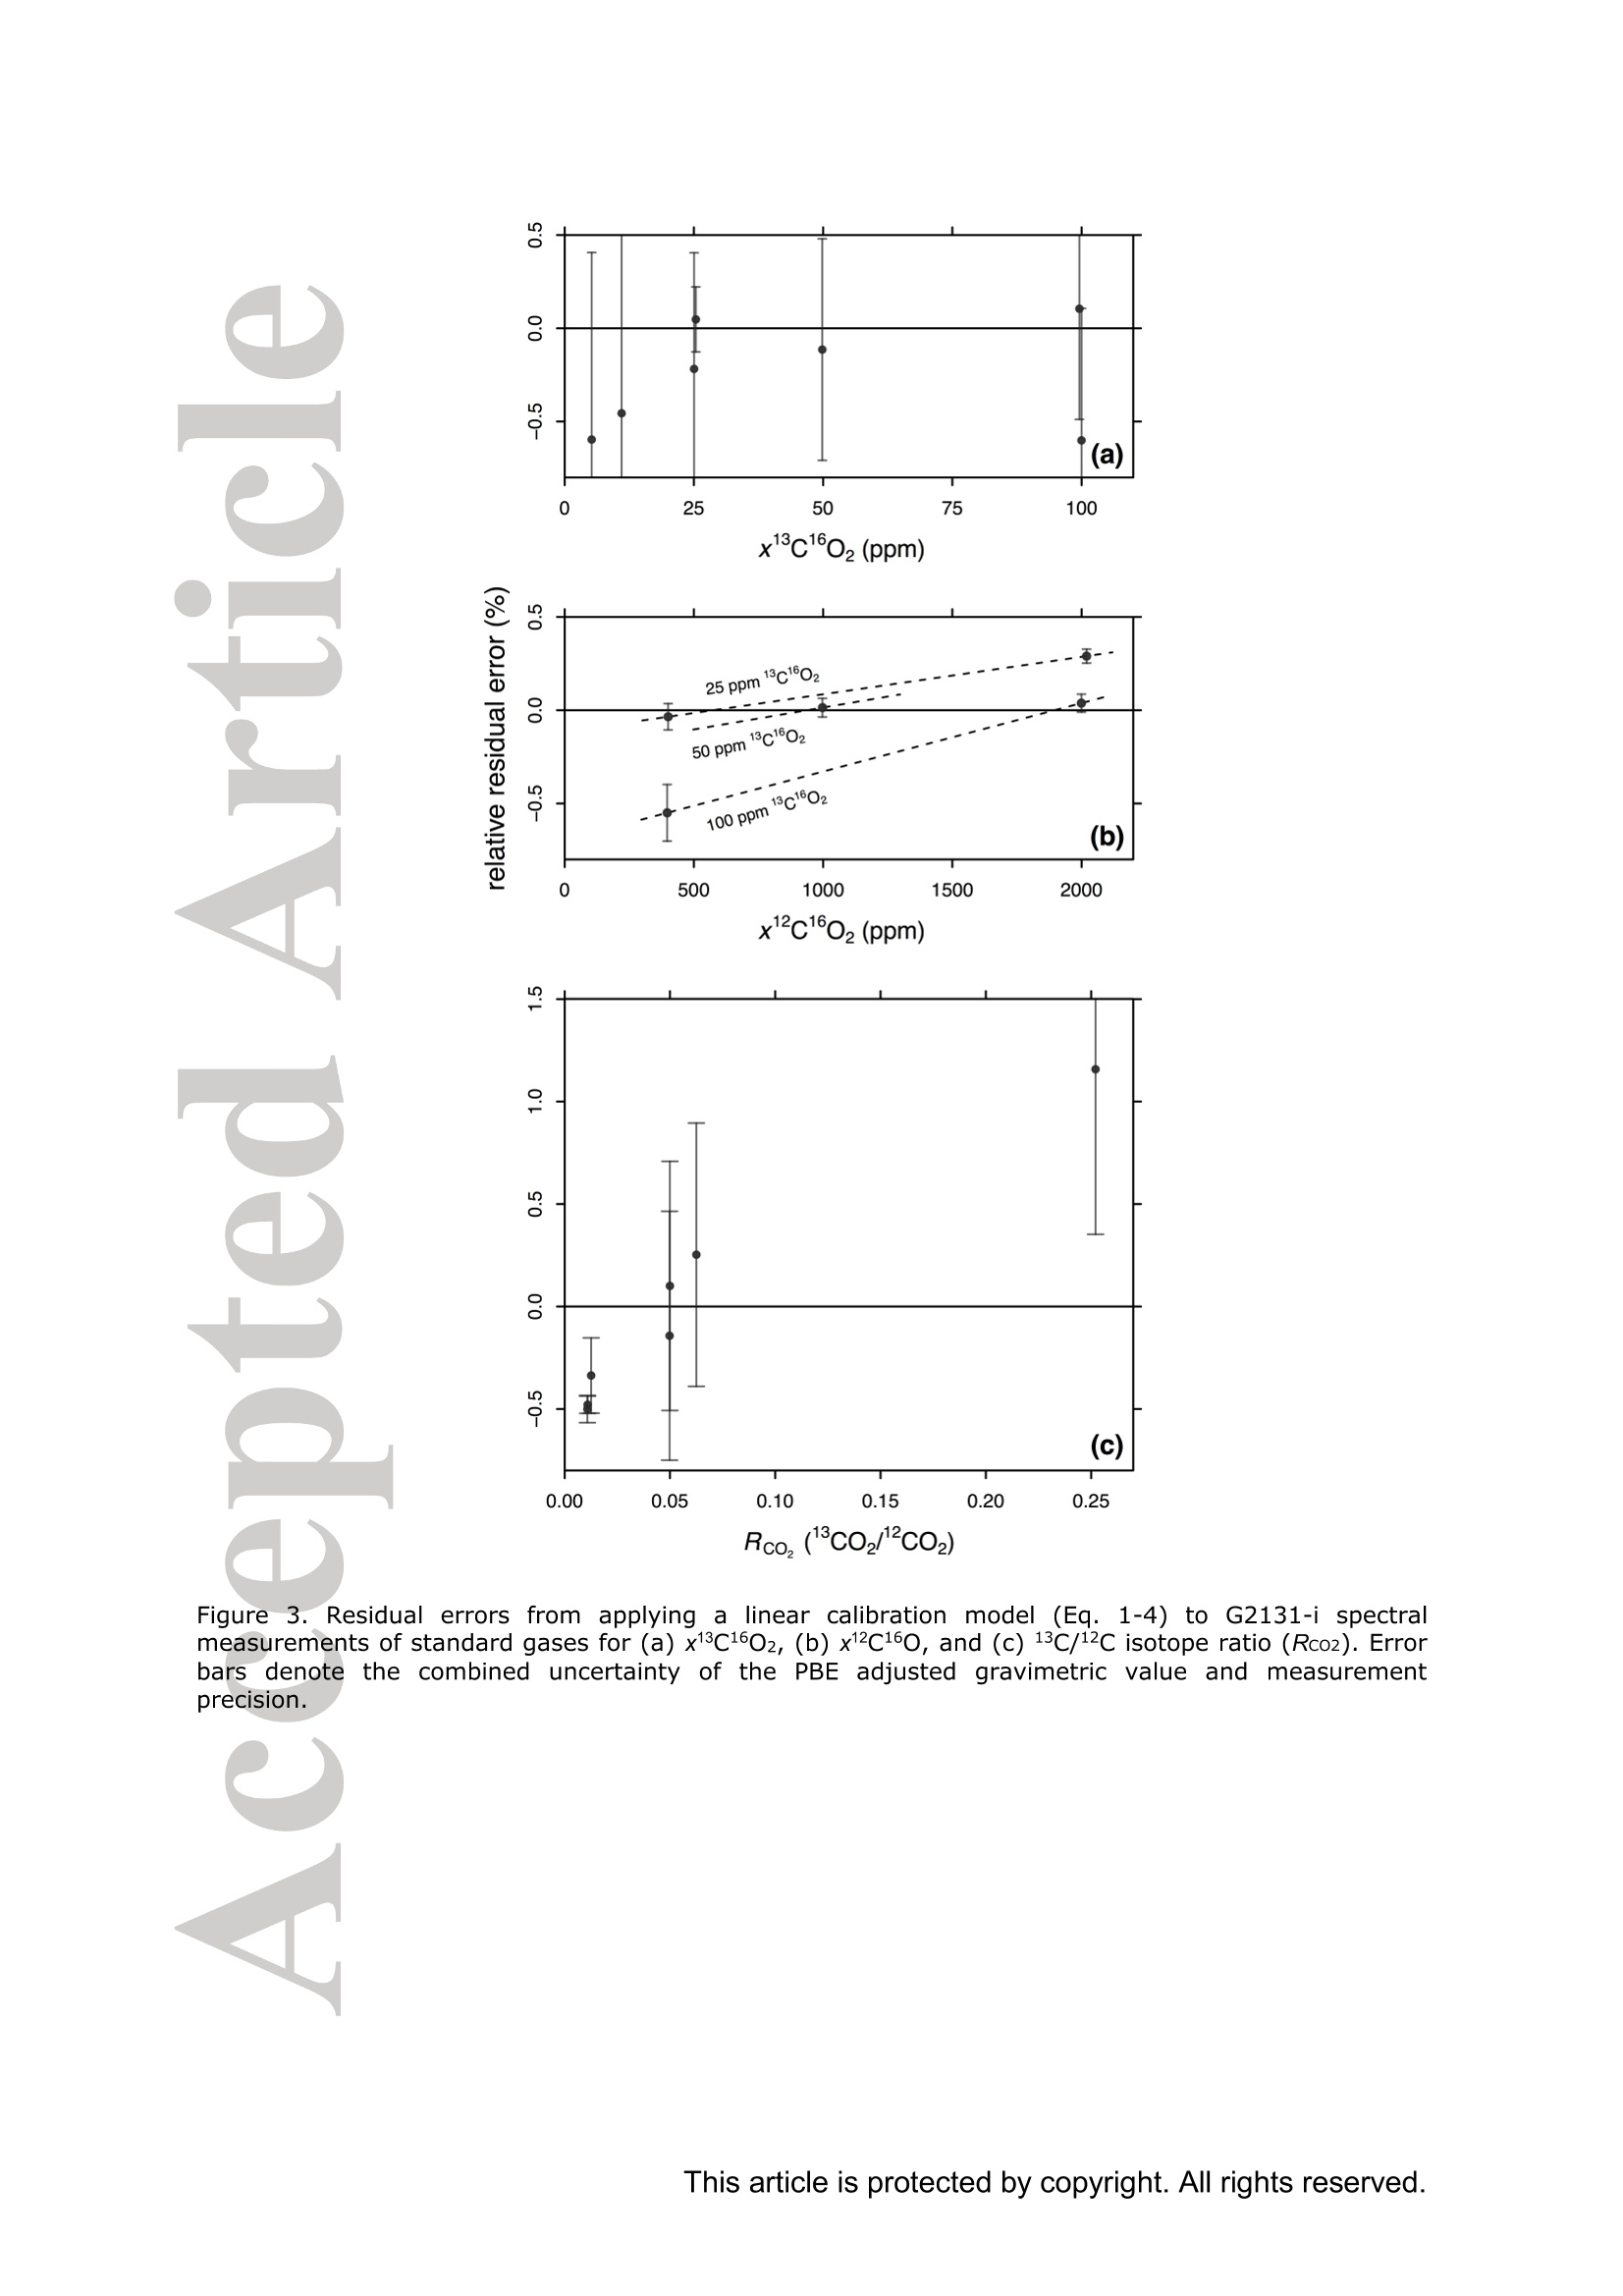
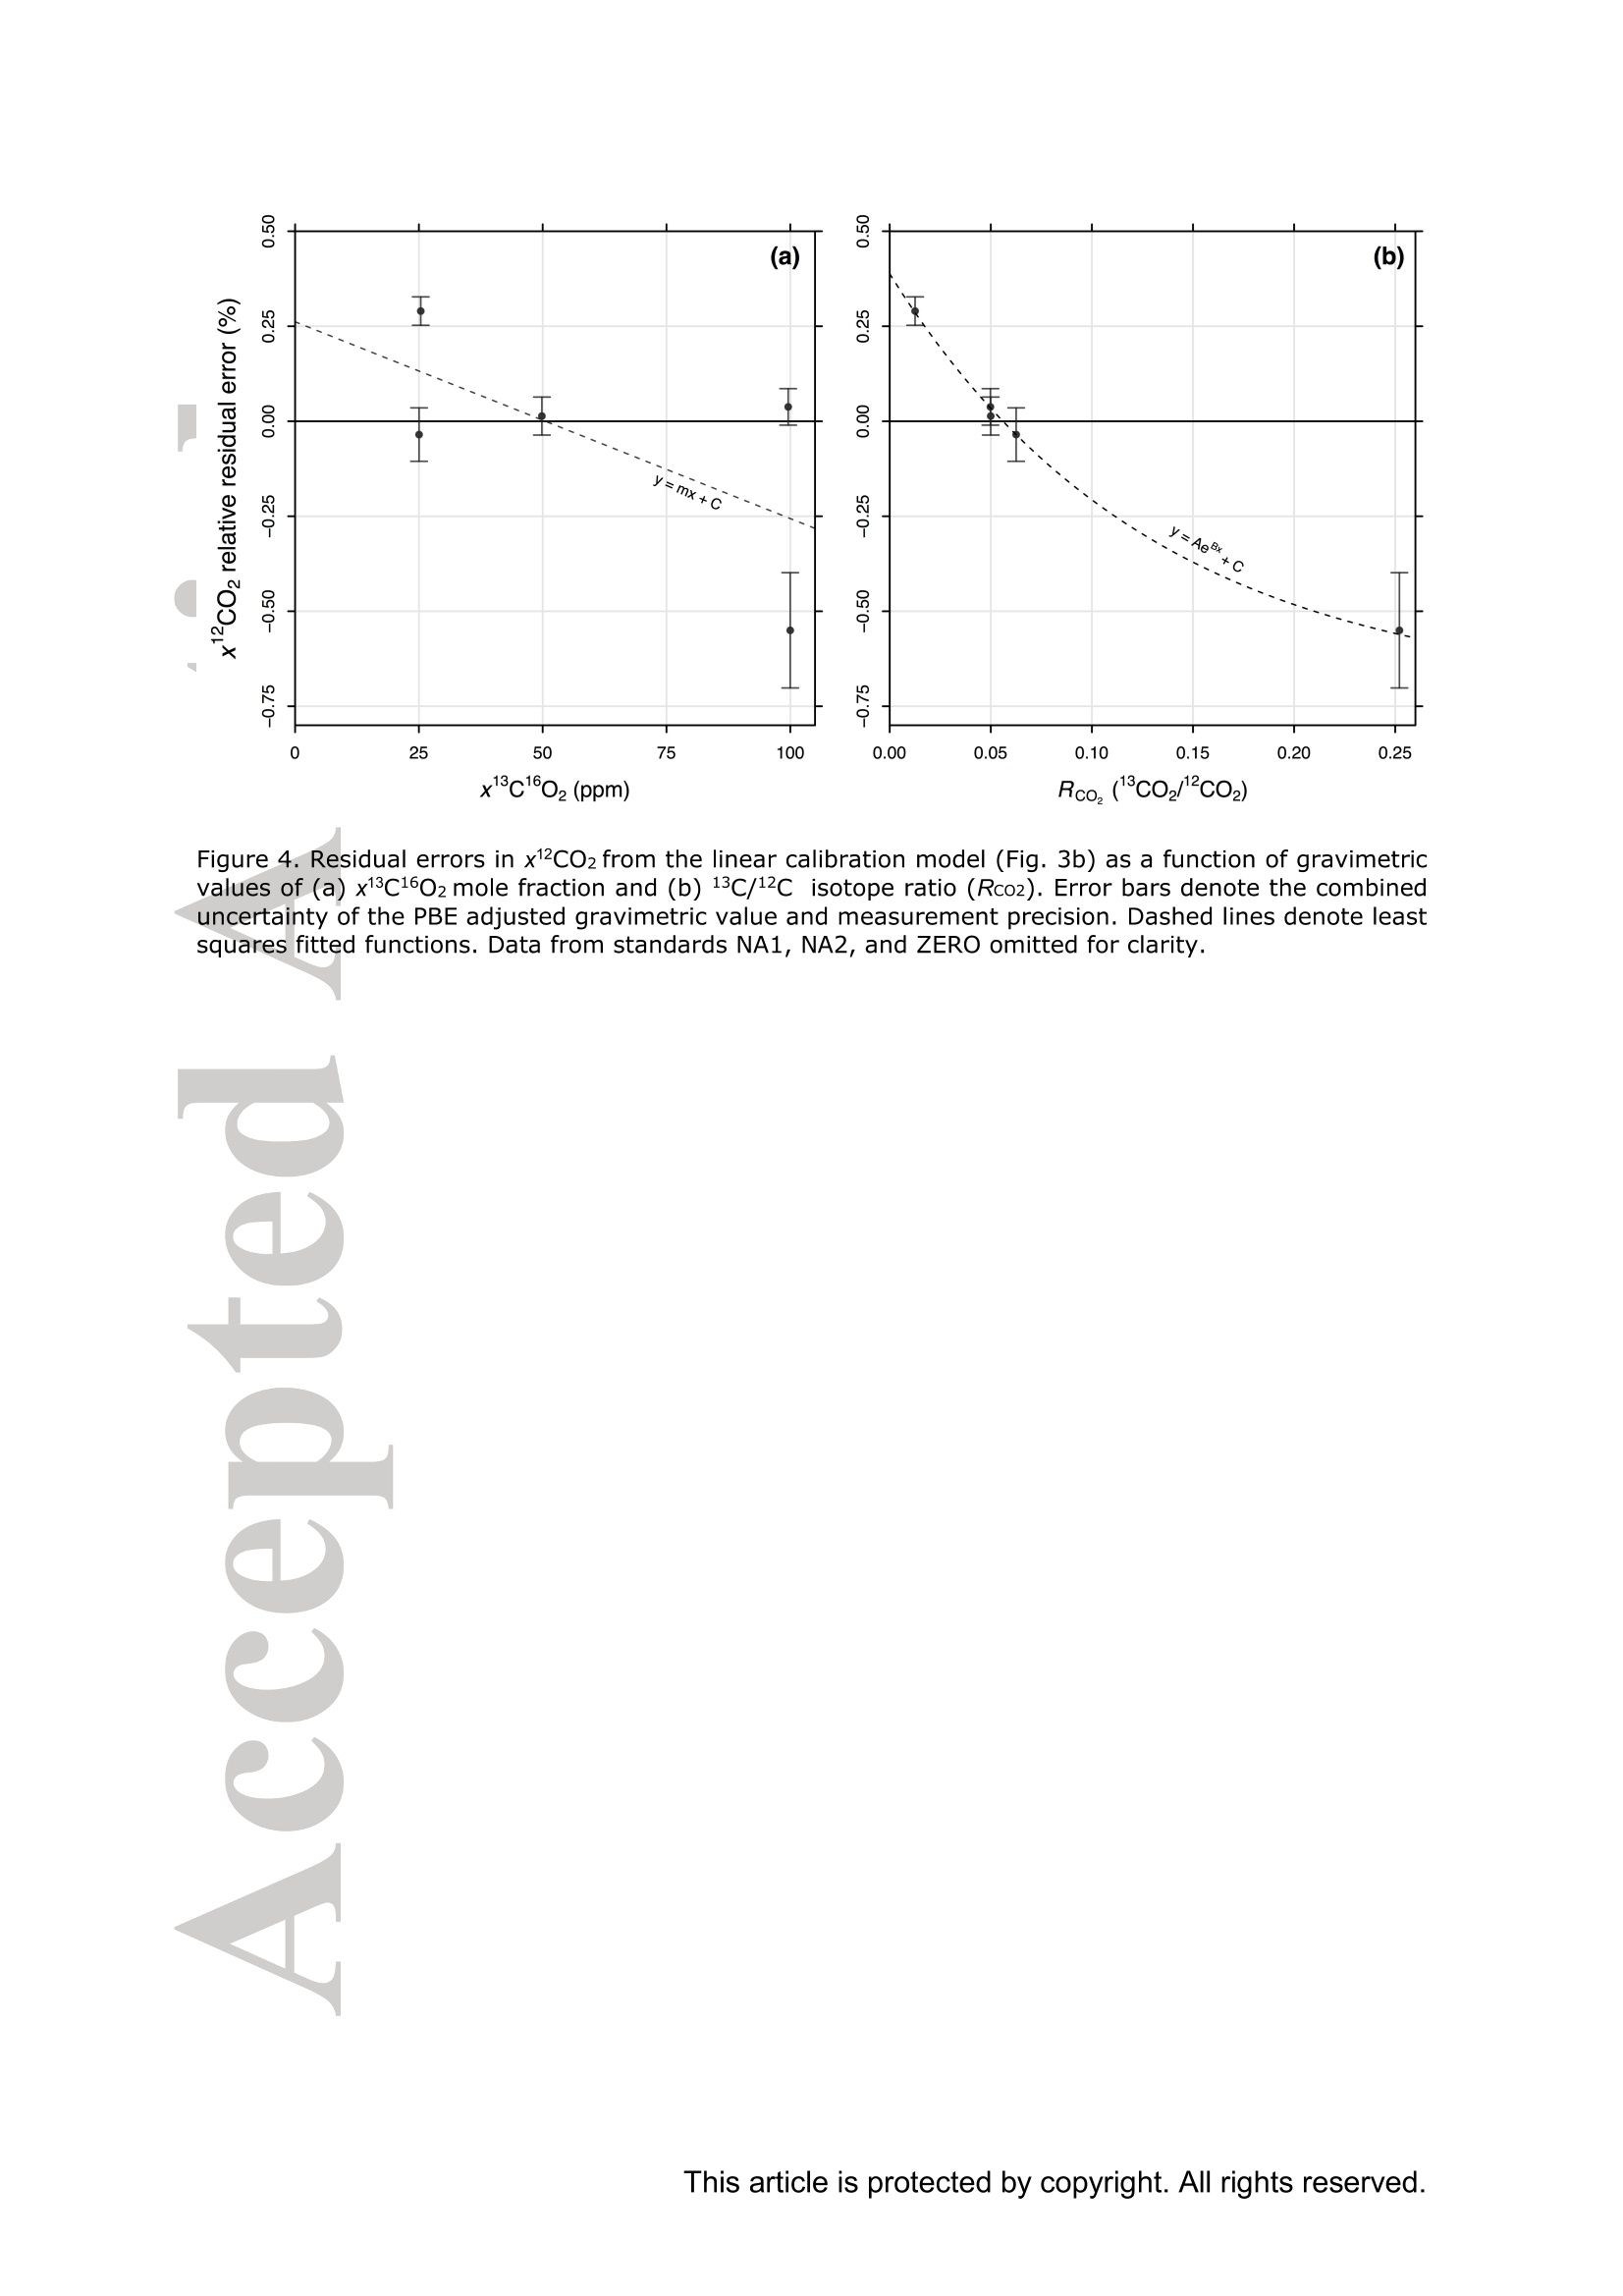
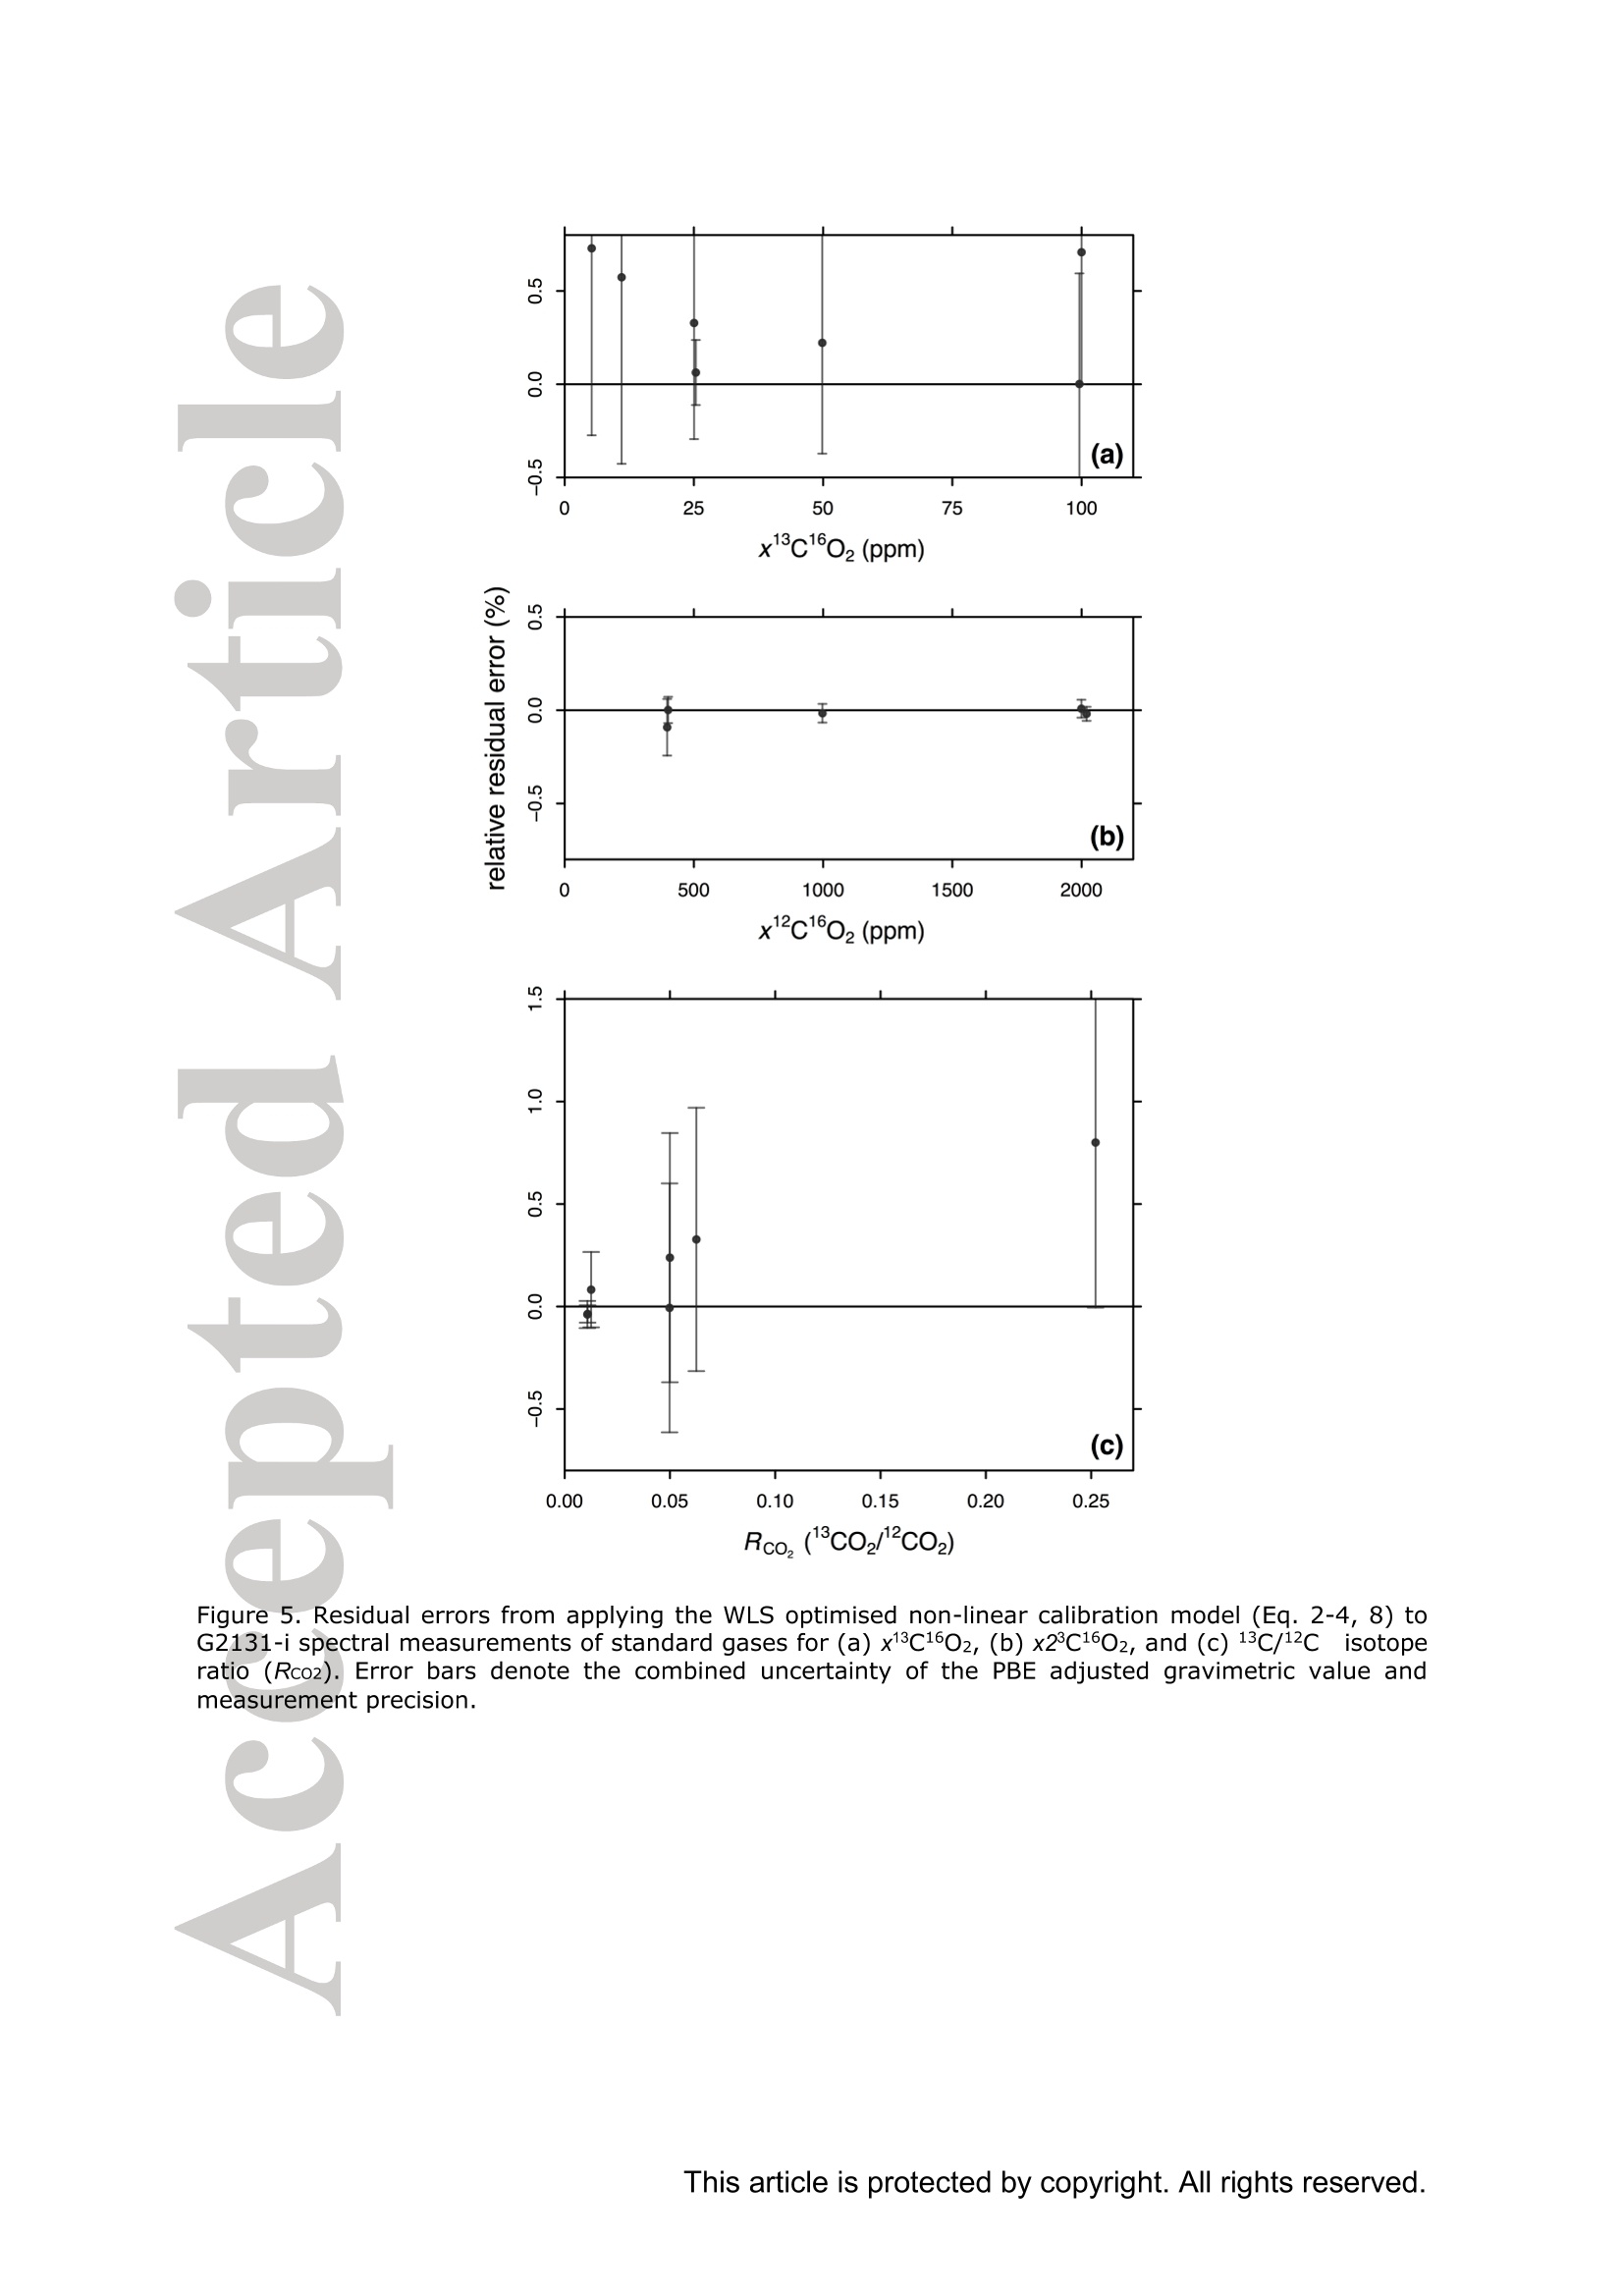
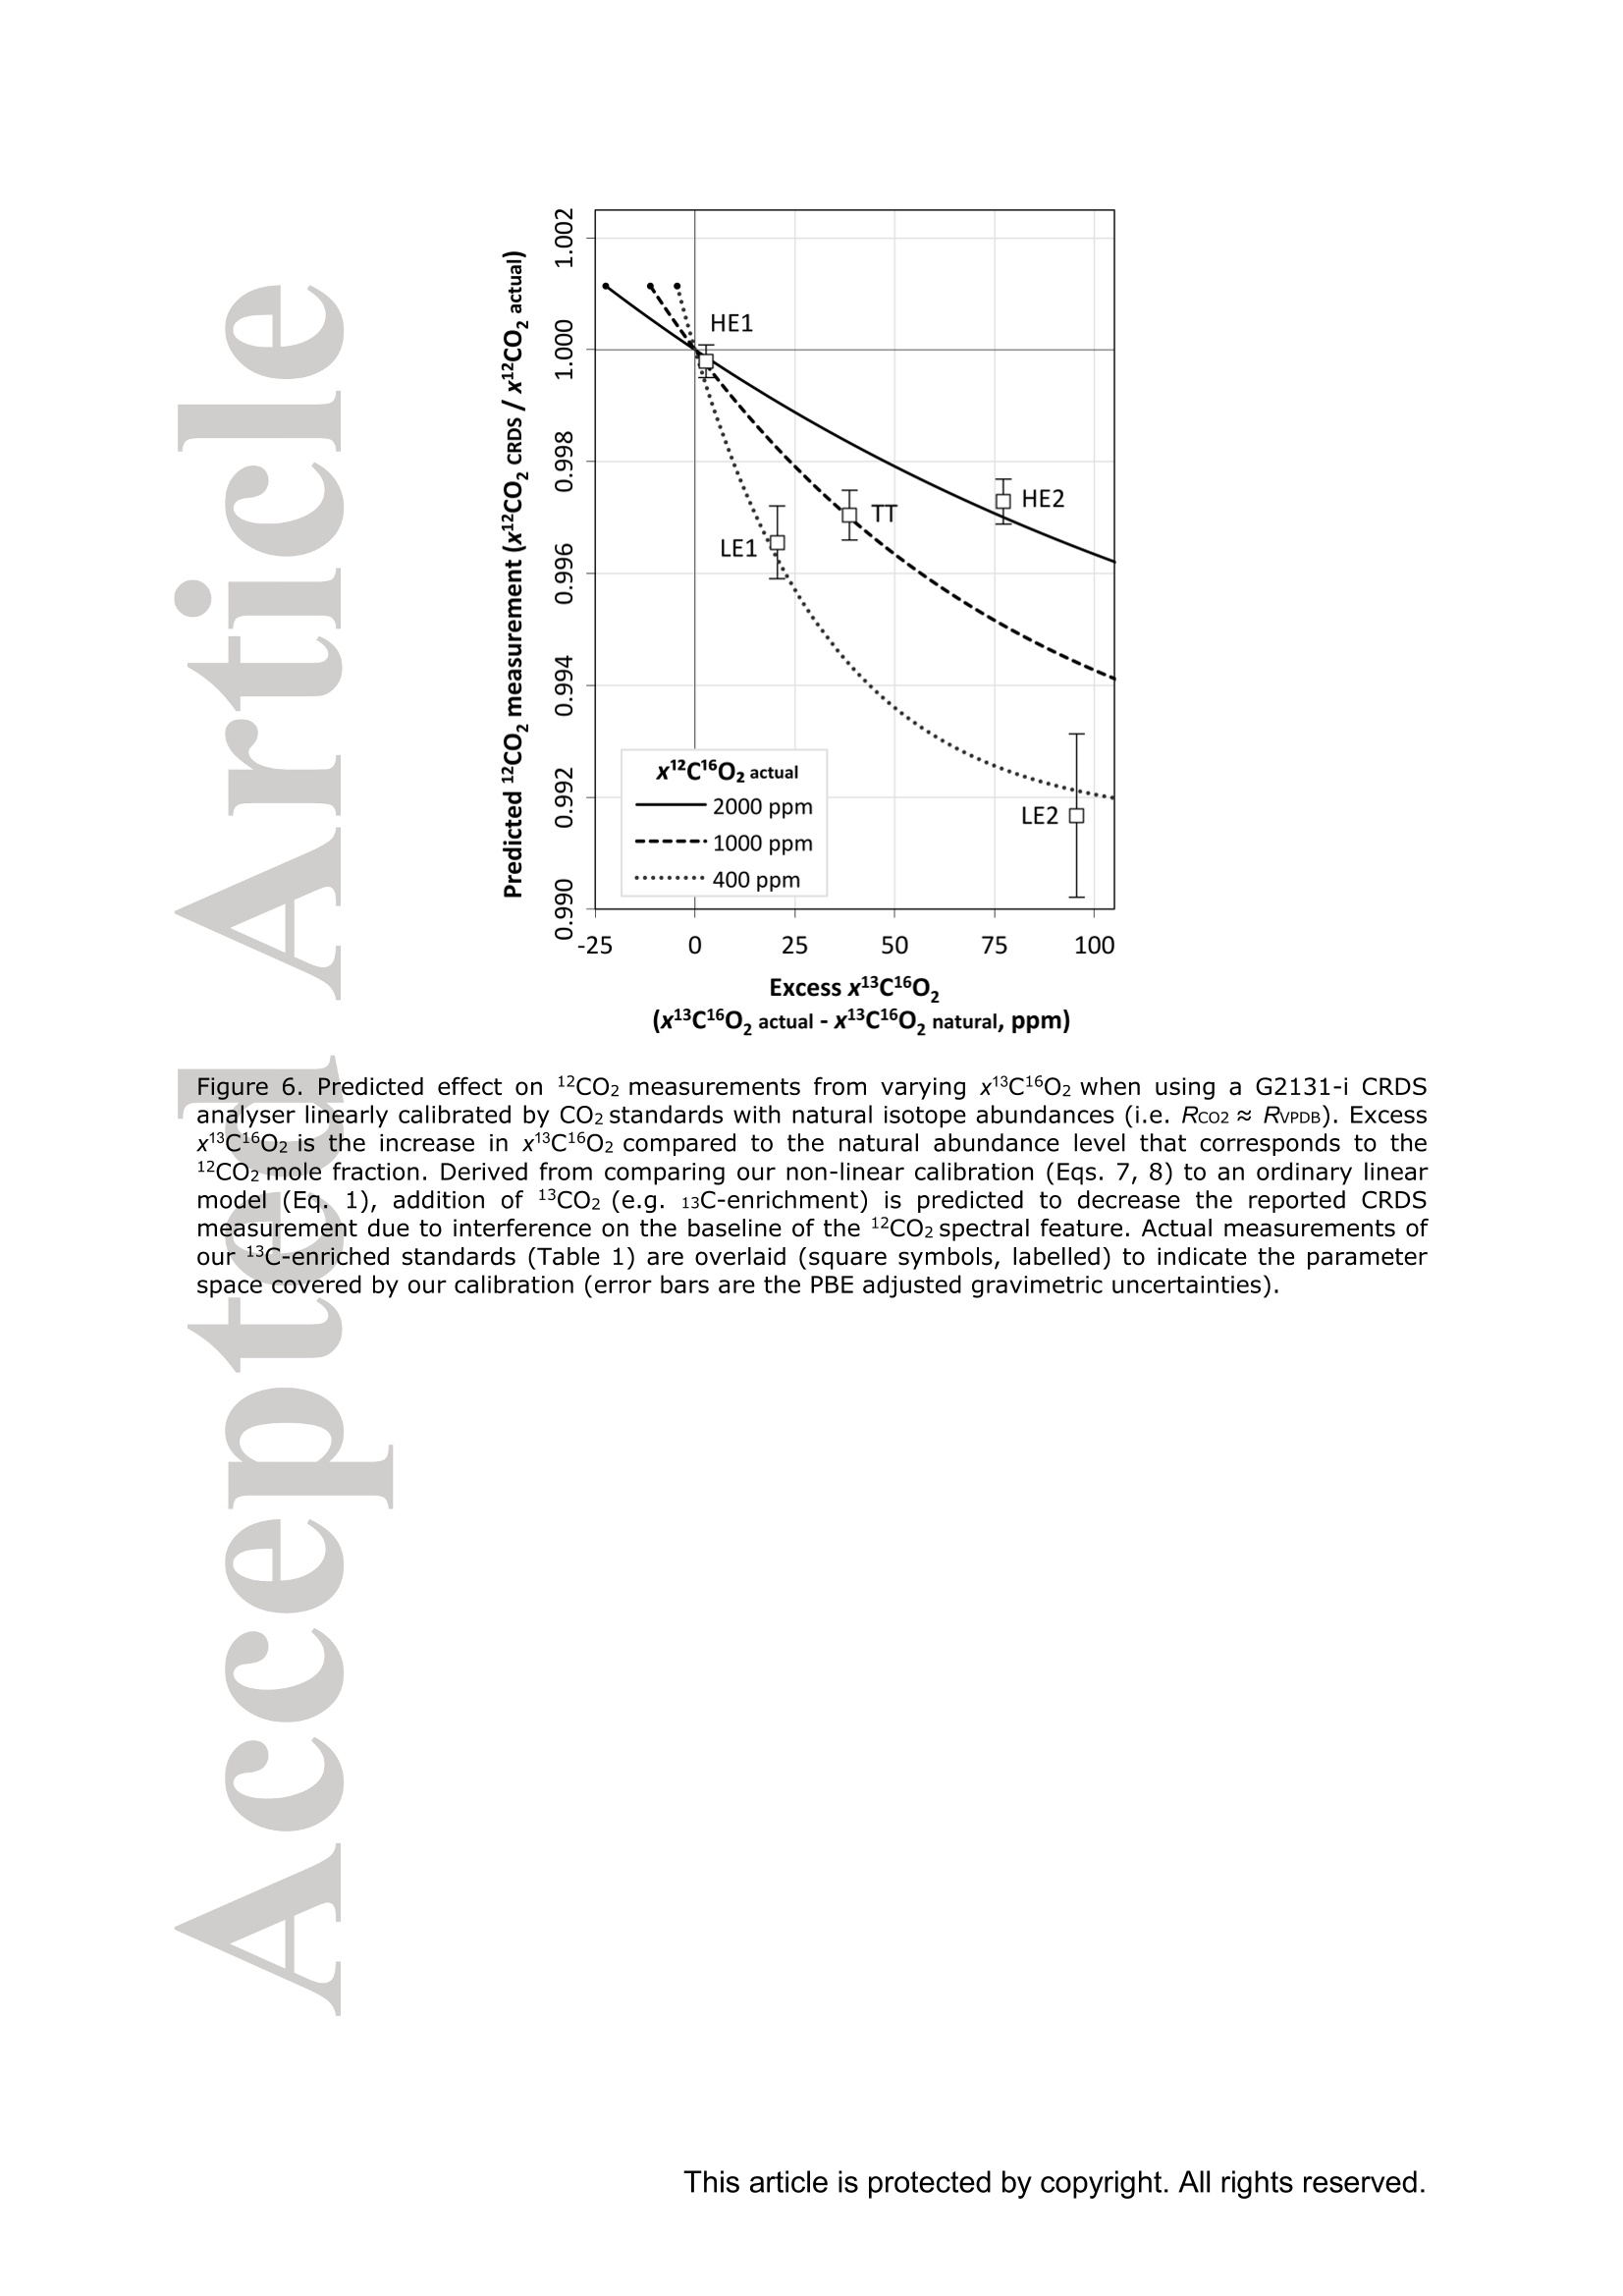
Standard gases: preparation and composition Measuring13C-enrichedCO22 inairwithacavity ring-downspectroscopy gas analyser: Evaluation and calibration Dane Dickinson*. Samuel Bode. Pascal Boeckx’ Biosystems Engineering, Ghent University, Coupure Links 653, 9000 Gent, Belgium 2Isotope Bioscience Laboratory - ISOFYS, Ghent University, Coupure Links 653, 9000Gent, Belgium *Correspondence to: dane.dickinson@ugent.be Keywords: cavity ring-down spectroscopy, 813c, 13CO2, Picarro G2131-i, 13C-enrichment, CRDS This article has been accepted for publication and undergone full peer review but has notbeen through the copyediting, typesetting, pagination and proofreading process which maylead to differences between this version and the Version of Record. Please cite this article asdoi: 10.1002/rcm.7969 Abstract RATIONALE: Cavity ring-down spectroscopy (CRDS) is becoming increasingly popularfor 813C-CO2 analysis of air. However, little is known about the effect of high 13C abundances(on CRDS performance. Overlap between 2CO2 and 13Co2 spectral lines may adversely affectisotopic-CO2 CRDS measurements of C-enriched samples. Resolving this issue is importantso that CRDS analysers can be used in CO2 flux studies involving C-labelled tracers. METHODS: We tested a Picarro G2131-i CRDS isotopic-CO2 gas analyser with specialtygravimetric standards of widely varying I3c abundance (from natural to 20.1 atom%) andCO2 mole fraction (xCO2: <0.1 to 2116 ppm) in synthetic air. The presence of spectroscopicinterferencebetween12co2 anadd i13CO2 bandswas assessed tbyanalysing errorsinmeasurements of the standards. A multi-component calibration strategywas iadopted,incorporating isotope ratio and mole fraction data to ensure accuracy and consistency incorrected values of 813c-CO2,xCO2,andx3co2. RESULTS: CRDS measurements ofxlCo2 were found to be accurate throughout the testedrange (<0.005 to 100 ppm). On the other hand, spectral cross-talk in xl2CO2 measurements ofstandards containing elevated levels ofCo led to inaccuracy in x2CO2, total-xC02 (x2COz+x3co2),and 83c-CO2 data. An empirical relationship for x2cO2 measurestthatincorporated Ic/c isotope ratio (i.e. 13co2/2co2, Rco,) as a secondary (non-linear)variable was found to compensate for the perturbations, and enabled accurate instrumentcalibration for all CO2 compositions covered by our standard gases. CONCLUSIONS: 13C-enrichement in CO2 leads to minor errors in CRDS measurements ofx2CO2. We propose an empirical correction for measurements ofl3C-enriched CO2 in air byCRDS instruments such as the Picarro G2131-i. Introduction Cavity ring-down spectroscopy (CRDS) is an advanced laser absorption method13 gainingprominence for measuring trace gases in air. The high sensitivity of CRDS has alloweddevelopment of analysers tuned to detect multiple isotopologues,4-6] meaning that isotoperatios and mole fractions of trace-gases may be concurrently measured. With similarprecision’l to conventional continuous flow isotope-ratio mass spectrometry (IRMS) but atlower measurement cost basis,[8] isotopic CRDS is poised to displace traditional analyticalinstruments and open new research possibilities. A frequent application of isotope ratio CRDS is 813C measurement of atmospheric CO2.813c-Co2 values are widely used in carbon cycling studies,[10-12] paleoclimatology,[13, 14]oceanography,[15] and atmospheric science[16] Monitoring of greenhouse gas emissions aswell as CO2 sequestration and storage integrity are further applications. 17, 18] Althoughisotopic-CO2 CRDS is principally used for measuring 8C-CO2 values, the simultaneousacquisition of high resolution CO2 mole fraction data (xCO2) is often helpful, for instance inbiomedical metabolic flux analysisIS, 19] and ecosystem soil respiration experiments.[20,21] Significant evaluative work has been conducted on isotopic-CO2 CRDS at natural13cabundances.I7, 9,22-26] Corrective strategies for H2O interference,[27,28] background gas-matrixperturbationeffects,23,29. 301 andconcentration dependencel20,,29-32on813C-CO2measurements are known. The characterisation and elimination of H2S interference have alsobeen described.[33] However, limited attention has been paid to CRDS analysis of 13c-enriched samples despite possible cross-talk between 12Co2 and 13co2 spectral features at high 13C abundances. Assessing instrument performance and potential spectral interference under such conditions is important if CRDS is to be applied to experiments involving 13C-labelled tracers, such as those performed for studying the microbial decomposition oforganicmatter in soil,[34] or in research of plant metabolism.[35] In such cases, in addition to practicaladvantages,[26, 36] accurate isotopic-CO2 CRDS at high 13c abundances would significantlyimprove empirical precision via reduction of uncertainty in isotopic partitioning of CO2 In this study, we tested isotopic-CO2 CRDS for accuracy and spectral cross-talk over a widerange of3C-contents (from natural abundance to 20.1 atom%) and CO2 mole fractions (<0.1to 2116 ppm). Small but detectable interference from 13co2 on 12Co2 measures was observedat high 13C abundances. We present a multi-component calibration strategy and empiricalcorrection for compensating affected measurements of 2Co2 and, indirectly, 83c-CO2values. Our results are important for future refinement of CRDS instrumentation and forresearchers employing CRDS analysers to measure13C-enriched CO2 in air. Methods Cavity ring-down spectrometer The instrument used in this study was a G2131-i isotopic-CO2 CRDS gas analyser (PicarroInc., Santa Clara, CA, USA). The G2131-i measures spectral lines of 12c1602 and 13c1602 in acontrolled optical cavity (35 cm’, held at 318.150 ±0.002 K and 18.67± 0.02 kPa). Avacuum pump and automatic valve system continuously circulate sample gas through thecavity with an inlet flow rate of ca 25 mL min(NTP), while measurement data are returnedat a rate of ca 0.8 Hz. The spectral features measured are the R(36) 30013←00001 band centred at 6251.760 cm² for 12C1602, and the R(12) 30012<00001 transition of 13cl602 at6251.315 cm (Figure 1). The analyser repeatedly assesses ring-down times across eachfeature to construct optical absorption spectra. Galatryl38 spectral models are automaticallyfitted to the spectra, 39, 40] and modelled absorption peak heights used for calculating molefractions of 12C1602 and 13c1602, while 813c-CO2 values are determined from the ratio of the13c1602 and 12c1602 peak heights.[41] However, spectral interferences from CH4 and H2O complicate the CO2 measurements. Tomitigate these, the G2131-i also measures spectral lines of 12C'H4 and H2160 (respectivelycentred at 6056.84 and 6057.80 cm; not shown), which are used to correct raw CO2 peakmeasurements. The H2O corrections are comprehensively described elsewhere,[27,28,41] whilecompensation of CH4 interference[9] is explained in notes[41, 42] from the instrumentmanufacturer (see also supporting material 1: Table S2). After the CH4l4aand H2O corrections, the G2131-i applies separate linear calibrationtransformations (i.e. Beer-Lambert law, see supporting material 1: Table S3) to the correctedspectral peak data of 12c1602, 13c1602, and their ratio (i.e. 13c1602/2c1602 to independentlygive 83c-CO2).[41] This approach is problematic as it invites systematic disagreement inoutput results -because fixing any two values of x12Co2, xl3co, and 83C-CO2automatically determines the third, individual calibrations for all three leads to contradictory,overdetermined data. Although such inconsistency may be overlooked in certain contexts (ifaccurate xCO2 data are not required for example), in our view, the possibility for artificialerror represents an oversight in G2131-i calculation logic. We describe an alternativeapproach that ensures consistency in final CO2 values (see below). Potential for spectral cross-talk between ’Co2 andCo2 Apart from H2O and CH4, no other interferences to CO2 absorptions are considered by theG2131-i system. Examining the spectral region,[43,44] however (Figure 1), a potential sourceof additional interference is the R(10) 31112<01101 13cl602 transition at 6251.716 cm thatshoulders the R(36) 12c1602 feature (measured by the G2131-i from 6251.65 to 6251.86 cm1). At natural abundance 13C the comparative magnitude of these two absorptions differs by afactor of more than 700, making any interference negligible. However, in our focus on 13c-enriched CO2, this presumption may not hold, and measurement error in 12C1602 may result.For instance, at 10 atom%1c the R(36) 12C02 absorption is only 70 times greater than theR(10) 13c1602 band. While such potential perturbation may seem minor, work by Malowanyetall3c3o]ncerning H2S interference on CO2 spectroscopy shows that even asmallshouldering overlap from unanticipated transitions can result in disruption to 12C1602 and3c2 measurements (and subsequently to 813c-Co2 values). The potential for interferenceis visualised most sharply in the total absorption spectrum for equimolar fractions of 2cO2and 13Co2 in air (i.e. 50 atom% 13c; Figure 1 inset). In contrast to the R(36) 12C1602 transition, no unaddressed cross-talk interferences are likelyto affect the R(12) 13c1602 measurement band (6251.21 to 6251.40 cm, Figure 1). The onlypossible conflict is the 12c1600 absorption at 6151.383 cm, but this is ca 1200 timessmaller than the 13C1602 feature at natural abundance 170. (For completeness we also mentionthat the 12c160180 spectral bands at 6251.611 and 6251.785 cmhave respective absorptions650 and 6000 times less than the R[36]12Cl602 transition at natural abundance 180, meaningthat neither are plausible sources of interference in samples containing natural distributions ofoxygen isotopes.) To investigate possible cross-talkbetweenCO2 species and any effect on G2G12.131-iperformance, five high-precision 13C-enriched gravimetric standard gas mixtuires wereprepared by Linde Gas Benelux B.V. (Dieren, The Netherlands). The standard mixtures werecomposed of C-enriched and natural abundance CO2 sources (Sigma-Alrich Corp., St.Louis, MO,USA), and were balanced with high purity O2 and N2. Standards were designedto conform to G2131-i performance specifications, with total-xCO2 (i.e. xl2CO2 +x13Co2)ranging from 429 ppm to 2116 ppm. Meanwhile the 13C-content varied from near naturalabundance to 20.1 atom% (i.e. 813C-Co2 values from ca -36 %o to +21500 %o vs VPDB45]).In addition to 13C-enriched standards, two natural 13c abundance standard airs and a standardzero air were also sourced (Praxair N.V., Oevel, Belgium; Air Liquide S.A., Paris, France).All sstandards were prepared moisture-free;[46] composition data are presented in Table 1.Uncertainties on 13C-enriched standards were calculated using error propagation methods[47]incorporating gravimetric, isotopic, and molar mass precisions inherent to the preparationprocess (sensitivity of the gravimetric balance and isotopic purity of the 13C-enriched CO2source were the largest contributors ofuncertainty). These resulting uncertainties (Table 1)effectively placed tolerance limits on the standard values - limits within which accurateCRDS measurements should lie (complete calculations set out in supporting material 2). Thenatural 3c abundance standard airs had certified levels of total-xCO2 (from which the CRDSrelevant xC1602 values were deduced, Table 1) while their 813C-CO2 values were determinedusing a trace-gas preparation unit (ANCA-TGII, Sercon Ltd, Crewe, UK) interfaced to aSerCon 20-20 isotope ratio mass spectrometer. The IRMS measurements were calibrated withVPDB reference standards and carried an uncertainty of 0.3 %o. One complication of the 13C-enriched standards was the presence of 18O-enriched CO2, whichwas introduced from the initial 13C-enriched CO2 source (99 atom% 13C, 2.0 atom%6180).Although CO2 species containing 18o(and ’0) are not detected by the G2131-i, there ispotential for interference from any significant increase in 12c16018o (see above). Fortunately,because only small amounts of the 13C-enriched CO2 source were used in producing thestandard mixtures, we determined that the 8180-12CO2 values in the final standards were nomore than ca +50 %o vs VSMowl45]. Consequently, interference from 12cl60180 was not aconcern and we could reasonably disregard the excess 180. For clarity, we report 12C1602 and13c02 isotopologue data (Table 1) and use these in all calibration calculations beforeseparately applying a final oxygen isotope scaling-factor to align calibrated 2C02 and13c1602 measurements to their would-bee112CO2 and13CO2mole fractions at naturalabundances of oxygen isotopes. Standard gases: gas-matrix pressure broadening corrections Since our 13C-enriched standards were balanced with N2 and O2 but not Ar, the CO2spectroscopy differed slightly from that of ambient air due to gas-matrix pressure broadeningeffects (PBEs). To ameliorate these distortions, we applied adjustments to the gravimetricvalues of the prepared standards to give apparent CO2 mole fractions and 13c/l2C isotoperatios that an accurately calibrated G2131-i instrument should report (i.e. CO2 compositionequivalents, as though the standards had been balanced by CO2-free ambient air). Significant work has been conducted on the PBEs of CO2 spectral absorptions relevant to theG2131-i,[48-56]with the empirical effects of different buffer-gas compositions on CRDS comprehensively documented.[29,30, 57-59] We assessed the correction method of Friedrichs et al29 as suitable for making PBE adjustments in our work, and preliminary testing of theG2131-i indicated performance consistent with their findings. Briefly, Friedrichs et al apply asingle line shape correction for PBEs on CO2 mole fraction data and use a separate 813Coffset factor to adjust for divergence between R(36) 12c1602 and R(12) 13C1602 bands (andhus 813C-CO2 measurements).We found excellent agreement between the empiricalcorrection of Friedrichs et al and the relative buffer-gas pressure broadening coefficients ofthe R(36) 12c1602 transition as described in specialist studies.[50-54, 59-61] On the other hand, wewere unable to find any literature on pressure broadening coefficients for the R(12) 13C602transitiioonn in order to compare the 813c offsets, although we note that the spectroscopicsimulations of Friedrichs et al are in close agreement with their empirical findings. While Friedrichs et all29l do not provide uncertainty analysis in their correction scheme, Naraet all58]report standard errors for their PBE measurements of the R(12) 30013<000012C16O2 transition in a sister CRDS instrument (Picarro G2301). Applying the errors observedby Nara et al to our calculations yielded ca 4.5 % relative uncertainties on the PBEs in2c1602. To remove all doubt, we therefore incorporated 9 % uncertainties on our PBEadjustments. We similarly incorporated uncertainties on the 13C1602 corrections derived fromFriedrichs et al by placing conservative margins on their 81c offset factors. CO self-broadening effects were omitted as negligible (which, if detectable, would be seen as non-linearity in the CRDS absorption-abundance response). Finalised PBE corrections2andapparent CO2 compositions that an accurate G2131-i should measure for the 13C-enrichedstandards are presented in Table 1 (for details see supporting material 2). Measurements ofstandard gases Standards were measured in an environmentally controlled laboratory (20°C) to ensure stableconditions for analyser operation. Measurements were conducted by connecting gas bottles tothe G213i-i inlet port via a regulated union (10 kPa gauge pressure). Each standard waspumped through the optical cavity for more than one hour before recording any formal data.This prolonged ‘flush period’of each standard ensured that all transient memory effects dueto dilution, contamination, and surface sorption were eliminated. Once readings stabilised,10-minutes of data (ca 460 data points) were recorded and averaged. Standard deviations ofthe aggregate data were calculated to provide measurement uncertainties. In addition to theinstrument reported CO2 data, raw spectral peak absorption values were reconstructed (seesupporting material 1 and 3) to serve as principal measures for assessing the G2131-i, therebycircumventing any ambiguity created by inconsistencies in the internal calculations (see above). All the measurement and reconstructed data are collated in supporting material 3. Calibration strategy Conventional calibration of isotope ratio data involves adjustment of sample measuresagainst standards.s oof known.(or assumedisotopic values. Correctionsaregenerallyaccomplished by 1-point offsets or 2-point interpolations, and standards are chosen that are asclose as possible to unknown sample values.[31] The principal errors that calibrations of 8l3C-CO2 measuresusually addressare concentration dependence and instrument drift;22]unknown sample values are adjusted precisely, and final uncertainties typically derive frommeasurement precision rather than from uncertainties on standards.9 In the present study, we faced a different set of considerations.(i) Multiple standards withinexactly known compositions would not be utilised effectively by usual interpolationcalibrations. (ii) The standards were also intended to test for cross-talk in G2131-i spectralmeasurements. (iii) We aimed to deploy a single calibration model that would deliveraccuracy in both mole fraction and isotope ratio data across a broad range of 13c abundancesand xCO2 levels. As a first appraisal, we compared G2131-i reported CO2 data (i.e. measurements as per thefactory calibration) with PBE adjusted gravimetric standard data (Figure 2). While the factorycalibration of our G2131-i was accurate to the uncertainty tolerances of all standards in 83C-CO2 values (shown as Rco,, Figure 2c), there were significant residual errors in the x2C1602data (Figure 2b), and the x3cl602 data were entirely inaccurate (Figure 2a). To improve overall accuracy and data coherence, we implemented an alternative approachwhereby calibrations were applied only tox2C02 and x3C602 measurements, with 81c-CO and total-xC02 values being subsequently calculated from corrected measures.However., rather than performing independent calibrations, xl2c1602 and xl3cl602 werejointly corrected through an enlarged optimisation problem (a multi-component calibration)that incorporated all available data from the gravimetric standards and also accounted forvarying uncertainties on standard values. For the case of linear relationships between spectral peak heights and CO2 isotopologue molefractions, the primary calibration equations were as follows: x12c1602=(12rep+A12)· B12/wd_ratio (1) x13c1602=(13rep+A13)· B13/ wd_ratio (2) where 12rep and 13rep are the respective CH4-H2O-corrected spectral absorption peak heightsreportedforor12c16022 aand13c1602(respectivelytermed peak87 baseave specc aandpeak88_baseave_spec in the G2131-i data system, see supporting material 1), A12-B13 areempirical coefficients, and wd ratio is an ancillary H2O correction variable used by theG2131-i for adjusting xCO2 data to a dry mole fraction basis (i.e. the variable compensatesfor molar dilution caused by any water vapour present in samples; see supporting material 1Table S2, and also Rella27 and Hoffnaglel41] -if H2O mole fraction= 0 then wd_ratio =1).From these calibrated data, total-xC1602, the 13c/2C isotope ratio (Rco), and 813c-CO2values were calculated: Calibration coefficients (412, B12, A13, and B13) were found through weighted least squares(WLS) optimisation of Eqs. (1)-(4), with G2131-i measurements used as input data (12rep,13rep,wd ratio; supporting material 3) and PBE adjusted standard values (Table1)substituting the dependent variables in each equation (i.e. reverse regression). Residualweights were taken as the reciprocals of the summed variances resulting from the uncertainty on the relevant standard and the raw measurement’s standard deviation. This procedure wassimilar to the weighted total least squares analysis (cf. orthogonal regression) described byKrystek and Anton162] and used by Stowasser et al39] for CRDS calibration (we could notfully adopt that method as it only applies to simple linear regression). The weightingsallowed diverse data (i.e. mole fraction and isotope ratio) to be proportionally included into asingle analysis, and meant that a least squares solution would, on aggregate, calibrate themeasurements to within the uncertainties of each standard value (we considered a calibrationmodel to be ‘accurate’if all calibrated measures were within their respective uncertaintylimits, e.g. Figure 2a). The WLS solution was found with R (version 3.2.1)I63] using generalpurpose optimisation with the L-BFGS-B algorithml64] to yield the best-fit calibration for allavailable standard data(n=31). By examining residual errors in linear calibration, we assessed the presence of spectral cross-talk between 2CO2 and 1CO2. Expecting an interference from the R(10) 13c1602 transitionon2C02 measurements (see above, Figure 1), we postulated a generic relationship betweenthe ‘true’optical absorption peak height of the R(36) 12C02 transition (12true) and theinterference-affected G2131-i reported measurement (12rep): where f(z), g(z) are hypothetical functions of an unknown secondary variable z thatcharacterises spectral distortion on the 2CO2 measurement. With a suitable variable andfunction(s), Eq. (6) may be used to modify Eq. (1) and provide an interference correctingcalibration for x2c1602, which may then be optimised in the same manner as described for asimple linear model. Results and discussion WLS optimisation of the multi-component linear calibration model (Eqs. 1-4) yielded asimilar outcome to the factory configuration (Figure 3; coefficients in Table 2) except that theresultingx12c1602,x13c1602, and 813C-CO2 measurement data were internally self-consistent.Consequently, the calibratedx3c160,values were accuratethroughouitt thetestedcomposition range (<0.005 to 100 ppm x3C02) with all residuals falling within theuncertainty tolerances and no limit-of-linearity reached (Figure 3a). This is an importantdemonstration of G2131-i performance outside its specified operating envelope. On the otherhand, as with the factory-set calibration, a linear model was not accurate for x2C1602measurements. with sevvderal residualerrorssignificantly larger thantheaggregateuncertainties on standard compositions (Figure 3b). These small inaccuracies also gave rise toincorrect Rco,(Figure 3c) and total-xC02 data (not shown). To achieve accurate calibration,a different functional form was thus required for 2cO2 measurements. Non-linear calibration model Under a linear response model of optical absorption and molecular abundance, G2131-i measures forx2c02 were progressively reduced (under-measured) at higher levels of 3cOz(Figure 3b). This was contrary to our expectation that spectral overlap would lead tooverestimation in absorption peak height. We speculate that the origin of this phenomenon isa fitting artefact caused by imposing a single peak spectral model to ring-down measurementsof the 12c1602 spectral feature (a similar phenomenon is observed[33] from H2S interference on13co2). If our supposition is correct, because the R(10) 13c1602 transition lies at ashouldering wavenumber, it partly disrupts the baseline of the larger R(36) 12c1602 transition(e.g. Figure 1 inset). As a result, fitting a single peak spectral model to the overlappedspectrum raises the baseline and decreases the reported peak height. We were able toreproduce this outcome by testing Voigt and Galatry peak-fitting algorithms with constanthalf-width parameterS on simulated[44]spectra.However.observed measurementperturbations could not be characterised theoretically as details of the spectroscopic modelused in the G2131-i are not publicly available. Notwithstanding the lack of a precise spectroscopic correction or revision, we devised anempirical model approximating the observed deviations. Following our inference thatx12C1602 errorswere caused by the R(10) 13c02 absorption, residuals of the linearcalibration were examined against 13Cl602 mole fraction (Figure 4a). While a negativecorrelation was observed, considerable remaining variance indicated that the interference ismore complex than a linear adjustment. This is unsurprising given that a baseline aberrationis probably a function of the relative size of the interfering absorption as opposed to itsabsolute magnitude. Accordingly, comparing x2C02residuals with standard Rco, valuesrevealed a definite, albeit non-linear, relationship to the measurement errors (Figure 4b).Trialling numerous potential corrective formulae (smooth continuous functions with no morethan two parameters plus an intercept and no local inflections throughout the assessed CO2range), we found that an exponential relation of Rco, would fit the residual errors (dashedline, Figure 4b). We therefore developed an appropriate form for Eq. (6) using Rco, asvariable z: where C and D are constant terms. Using Eq. (7) to amend Eq. (1), and substitutingxl3c1602/12rep as a proxy for Rco,, an improved calibration equation for xl2c1602 was found: with Ci2 and D12 as additional coefficients that characterise the interference correction termand x3c602 being determined from Eq. (2). WLS optimisation of Eq. (8) together with Eqs.(2)-(4) resulted in a calibration model (Table2) where all measurement data (i.e.x2C02,x3C02, Rco,, and total-xC02) were within the uncertainties on the gravimetric values (Figure 5, and supporting material 3). Evaluation and application Despite 13CO2 interference, linear calibration of G2131-i x12cl602 measurements achievedreasonable accuracy in all the 13C-enriched standards that we tested (all relative residualerrors 0.67 %, averaging 0.32 %). However, these residual errors were larger than theresolutionafforded(lby the G2131-iand uncertaintiesongravimetric standards. Incompensating for the measures with a non-linear function of Rco, our revised calibrationmodel ensured that all the corrected x2C1602 values were within the combined uncertaintylimits of l3C-enriched standards (i.e. ≤0.15 %), and had a mean relative residual error of 0.04%(i.e. an 8-fold improvement on the linear model). In contrast, linear calibration ofxl3c1602 was accurate for all standards tested (irrespective ofwhich Co2 model-Eq. 1 or 8 - was used for optimisation), although the comparatively larger gravimetric uncertainties may have obscured small interferences or non-linearity. Therelative residual errors in the calibrated xl3c02 data averaged 0.40 % while the largestcorresponding uncertainty on the 13C-enriched gravimetric standards was 0.71 %. In terms of complete calibration efficacy, we reiterate that errors in x2c1602 data (when using linear calibration) also caused inaccuracy in Rco, and total-xC02 (Figure 3, andsupporting material 3). However, with the 13CO2 correction applied, the calibrated Rco, andtotal-xC02 data were accurate to the determined uncertainty limits on the gravimetricstandards (respective mean relative residuals errors of 0.37 % and 0.03 % while the largestuncertainty on the standards was 0.81 % for Rco, and 0.11% for total-xC02; see Table 1,and supporting material 2 and 3). All measurements of natural abundance CO2 standard airswere also accurate under the 13CO2 correction of xl2c1602. In comparison with conventionalcalibrations of CRDS isotope ratio measurements,[22, 31] our approach precluded the typicalissue of concentration dependence (accurate calibration in x2C1602 and x3c1602 eliminatedthe need for direct correction of 83C-CO2 values). In summary, our non-linear calibrationwas accurate with every gravimetric standard that we tested. Overall, the weighted residualsquare errors for the complete linear calibration model totalled 110.81, while applying thenon-linear correction on xl2c1602 reduced these to 8.82, thus giving our revised calibration acoefficient of partial determination (partialr-) of 0.92 against the linear approach (Table 2). To apply our calibration strategy to raw G2131-i measurement data (using either our non-linear model or a normal linear equation for 12CO2), a post-correction workbook is supplied(supporting material 4). While calibration constants may vary temporally and betweenindividual G2131-i analysers, given the minimal drift and inter-instrument consistencyobserved in other studies,[9, 22, 65] we expect that reasonable accuracy may be achieved by cautious application of our correction model to measurements of 13C-enriched CO2 samplesby other G2131-i units. In any case, the results and methods reported here are a template forG2131-i users and may be extended to other laser absorption instruments sharing the sameCO2 spectroscopy (e.g. Picarro G2201-i). Although our multi-component calibration improves upon conventional methods used forCRDS, we note that it is only relevant for measurements where both high accuracy CO2 molefraction and 8l3C-CO2 data are simultaneously required. G2131-i users unconcerned withsmall errors in xCO2 and 83C-CO2 at highC abundances will achieve acceptable accuracyusing simple linear calibration models. Furthermore, our non-linear correction to 12Co2measurements is unnecessary where G2131-i measurements cover only a narrow band of8C-Co2 values (e.g. natural abundance samples). This is because the correction termremains proportionally constant for a given value of Rco, irrespective of CO2 mole fraction(Eq. 7), and so linear calibration will be accurate when the 13c/2C isotope ratios of unknownsamples and calibration standards are similar. In addition, while the 12Co2 correction presented in this work fits all the tested gravimetricstandard data, the associated uncertainties mean that other mathematical functions (e.g.power, polynomial) could equally account for the observed measurements. A more extensiveinvestigation of G2131-i measurements at elevated levels ofCo2 is required to verify if ournegative exponential equation of Rco, (Eq. 7) accurately represents 13Co2 interference on theR(36)12C1602 transition, and hence determine whether a different correction function is moresuitable (particularly for CO2 compositions outside the range that we measured). We expectthat careful gas blending experiments employing dynamic mass flow control mixers such asthose used by Rella et al[28], Nara et al[58] and Friedrichs et al[29] will enable a more exact quantification of x2C02 measurement errors. From our calibration model we may derivethe expected distortion that 13CO addition causes on G2131-i measurements of 12CO2 (Fig.6)-a prediction that may be expressly tested by such blending experiments. CRDSissan increasingly popular and versatile method1 for the isotopic analysis cofatmospheric trace-gases. However, due to narrow separation between spectroscopic bands ofdifferent isotopologues, there is potential for cross-talk interferences in CRDS measurements.While not an issue for samples with natural abundance 13C, we found errors in the PicarroG2131-i isotopic-CO2 analyses of gravimetric standard gases highly enriched1 iinn 11:3c.Evidenced as under-measurement in x2C1602 (and therefore overestimation of 813C-CO2values), the observed errors were putatively caused by interference from a secondary 13c1602transition shouldering the primary 12Cl602 absorption. We suspect that spectroscopic overlapdistorts the baseline fitting of the spectral model used in the G2131-i, leading to under-estimation of xl2c1602 at elevated levels of 13co2 (conversely, xl3c1602 data were notaffected). If our conjecture is correct, redressing the principal source of x2CO2 error inG2131-i measurements should be possible by implementing a new spectral model ininstrument software or by shifting the spectroscopy to an unimpeded 12c1602 transition. In lieu of resolving the direct cause of the inaccuracies, a non-linear correction can be appliedtox2C02 measurements. By using a multi-component calibration strategy where molefraction and isotope ratios are jointly optimised against standards, G2131-i measurements canbe adjusted to provide accurate data across a wide range of CO2 compositions. Researcherscan directly implement or adapt our correction scheme using materials supplied in the supporting material. While our calibration model requires further validation, it neverthelessimprovesitthe measurement accuracy of 13C-enriched CO samples comparedwithhaconventional approach. In addition to the G2131-i analyser, these methods may be employedwith other isotopic-CO2 instruments that share the same spectroscopic architecture. Acknowledgements We acknowledge Lex van Leeuwen and Linde Gas Benelux B.V. for their service andcooperation in producing IC-enriched specialty gravimetric standard gases. We are gratefulto our colleagues Stijn Vandevoorde and Katja Van Nieuland for their assistance. RenatoWinkler and Nabil Saad from Picarro Inc. provided useful information and advice concerningthe spectroscopy of the G2131-i analyser. Finally, we thank three anonymous reviewerswhose comments helped improve this paper. Supporting information 1. Details of G2131-i datalog and measurement calculations 2.(Gravimetric standard calculations, uncertainties, and PBE calculations .RawV measurementit data, reconstructed data, linear calibrateddata, non-linear calibrated data 4. Dlata post-correction workbook References [1] A. O'Keefe, D. A. G. Deacon. Cavity ring-down optical spectrometer for absorptionmeasurements using pulsed laser sources. Rev. Sci. Instrum. 1988, 59,2544. [21 R. T. Jongma, M. G. H. Boogaarts, I. Holleman, G. Meijer. Trace gas detection withcavity ring down spectroscopy. Rev. Sci. Instrum. 1995,66,2821. T31 M.D. Wheeler, S. M. Newman, A. J. Orr-Ewing, M. N. R. Ashfold. Cavity ring-downspectroscopy. J. Chem. Soc., Faraday Trans. 1998, 94, 337. 41 H. Dahnke, D. Kleine, W. Urban, P. Hering, M. Mirtz. Isotopic ratio measurement ofmethane in ambient air using mid-infrared cavity leak-out spectroscopy.Appl. Phys. B2001,72,121. 5| E. R. Crosson, K. N. Ricci, B. A. Richman, F. C. Chilese, T. G. Owano, R. A.Provencal,M. W. Todd, J. Glasser, A. A. Kachanov, B. A. Paldus, T. G. Spence, R.N. Zare. Stable isotope ratios using cavity ring-down spectroscopy: Determination of13c/12C for carbon dioxide in human breath. Anal. Chem. 2002,74,2003. [6]1 E. R. T. Kerstel, R. Q. Iannone, M. Chenevier, S. Kassi, H. J. Jost, D. Romanini. Awater isotope (?H, 170, and 180) spectrometer based on optical feedback cavity-enhanced absorption for in situ airborne applications. Appl. Phys. B 2006, 85, 397. [7] E. M. Berryman, J. D. Marshall, T. Rahn, S. P. Cook, M. Litvak. Adaptation ofcontinuous-flow cavity ring-down spectroscopy for batch analysis of 813c of CO2 andcomparison with isotope ratio mass spectrometry. Rapid Commun. Mass Spectrom.2011,25,2355. 81 Picarro. WS-CRDS for Isotopes - Cost of Measurement Comparison with IRMS forLiquid Water, Picarro Inc., Sunnyvale, California, USA, 2009. [9] F. R. Vogel, L. Huang, D. Ernst, L. Giroux, S. Racki, D. E. J. Worthy. Evaluation of acavity ring-down spectrometer for in situ observations ofl3co2. Atmos. Meas. Tech.2013,6,301. [10] M.S. Torn, S. C. Biraud, C. J. Still, W. J. Riley,J. A. Berry. Seasonal and interannualvariability in 13c composition of ecosystem carbon fluxes in the US Southern GreatPlains. Tellus B2011,63,181. 111 D. Yakir, L. d. S. L. Sternberg. The use of stable isotopes to study ecosystem gasexchange.Oecologia 2000, 123,297. [12] W. Mook. 13C in atmospheric CO2. Neth. J. Sea Res. 1986, 20,211. [13] R. J. Francey, C. E. Allison, D. M. Etheridge, C. M. Trudinger, I. G. Enting, M.Leuenberger, R. L. Langenfelds, E. Michel, L. P. Steele. A 1000-year high precisionrecord of 8 C in atmospheric CO2. Tellus B 2011, 51, 170-191. [14]_1T. K. Bauska, D. Baggenstos, E. J. Brook, A. C. Mix, S. A. Marcott, V. V. Petrenko,H. Schaefer, J. P. Severinghaus, J. E. Lee. Carbon isotopes characterize rapid changesin atmospheric carbon dioxide during the last deglaciation. Proc. Natl. Acad. Sci. USA2016,113,3465. [15] A. Mix,N. Pisias, R. Zahn, W. Rugh, C. Lopez, K. Nelson. Carbon 13 in Pacific DeepandIntermediateWaters.0-3700 kka:Implicationsfor Ocean (Circulation2andPleistocene CO2. Paleoceanography 1991, 6,205. 16 S. S. Assonov, C. A. M. Brenninkmeijer, T. J. Schuck, P. Taylor. Analysis of 13c and180isotope data of CO2 in CARIBIC aircraft samples as tracers of uppertroposphere/lower stratosphere mixing and the global carbon cycle. Atmos. Chem.Phys.2010, 10,8575. [17] B. Galfond, D. Riemer, P. Swart. Analysis of signal-to-noise ratio of 813C-CO2measurements; at carbon capture, utilization and storage injection sites. Int. J.Greenhouse Gas Control 2015,42,307. [181 S. Krevor, J.-C. Perrin, A. Esposito, C. Rella, S. Benson. Rapid detection andcharacterization of surface CO2 leakage through the real-time measurement of 813csignatures in CO2 flux from the ground. Int. J. Greenhouse Gas Control 2010, 4,811. [19]T. H. Yang, E. Heinzle, C. Wittmann. Theoretical aspects of 13c metabolic fluxanalysis with sole quantification of carbon dioxide labeling. Comput. Biol. Chem.2005,29, 121. [201H. S. K. Snell, D. Robinson, A. J. Midwood. Minimising methodological biases toimprove the accuracy of partitioning soil respiration using natural abundance 13c.Rapid Commun. Mass Spectrom. 2014, 28, 2341. T211 F. Albanito, J. L. McAllister, A. Cescatti, P. Smith, D. Robinson. Dual-chambermeasurements of 8l3C of soil-respired CO2 partitioned using a field-based three end-member model. Soil Biol. Biochem. 2012,47,106. [22]J. Pang, X. Wen, X. Sun, K. Huang. Intercomparison of two cavity ring-downspectroscopy analyzers for atmospheric 13co2/2Co2 measurement. Atmos. Meas.Tech. 2016.9.3879. 1231 M. Becker, N. Andersen, B. Fiedler, P. Fietzek, A. Kortzinger, T. Steinhoff, G.Friedrichs. Using cavity ringdown spectroscopy for continuous nmonitoring of83C(CO2) and fCO2 in the surface ocean. Limnol. Oceanogr. Methods 2012, 10,752. [24] S. Eyer, B. Tuzson, M. E. Popa, C. van der Veen, T. Rockmann, M. Rothe, W. A.Brand, R. Fisher, D. Lowry, E. G. Nisbet, M. S. Brennwald, E. Harris, C. Zellweger,L. Emmenegger, H. Fischer, J.Mohn. Real-time analysis of 813C- and 8D-CH4 inambient air with laser spectroscopy: method development and first intercomparisonresults. Atmos. Meas. Tech. 2016,9,263. [25] C. Rella. Reduced drift, high accuracy stable carbon isotope ratio measurementsusing a reference gas with the Picarro 8Co2 G2101-igas analyzer, Picarro Inc.,Sunnyvale, California, USA, 2010. [261 E. H. Wahl, B. Fidric, C. W. Rella, S. Koulikov, B. Kharlamov, S. Tan, A. A.Kachanov, B. A. Richman, E. R. Crosson, B. A. Paldus, S. Kalaskar, D. R. Bowling.Applications of cavity ring-down spectroscopy to high precision isotope ratiomeasurement of 13C/2C in carbon dioxide. Isotopes Environ. Health Stud. 2006, 42,211. [27] C. Rella. Accurate stable carbon isotope ratio measurements in humid gas streamsusing the Picarro 8CO2 G2101-i gas analyzer, Picarro Inc., Sunnyvale, California,USA,2010. [281C. W. Rella, H. Chen, A. E. Andrews, A. Filges, C. Gerbig, J. Hatakka, A. Karion,N.L. Miles, S. J. Richardson, M. Steinbacher, C. Sweeney, B. Wastine, C. Zellweger.High accuracy measurements of dry mole fractions of carbon dioxide and methane inhumid air. Atmos. Meas. Tech. 2013, 6, 837. 1291 G. Friedrichs, J. Bock, F. Temps, P. Fietzek, A. Kortzinger, D. W. R. Wallace.Toward continuous monitoring of seawater 13co2/2CO2 isotope ratio and pCO2: Performance of cavity ringdown spectroscopy and gas matrix effects. Limnol.Oceanogr. Methods 2010, 8, 539. [30] L. A. Konopel’ko,V. V. Beloborodov, D.V. Rumyantsev, Y. K. Chubchenko, V. V.Elizarov. Metrological problems of gas analyzers based on wavelength-scanned cavityring-down spectroscopy. Opt. Spectrosc. 2015,118,1017. [311 X. F. Wen, Y. Meng, X. Y. Zhang, X. M. Sun, X. Lee. Evaluating calibrationstrategies for isotope ratio infrared spectroscopy for atmospheric 13co/12CO2measurement. Atmos.Meas. Tech. 2013, 6, 1491. [32] C. Rella. Accurate stable carbon isotope ratio measurements with rapidly varyingcarbon dioxide concentrations using the Picarro 8Co2 G2101-i gas analyzer,Picarro Inc., Sunnyvale, California, USA, 2010. [331 K. Malowany, J. Stix, A. Van Pelt, G. Lucic. H2S interference on CO2 isotopicmeasurements using a Picarro G1101-i cavity ring-down spectrometer.Atmos. Meas.Tech.2015,8,4075. [34] S. Bode, R. Fancy, P. Boeckx. Stable isotope probing of amino sugars - a promisingtool to assess microbial interactions in soils. Rapid Commun.Mass Spectrom. 2013,27,1367. [351 G. Tcherkez, R. Bligny, E. Gout, A. Mahe, M. Hodges, G. Cornic. Respiratorymetabolism of illuminated leaves depends on CO2 and O2 conditions. Proc. Natl.Acad. Sci. USA 2008,105,797. [36]A. J. Midwood, P. Millard. Challenges in measuring the 813C of the soil surface CO2efflux. Rapid Commun. Mass Spectrom. 2011,25, 232. [37] D. L. Phillips, J. W.Gregg. Uncertainty in source partitioning using stable isotopes.Oecologia 2001,127,171. [381 L. Galatry. Simultaneous Effect of Doppler and Foreign Gas Broadening on SpectralLines. Phys. Rev. 1961,122,1218. 391 C. Stowasser, A. D. Farinas, J. Ware, D. W. Wistisen, C. Rella, E. Wahl, E. Crosson,T.Blunier. A low-volume cavity ring-down spectrometer for sample-limitedapplications. Appl. Phys. B 2014, 116,255. 401 C. W. Rella, J. Hoffnagle, Y. He, S. Tajima. Local and regional scale measurementsof CH4, 83CH4, C2H6 in the Uintah Basin using a mobile stable isotope analyzer.Atmos. Meas. Tech. 2015,8,4539. [41]JJ. Hoffnagle. Understanding the G2131-i isotopic carbon dioxide data log, PicarroInc., Santa Clara, California, USA, 2015. [42]J. Hoffnagle. Understanding the data log created by the G1101-i/G2101-i/G2131-i/G2121-i/G2201-i isotopic carbon dioxide analyzers, Picarro Inc., Santa Clara,California, USA, 2015. [43] L. S. Rothman, I. E. Gordon, Y. Babikov, A. Barbe, D. Chris Benner, P. F. Bernath,M. Birk, L. Bizzocchi,V. Boudon, L. R. Brown, A. Campargue, K. Chance, E. A.Cohen, L. H. Coudert, V. M. Devi, B. J. Drouin, A. Fayt, J. M. Flaud, R. R. Gamache,J.J. Harrison, J. M. Hartmann, C. Hill, J. T. Hodges, D. Jacquemart, A. Jolly, J.Lamouroux, R. J. Le Roy, G. Li, D. A. Long, O. M. Lyulin, C. J. Mackie, S. T.Massie, S. Mikhailenko, H. S. P. Muller, O. V. Naumenko, A. V. Nikitin, J. Orphal,V. Perevalov, A. Perrin, E. R. Polovtseva, C. Richard, M. A. H. Smith, E. Starikova,K. Sung, S. Tashkun, J. Tennyson, G. C. Toon, V. G. Tyuterev, G. Wagner. TheHITRAN2012molecular spectroscopic database. J. Quant.Spectrosc.Radiat.Transfer 2013, 130, 4. HITRAN on the web. http://hitran.iao.ru, Accessed: 28 May 2016. R. A. Werner, W. A. Brand. Referencing strategies and techniques in stable isotoperatio analysis. Rapid Commun. Mass Spectrom.2001,15,501. [461 International Organization for Standardization. ISO 6142:2001 Gas analysisPreparationof calibration gas mixtures. InternationalOrganization forStandardization (ISO), Geneva, Switzerland, 2001. [47] JointCommittee for GuidesinIMetrology. JCGM100:2008 Evaluation(ofeasuremrent data - Guide to the expression of uncertainty in measurement,InternationalCommitteefotrorWeightsandMeasures(BIPM)/lInternationalElectrotechnical Commission (IEC) / International Federation of Clinical ChemistryandLaboratoryMedicine(IFCC) / InternationalLaboratory AccreditationCooperation (ILAC) / International Organizationfor Standardization (ISO))/International Union of Pure and Applied Chemistry (IUPAC) / International Union of Pure and Applied Physics (IUPAP)/ International Organization of Legal Metrology(OIML),2008. [48] J. Buldyreva, M. Chrysos. Semiclassical modeling of infrared pressure-broadenedlinewidths: A comparative analysis in CO2-Ar at various temperatures. J. Chem.Phys. 2001, 115,7436. [491 D. C. Benner, C. E. Miller, V. M. Devi. Constrained multispectrum analysis of CO2-Ar broadening at 6227 and 6348 cm-. Can. J.Phys. 2009,87,499. 501T. Hikida, K. M. T. Yamada. N2- and O2-broadening of CO2 for the (3001)III←(0000) band at 6231cm. J. Mol. Spectrosc. 2006, 239,154. [511 C. B. Suárez, F. P. Valero. Intensities, self-broadening, and broadening by Ar and N2for the 301 Ⅲ000 band of CO2 measured at different temperatures. J. Mol.Spectrosc. 1978, 71,46. [521 F. Thibault, B. Calil, J. Buldyreva, M. Chrysos, J. M. Hartmann, J. P. Bouanich.Experimental and theoretical CO2-Ar pressure-broadening cross sections and theirtemperature dependence. Phys. Chem. Chem. Phys. 2001,3, 3924. [531 R. R. Gamache, J.J. Lamouroux, A. L. Laraia, J.-M. FHartmann, C. Boulet.Semiclassical calculations of half-widths and line shifts for transitions in the 30012<00001 and 30013<00001 bands of CO2, I: Collisions with N2. J. Quant. Spectrosc.Radiat. Transfer 2012,113,976. [541 J..Lamouroux, R..R.. Gamache, A. L. Laraia, J Hartmann, C. Boulet.Semiclassical calculations of half-widths and line shifts for transitions in the 30012←00001 and 3001300001 bands of CO2 ⅡI: Collisions with O2 and air. J. Quant.Spectrosc. Radiat. Transfer 2012,113,991. [55] R. R. Gamache, J. Lamouroux. The vibrational dependence of half-widths of CO2transitions broadened by N2, O2, air, and CO2. J. Quant. Spectrosc. Radiat. Transfer2013,117,93. 1561 F. P. J. Valero, C. B. Suarez. Measurement at different temperatures of absoluteintensities, line half-widths, and broadening by Ar and N2 for the 3001II—0000 bandof CO2. J. Quant. Spectrosc. Radiat. Transfer 1978, 19, 579. 577 D. A. Long, L. Gameson, G. W. Truong, K. Bielska, A. Cygan, J. T. Hodges, J. R.Whetstone, R. D. van Zee. The Effects of Variations in Buffer Gas Mixing Ratios onCommercial Carbon Dioxide Cavity Ring-Down Spectroscopy Sensors. J. Atmos.Oceanic Technol.2013,30,2604. 581 H. Nara, H. Tanimoto, Y. Tohjima, H. Mukai, Y. Nojiri, K. Katsumata, C. W. Rella.Effect of air composition (N2, O2, Ar, and H2O) on CO2 and CH4 measurement bywavelength-scanned cavity ring-down spectroscopy: calibration and measurementstrategy. Atmos. Meas. Tech.2012,5,2689. [59] S. Nakamichi, Y. Kawaguchi, H. Fukuda, S. Enami, S. Hashimoto, M. Kawasaki, T.Umekawa, I. Morino, H. Suto, G. Inoue. Buffer-gas pressure broadening for the (30(0) 1)III <--(0 00) band of CO2 measured with continuous-wave cavity ring-downspectroscopy. Phys. Chem. Chem. Phys.2006,8, 364. 601 A. Predoi-Cross, W. Liu, C. Holladay, A. V. Unni, I. Schofield, A. R. W. McKellar,D. Hurtmans. Line profile study of transitions in the 30012<-00001 and 30013<00001 bands of carbon dioxide perturbed by air. J. Mol. Spectrosc. 2007,246,98. [61]A. Predoi-Cross, A. R. W. McKellar, D. C. Benner, V. M.Devi,R. R. Gamache, C. E.Miller, R. A. Toth, L. R. Brown. Temperature dependences for air-broadened Lorentzhalf-width and pressure shift coefficients in the 30013<00001 and 30012<00001bands of CO2 near 1600 nm. Can. J. Phys. 2009,87, 517. [621M. Krystek, M. Anton. A weighted total least-squares algorithm for fitting a straightline. Meas. Sci. Technol.2007,18,3438. [631 R Core Team. R: A Language Environment for Statistical Computing, R Foundationfor Statistical Computing, Vienna, Austria, 2015. [64])C. Zhu, R. H. Byrd, P. Lu, J. Nocedal. Algorithm 778: L-BFGS-B: Fortransubroutines for large-scale bound-constrained optimization. ACM Trans. Math. Softw.1997,23,550. [65T] C. Y. Kwok, O. Laurent, A. Guemri, C. Philippon, B. Wastine, C. W. Rella, C.Vuillemin, F. Truong, M. Delmotte, V. Kazan, M. Darding, B. Lebegue, C. Kaiser, I.Xueref-Remy, M. Ramonet. Comprehensive laboratory and field testing of cavityring-down spectroscopy analyzers measuring H2O, CO2,CH4 and CO. Atmos. Meas.Tech. 2015,8,3867. StandardID Gravimetric values c160212c1602 13c1602813C-CO2Rcoz XN2 xO2( ppm) (ppm) (ppm) (%o))** PBE adjustments12c1602 13c1602(ppm) (ppm) PBE corrected values (G2131-i apparent) c160212c1602 13c1602813c-CO2Rco2(ppm) (ppm) (ppm)(%) LE1 426.17 401.10 25.07 6.25 +45910.7896 0.2099±0.18 ±0.19 ±0.14 ±0.04 ±31 -0.80 -0.04±0.07 ±0.02 425.33 400.30 25.03 6.25 +4594 ±0.26 ±0.26 ±0.16 ±0.04 ±36 LE2 497.64 397.49 100.15 25.20 +21536 0.7901 0.2094±0.43 ±0.51 ±0.62 ±0.18 ±163 -0.83 -0.16±0.07 ±0.08 496.65 396.66 99.99 25.21 +21547 ±0.52 ±0.58 ±0.71 ±0.20 ±181 TT 1049.42 999.50 49.92 4.99 +34670.7893 0.2097±0.25 ±0.27 ±0.25 ±0.03 ±23 -2.01 -0.08±0.18 ±0.04 1047.33 997.49 49.84 5.00 +3469±0.43 ±0.45 ±0.30 ±0.03 ±27 HE1 2048.41 2023.00 25.41 1.256 +123.60.7872 0.2107±0.27 ±0.26 ±0.02 ±0.001 ±1.1 -3.68 -0.04±0.33 ±0.02 2044.69 2019.31 25.38 1.257 +124.1 ±0.60 ±0.59 ±0.04 ±0.002 ±2.0 HE2 2102.64 2002.92 99.72 4.98 +34530.7872 0.2107±0.42 ±0.47 ±0.51 ±0.03 ±23 -3.66 -0.14±0.33 ±0.08 2098.84 1999.26 99.58 4.98 +3455 ±0.76 ±0.80 ±0.59 ±0.03 ±27 NA1 490 484.4 5.22 1.0780' -35.8'ambient airf ±5 ±4.8 ±0.05 ±0.0003 ±0.3 - As per gravimetric values: no PBE adjustment asbackground gas compositions were that of ambient airf NA2 1024 1013 11.0 1.0875' -27.3'ambient airf±10 ±10 ±0.1 ±0.0003 ±0.3 - ZERO <0.10 <0.10 <0.005 - - ambient airf - **613C-CO2 values are reported against VPDBI45]IRMS value*xN2=0.781,x02=0.209,xAr=0.010 (from Friedrichs et al.129]) ( T able 1 . Composition data of standards used for calibrating the G2131-i. Details of the PBE (pressure broadening effect) adjustmentsare set out in Supporting Information 2 (see also text).±values denote uncertainties resulting from gravimetric preparation,PBEadjustment, and their combination (except for the Rco,and 813C-CO2 data for standards NA1 and NA2 where their ± values are the IRMS measurement uncertainties). ) Calibration model Model parameters xl2co2 (Eq.1 or 8) A12 B12 C12 D12 x13co2(Eq. 2)A13 B13 Total weighted Partial residual squares WLS solution -0.618 1.6661 - - -0.020 0.6291 110.81 n/a x12CO2 linear (Eq.1) Oxygen isotopecorrected solution * -0.618 1.6742 - - -0.020 0.6323 Standard error onparameter estimate 0.015 0.0002 一 0.004 0.0002 WLS solution -0.639 1.677 0.0095 -6.32 -0.020 0.6280 8.82 0.92 x2CO2 non-linear Oxygenisotope (Eq.8) corrected solution * -0.639 1.685 0.0095 -6.29 -0.020 0.6310 Standard error onparameter estimate 0.015 0.002 0.0010 1.25 0.004 0.0003 :*The WLS solution was adjusted so calibrated data include all isotopologues of 12CO2 and 13CO2, not only the 12C1602 and 13C1602 directly measured by CRDS. The ratio of CO2/C1602at natural abundance 170 and 180 is 1.004878 Table 2. Results from weighted least squares (WLS) optimisation of calibration models applied to G2131-i measurements of standardgases. o Figure 1. HITRAN[3 generated spectral simulations of CO2 in air (0.184 atm, 318.15 K) across theG2131-i measurement region. Totalabsorption spectra for naturall abundance and equimolarcompositions of CO2 isotopolouges are presented (each normalised to 100 ppm 12C1602), with transitionintensities and centres overlaid. Shaded columns indicate the G2131-i scanning ranges for the R(12)13C1602 and R(36) 12C1602 bands (bold labels, respectively centred at 6151.315 and 6151.760 cm1). Aclose-up (inset) of the R(36)12C1602 spectral region illustrates the potential for interference from theshouldering R(10) 13C1602 transition (arrow, main plot;6251.716 cm-1) at high fractions of 13co’(equimolar composition shown). Note the logarithmic and linear y-axes. 0.00 0.05 0.10 0.15 0.20 0.25 Rco,(co/2co2) Figure 2. Relative errors of G2131-i measurements (raw reported values) of standard gases for (a) x13C1602, (b)x12C160, and (c) 13C/12C isotope ratio (Rco2). Error bars denote the combined uncertainty ofthe PBE adjusted gravimetric standard value and measurement precision. Figure 3. Residual errors from applying a linear calibration model (Eq. 1-4) to G2131-i spectralmeasurements of standard gases for (a)x13C1602, (b)x12C160, and (c) 13C/12C isotope ratio (Rc02). Errorbars denote 1the combined uncertainty of the PBE adjusted gravimetric value and measurementprecision. Figure 4. Residual errors in x12CO2 from the linear calibration model (Fig. 3b) as a function of gravimetricvalues of (a) x13C1602 mole fraction and (b) 13C/12C isotope ratio (Rcoz). Error bars denote the combined1uncertainty of the PBE adjusted gravimetric value and measurement precision. Dashed lines denote leastsquares fitted functions. Data from standards NA1, NA2, and ZERO omitted for clarity. o Rco,(co/2co2) Figure 5. Residual errors from applying the WLS optimised non-linear calibration model (Eq. 2-4, 8) toG2131-i spectral measurements of standard gases for (a) x13C1602,(b)x23C1602, and (c) 13C/12C isotoperatio (Rco2). Error bars denote the combined uncertainty of the PBE adjusted gravimetric value andmeasurement precision. xO (x13c160, actual-x13c1602 natural, ppm) Figure 6. Predicted effect on 12CO2 measurements from varying x13C1602 when using a G2131-i CRDSanalyser linearly calibrated by CO2 standards with natural isotope abundances (i.e. Rco2≈ RvPDB). Excessx13C1602 is the increase in x13C1602 compared to the natural abundance level that corresponds to the12CO2 mole fraction. Derived from comparing our non-linear calibration (Eqs.7, 8) to an ordinary linearmodel (Eq. 1), addition of 13CO2 (e.g. 13C-enrichment) is predicted to decrease the reported CRDSmeasurement due to interference on the baseline of the 12CO spectral feature. Actual measurements ofour 13C-enriched standards (Table 1) are overlaid (square symbols, labelled) to indicate the parameterspace covered by our calibration (error bars are the PBE adjusted gravimetric uncertainties). This article is protected by copyright. All rights reserved. HITRAN[43] generated spectral simulations[44] of CO2 in air (0.184 atm, 318.15 K) across theG2131-i measurement region. Total absorption spectra for natural abundance and equimolar compositions of CO2 isotopolouges are presented (each normalised to 100 ppm 12C16O2), with transition intensities and centres overlaid. Shaded columns indicate the G2131-i scanning ranges for the R(12) 13C16O2 and R(36) 12C16O2 bands (bold labels, respectively centred at 6151.315 and 6151.760 cm-1). A close-up (inset) of the R(36) 12C16O2 spectral region illustrates the potential for interference from the shouldering R(10) 13C16O2 transition (arrow, main plot; 6251.716 cm-1) at high fractions of 13CO2(equimolar composition shown). Note the logarithmic and linear y-axes.
确定
还剩33页未读,是否继续阅读?

产品配置单
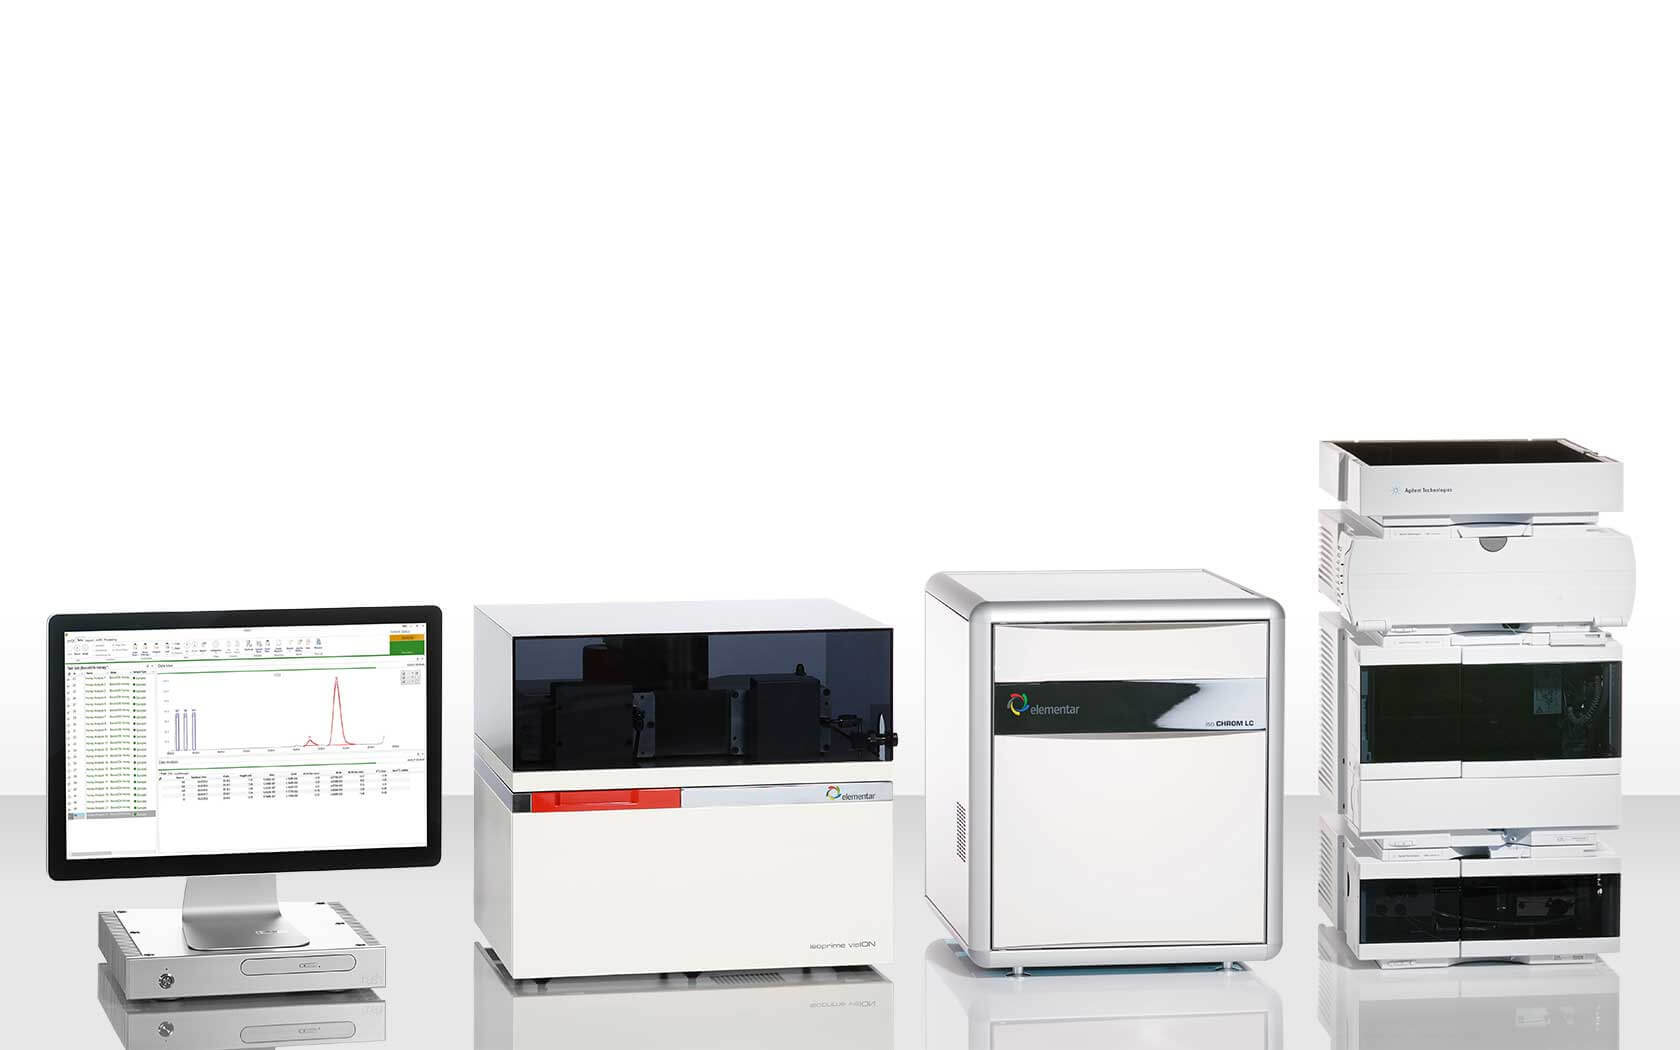
北京世纪朝阳科技发展有限公司为您提供《大气中二氧化碳检测方案(多气体分析仪)》,该方案主要用于空气中分子态无机污染物检测,参考标准--,《大气中二氧化碳检测方案(多气体分析仪)》用到的仪器有Picarro G2131-i 高精度CO2碳同位素和气体浓度分析仪
推荐专场
相关方案
更多
该厂商其他方案
更多