


未来几十年,北冰洋的持续变暖预计将引发106吨甲烷的释放,这些甲烷来自于浅海大陆架上融化的海底永冻层和上部大陆架斜坡上甲烷水合物的分解。在小于100米水深的浅层大陆架,海底释放的甲烷可能会进入大气,并可能加剧全球变暖。另一方面,对二氧化碳(CO2)的生物吸收有可能抵消释放甲烷的正升温潜力,这一过程尚未得到完全证实。在斯瓦尔巴边缘的一个浅层沸腾甲烷渗出区收集的连续海气通量数据显示,大气二氧化碳吸收率(-33300±7900μmol m-2·d-1)是周围水域的两倍,比扩散海气甲烷流出量(17.3±4.8μmol m−2·d−1)高约1900倍。从二氧化碳吸收中预期的逆向变化趋势比从甲烷排放中预期的正向趋势高出231倍。地表水特征(例如,高溶解氧、高ph值和CO2中13C的富集)表明,来自海底附近的富营养冷水上升流伴随着甲烷的排放,并通过浮游植物的光合作用刺激二氧化碳的消耗。这些发现挑战了人们一直以来的观点,即以浅水甲烷渗漏和/或海-气甲烷通量强烈升高为特征的区域总是增加全球大气温室气体排放的负担。
方案详情

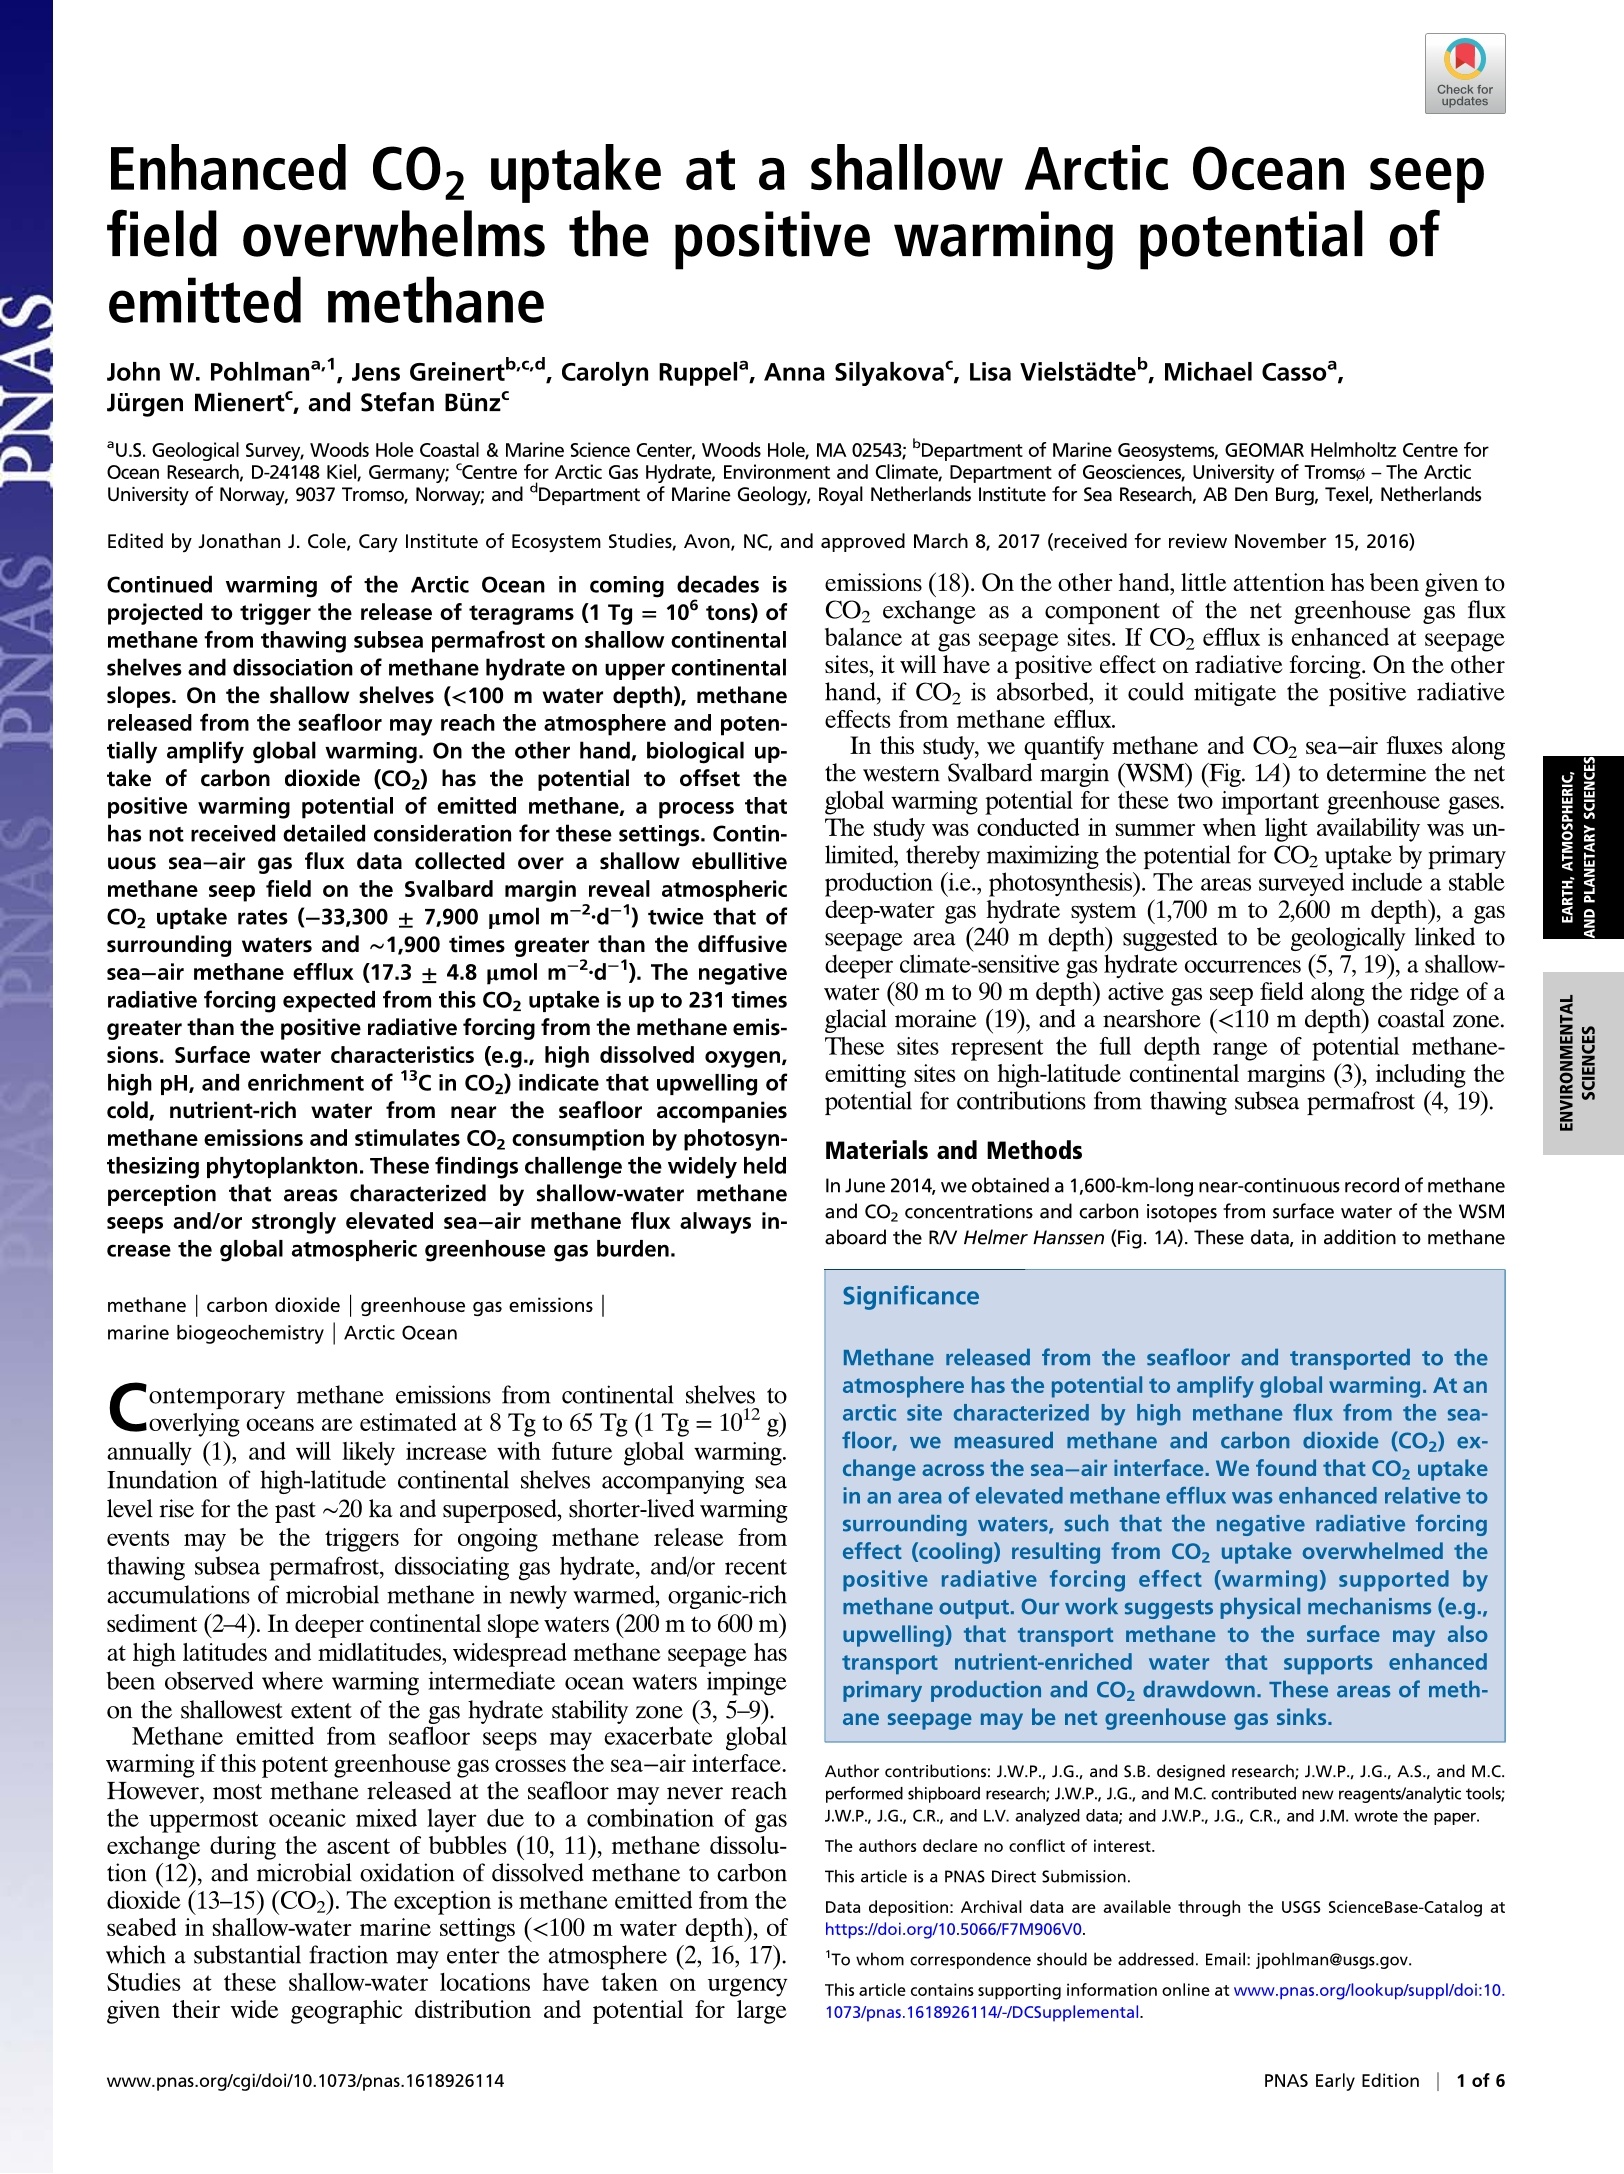
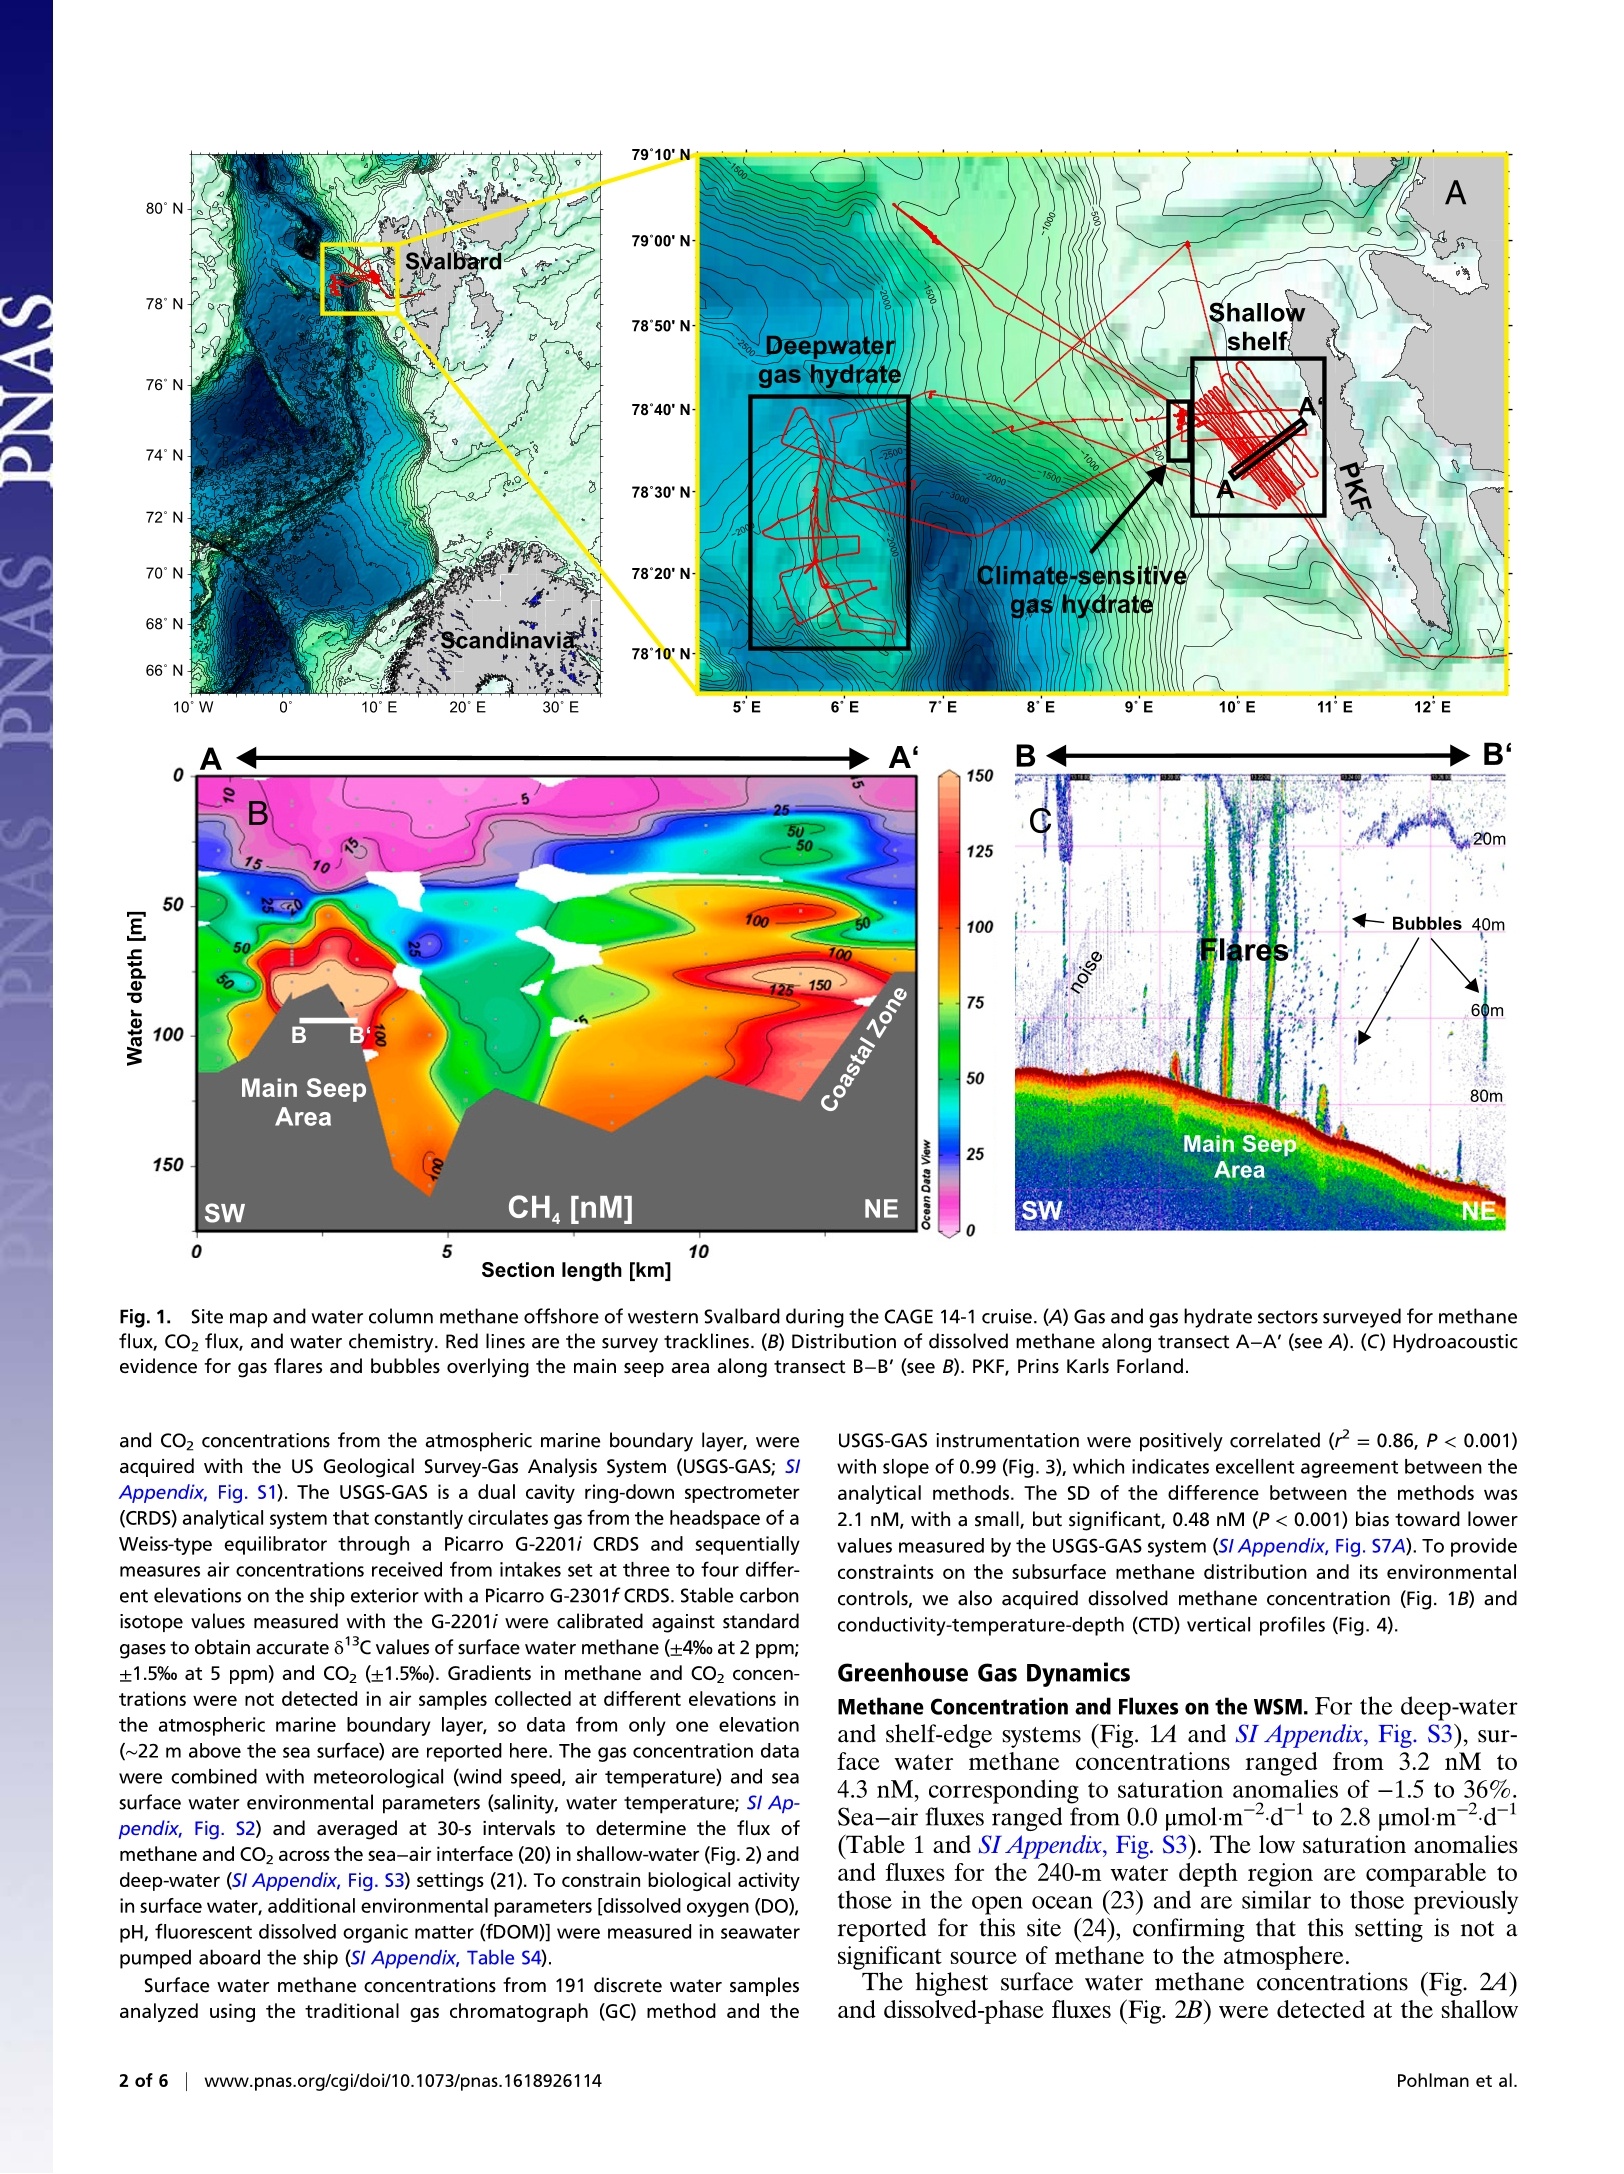
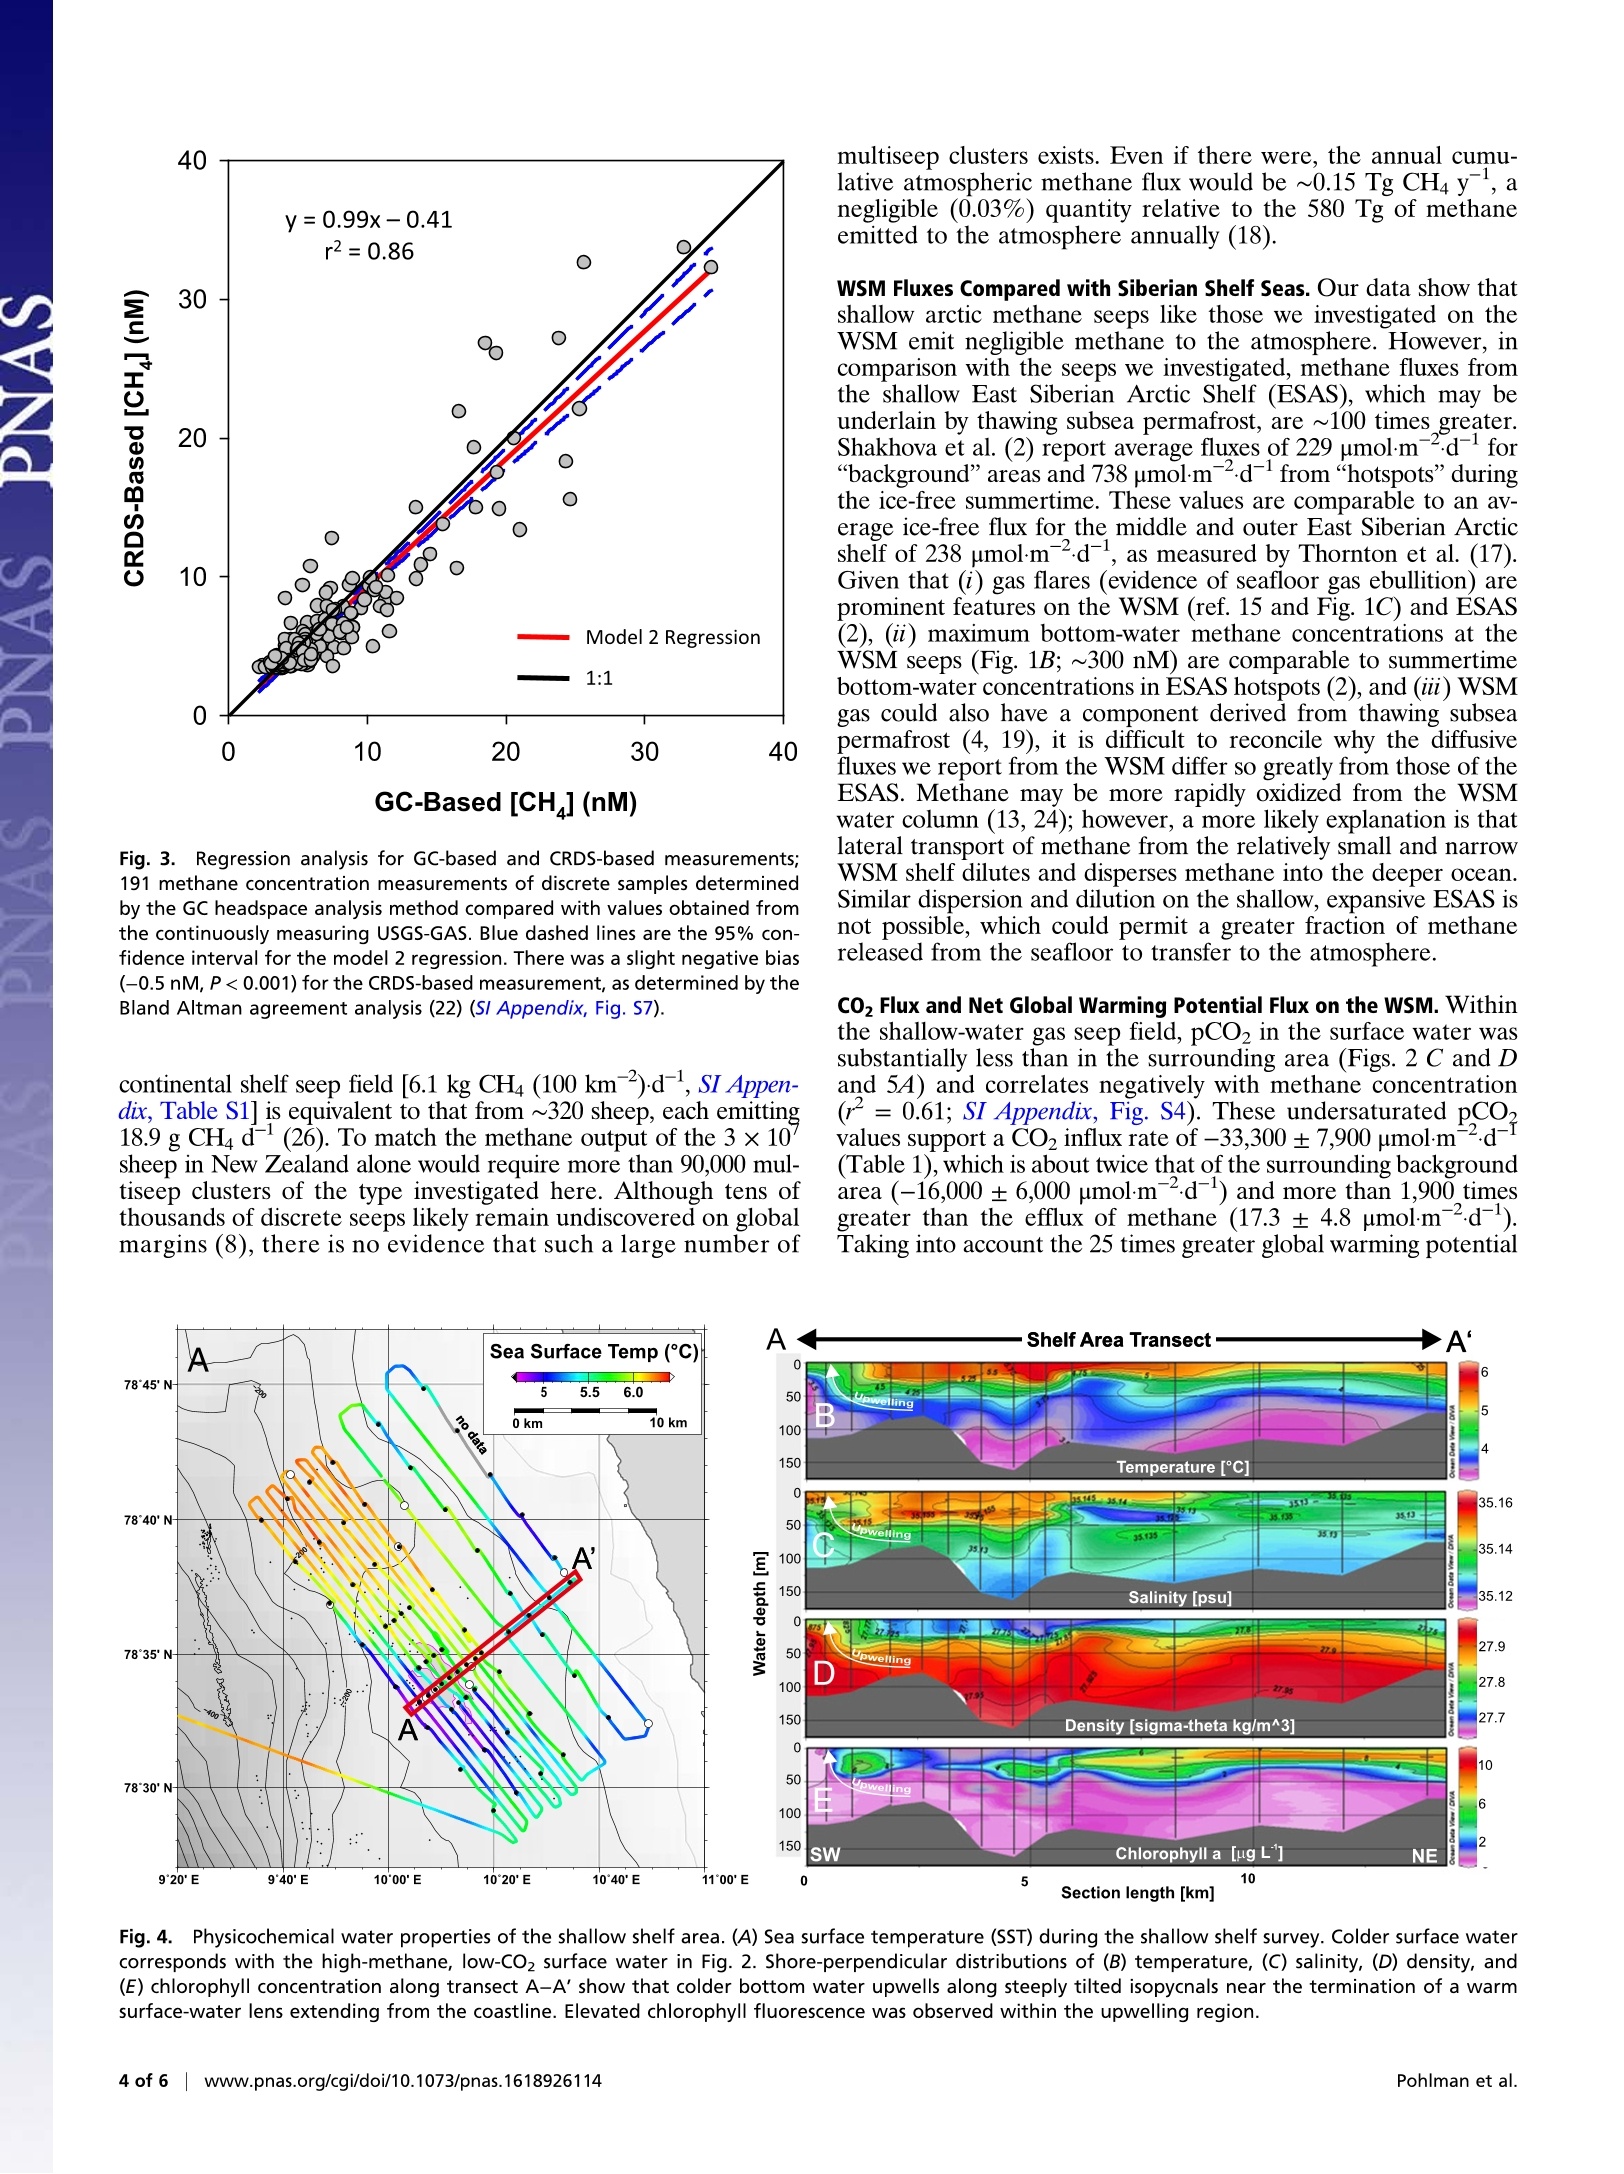
Enhanced CO2 uptake at a shallow Arctic Ocean seepfield overwhelms the positive warming potential ofemitted methane John W. Pohlmana1, Jens Greinertb.c.d, Carolyn Ruppel, Anna Silyakova, Lisa Vielstadte, Michael Casso,Jurgen Mienert ,and Stefan Bunz U.S. Geological Survey, Woods Hole Coastal & Marine Science Center, Woods Hole, MA 02543; Department of Marine Geosystems,GEOMAR Helmholtz Centre forOcean Research, D-24148 Kiel, Germany; Centre for Arctic Gas Hydrate, Environment and Climate, Department of Geosciences, University of Tromsp -The ArcticUniversity of Norway, 9037 Tromso, Norway; and "Department of Marine Geology, Royal Netherlands Institute for Sea Research, AB Den Burg, Texel, Netherlands Edited by Jonathan J. Cole, Cary Institute of Ecosystem Studies, Avon, NC, and approved March 8, 2017 (received for review November 15, 2016) Continued warming of the Arctic Ocean in coming decades isprojected to trigger the release of teragrams (1 Tg = 10 tons) ofmethane from thawing subsea permafrost on shallow continentalshelves and dissociation of methane hydrate on upper continentalslopes. On the shallow shelves (<100 m water depth), methanereleased from the seafloor may reach the atmosphere and poten-tially amplify global warming. On the other hand, biological up-take of carbon dioxide (CO2) has the potential to offset thepositive warming potential of emitted methane, a process thathas not received detailed consideration for these settings. Contin-uous sea-air gas flux data collected over a shallow ebullitivemethane seep field on the Svalbard margin reveal atmosphericCO2 uptake rates (-33,300±7,900 umol m-d-1) twice that ofsurrounding waters and ~1,900 times greater than the diffusivesea-air methane efflux (17.3 ± 4.8 umol m-.d-1). The negativeradiative forcing expected from this CO2 uptake is up to 231 timesgreater than the positive radiative forcing from the methane emis-sions. Surface water characteristics (e.g., high dissolved oxygen,high pH, and enrichment of 13C in CO2) indicate that upwelling ofcold, nutrient-rich water from near the seafloor accompaniesmethane emissions and stimulates CO2 consumption by photosyn-thesizing phytoplankton. These findings challenge the widely heldperception that areas characterized by shallow-water methaneseeps and/or strongly elevated sea-air methane flux always in-crease the global atmospheric greenhouse gas burden. methane| carbon dioxide| greenhouse gas emissionsmarine biogeochemistryArctic Ocean ontemporary methane emissions from continental shelves tooverlying oceans are estimated at 8 Tg to 65 Tg (1 Tg=102g)annually (1), and will likely increase with future global warming.Inundation of high-latitude continental shelves accompanying sealevel rise for the past ~20 ka and superposed, shorter-lived warmingevents may be the triggers for ongoing methane release fromthawing subsea permafrost, dissociating gas hydrate, and/or recentaccumulations of microbial methane in newly warmed, organic-richsediment (2-4). In deeper continental slope waters (200 m to 600 m)at high latitudes and midlatitudes, widespread methane seepage hasbeen observed where warming intermediate ocean waters impingeon the shallowest extent of the gas hydrate stability zone (3, 5-9). Methane emitted from seafloor seeps may exacerbate globalwarming if this potent greenhouse gas crosses the sea-air interface.However,most methane released at the seafloor may never reachthe uppermost oceanic mixed layer due to a combination of gasexchange during the ascent of bubbles (10, 11), methane dissolu-tion (12), and microbial oxidation of dissolved methane to carbondioxide (13-15) (CO2). The exception is methane emitted from theseabed in shallow-water marine settings (<100 m water depth), ofwhich a substantial fraction may enter the atmosphere (2, 16,17).Studies at these shallow-water locations have taken on urgencygiven their wide geographic distribution and potential for large emissions (18). On the other hand, little attention has been given toCO2 exchange as a component of the net greenhouse gas fluxbalance at gas seepage sites. If CO efflux is enhanced at seepagesites, it will have a positive effect on radiative forcing. On the otherhand, if CO2 is absorbed, it could mitigate the positive radiativeeffects from methane efflux. In this study, we quantify methane and CO2 sea-air fluxes alongthe western Svalbard margin (WSM) (Fig. 14) to determine the netglobal warming potential for these two important greenhouse gases.The study was conducted in summer when light availability was un-limited, thereby maximizing the potential for CO2 uptake by primaryproduction (i.e., photosynthesis). The areas surveyed include a stabledeep-water gas hydrate system (1,700 m to 2,600 m depth), a gasseepage area (240 m depth) suggested to be geologically linked todeeper climate-sensitive gas hydrate occurrences (5, 7, 19), a shallow-water (80 m to 90 m depth) active gas seep field along the ridge of aglacial moraine (19), and a nearshore (<110 m depth) coastal zone.These sites represent the full depth range of potential methane-emitting sites on high-latitude continental margins (3), including thepotential for contributions from thawing subsea permafrost (4, 19). Materials and Methods In June 2014, we obtained a 1,600-km-longnear-continuous record of methaneand CO2 concentrations and carbon isotopes from surface water of the WSMaboard the RN Helmer Hanssen (Fig. 1A). These data, in addition to methane Significance Methane released from the seafloor and transported to theatmosphere has the potential to amplify global warming. At anarctic site characterized by high methane flux from the sea-floor, we measured methane and carbon dioxide (CO2) ex-change across the sea-air interface. We found that CO2 uptakein an area of elevated methane efflux was enhanced relative tosurrounding waters, such that the negative radiative forcingeffect (cooling) resulting from CO2 uptake overwhelmed thepositive radiative forcing effect (warming) supported bymethane output. Our work suggests physical mechanisms (e.g.,upwelling) that transport methane to the surface may alsotransport nutrient-enriched water that supports enhancedprimary production and CO2 drawdown. These areas of meth-ane seepage may be net greenhouse gas sinks. ( A uthor contributions: J.W.P., J.G., and S.B. d esigned r e search; J . W.P., J . G., A.S., and M.C. p erformed shipboard research; J.W.P., J.G., and M.C. contributed new reagents/analytic tools; J.W.P., J.G., C.R., and L.V. analyzed d a ta; and J.W.P., J. G ., C.R., a n d J. M . wrote the paper. ) The authors declare no conflict of interest. This article is a PNAS Direct Submission. ( Data deposition: A rchival d ata are available t hrough the USGS ScienceBase-Catalog at h tt ps: //do i.o r g /10.506 6/ F7M9 0 6V0 . ) B B150 20m 125 100 Bubbles 40m Hlares 75 esion 60m 50 80m 25 Main Seep Area SW NE Section length [km] Fig. 1. Site map and water column methane offshore of western Svalbard during the CAGE 14-1 cruise. (A) Gas and gas hydrate sectors surveyed for methaneflux, CO2 flux, and water chemistry. Red lines are the survey tracklines. (B) Distribution of dissolved methane along transect A-A'(see A). (C) Hydroacousticevidence for gas flares and bubbles overlying the main seep area along transect B-B' (see B). PKF, Prins Karls Forland. and CO2 concentrations from the atmospheric marine boundary layer, wereacquired with the US Geological Survey-Gas Analysis System (USGS-GAS; SIAppendix, Fig. S1). The USGS-GAS is a dual cavity ring-down spectrometer(CRDS) analytical system that constantly circulates gas from the headspace of aWeiss-type equilibrator through a Picarro G-2201i CRDS and sequentiallymeasures air concentrations received from intakes set at three to four differ-ent elevations on the ship exterior with a Picarro G-2301fCRDS. Stable carbonisotope values measured with the G-2201i were calibrated against standardgases to obtain accurate 813C values of surface water methane (±4%o at 2 ppm;±1.5%o at 5 ppm) and CO2(±1.5%o). Gradients in methane and CO2 concen-trations were not detected in air samples collected at different elevations inthe atmospheric marine boundary layer, so data from only one elevation(~22 m above the sea surface) are reported here. The gas concentration datawere combined with meteorological (wind speed, air temperature) and seasurface water environmental parameters (salinity, water temperature; SI Ap-pendix, Fig. 52) and averaged at 30-s intervals to determine the flux ofmethane and CO2 across the sea-air interface (20) in shallow-water (Fig. 2) anddeep-water (SI Appendix, Fig. S3) settings (21). To constrain biological activityin surface water, additional environmental parameters [dissolved oxygen(DO),pH, fluorescent dissolved organic matter (fDOM)] were measured in seawaterpumped aboard the ship (SI Appendix, Table S4). Surface water methane concentrations from 191 discrete water samplesanalyzed using the traditional gas chromatograph (GC) method and the USGS-GAS instrumentation were positively correlated(r= 0.86, P <0.001)with slope of 0.99 (Fig.3), which indicates excellent agreement between theanalytical methods. The SD of the difference between the methods was2.1 nM, with a small, but significant, 0.48 nM (P <0.001) bias toward lowervalues measured by the USGS-GAS system (SI Appendix, Fig. S7A). To provideconstraints on the subsurface methane distribution and its environmentalcontrols, we also acquired dissolved methane concentration (Fig. 1B) andconductivity-temperature-depth (CTD) vertical profiles (Fig. 4). Greenhouse Gas Dynamics Methane Concentration and Fluxes on the WSM. For the deep-waterand shelf-edge systems (Fig. 14 and SI Appendix, Fig. S3), sur-face water methane concentrations ranged from 3.2 nM to4.3 nM, corresponding to saturation anomalies of -1.5 to 36%.Sea-air fluxes ranged from 0.0 pmol-m-.d-to 2.8 pmol-m--d-1(Table 1 and SI Appendix, Fig. S3). The low saturation anomaliesand fluxes for the 240-m water depth region are comparable tothose in the open ocean (23) and are similar to those previouslyreported for this site (24), confirming that this setting is not asignificant source of methane to the atmosphere. The highest surface water methane concentrations (Fig. 24)and dissolved-phase fluxes (Fig. 2B) were detected at the shallow Fig.2. Surface water methane and CO2 concentration and flux at the shallow shelf site. (A) Methane concentration, (B) methane flux, (C)CO2 concentration,and (D) CO2 flux. Individual seep locations are indicated by small black dots. The main area of gas seepage containing multiple seeps is outlined with a solidpink line. Larger black dots located along the survey lines are the CTD hydrocast locations. White circles along the track line represent 6-h time intervalsduring the survey. The flux maps are partitioned into seep and coastal zones for the mass flux calculations in Table 1. The seaward limit of the coastal zone isbounded by the 110-m isobath. Within the seep zone, areas of high methane efflux and COz influx (note negative values in the legend) are focused near themain seep area. SI Appendix, Fig. S3 contains flux maps for the climate-sensitive and deep-water gas hydrate areas. continental shelf site (“Shallow shelf’ in Fig. 14), where gasbubbles emanate from a seep field on a glacial moraine at 80 m to90 m water depth (Fig. 1C) and dissolved methane is releasedfrom the adjacent nearshore coastal zone seafloor (<110 m waterdepth). The median flux from more than 7,000 averaged intervals(30 s) for the shallow shelf was 3.9 umolm2d-, which is similarto a median value of 3.5 umolmd-calculated from hydrocastsamples collected from 10 m water depth (25). In the seep field,methane concentrations ranged from 3.4 nM to 10.8 nM (Fig. 2A),representing an 8 to 235% saturation anomaly and supporting asea-air flux of 0.1 umol-m-2.d-l to31.8 umol-m2.d-(Fig. 2Band Table 1). Where the diffusive sea-air methane flux exceeded 10 umol-m-2.d- in the seep field (“high-flux”region in Table 1),values average 17.3± 4.8 umolmd-, almost 9 times greaterthan the background flux of 2.0 ± 1.9 pumol-m-.d-1 (Table 1).Methane concentrations in the nearshore coastal zone rangedfrom 3.2 nM to 11.0 nM (Fig. 2A), with corresponding sea-airfluxes of 0.1 umolm-2.d- to 28.7 umolm-2.d(Fig. 2B andTable 1). Gridded and normalized to an area of 100 km’, the daily sea-air methane flux from each area ranged from 0.5 kg to 8.8 kg per100 km, with highest values in the nearshore (SI Appendix,Table S1). In the context of a well-constrained global atmosphericmethane source (e.g., ruminants), the flux from the shallow-water Fig.3. Regression analysis for GC-based and CRDS-based measurements;191 methane concentration measurements of discrete samples determinedby the GC headspace analysis method compared with values obtained fromthe continuously measuring USGS-GAS. Blue dashed lines are the 95% con-fidence interval for the model 2 regression. There was a slight negative bias(-0.5 nM, P<0.001) for the CRDS-based measurement, as determined by theBland Altman agreement analysis (22) (SI Appendix, Fig. S7). continental shelf seep field [6.1 kg CH4 (100 km)-d, SI Appen-dix, Table S1]is equivalent to that from ~320 sheep, each emitting18.9 g CH4 d(26). To match the methane output of the 3 ×10'sheep in New Zealand alone would require more than 90,000 mul-tiseep clusters of the type investigated here. Although tens ofthousands of discrete seeps likely remain undiscovered on globale1margins (8), there is no evidence that such a large number of multiseep clusters exists. Even if there were, the annual cumu-lative atmospheric methane flux would be ~0.15 Tg CH4 y, anegligible (0.03%) quantity relative to the 580 Tg of methaneemitted to the atmosphere annually (18). WSM Fluxes Compared with Siberian Shelf Seas. Our data show thatshallow arctic methane seeps like those we investigated on theWSM emit negligible methane to the atmosphere. However, incomparison with the seeps we investigated, methane fluxes fromthe shallow East Siberian Arctic Shelf (ESAS), which may beunderlain by thawing subsea permafrost, are ~100 times greater.Shakhova et al.(2) report average fluxes of 229 umolm dfor“background"areas and 738 umolmdfrom"hotspots” duringthe ice-free summertime. These values are comparable to an av-erage ice-free flux for the middle and outer East Siberian Arcticshelf of 238 umolmd, as measured by Thornton et al. (17).Given that (i) gas flares (evidence of seafloor gas ebullition) areprominent features on the WSM (ref. 15 and Fig. 1C) and ESAS(2), (ii) maximum bottom-water methane concentrations at theWSM seeps (Fig. 1B; ~300 nM) are comparable to summertimebottom-water concentrations in ESAS hotspots (2), and (iii) WSMgas could also have a component derived from thawing subseapermafrost (4, 19), it is difficult to reconcile why the diffusivefluxes we report from the WSM differ so greatly from those of theESAS. Methane may be more rapidly oxidized from the WSMwater column (13, 24); however, a more likely explanation is thatlateral transport of methane from the relatively small and narrowWSM shelf dilutes and disperses methane into the deeper ocean.Similar dispersion and dilution on the shallow, expansive ESAS isnot possible, which could permit a greater fraction of methanereleased from the seafloor to transfer to the atmosphere. C02 Flux and Net Global Warming Potential Flux on the WSM. Withinthe shallow-water gas seep field, pCO2 in the surface water wassubstantially less than in the surrounding area (Figs. 2 C and Dand 5A) and correlates negatively with methane concentration(r=0.61; SI Appendix, Fig. S4). These undersaturated pCO?values support a CO2 influx rate of -33,300±7,900 umolmd-(Table 1), which is about twice that of the surrounding backgroundarea (-16,000±6,000 umolm d-) and more than 1,900 timesgreater than the efflux of methane (17.3±4.8 umolmd).Taking into account the 25 times greater global warming potential Section length [km] Fig. 4. Physicochemical water properties of the shallow shelf area. (A) Sea surface temperature (SST) during the shallow shelf survey. Colder surface watercorresponds with the high-methane, low-CO2 surface water in Fig. 2. Shore-perpendicular distributions of (B) temperature, (C) salinity, (D) density, and(E) chlorophyll concentration along transect A-A' show that colder bottom water upwells along steeply tilted isopycnals near the termination of a warmsurface-water lens extending from the coastline. Elevated chlorophyll fluorescence was observed within the upwelling region. Table 1..Methane and CO, fluxes for areas investigated in thisstudy Survey CHa flux CO2 flux Setting area (km) (umol-m.d-1) (umolm-2.d-l) Shallow shelf seep field All 150.5 3.8±5.5 -18,037±8,464 High flux* 17.6 17.3±4.8 -33,317±7,927 Background 132.9 2.0±1.9 -16,017±6,152 Nearshore coastal zone 38.7 5.5±6.5 -24,944±17,818 Deep shelf seeps 11.5 0.30±0.26 -2,166±1,117 Deep-water gas hydrate 112 1.05±0.61 -42,001±24,528 See SI Appendix, Table S1 for additional site summary details.*High flux defined as areas with CH4 flux > 10 umol·m-.d1. of methane relative to CO2 for a 100-y timescale on a per unitmass basis (18), the strongly negative CO flux at the seep offsetsthe positive effect of methane expelled by a factor of 231 despitemethane’s greater global warming potential. Even on a 25-ytimescale, for which methane has stronger GWP of 84 (18), thecooling effect of CO2 uptake is 69 times greater than methane’swarming effect. Our comparisons consider only the dissolvedphase gas fluxes. However, hydroacoustic imaging (Fig. 1C) andbubble modeling (SI Appendix, Fig. S84) suggest minimal directbubble transport to the atmosphere. Furthermore, a recent studyfrom the ESAS suggesting that turbulence-driven diffusivemethane flux (not ebullition) is the primary transport mechanismfor sea-air methane flux (17) supports our assessment thatbubble transport of methane to the atmosphere is not importantat this setting. Stimulation of CO2 Uptake over Shallow-Water Methane Seeps. Atleast two processes could be responsible for the reduced concen-trations of CO2 observed over the shallow-water methane seeps: (i)Methane bubbles ascending from the seafloor dissolve methane,strip CO2 from the water column, and transport this CO2 to thesea-air interface and release it to the atmosphere (12), or (ii) aphysical and/or biological mechanism stimulates photosynthesis,and thus CO2 drawdown, above the seep area. To test the firsthypothesis, we applied a numerical bubble-stripping model (12).Reproducing the low CO2 concentrations requires (i) bubble diam-eters of 14 mm, which is much larger than the most frequent di-ameter of ~6 mm (range 2 mm to 16 mm) observed in the area (27),and (ii) a volumetric gas flux of 34 Lmminfrom the seabed at90 m (~13.6 mol/min, at 4℃), compared with reported values of3mLminto 41 mLmin per seep at 385 m (5.4 mmol/min to74.5 mmol/min, at 4℃) (19). Bubble stripping is therefore not aplausible mechanism for removing CO2. The alternate hypothesis for lower surface-water pCO2 is thatupwelling of cold, nutrient-rich water stimulated CO2 assimila-tion by phytoplankton, a phenomenon also observed in areas ofstrong upwelling associated with eastern boundary currents ofmajor ocean basins (28). Surface water within the high-methane,low-CO2 seep area was 0.65℃ colder than the surroundingsurface water (Figs. 44 and 5C and SI Appendix, Table S1), andthe estimated 8C of the seabed-sourced methane measured atthe sea surface (-54.6%o; SI Appendix, Methane Isotopic MassBalance for Determination of Seabed) was similar to that reportedat the seafloor(29) and emanating from seeps downslope (19).We are therefore confident the cold and methane-rich surfacewater originated from near the seafloor close to the seep area.Furthermore, CO2 uptake rates we measured (2,200 umol·m-d- to 42,000 umol-m-2.d-1; Table 1) are comparable to primaryproduction rates reported from nearby Kongsfjorden (30) (600jumolm-2.d-to 184,000 pumolm.d-), confirming the plausibilitythat phytoplankton-related processes altered the surface waterCO2 budget. A possible subsurface manifestation of high surfaceproductivityiiss that benthic chlorophyll and phaeopigment concentrations at this seep were the highest among nine stationsinvestigated in the western Svalbard-Barents Sea region (31). Upwelling on the WSM shelf is driven by Ekman transport duringnortherly or onshore wind events that can occur during any season(32). On a smaller scale, the topographically steered SpitsbergenPolar Current encountering the high-relief glacial moraine may up-well locally along steeply tilted isopycnals (Fig. 4D). Bubble-drivenbuoyancy and entrainment of bottom waters may also transportbottom water to the photic zone from depths as great as 1,000 m(33), a mechanism invoked to explain elevated surface-water chlo-rophyll above a Gulf of Mexico hydrocarbon seep (34). The rela-tively low seafloor methane flux at the WSM seep sites between240 m and 385 m water depth (19) renders it unlikely that bubble-associated buoyancy caused the upwelling, supporting the assump-tion that physical oceanographic processes alone are responsible forupwelling, independent of the presence of gas seepage. Regardless of the upwelling mechanism, multiple lines of ev-idence support the interpretation that primary production andconsequent CO2 drawdown are enhanced where methane-charged bottom water emerges: (i) Chlorophyll-fluorescence,a proxy for photosynthesis, is elevated (Fig. 4E); (ii) DO, aproduct of photosynthesis, is ~1 mg/L higher in surface waterswith high methane and low CO2 concentrations (Fig. 5D); (iii )pH, which increases when CO2 is removed from solution by photo-synthesis, is elevated by as much as 0.6 units compared with back-ground (Fig. 5D); and (iv) 8-C-CO2, a metric that becomes more Fig. 5.SSurface water time series data for the shallow shelf survey. (A)Dissolved methane concentration and pCO2;(B)813C-CHa and 81c-CO2;(C)SST temperature [dark green, hull-mounted sensor; light green, EXO2 sensor(YSI Incorported)] and fDOM; and (D) pH and DO. Seep crossings (high-lighted with gray bars) are characterized by colder water containing ele-vated concentrations of 13C-depleted methane and lower concentrations ofc-enriched COz. Isotopic excursions are demarcated by dashed lines thatconnect 81C values from the margins of the seep crossings. Within the seepcrossings, fDOM,pH, and DO are elevated. The combined evidence suggestsupwelling of cold, methane-charged (and presumably nutrient-rich) bottomwater originating from the seep-stimulated phytoplankton activity in thesurface water that enhanced the consumption of CO2. Similar trends occurwithin the nearshore coastal zone. positive when algae preferentially remove "Co2 during photosyn-thesis, is 13c-enriched (more positive) by as much as 2% within theupwelling area of methane-charged bottom water (Fig.5B). Despite the spatiotemporal coincidence between high concen-trations of methane and enhanced CO2 uptake at seeps on theWSM continental shelf (Fig.5A) and in some other settings such asthe Santa Barbara Basin seep field (36), we suggest that highmethane concentrations are an indicator of, but not a necessarycondition for, enhanced CO2 drawdown. Instead, the surface-watermethane observed on the WSM is a chemical tracer for cold,nutrient-rich upwelled water that supports enhanced photosynthesiswithin the euphotic zone. A relationship of higher methane effluxand CO2 influx that correlated with colder surface waters wasalso observed near the >2,000-m deep-water gas hydrate site (SIAppendix, Fig. S5). This observation suggests enhanced CO2drawdown is likely to occur whenever deep nutrient-rich (andperhaps methane-charged) waters are upwelled to the surface,and conditions for photosynthesis are suitable. 1. Hovland M, Judd AG, Burke RA (1993) The global flux of methane from shallowsubmarine sediments. Chemosphere 26:559-578. 2. Shakhova N, et al. (2010) Extensive methane venting to the atmosphere from sedi-ments of the East Siberian Arctic Shelf. Science 327:1246-1250. 3. Ruppel CD, Kessler JD (2017) The interaction of climate change and methane hy-drates. Rev Geophys 55(1):126-168. 4. Portnov A, Vadakkepuliyambatta S, Mienert J, Hubbard A (2016) Ice-sheet-drivenmethane storage and release in the Arctic. Nat Commun 7:10314. 5. Westbrook GK, et al. (2009) Escape of methane gas from the seabed along the WestSpitsbergen continental margin. Geophys Res Lett 36:L15608. 6. Ferre B, Mienert J, Feseker T (2012) Ocean temperature variability for the past60 years on the Norwegian-Svalbard margin influences gas hydrate stability on hu-man time scales. J Geophys Res-Oceans 117:C10017. 7. Berndt C, et al. (2014) Temporal constraints on hydrate-controlled methane seepageoff Svalbard. Science 343:284-287. 8. Skarke A, Ruppel C, Kodis M, Brothers D, Lobecker E (2014) Widespread methaneleakage from the sea floor on the northern US Atlantic margin. Nat Geosci7:657-661. 9. Phrampus BJ, Hornbach MJ, Ruppel CD, Hart PE (2014) Widespread gas hydrateinstability on the upper U.S. Beaufort margin. JGeophys Res Solid Earth 119:8594-8609. 10. McGinnis DF, Greinert J, Artemov Y, Beaubien SE, Wuest A (2006) Fate of risingmethane bubbles in stratified waters: How much methane reaches the atmosphere?J Geophys Res-Oceans 111:C09007. 11. Rehder G, Leifer l, Brewer PG, Friederich G, Peltzer ET (2009) Controls on methanebubble dissolution inside and outside the hydrate stability field from open ocean fieldexperiments and numerical modeling. Mar Chem 114:19-30. 12. Vielstadte L, et al. (2015) Quantification of methane emissions at abandoned gaswells in the Central North Sea. Mar Pet Geol 68:848-860. 13. Steinle L, et al.(2015) Water column methanotrophy controlled by a rapid oceano-graphic switch. Nat Geosci 8:378-382. 14. Kessler JD, et al. (2011) A persistent oxygen anomaly reveals the fate of spilledmethane in the deep Gulf of Mexico. Science 331:312-315. 15. Ward BB, Kilpatrick KA, Novelli PC, Scranton MI (1987) Methane oxidation and methanefluxes in the ocean surface layer and deep anoxic waters. Nature 327:226-229. 16. Shakhova N, et al. (2014) Ebullition and storm-induced methane release from the EastSiberian Arctic Shelf.Nat Geosci 7:64-70. 17. Thornton BF, Geibel MC, Crill PM, Humborg C, Morth CM (2016) Methane fluxes fromthe sea to the atmosphere across the Siberian shelf seas. Geophys Res Lett 43:5869-5877. 18. Intergovernmental Panel on Climate Change (2013) Climate Change 2013: ThePhysical Science Basis. Contribution of Working Group / to the Fifth AssessmentReport of the Intergovernmental Panel on Climate Change (Cambridge Univ Press,Cambridge,UK). 19. Sahling H, et al.(2014) Gas emissions at the continental margin west of Svalbard:Mapping, sampling, and quantification. Biogeosciences 11:6029-6046. Methane seepage from high-latitude shallow continental marginsis an atmospheric methane source (2) that could become moresubstantial as the climate continues to warm. Evidence that thecooling potential from CO influx at this shallow-water arcticmethane seep overwhelms the greenhouse warming potential fromthe emitted methane suggests that methane seeps can neverthelessbe net sinks for climate-forcing gases. If the sedimentary efflux ofnutrients that support photosynthesis is related to methane dis-charge intensity from the seafloor, a positive feedback betweenaccelerated methane release from the seafloor and amplified at-mospheric warming may be offset by atmospheric CO2 drawdown.Further investigation of sea-air greenhouse gas fluxes at methaneseep sites where upwelling-driven outputs are counteracted byphotosynthetic CO2 drawdown (including light-limited wintertimeconditions) would provide data to constrain which processes areresponsible for enhanced CO2 uptake, quantify net greenhouse gasfluxes globally for shallow-water methane seepage areas, and de-termine if accelerated seafloor methane release will be offset byenhanced CO2 uptake at the sea-air interface in the future. ACKNOWLEDGMENTS. E. Bergeron, E. Moore, and P. Bernard at the USGScontributed engineering and logistical expertise that led to the successful com-pletion of this project. We thank Andrea Bodenbinder and Mario Veloso fromGEOMAR for providing technical assistance. J.W.P., C.R., aIDnd M.C. were supportedby the USGS and interagency agreements DE-FE0002911 and DE-FE0005806 withthe US Department of Energy.A.S., J.M., and S.B., as well as R/ Helmer Hanssencruise costs, were supported by University of Tromsp -The Arctic University ofNorway and the Research Council of Norway. The research is part of the Centrefor Arctic Gas Hydrate, Environment and Climate and was supported by theofResearch Council of Norway through its Centres of Excellence funding schemeGrant 223259. Any use of trade names is for descriptive purposes and does notimply endorsement by the US government. 20. Wanninkhof R (1992) Relationship between wind speed and gas exchange over theocean. J Geophys Res-Oceans 97:7373-7382. 21. Wanninkhof R, Asher WE, Ho DT, Sweeney C, McGillis WR (2009) Advances inquantifying air-sea gas exchange and environmental forcing. Annu Rev Mar Sci 1:213-244. 22. Bland JM, Altman DG (1986) Statistical methods for assessing agreement betweentwo methods of clinical measurement.Lancet 1:307-310. 23. Tilbrook BD, Karl DM (1995) Methane sources, distributions and sinks from Californiacoastal waters to the oligotrophic North Pacific gyre. Mar Chem 49:51-64. 24. Graves CA, et al. (2015) Fluxes and fate of dissolved methane released at the seafloorat the landward limit of the gas hydrate stability zone offshore western Svalbard.J Geophys Res-Oceans 120:6185-6201. 25. Myhre CL, et al. (2016) Extensive release of methane from Arctic seabed west ofSvalbard during summer 2014 does not influence the atmosphere. Geophys Res Lett43:4624-4631. 26. Lassey KR, Ulyatt MJ, Martin RJ, Walker CF, Shelton ID (1997) Methane emissionsmeasured directly from grazing livestock in New Zealand. Atmos Environ 31:2905-2914. 27. Veloso M, Greinert J, Mienert J, De Batist M (2015) A new methodology for quanti-fying bubble flow rates in deep water using splitbeam echosounders: Examples fromthe Arctic offshore NW-Svalbard. Limnol Oceanogr Methods 13:267-287. 28. Capone DG, Hutchins DA (2013) Microbial biogeochemistry of coastal upwelling re-gimes in a changing ocean. Nat Geosci 6:711-717. 29. Damm E, Schauer U, Rudels B, Haas C (2007)Excess of bottom-released methane in anArctic shelf sea polynya in winter. Cont Shelf Res 27:1692-1701. 30. Piwosz K, Pernthaler J (2010) Seasonal population dynamics and trophic role ofplanktonic nanoflagellates in coastal surface waters of the Southern Baltic Sea.Environ Microbiol 12:364-377. 31. Astrom EKL, Carroll ML, Ambrose WG, Carroll J (2016) Arctic cold seeps in marinemethane hydrate environments: impacts on shelf macrobenthic community structureoffshore Svalbard. Mar Ecol Prog Ser 552:1-18. 32. Nilsen F, Skogseth R, Vaardal-Lunde J, Inall M (2016) A simple shelf circulation model: Intrusion of Atlantic water on the West Spitsbergen shelf. JPhys Oceanogr 46:1209-1230.33. Leifer l, Jeuthe H, Gjosund SH, Johansen V (2009) Engineered and natural marine seep, bubble-driven buoyancy flows. J Phys Oceanogr 39:3071-3090. 34. D'Souza NA, et al. (2016) Elevated surface chlorophyll associated with natural oilseeps in the Gulf of Mexico.Nat Geosci 9:215-218. 35. Damm E, Kiene RP, Schwarz J, Falck E, Dieckmann G (2008) Methane cycling inArctic shelf water and its relationship with phytoplankton biomass and DMSP.Mar Chem 109:45-59. 36. Du M, et al. (2014) High resolution measurements of methane and carbon dioxide insurface waters over a natural seep reveal dynamics of dissolved phase air-sea flux.Environ Sci Technol 48:10165-10173. www.pnas.org/cgi/doi/pnas.of PNAS Early Edition of Pohlman et al.www.pnas.org/cgi/doi/pnas.
确定


还剩4页未读,是否继续阅读?

产品配置单

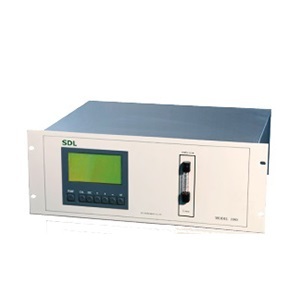
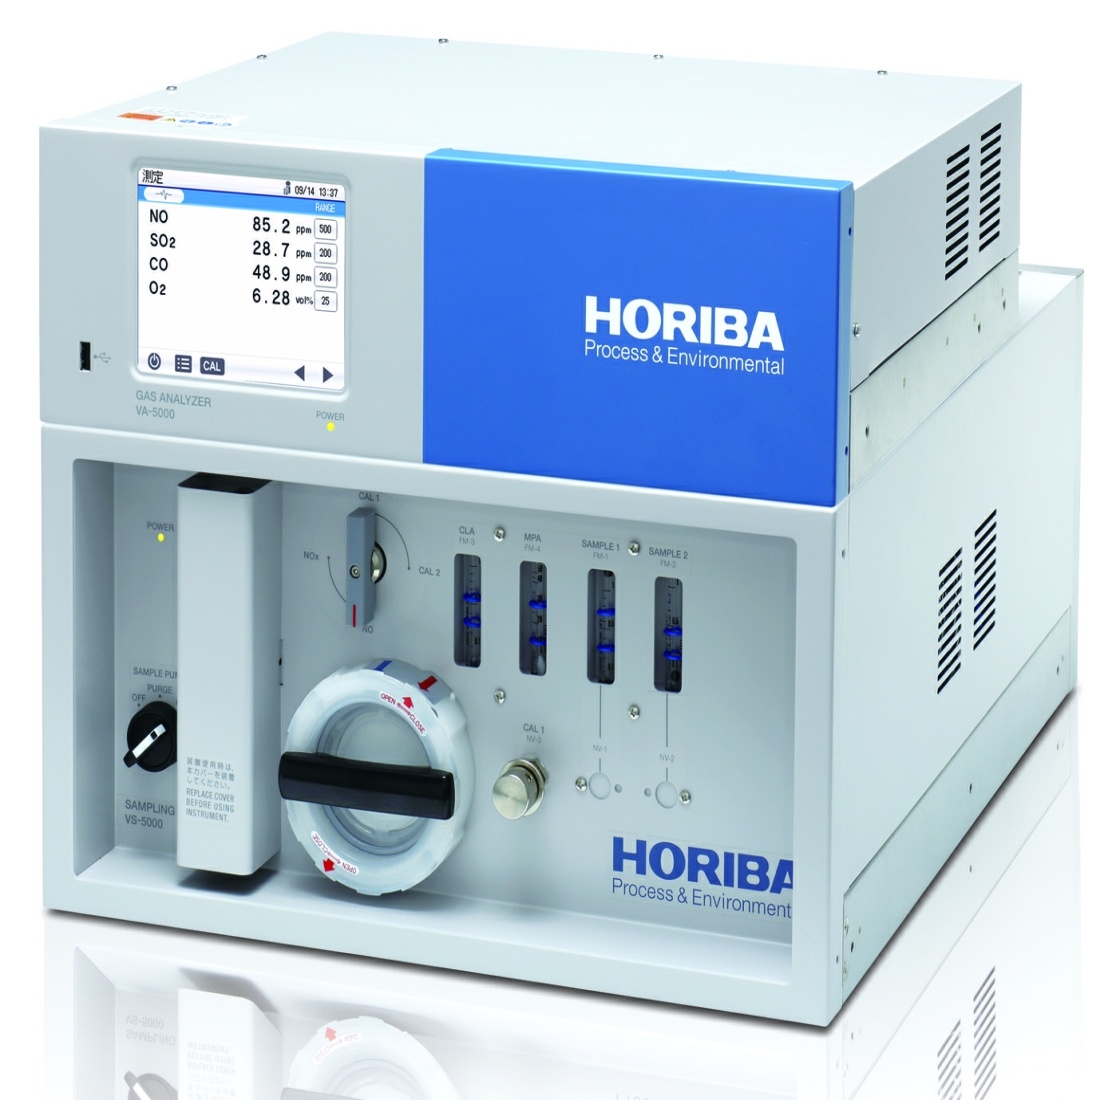
北京世纪朝阳科技发展有限公司为您提供《大气中二氧化碳、甲烷检测方案(多气体分析仪)》,该方案主要用于废气中分子态无机污染物检测,参考标准--,《大气中二氧化碳、甲烷检测方案(多气体分析仪)》用到的仪器有Picarro高精度温室气体分析仪G2301(CO2/CH4/H2O)、Picarro G2201-i 高精度CO2/CH4碳同位素及气体分析仪
推荐专场
相关方案
更多
该厂商其他方案
更多