当前位置:
仪器信息网
>
行业应用
>
预防类生物药品检测方案
>
单克隆抗体及其片段(Monoclonal Antibodies and Their Fragments)中凝胶排阻层析(Size-Exclusion Chromatography Coupled)检测方案(液相色谱仪)


方案详情
文
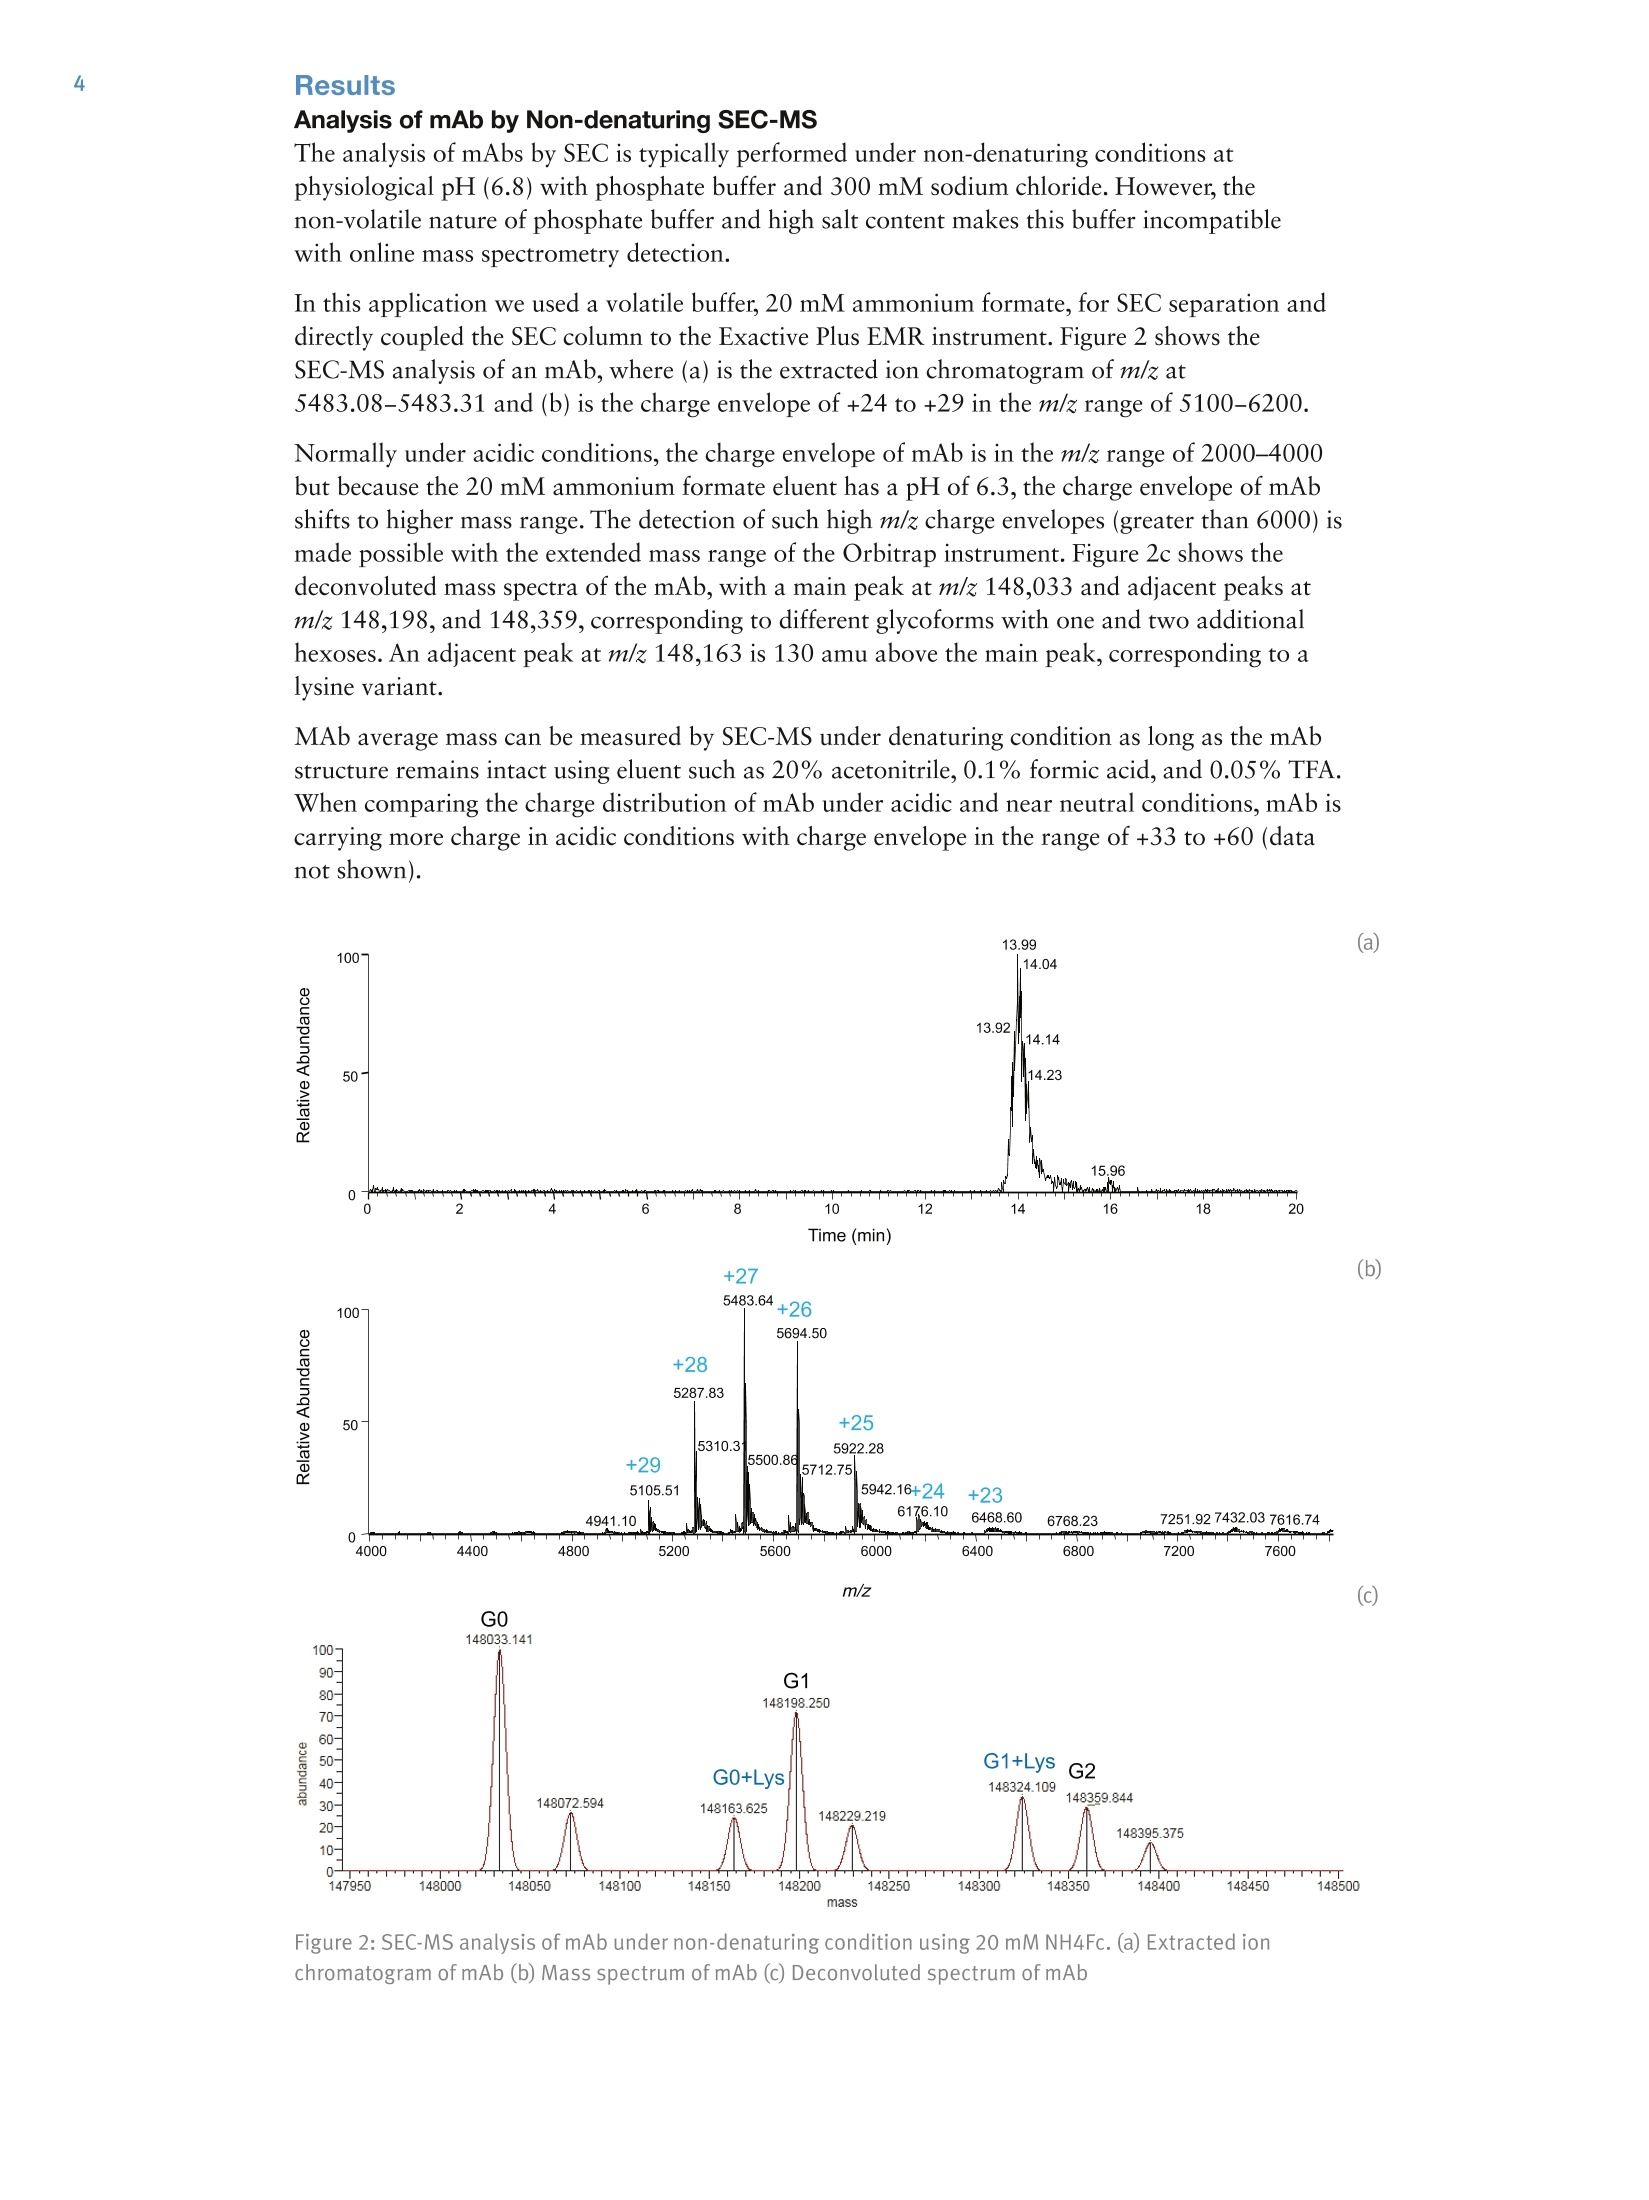
The biopharmaceutical industry continues to increase its focus on the development of biotherapeutic monoclonal antibody (mAbs) drugs. Early in the development of recombinant mAbs, a large number of harvest cell culture (HCC) samples must be screened for IgG titer,aggregations, and charge variants.
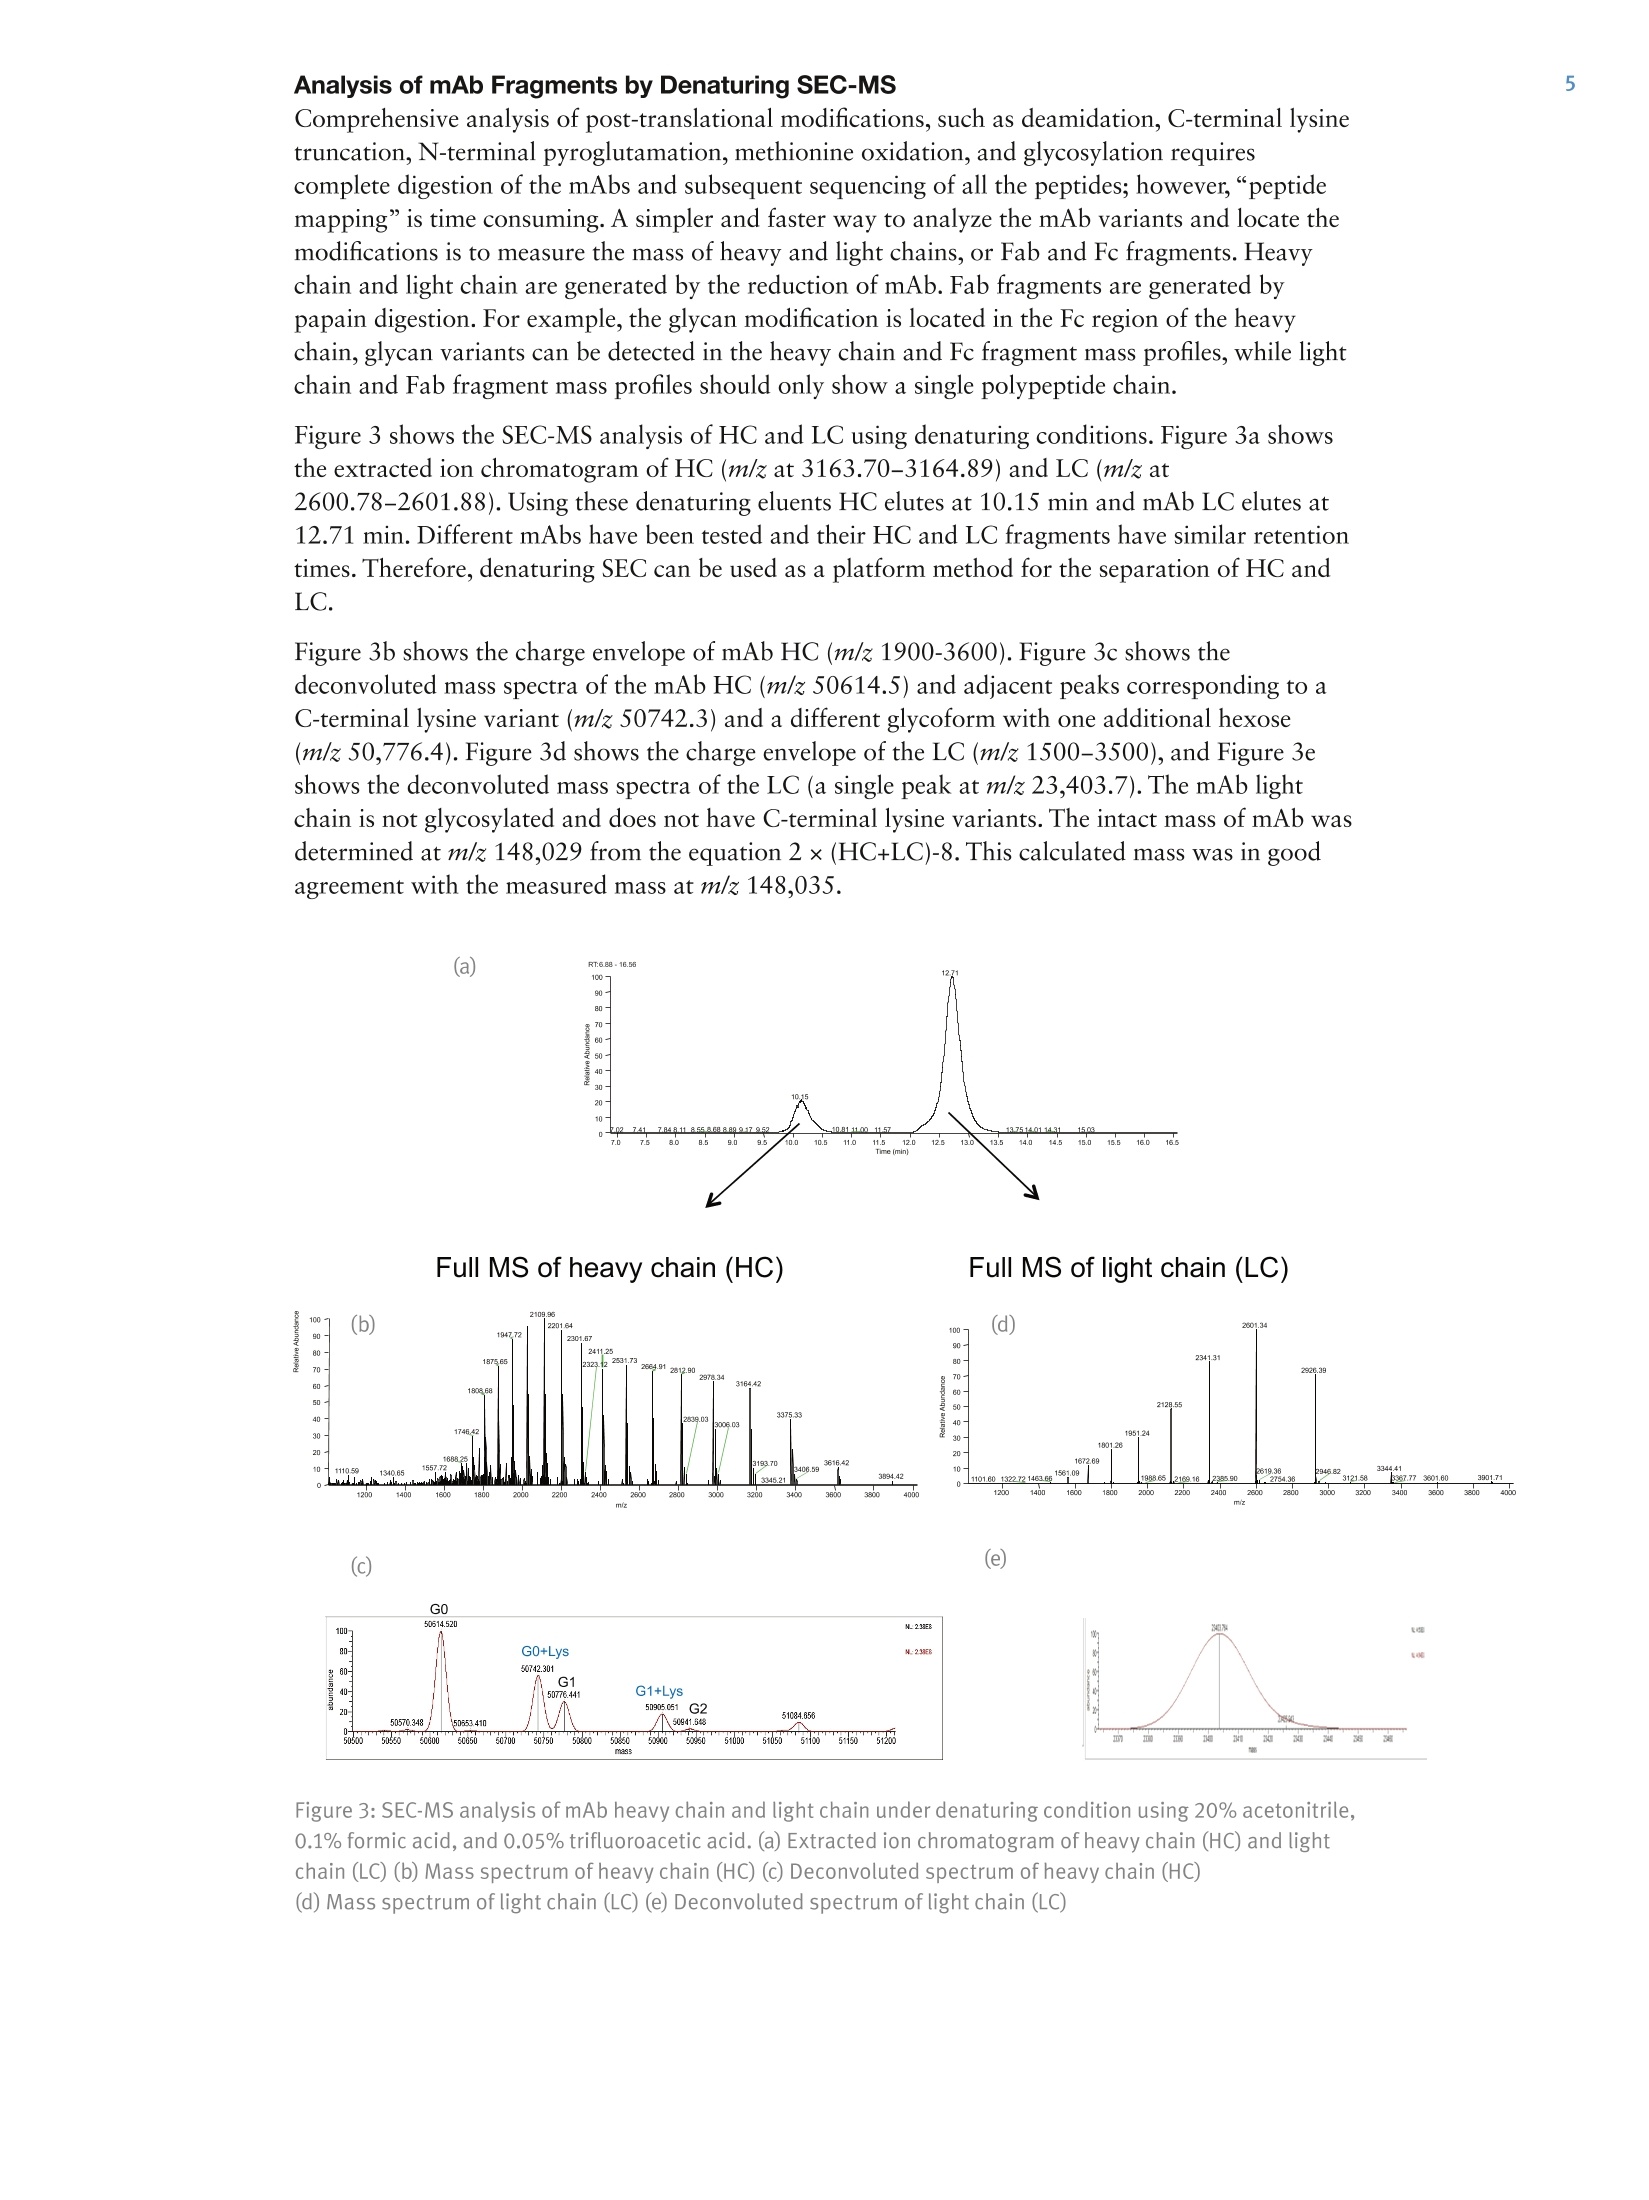
方案详情

4 6All Other Enquiries +44(0) 1928 534050AThermo Fisher Scientific BrandAN20940 E05/14S Analysis of Monoclonal Antibodies andTheir Fragments by Size-ExclusionChromatography Coupled with an OrbitrapMass Spectrometer Shanhua Lin, Hongxia Wang, Zhiqi Hao, and Xiaodong LiuThermo Fisher Scientific, Sunnyvale, CA, USA Key Words MAbPac SEC-1, Exactive Plus EMR Orbitrap, monoclonal antibody, mAb,mAb heavy chain (HC) and light chain (LC), mAb Fab and Fc fragments Abstract The Thermo ScientificTM MAbPacTM SEC-1 column uses size-exclusion chromatography (SEC) and is designed for monoclonal antibody (mAb)analysis, including monomers,aggregates, and fragments. Couplingsize-exclusion chromatography with a high-resolution Thermo ScientificTMExactiveTM Plus EMR OrbitrapTM mass spectrometer (SEC-MS) enablesaccurate mass measurement of mAb and its fragments in either nativeor denatured state. When using a non-denaturing volatile eluent, such as20 mM ammonium formate, the intact mass of mAb can be measuredin its native state. When using denaturing volatile eluents, such as 20%acetonitrile, 0.1% formic acid and 0.05% trifluoroacetic acid, mAb heavychain (HC), light chain (LC), Fab, and Fc fragments are successfullyseparated on MAbPac SEC-1 and their masses are determined accurately. Introduction The biopharmaceutical industry continues to increase itsfocus on the development of biotherapeutic monoclonalantibody (mAbs) drugs. Early in the development ofrecombinant mAbs, a large number of harvest cell culture(HCC) samples must be screened for IgG titer,aggregations, and charge variants. In a typical workflow,mAbs are first purified byProtein A affinity chromatography and then characterizedby ion-exchange chromatography to identify chargevariants and size-exclusion chromatography to quantifyaggregations. Thermo Fisher Scientific has a completeportfolio of HPLC consumables and systems for theaffinity, SEC, and IEX applications, namely theThermo ScientificTM MAbPacTM Protein A column,Thermo ScientificTM ProPacTM WCX-10 column,Thermo ScientificTM MAbPacTM SCX-10 column,Thermo Scientific CX-1 pH Gradient Buffer Kit,Thermo ScientificTM DionexTM UltiMateTM 3000 BioRSsystem and UltiMate 3000 PCM-3000 pH andConductivity Monitor. [1] For final biopharmaceutical product approval andsubsequent manufacturing, a comprehensivecharacterization of mAb purity, aggregate forms, andcharge variants is required by regulatory agencies. MAbs Figure 1:IgG structure produced from mammalian cell culture may contain significant amounts of dimers and higher-orderaggregates. Studies show that these aggregates present in drug products may cause severeimmunogenic and anaphylactic reactions. Size-exclusion chromatography (SEC) is a well-acceptedtechnique for the detection and accurate quantification of protein aggregates in biological drugproducts. It is also routinely used for the characterization and quality control of mAb products. There is a growing requirement to determine intact mass information, as well as the glycan profilein the QC of mAbs, using high resolution mass spectrometry. Most commonly employed LC/MSmethods require the mAb to be desalted prior to MS analysis, and this is typically done byreversed-phase chromatography. However, the low pH and high concentration of organic solventcondition used in reversed-phase chromatography often denatures the mAb. This problem is furtherexacerbated in the particular case of antibody-drug conjugate (ADC) with interchain cysteine-linked drugs. The harsh solvent condition dissociates the heavy and light chains of the ADC andprevents the measurement of intact mass. SEC chromatography using ammonium formate buffers, in front of mass spectrometry detection,enables mass measurement of intact mAb in its native state without the need for desalting. Sinceammonium formate is a volatile buffer, it is compatible with MS and preserves intact proteinstructure. Full characterization of a mAb includes mass determination of the fragments, such as theheavy chain and light chains generated by reduction of the disulfide bonds. SEC-MS enables intactmass detection of mAb under non-denaturing condition and fragments (including heavy chain, lightchain, Fab,and Fc) under denaturing condition (Figure 1). The MAbPac SEC-1 column is a size-exclusion chromatography (SEC) column designed formonoclonal antibody (mAb) analysis, including monomers, aggregates, and fragments. Itsproprietary column chemistry ensures low column bleed and and compatibility with MS detection.The compatibility of the MAbPac SEC-1 column with the Exactive Plus EMR Orbitrap massspectrometer is demonstrated here. The Exactive Plus EMR MS combines high-resolution accurate-mass with the extended mass range (EMR). It has an m/z range up to 20,000 and improvedtransmission of higher-mass ions for stronger signals. All these features make the Exactive PlusEMR mass spectrometer a superb tool for accurate intact mass measurement of mAb andhigh-performance screening of mAb glycosylation profile. This application note compares SEC-MS analysis of heavy chain and light chain mAb fragmentsunder denaturing conditions. Additionally, the Fc and Fab fragments were analyzed after papaindigestion (Figure 1) under denaturing conditions. Experimental Details Consumables Part Number All reagents were purchased from reputable suppliers. Monoclonal antibodies were kindly supplied by a biotechnology company. Column MAbPac SEC-1, 5 um, 4×300 mm 074696 Non-denaturing SEC mobile phase 20 mM ammonium formate. Solution pH was measured at 6.3. Denaturing SEC mobile phase 20% acetonitrile, 0.1% formic acid, and 0.05% trifluoroacetic acid (TFA) Chromatographic Conditions HPLC experiments were carried out using a Thermo ScientificTM DionexTM UltiMateTM 3000 RSLCnano system equipped with an SRD-3400 Membrane Degasser, NCS-3500RS Dual-Gradient Pump and Column Compartment, and WPS- 3000TPL Rapid Separation Thermostatted Autosampler. Gradient: Isocratic Flow rate: 0.2 mL/min Total run time: 20 min Temperature: 30°℃ MS Conditions The Exactive Plus EMR Orbitrap mass spectrometer was used for this study. Intact mAb or mAb fragments were analyzed Data Processing MS spectra of intact mAbs and HC, LC, Fab, and Fc fragments were analyzed using Thermo ScientificTM ProteinDeconvolution 2.0 software, which utilizes the ReSpectTM algorithm for molecular mass determination. Mass spectra fordeconvolution were produced by averaging spectra across the most abundant portion of the elution profile for the mAb ortheir fragments. The averaged spectra were subsequently deconvoluted using an input range of m/z 4000 to 6000 forspectra acquired under non-denaturing conditions (or m/z 2000 to 4000 for spectra acquired under denaturingconditions). An output mass range of 140,000 to 160,000 Da with a target mass of 150,000 Da for mAb, or an outputmass range of 45,000 to 55,000 Da with a target mass of 50,000 Da for mAb fragments, and a minimum of at leasteight consecutive charge states from the input m/z spectrum was used to generate the deconvolution results. Reduction of mAb to Heavy Chain (HC) and Light Chain (LC) Subunits Reduction of inter-chain disulfides in a mAb (1 mg/mL) was achieved by incubation of mAb with 20 mM dithiothreitol (DTT) at 50 °℃ for 30 min. The reduced sample was acidified with formic acid to a final concentration of 0.1%. Papain Digestion of mAb to Generate Fab and Fc Subunits The digestion was carried out by incubating mAb (1 mg/mL) with papain (0.04 mg/mL) in 100 mM Tris-HCI, pH 7.6,4 mM EDTA, and 5 mM cysteine buffer at 37℃. After 4 hours, the digestion was stopped by addition of formic acidto a final concentration of 0.1%. Results Analysis of mAb by Non-denaturing SEC-MS The analysis of mAbs by SEC is typically performed under non-denaturing conditions atphysiological pH(6.8)with phosphate buffer and 300 mM sodium chloride. However,thenon-volatile nature of phosphate buffer and high salt content makes this buffer incompatiblewith online mass spectrometry detection. In this application we used a volatile buffer, 20 mM ammonium formate, for SEC separation anddirectly coupled the SEC column to the Exactive Plus EMR instrument. Figure 2 shows theSEC-MS analysis of an mAb, where(a) is the extracted ion chromatogram of m/z at5483.08-5483.31 and (b) is the charge envelope of +24 to +29 in the m/z range of 5100-6200. Normally under acidic conditions, the charge envelope of mAb is in the m/z range of 2000-4000but because the 20 mM ammonium formate eluent has a pH of 6.3, the charge envelope of mAbshifts to higher mass range. The detection of such high m/z charge envelopes (greater than 6000) ismade possible with the extended mass range of the Orbitrap instrument. Figure 2c shows thedeconvoluted mass spectra of the mAb, with a main peak at m/z 148,033 and adjacent peaks atm/z 148,198, and 148,359, corresponding to different glycoforms with one and two additionalhexoses. An adjacent peak at m/z 148,163 is 130 amu above the main peak, corresponding to alysine variant. MAb average mass can be measured by SEC-MS under denaturing condition as long as the mAbstructure remains intact using eluent such as 20% acetonitrile, 0.1% formic acid, and 0.05%TFA.When comparing the charge distribution of mAb under acidic and near neutral conditions, mAb iscarrying more charge in acidic conditions with charge envelope in the range of +33 to +60 (datanot shown). 13.99 (a) 100" Figure 2: SEC-MS analysis of mAb under non-denaturing condition using 20 mM NH4Fc. (a) Extracted ionchromatogram of mAb (b) Mass spectrum of mAb (c) Deconvoluted spectrum of mAb Analysis of mAb Fragments by Denaturing SEC-MS Comprehensive analysis of post-translational modifications, such as deamidation, C-terminal lysinetruncation, N-terminal pyroglutamation, methionine oxidation, and glycosylation requirescomplete digestion of the mAbs and subsequent sequencing of all the peptides; however,“peptidemapping”is time consuming. A simpler and faster way to analyze the mAb variants and locate themodifications is to measure the mass of heavy and light chains, or Fab and Fc fragments. Heavychain and light chain are generated by the reduction of mAb. Fab fragments are generated bypapain digestion. For example, the glycan modification is located in the Fc region of the heavychain, glycan variants can be detected in the heavy chain and Fc fragment mass profiles, while lightchain and Fab fragment mass profiles should only show a single polypeptide chain. Figure 3 shows the SEC-MS analysis of HC and LC using denaturing conditions. Figure 3a showsthe extracted ion chromatogram of HC (m/z at 3163.70-3164.89) and LC (m/z at 2600.78-2601.88). Using these denaturing eluents HC elutes at 10.15 min and mAb LC elutes at12.71 min. Different mAbs have been tested and their HC and LC fragments have similar retentiontimes. Therefore, denaturing SEC can be used as a platform method for the separation of HC andLC. Figure 3b shows the charge envelope of mAb HC (m/z 1900-3600). Figure 3c shows thedeconvoluted mass spectra of the mAb HC (m/z 50614.5) and adjacent peaks corresponding to aC-terminal lysine variant (m/z 50742.3) and a different glycoform with one additional hexose(m/z 50,776.4). Figure 3d shows the charge envelope of the LC (m/z 1500-3500), and Figure 3eshows the deconvoluted mass spectra of the LC (a single peak at m/z 23,403.7). The mAb lightchain is not glycosylated and does not have C-terminal lysine variants. The intact mass of mAb wasdetermined at m/z 148,029 from the equation 2x(HC+LC)-8. This calculated mass was in goodagreement with the measured mass at m/z 148,035. (a) - 6551688 1081111 Full MS of heavy chain (HC) Full MS of light chain (LC) Figure 3: SEC-MS analysis of mAb heavy chain and light chain under denaturing condition using 20% acetonitrile,0.1% formic acid, and 0.05% trifluoroacetic acid. (a) Extracted ion chromatogram of heavy chain (HC) and light chain (LC) (b) Mass spectrum of heavy chain (HC) (C) Deconvoluted spectrum of heavy chain (HC) (d) Mass spectrum of light chain (LC) (e) Deconvoluted spectrum of light chain (LC) Using the same chromatographic method, Fc and Fab fragments were eluted off the SEC column at9.94 and 10.79 min, respectively (Figure 4a), although the separation is not as good as that for HCand LC due to the fact that Fab and Fc fragments are very similar in size. Figure 4b shows thecharge envelope of Fc in the m/z range of 1500-3500. Figure 4c shows the deconvoluted massspectra of the Fc, with a main peak at m/z 52,752.9 and adjacent peaks at m/z 52,880.5 and52,916.1, corresponding to a lysine variant and a different glycoform with one additional hexose.Figure 4d shows the charge envelope of Fab in the m/z range of 1600-3700, and Figure 4e showsthe deconvoluted mass spectra of the Fab, with a single peak at m/z 47,317.6. The intact mass ofmAb is determined at m/z 147,387 using the equation 2xFab+Fc. The calculated mass is more than700 Da away from the measured mass at m/z 148,035, indicating an additional fragment generatedfrom the papain digestion. (a) 100 Figure 4:SEC-MS analysis of mAb Fc and Fab under denaturing condition using 20% acetonitrile, 0.1% formicacid, and 0.05% trifluoroacetic acid. (a) Extracted ion chromatogram of Fc and Fab (b) Mass spectrum of Fc(c) Deconvoluted spectrum of Fc (d) Mass spectrum of Fab (e) Deconvoluted spectrum of Fab Conclusion SEC serves as a platform method for mAb fragment analysis capable of resolving intact mAband its fragments. ●mAb intact mass can be measured by SEC-MS under non-denaturing condition using MScompatible eluents such as 20 mM ammonium formate. ●The Exactive Plus EMR mass spectrometer enables accurate detection of mAbs in the range ofm/z 350-20,000 ●Additionally, the MAbPac SEC-1 column successfully separated the HC and LC, and partiallyseparated the Fab and Fc fragments using denaturing eluents. [1] Lin, S.; Rao, S.; Thayer, J.; Agroskin,Y.; and Pohl, C. Automated Monoclonal Antibody2-Dimensional Workflow: from Harvest Cell Culture to Variant Analysis. Presented at TheWCBP Conference, San Francisco, CA, January 23-25, 2012. thermoscientific.com/chromatography C 2014 Thermo Fisher Scientific Inc. All rights reserved. ReSpect is a trademark of Positive Probability Ltd. All other trademarks are the property of ThermoFisher Scientific and its subsidiaries. This information is presented as an example of the capabilities of Thermo Fisher Scientific products. It is not intended toencourage use of these products in any manners that might infringe the intellectual property rights of others. Specifications, terms and pricing are subject tochange. Not all products are available in all countries. Please consult your local sales representative for details. 400 6505118 France +33 (0)1 60 92 48 34 ( For advice a nd support, please visit our website: www.thermoscientific.com/chromexpert ) The biopharmaceutical industry continues to increase its focus on the development of biotherapeutic monoclonal antibody (mAbs) drugs. Early in the development of recombinant mAbs, a large number of harvest cell culture (HCC) samples must be screened for IgG titer,aggregations, and charge variants.
确定


还剩5页未读,是否继续阅读?

赛默飞色谱与质谱为您提供《单克隆抗体及其片段(Monoclonal Antibodies and Their Fragments)中凝胶排阻层析(Size-Exclusion Chromatography Coupled)检测方案(液相色谱仪)》,该方案主要用于预防类生物药品中含量测定检测,参考标准--,《单克隆抗体及其片段(Monoclonal Antibodies and Their Fragments)中凝胶排阻层析(Size-Exclusion Chromatography Coupled)检测方案(液相色谱仪)》用到的仪器有
相关方案
更多
该厂商其他方案
更多