


方案详情
文
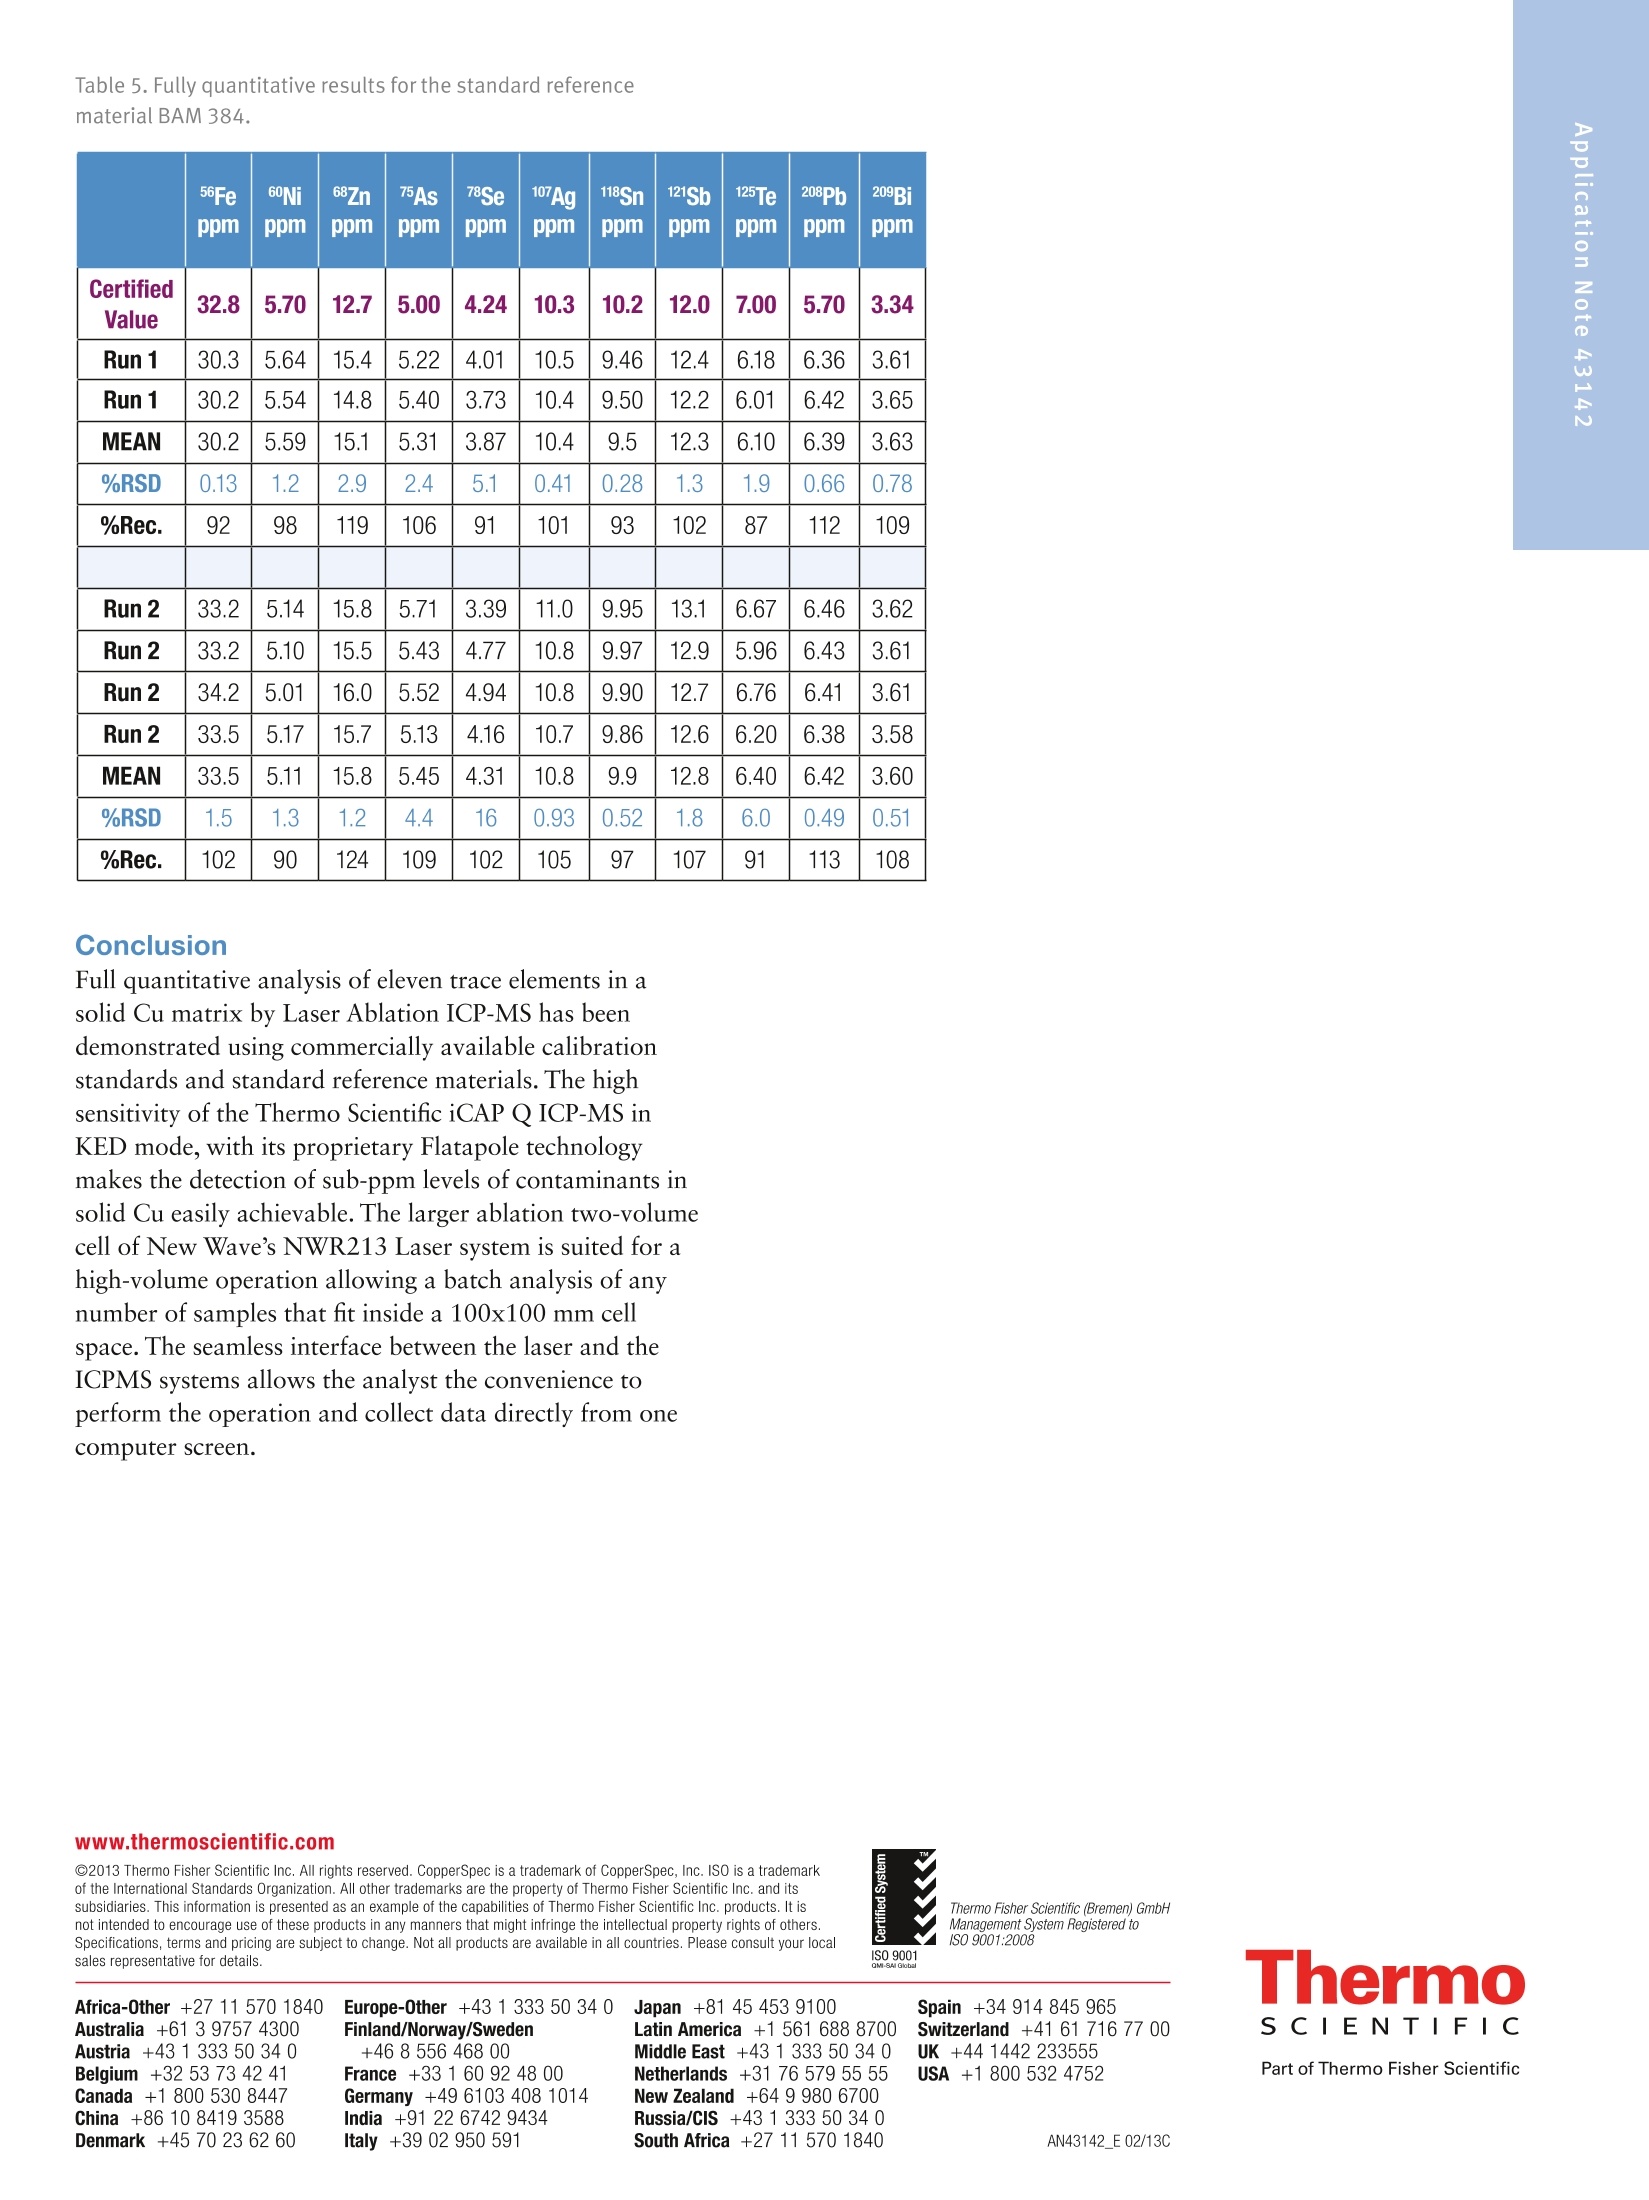
Full quantitative analysis of eleven trace elements in a solid Cu matrix by Laser Ablation ICP-MS has been demonstrated using commercially available calibration standards and standard reference materials. The high sensitivity of the Thermo Scientific iCAP Q ICP-MS in KED mode, with its proprietary Flatapole technology makes the detection of sub-ppm levels of contaminants in solid Cu easily achievable. The larger ablation two-volume cell of New Wave’s NWR213 Laser system is suited for a high-volume operation allowing a batch analysis of any
number of samples that fit inside a 100x100 mm cell space. The seamless interface between the laser and the ICPMS systems allows the analyst the convenience to perform the operation and collect data directly from one computer screen.
方案详情

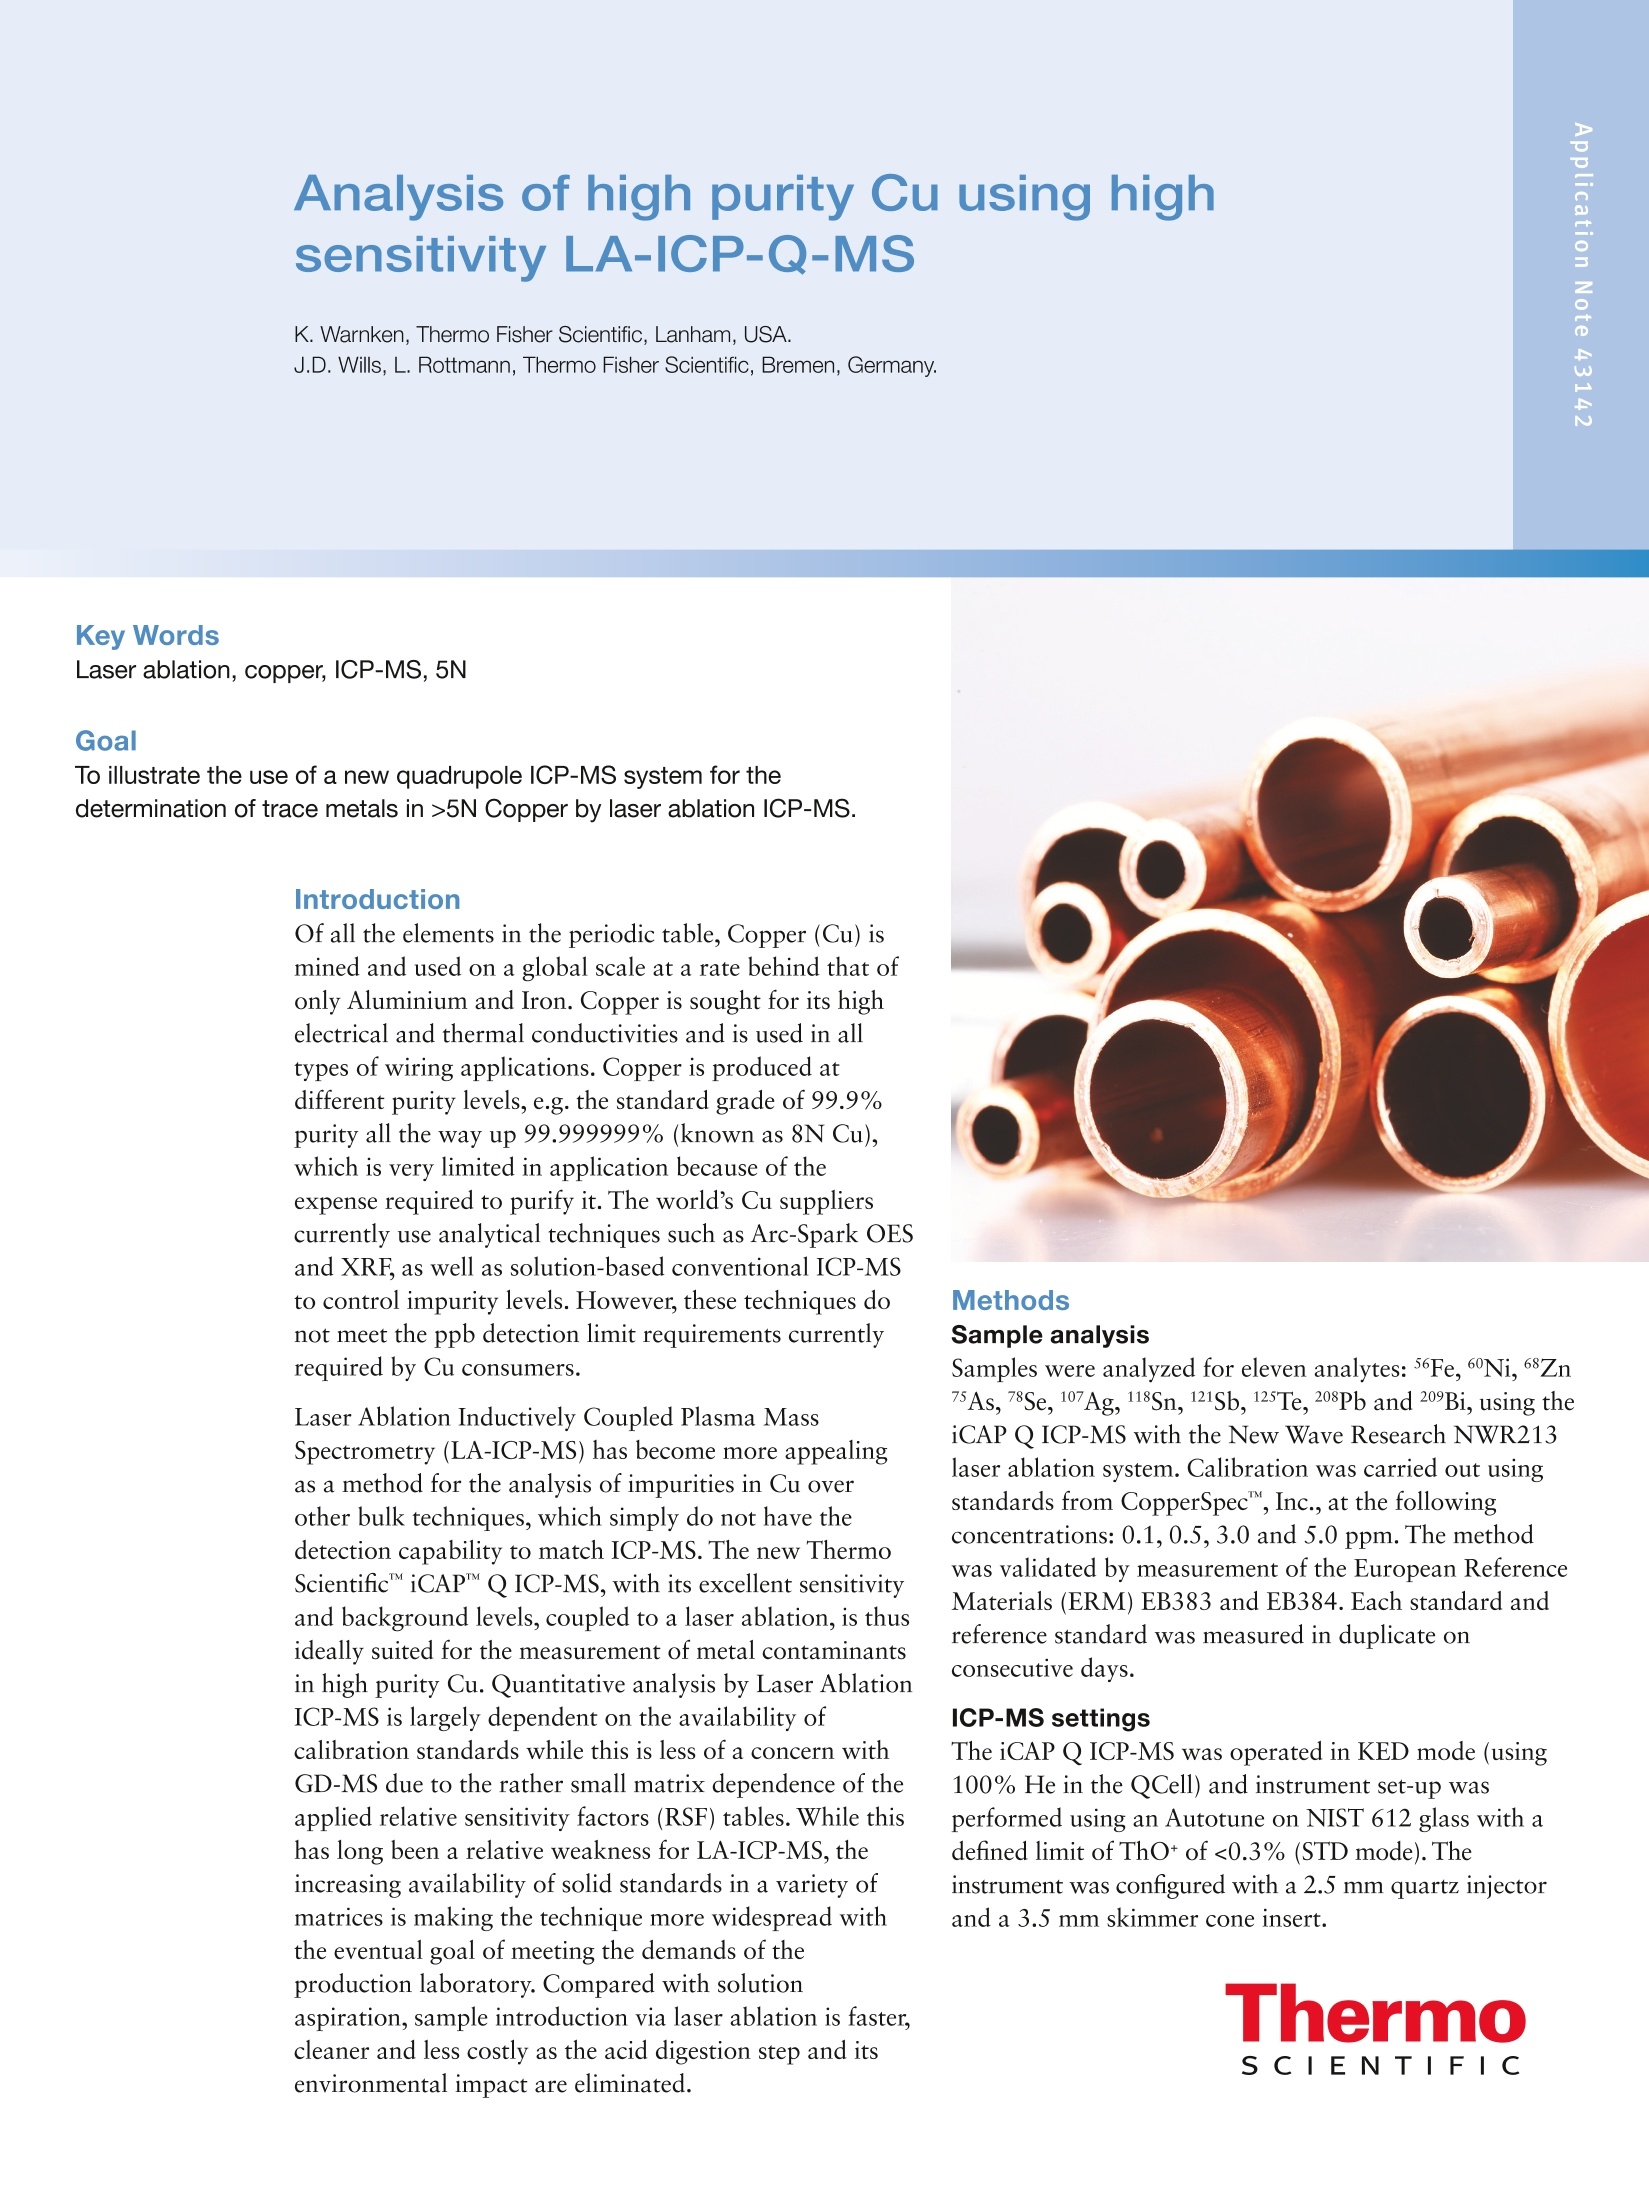
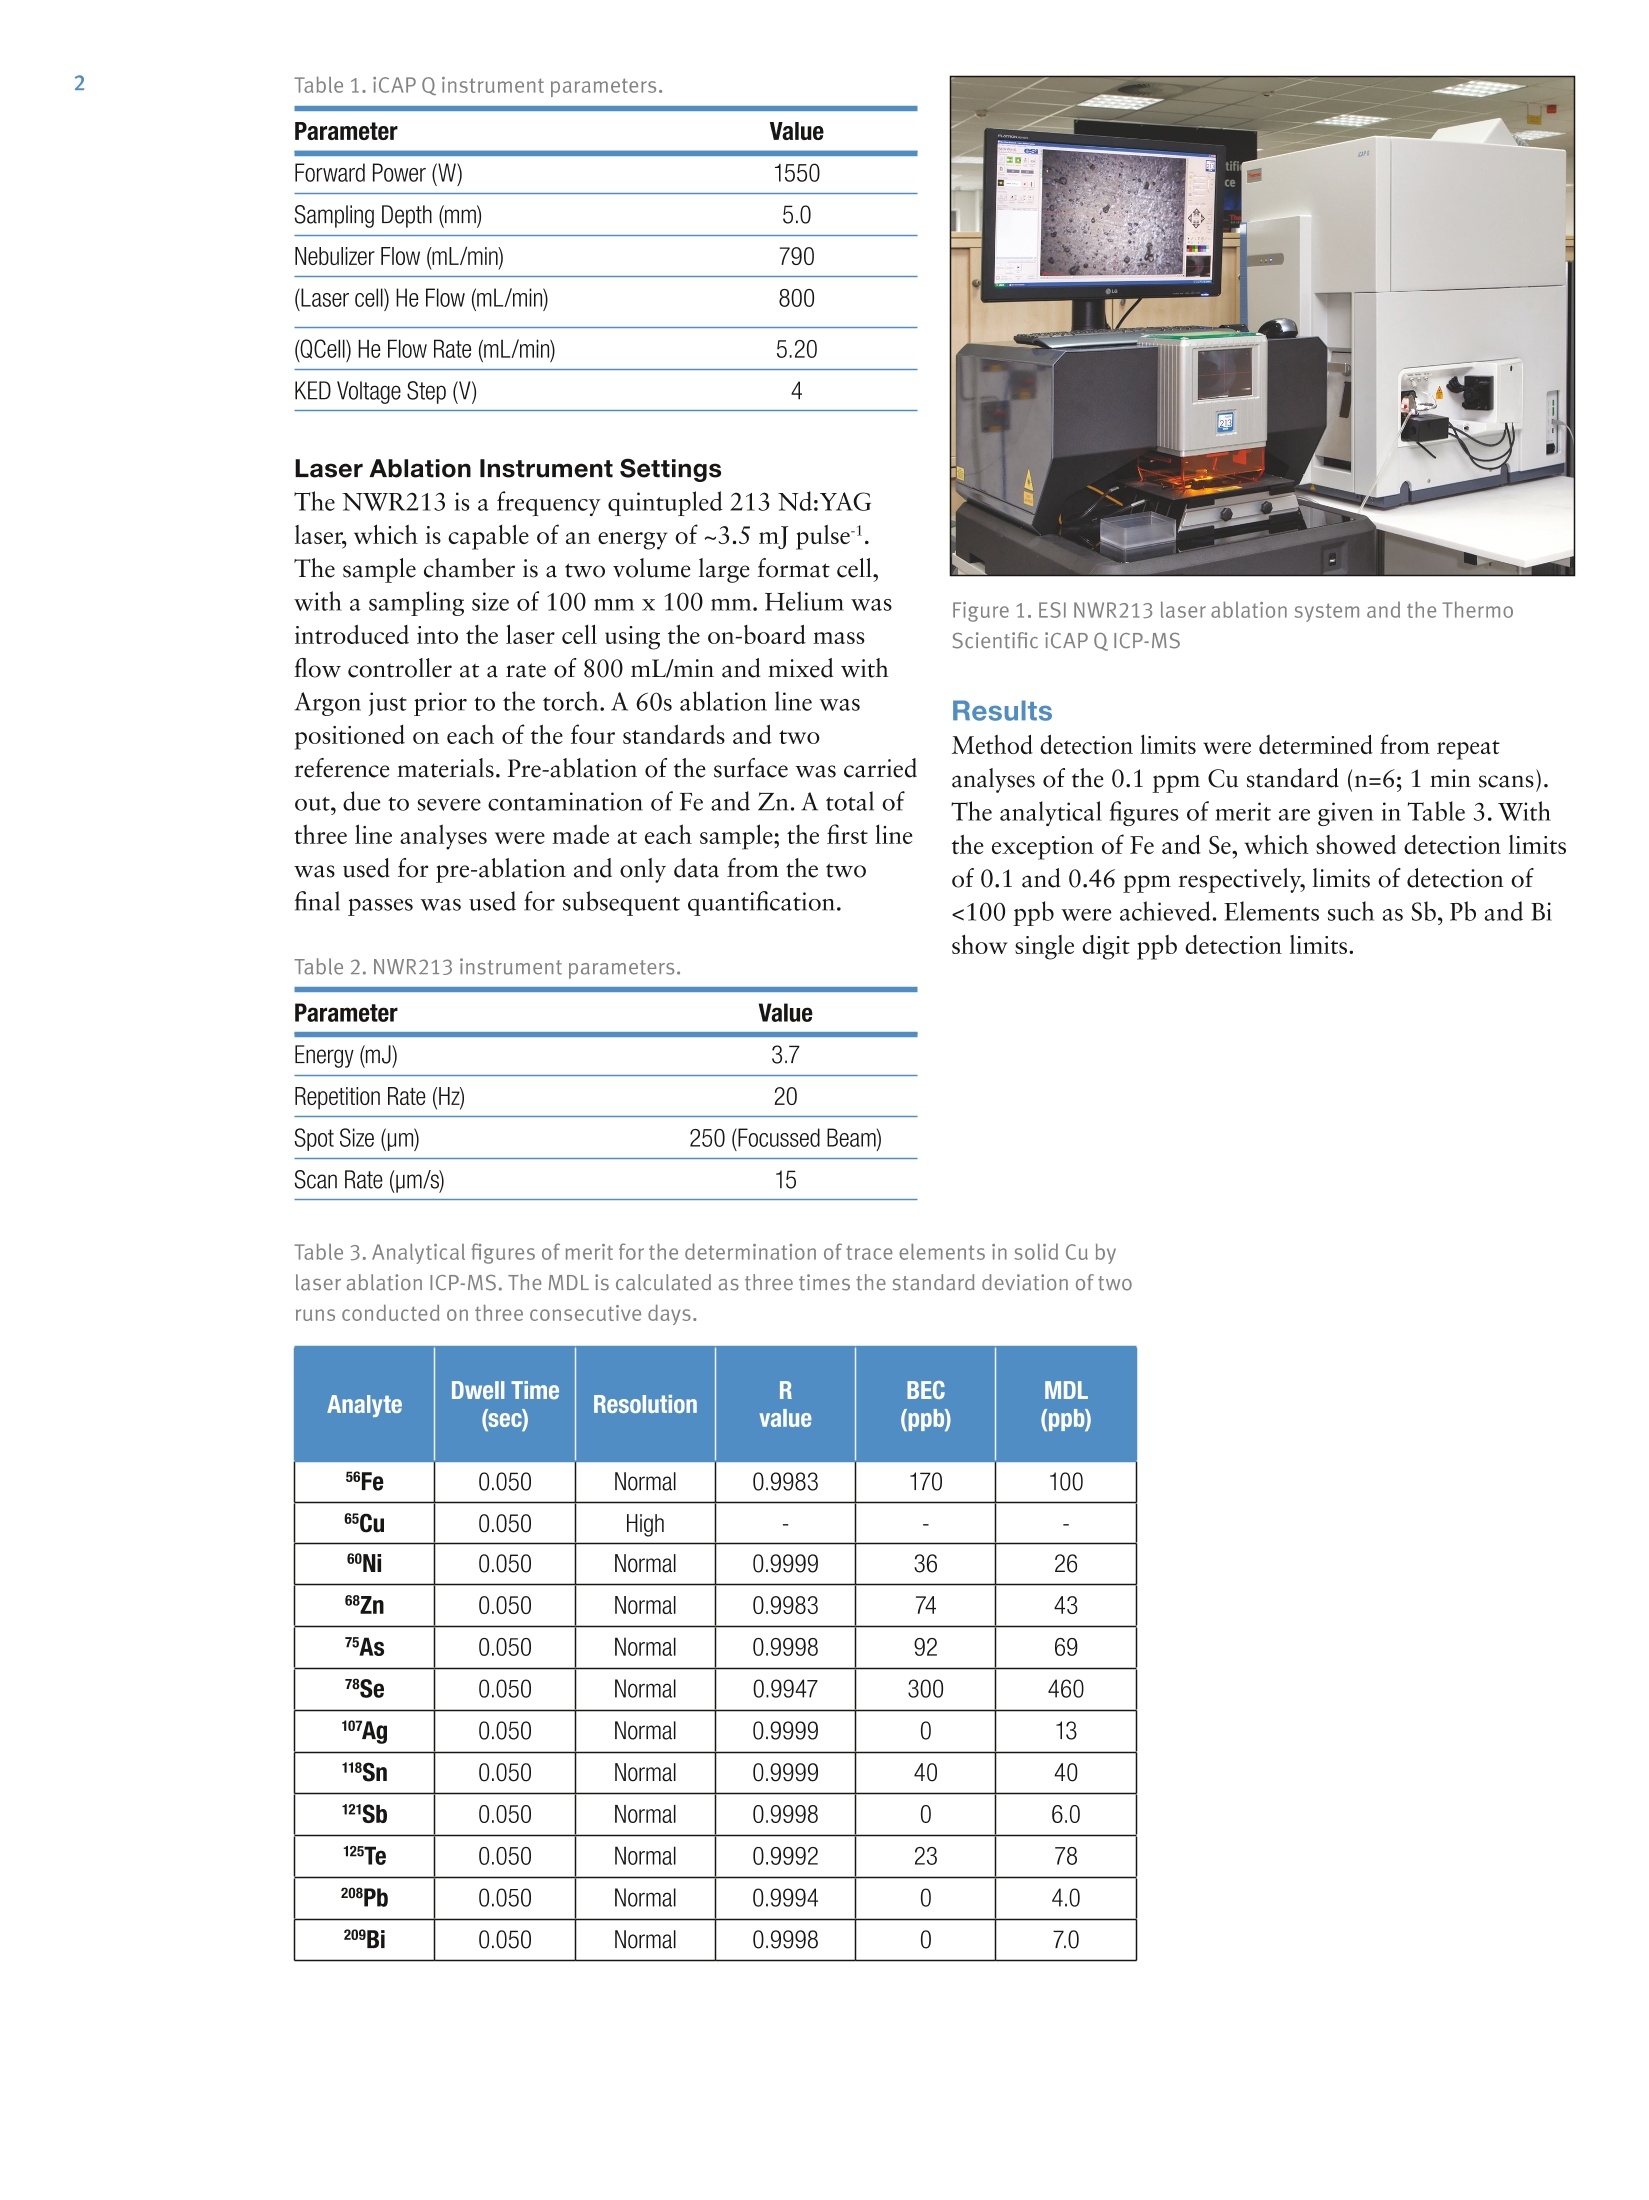
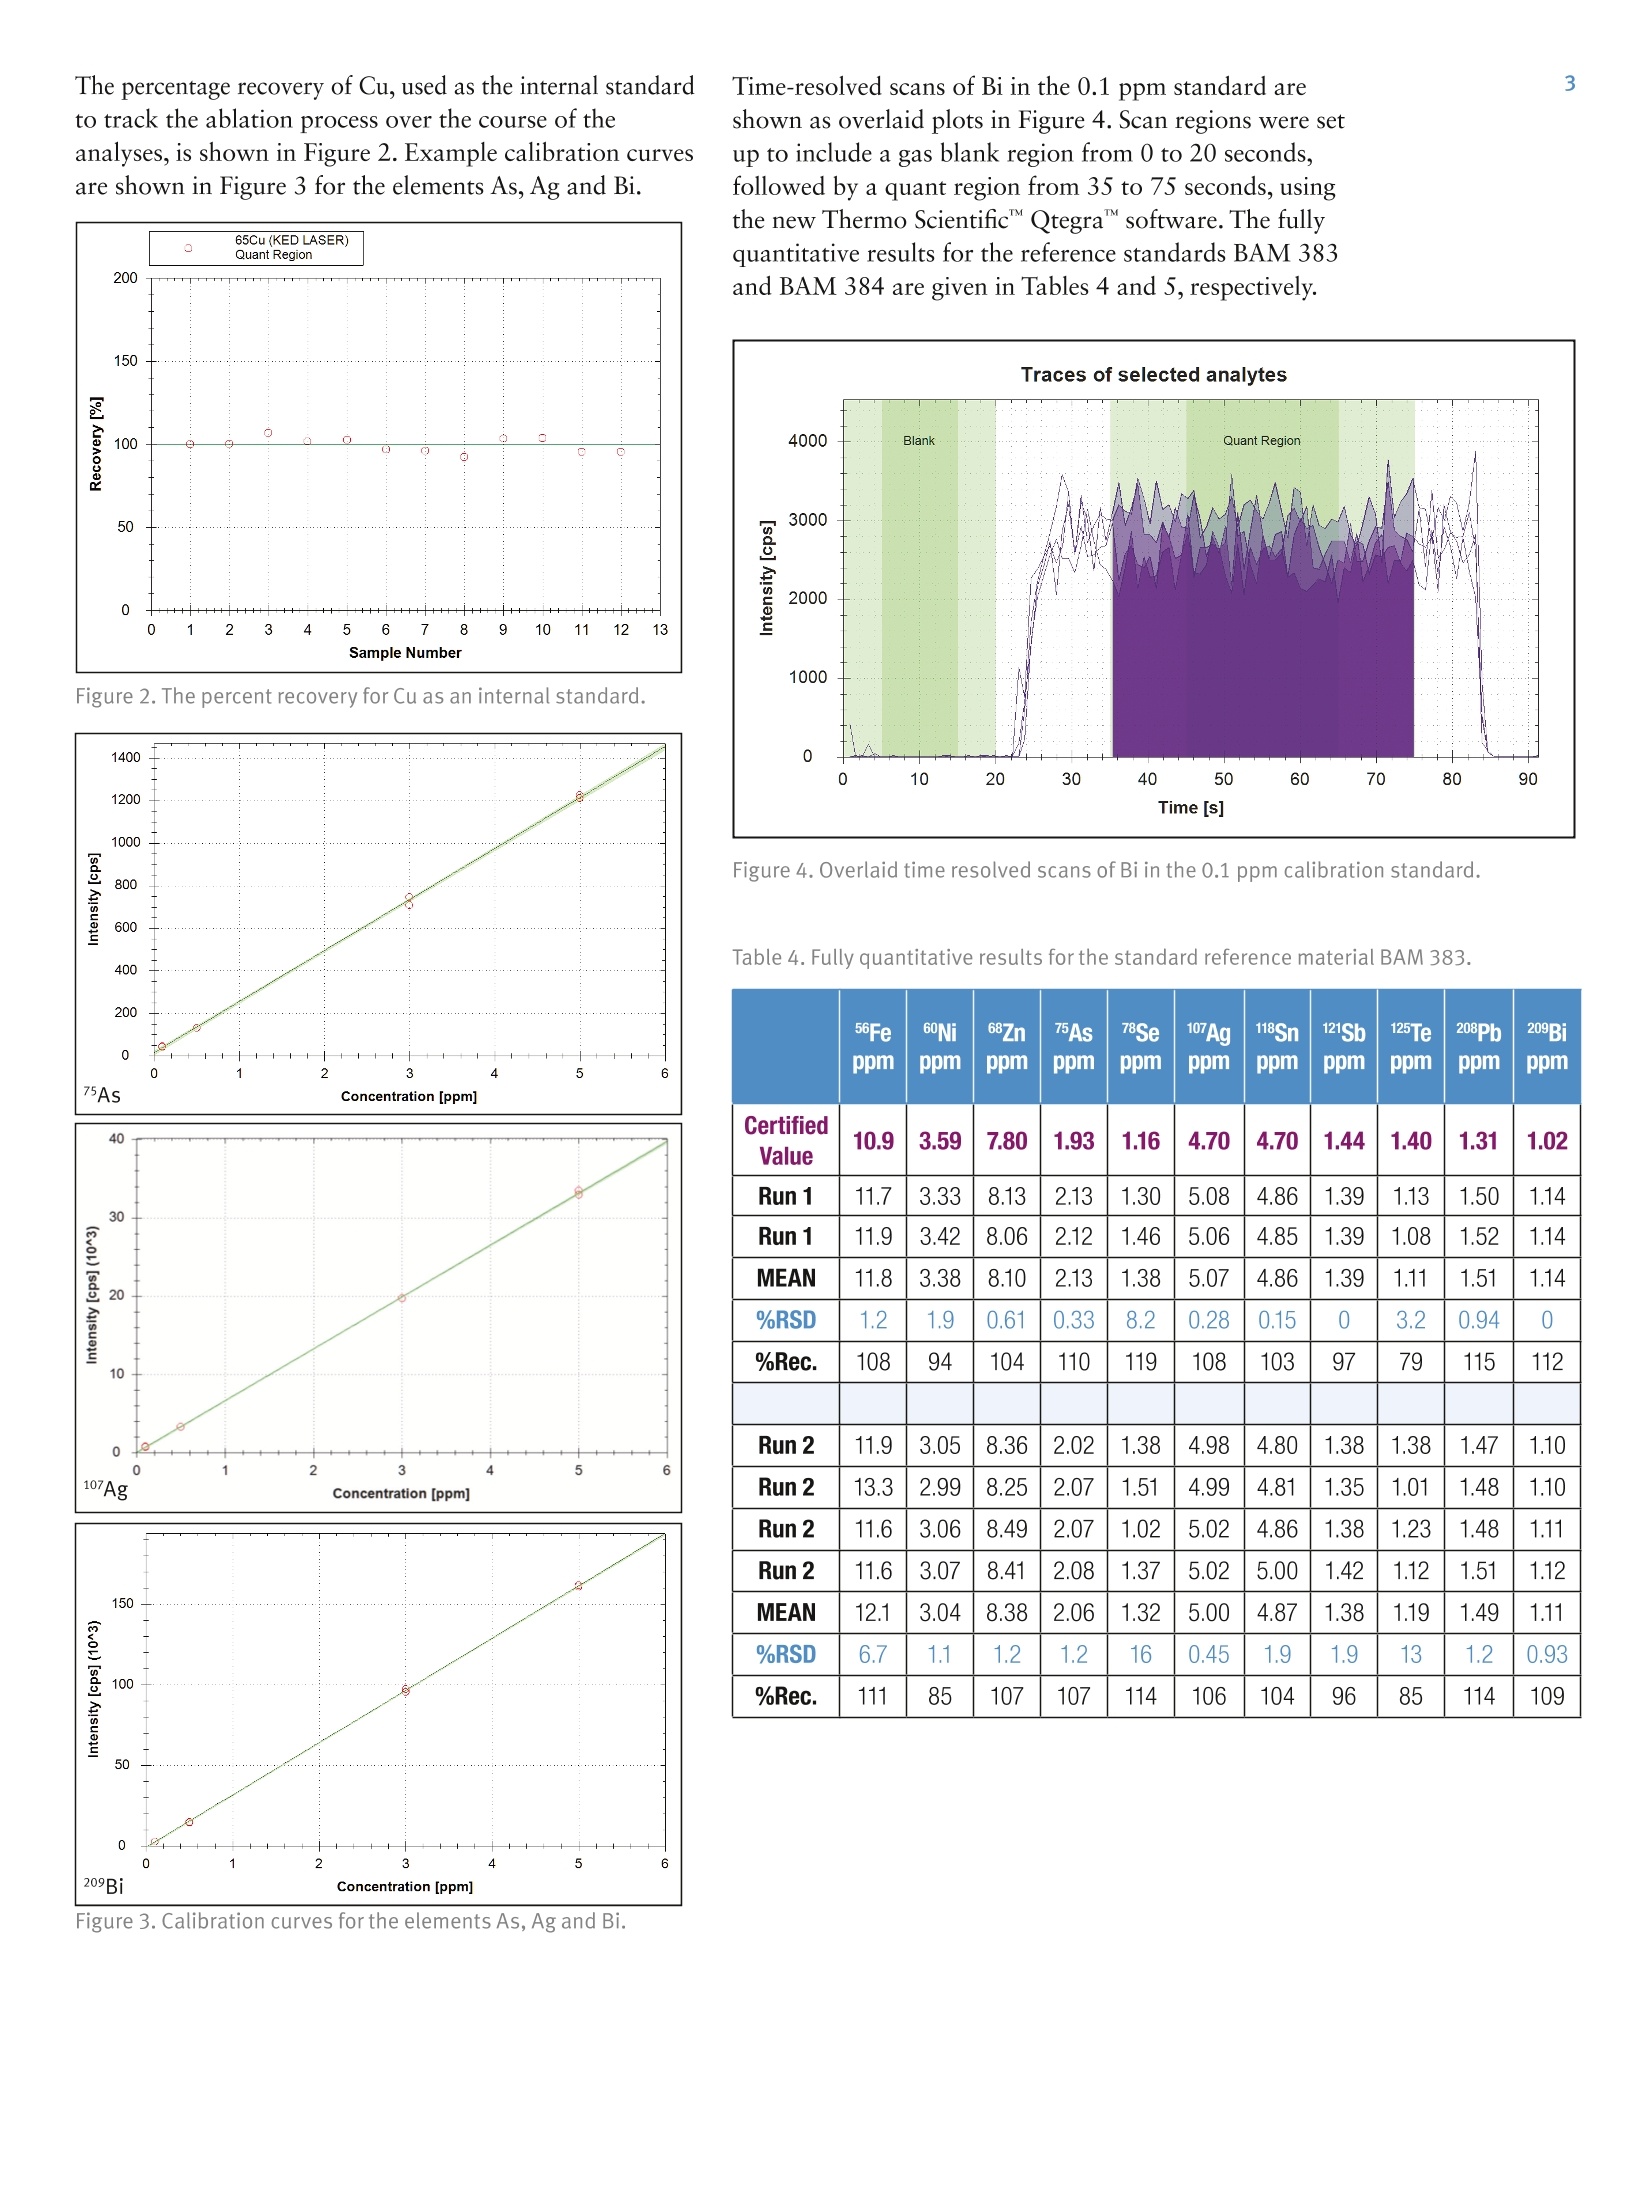
2 3 Analysis of high purity Cu using highsensitivity LA-ICP-Q-MS K. Warnken, Thermo Fisher Scientific, Lanham, USA. J.D. Wills, L. Rottmann, Thermo Fisher Scientific, Bremen, Germany. Key Words Laser ablation, copper, ICP-MS,5N To illustrate the use of a new quadrupole ICP-MS system for thedetermination of trace metals in >5N Copper by laser ablation ICP-MS. Introduction Of all the elements in the periodic table, Copper (Cu) ismined and used on a global scale at a rate behind that ofonly Aluminium and Iron. Copper is sought for its highelectrical and thermal conductivities and is used in alltypes of wiring applications. Copper is produced atdifferent purity levels, e.g. the standard grade of 99.9%purity all the way up 99.999999% (known as 8N Cu),which is very limited in application because of theexpense required to purify it. The world’s Cu supplierscurrently use analytical techniques such as Arc-Spark OESand XRF, as well as solution-based conventional ICP-MSto control impurity levels. However, these techniques donot meet the ppb detection limit requirements currentlyrequired by Cu consumers. Laser Ablation Inductively Coupled Plasma MassSpectrometry (LA-ICP-MS) has become more appealingas a method for the analysis of impurities in Cu overother bulk techniques, which simply do not have thedetection capability to match ICP-MS. The new ThermoScientificiCAPQICP-MS, with its excellent sensitivityand background levels, coupled to a laser ablation, is thusideally suited for the measurement of metal contaminantsin high purity Cu. Quantitative analysis by Laser AblationICP-MS is largely dependent on the availability ofcalibration standards while this is less of a concern withGD-MS due to the rather small matrix dependence of theapplied relative sensitivity factors (RSF) tables. While thishas long been a relative weakness for LA-ICP-MS, theincreasing availability of solid standards in a variety ofmatrices is making the technique more widespread withthe eventual goal of meeting the demands of theproduction laboratory. Compared with solutionaspiration, sample introduction via laser ablation is faster,cleaner and less costly as the acid digestion step and itsenvironmental impact are eliminated. MethodsSample analysis Samples were analyzed for eleven analytes: 56Fe, 60Ni,68Zn75As, 78Se,107Ag,118Sn,121Sb,125Te,208Pb and 209Bi, using theiCAP QICP-MS with the New Wave Research NWR213laser ablation system. Calibration was carried out usingstandards from CopperSpec", Inc., at the followingconcentrations: 0.1, 0.5, 3.0 and 5.0 ppm. The methodwas validated by measurement of the European ReferenceMaterials (ERM) EB383 and EB384. Each standard andreference standard was measured in duplicate onconsecutive days. ICP-MS settings The iCAP QICP-MS was operated in KED mode (using100% He in the QCell) and instrument set-up wasperformed using an Autotune on NIST 612 glass with adefined limit of ThO* of <0.3% (STD mode). Theinstrument was configured with a 2.5 mm quartz injectorand a 3.5 mm skimmer cone insert. Parameter Value Forward Power (W) 1550 Sampling Depth (mm) 5.0 Nebulizer Flow (mL/min) 790 (Laser cell) He Flow (mL/min) 800 (QCell) He Flow Rate (mL/min) 5.20 KED Voltage Step (V) 4 Laser Ablation Instrument Settings The NWR213 is a frequency quintupled 213 Nd:YAGlaser, which is capable of an energy of ~3.5 mJ pulse"l.The sample chamber is a two volume large format cell,with a sampling size of 100 mm x 100 mm. Helium wasintroduced into the laser cell using the on-board massflow controller at a rate of 800 mL/min and mixed withArgon just prior to the torch. A 60s ablation line waspositioned on each of the four standards and tworeference materials. Pre-ablation of the surface was carriedout, due to severe contamination of Fe and Zn. A total ofthree line analyses were made at each sample; the first linewas used for pre-ablation and only data from the twofinal passes was used for subsequent quantification. Table 2. NWR213 instrument parameters. Parameter Value Energy (mJ) 3.7 Repetition Rate (Hz) 20 Spot Size (um) 250 (Focussed Beam) Scan Rate (um/s) 15 Figure 1. ESI NWR213 laser ablation system and the ThermoScientific iCAP QICP-MS Results Method detection limits were determined from repeatanalyses of the 0.1 ppm Cu standard (n=6; 1 min scans).The analytical figures of merit are given in Table 3. Withthe exception of Fe and Se, which showed detection limitsof 0.1 and 0.46 ppm respectively, limits of detection of<100 ppb were achieved. Elements such as Sb, Pb and Bishow single digit ppb detection limits. Table 3. Analytical figures of merit for the determination of trace elements in solid Cu bylaserablationICP-MS. The MDL is calculated as three times the standard deviation of tworuns conducted on three consecutive days. Analyte Dwell Time (sec) Resolution R value BEC (ppb) MDL (ppb) 56Fe 0.050 Normal 0.9983 170 100 65Cu 0.050 High - 一 60Ni 0.050 Normal 0.9999 36 26 68Zn 0.050 Normal 0.9983 74 43 75As 0.050 Normal 0.9998 92 69 78Se 0.050 Normal 0.9947 300 460 107Ag 0.050 Normal 0.9999 0 13 118Sn 0.050 Normal 0.9999 40 40 121Sb 0.050 Normal 0.9998 0 6.0 125Te 0.050 Normal 0.9992 23 78 208Pb 0.050 Normal 0.9994 0 4.0 209Bi 0.050 Normal 0.9998 0 7.0 The percentage recovery of Cu, used as the internal standardto track the ablation process over the course of theanalyses, is shown in Figure 2. Example calibration curvesare shown in Figure 3 for the elements As, Ag and Bi. Time-resolved scans of Bi in the 0.1 ppm standard areshown as overlaid plots in Figure 4. Scan regions were setup to include a gas blank region from 0 to 20 seconds,followed by a quant region from 35 to 75 seconds, usingthe new Thermo ScientificQtegra" software. The fullyquantitative results for the reference standards BAM 383and BAM 384 are given in Tables 4 and 5,respectively. Figure 2. The percent recovery for Cu as an internal standard. Figure 4. Overlaid time resolved scans of Bi in the 0.1 ppm calibration standard. Table 4. Fully quantitative results for the standard reference material BAM 383. 56Fe ppm 60Ni ppm 68Znppm 75Asppm 78Seppm 107Agppm 118Sn ppm 121Sbppm 125Teppm 208Pbppm 209Bippm CertifiedValue 10.9 3.59 7.80 1.93 1.16 4.70 4.70 1.44 1.40 1.31 1.02 Run 1 11.7 3.33 8.13 2.13 1.30 5.08 4.86 1.39 1.13 1.50 1.14 Run 1 11.9 3.42 8.06 2.12 1.46 5.06 4.85 1.39 1.08 1.52 1.14 MEAN 11.8 3.38 8.10 2.13 1.38 5.07 4.86 1.39 1.11 1.51 1.14 %RSD 1.2 1.9 0.61 0.33 8.2 0.28 0.15 0 3.2 0.94 0 %Rec. 108 94 104 110 119 108 103 97 79 115 112 Run 2 11.9 3.05 8.36 2.02 1.38 4.98 4.80 1.38 1.38 1.47 1.10 Run 2 13.3 2.99 8.25 2.07 1.51 4.99 4.81 1.35 1.01 1.48 1.10 Run 2 11.6 3.06 8.49 2.07 1.02 5.02 4.86 1.38 1.23 1.48 1.11 Run 2 11.6 3.07 8.41 2.08 1.37 5.02 5.00 1.42 1.12 1.51 1.12 MEAN 12.1 3.04 8.38 2.06 1.32 5.00 4.87 1.38 1.19 1.49 1.11 %RSD 6.7 1.1 1.2 1.2 16 0.45 1.9 1.9 13 1.2 0.93 %Rec. 111 85 107 107 114 106 104 96 85 114 109 Figure 3. Calibration curves for the elements As,Ag and Bi. 56Fe ppm 60Nippm 68Znppm 75Asppm 78Seppm 17Agppm 118Snppm 121Sb ppm 125Teppm 208Pbppm 209Bippm CertifiedValue 32.8 5.70 12.7 5.00 4.24 10.3 10.2 12.0 7.00 5.70 3.34 Run 1 30.3 5.64 15.4 5.22 4.01 10.5 9.46 12.4 6.18 6.36 3.61 Run 1 30.2 5.54 14.8 5.40 3.73 10.4 9.50 12.2 6.01 6.42 3.65 MEAN 30.2 5.59 15.1 5.31 3.87 10.4 9.5 12.3 6.10 6.39 3.63 %RSD 0.13 1.2 2.9 2.4 5.1 0.41 0.28 1.3 1.9 0.66 0.78 %Rec. 92 98 119 106 91 101 93 102 87 112 109 Run 2 33.2 5.14 15.8 5.71 3.39 11.0 9.95 13.1 6.67 6.46 3.62 Run 2 33.2 5.10 15.5 5.43 4.77 10.8 9.97 12.9 5.96 6.43 3.61 Run 2 34.2 5.01 16.0 5.52 4.94 10.8 9.90 12.7 6.76 6.41 3.61 Run 2 33.5 5.17 15.7 5.13 4.16 10.7 9.86 12.6 6.20 6.38 3.58 MEAN 33.5 5.11 15.8 5.45 4.31 10.8 9.9 12.8 6.40 6.42 3.60 %RSD 1.5 1.3 1.2 4.4 16 0.93 0.52 1.8 6.0 0.49 0.51 %Rec. 102 90 124 109 102 105 97 107 91 113 108 Conclusion Full quantitative analysis of eleven trace elements in asolid Cu matrix by Laser Ablation ICP-MS has beendemonstrated using commercially available calibrationstandards and standard reference materials. The highsensitivity of the Thermo Scientific iCAP Q ICP-MS inKED mode, with its proprietary Flatapole technologymakes the detection of sub-ppm levels of contaminants insolid Cu easily achievable. The larger ablation two-volumecell of New Wave's NWR213 Laser system is suited for ahigh-volume operation allowing a batch analysis of anynumber of samples that fit inside a 100x100 mm cellspace. The seamless interface between the laser and theICPMS systems allows the analyst the convenience toperform the operation and collect data directly from onecomputer screen. www.thermoscientific.com ◎2013 Thermo Fisher Scientific Inc. All rights reserved. CopperSpec is a trademark of CopperSpec, Inc. ISO is a trademarkof the International Standards Organization. All other trademarks are the property of Thermo Fisher Scientific Inc. and itssubsidiaries. This information is presented as an example of the capabilities of Thermo Fisher Scientific Inc. products. It isnot intended to encourage use of these products in any manners that might infringe the intellectual property rights of others.Specifications, terms and pricing are subject to change. Not all products are available in all countries. Please consult your localsales representative for detailsS. Ets Thermo Fisher Scientific (Bremen) GmbHManagement System Registered toISO 9001:2008 ISO 9001 Spain +34 914845 965 Switzerland +41 6171677 00 . UK +44 1442 233555 USA +1 800 532 4752 S CIENTIFIC ThermoSCIENTIFICPart of Thermo Fisher ScientificANE Full quantitative analysis of eleven trace elements in a solid Cu matrix by Laser Ablation ICP-MS has been demonstrated using commercially available calibration standards and standard reference materials. The high sensitivity of the Thermo Scientific iCAP Q ICP-MS in KED mode, with its proprietary Flatapole technology makes the detection of sub-ppm levels of contaminants in solid Cu easily achievable. The larger ablation two-volume cell of New Wave’s NWR213 Laser system is suited for a high-volume operation allowing a batch analysis of any number of samples that fit inside a 100x100 mm cell space. The seamless interface between the laser and the ICPMS systems allows the analyst the convenience to perform the operation and collect data directly from one computer screen.
确定
还剩2页未读,是否继续阅读?

产品配置单

赛默飞色谱与质谱为您提供《purity Cu中Analysis of high purity Cu using high sensitivity LA-ICP-Q-MS检测方案(等离子体质谱)》,该方案主要用于铜中含量分析检测,参考标准--,《purity Cu中Analysis of high purity Cu using high sensitivity LA-ICP-Q-MS检测方案(等离子体质谱)》用到的仪器有赛默飞ELEMENT 2/XR HR-ICP-MS
推荐专场
该厂商其他方案
更多