
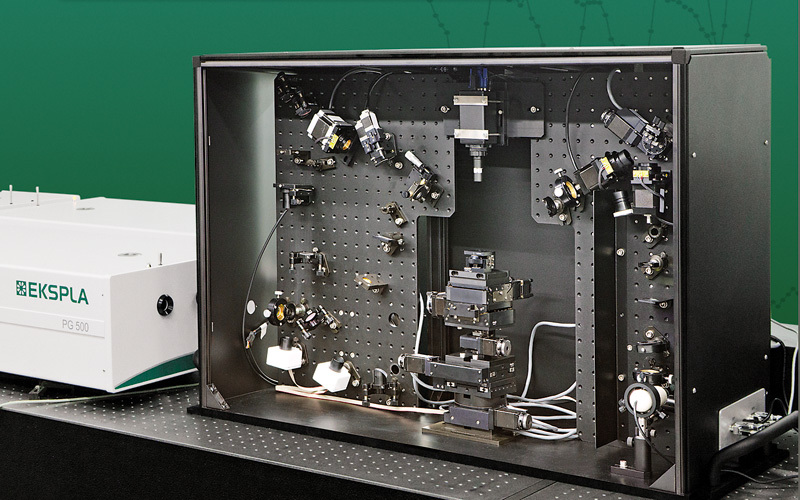


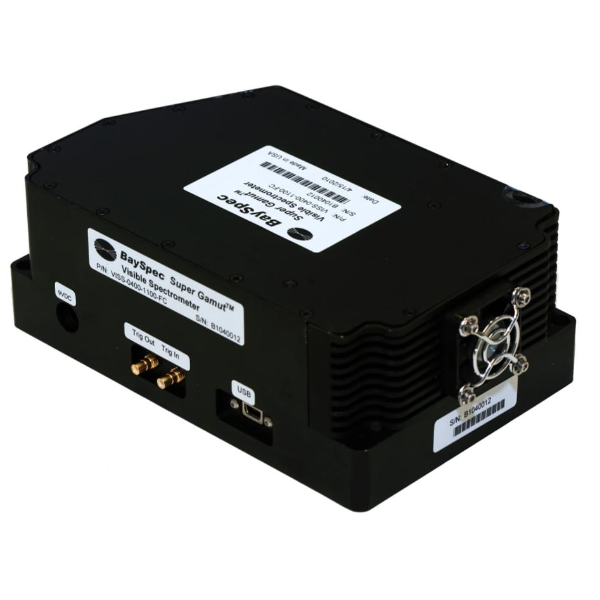
采用立陶宛Ekspla公司的振动和频光谱测量系统(VSFG)对海洋水样品进行检测,获得了在风浪通道实验条件下,表面有机物微层的信息。
方案详情

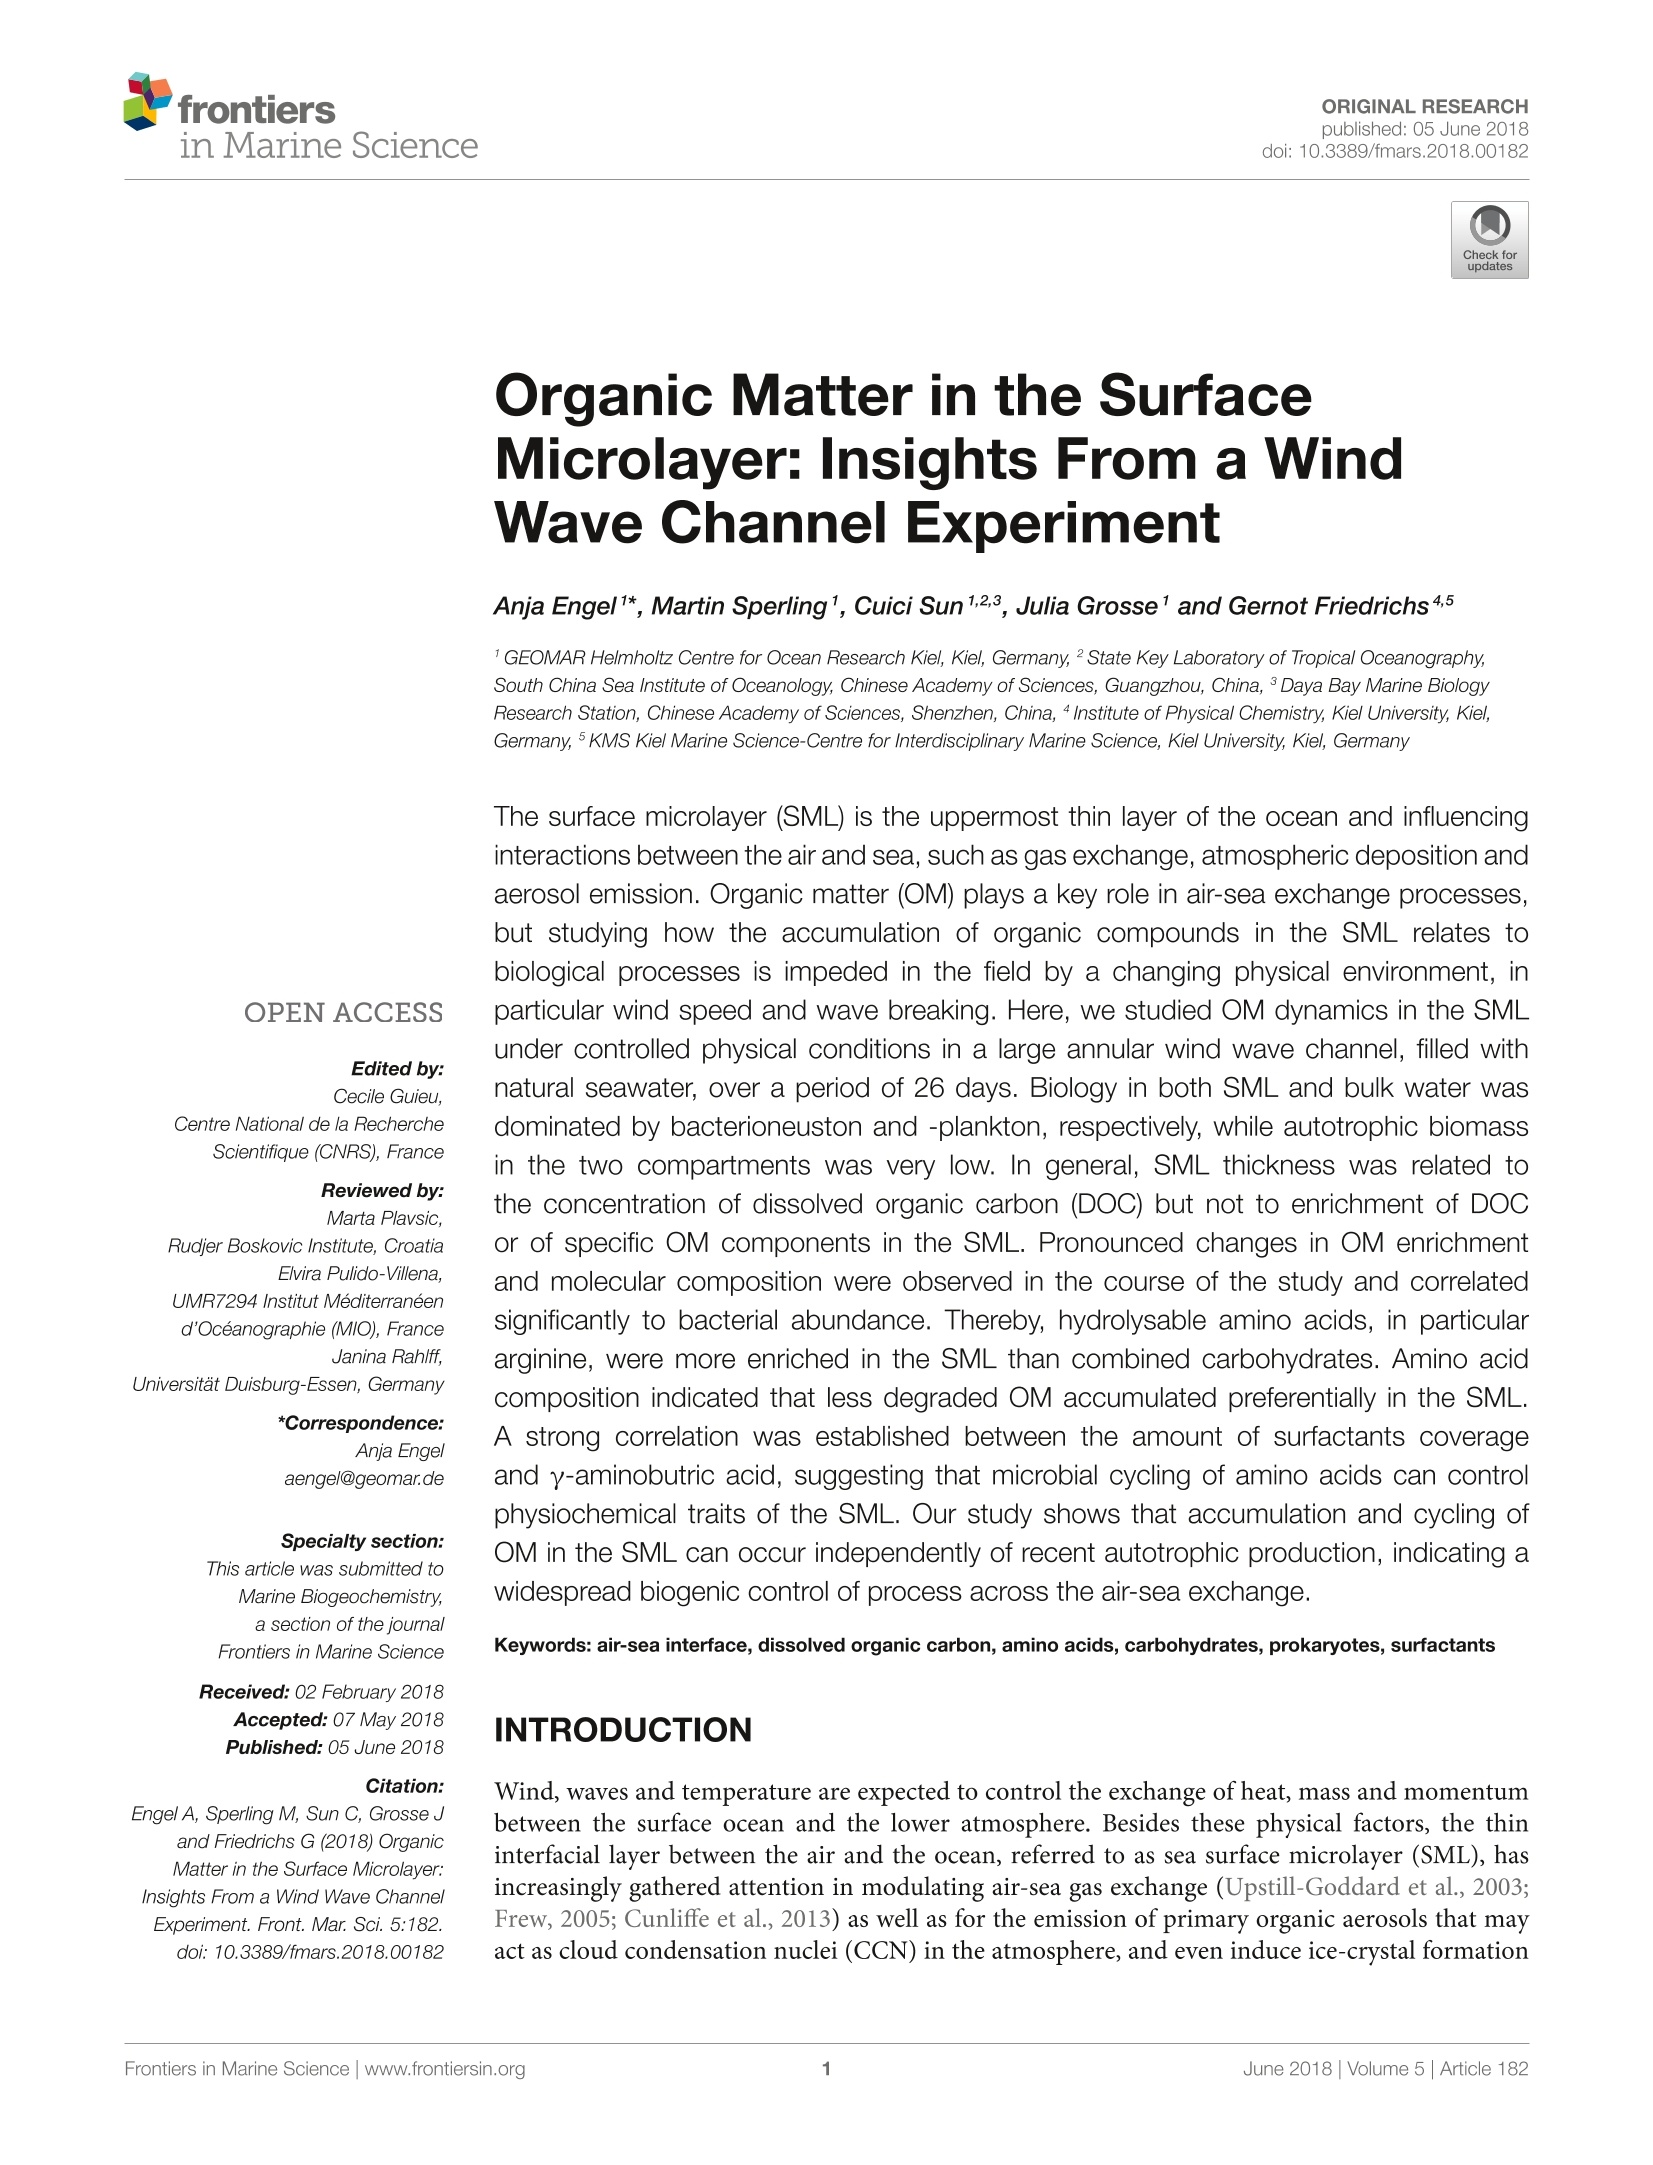
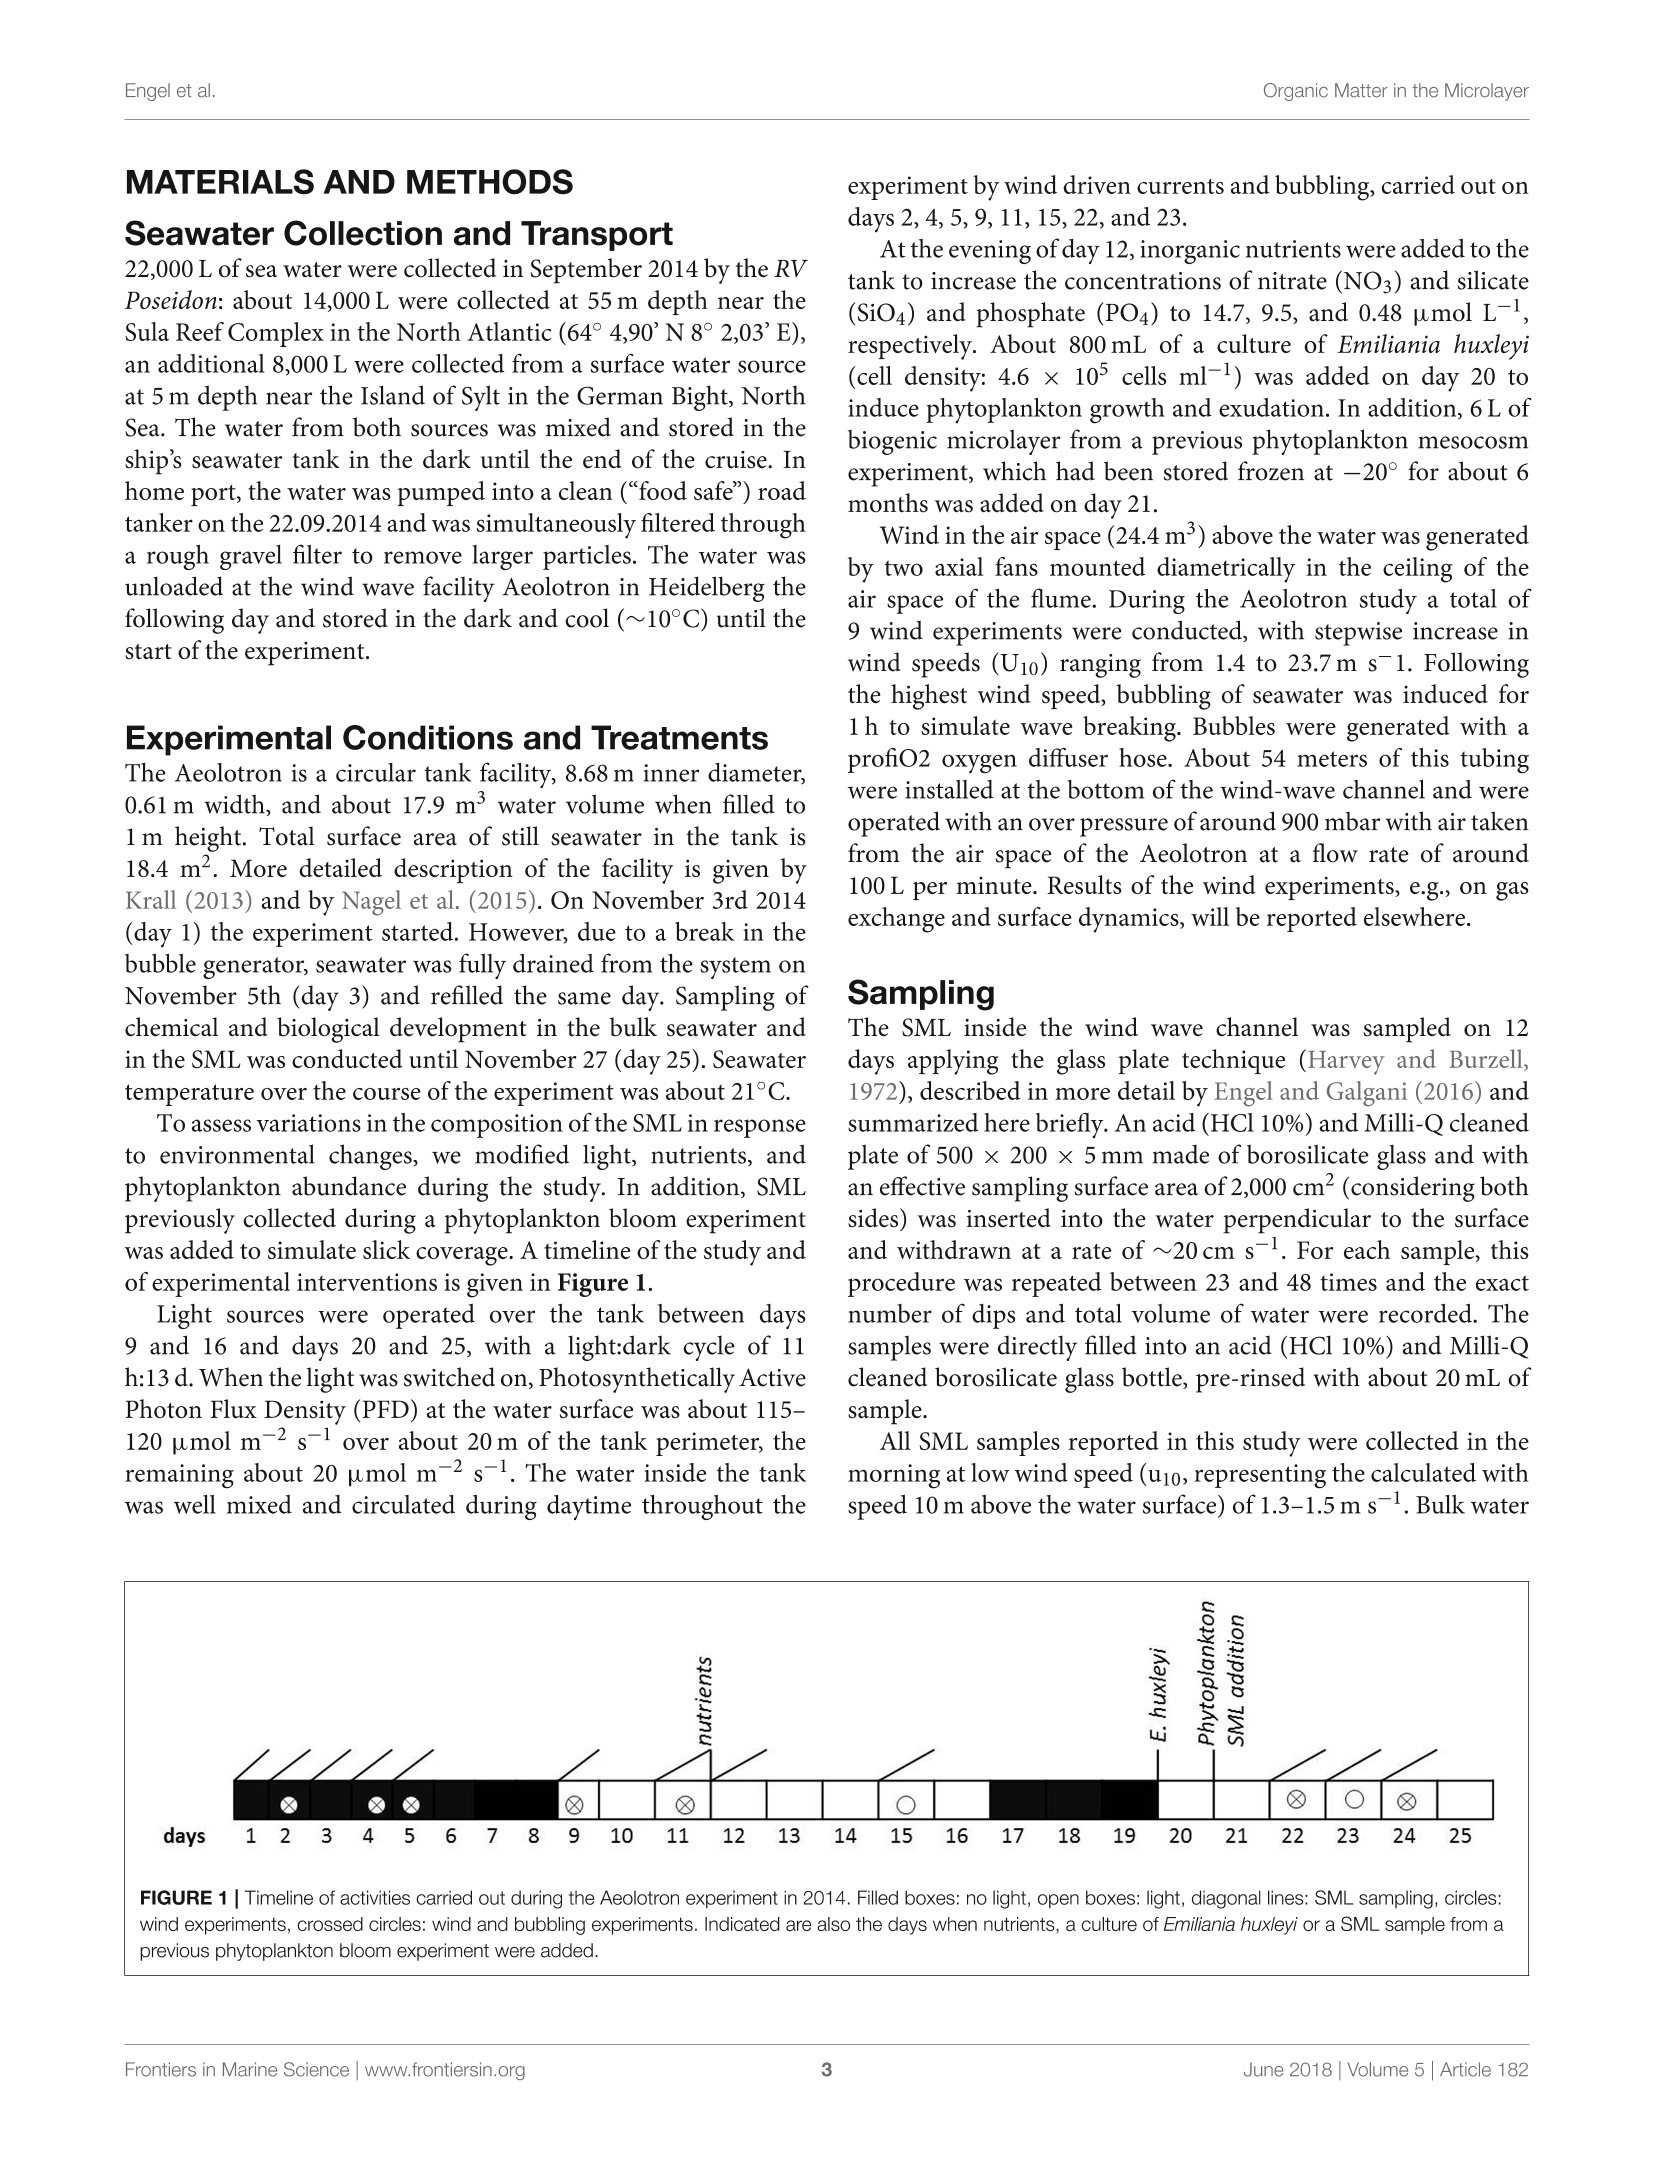
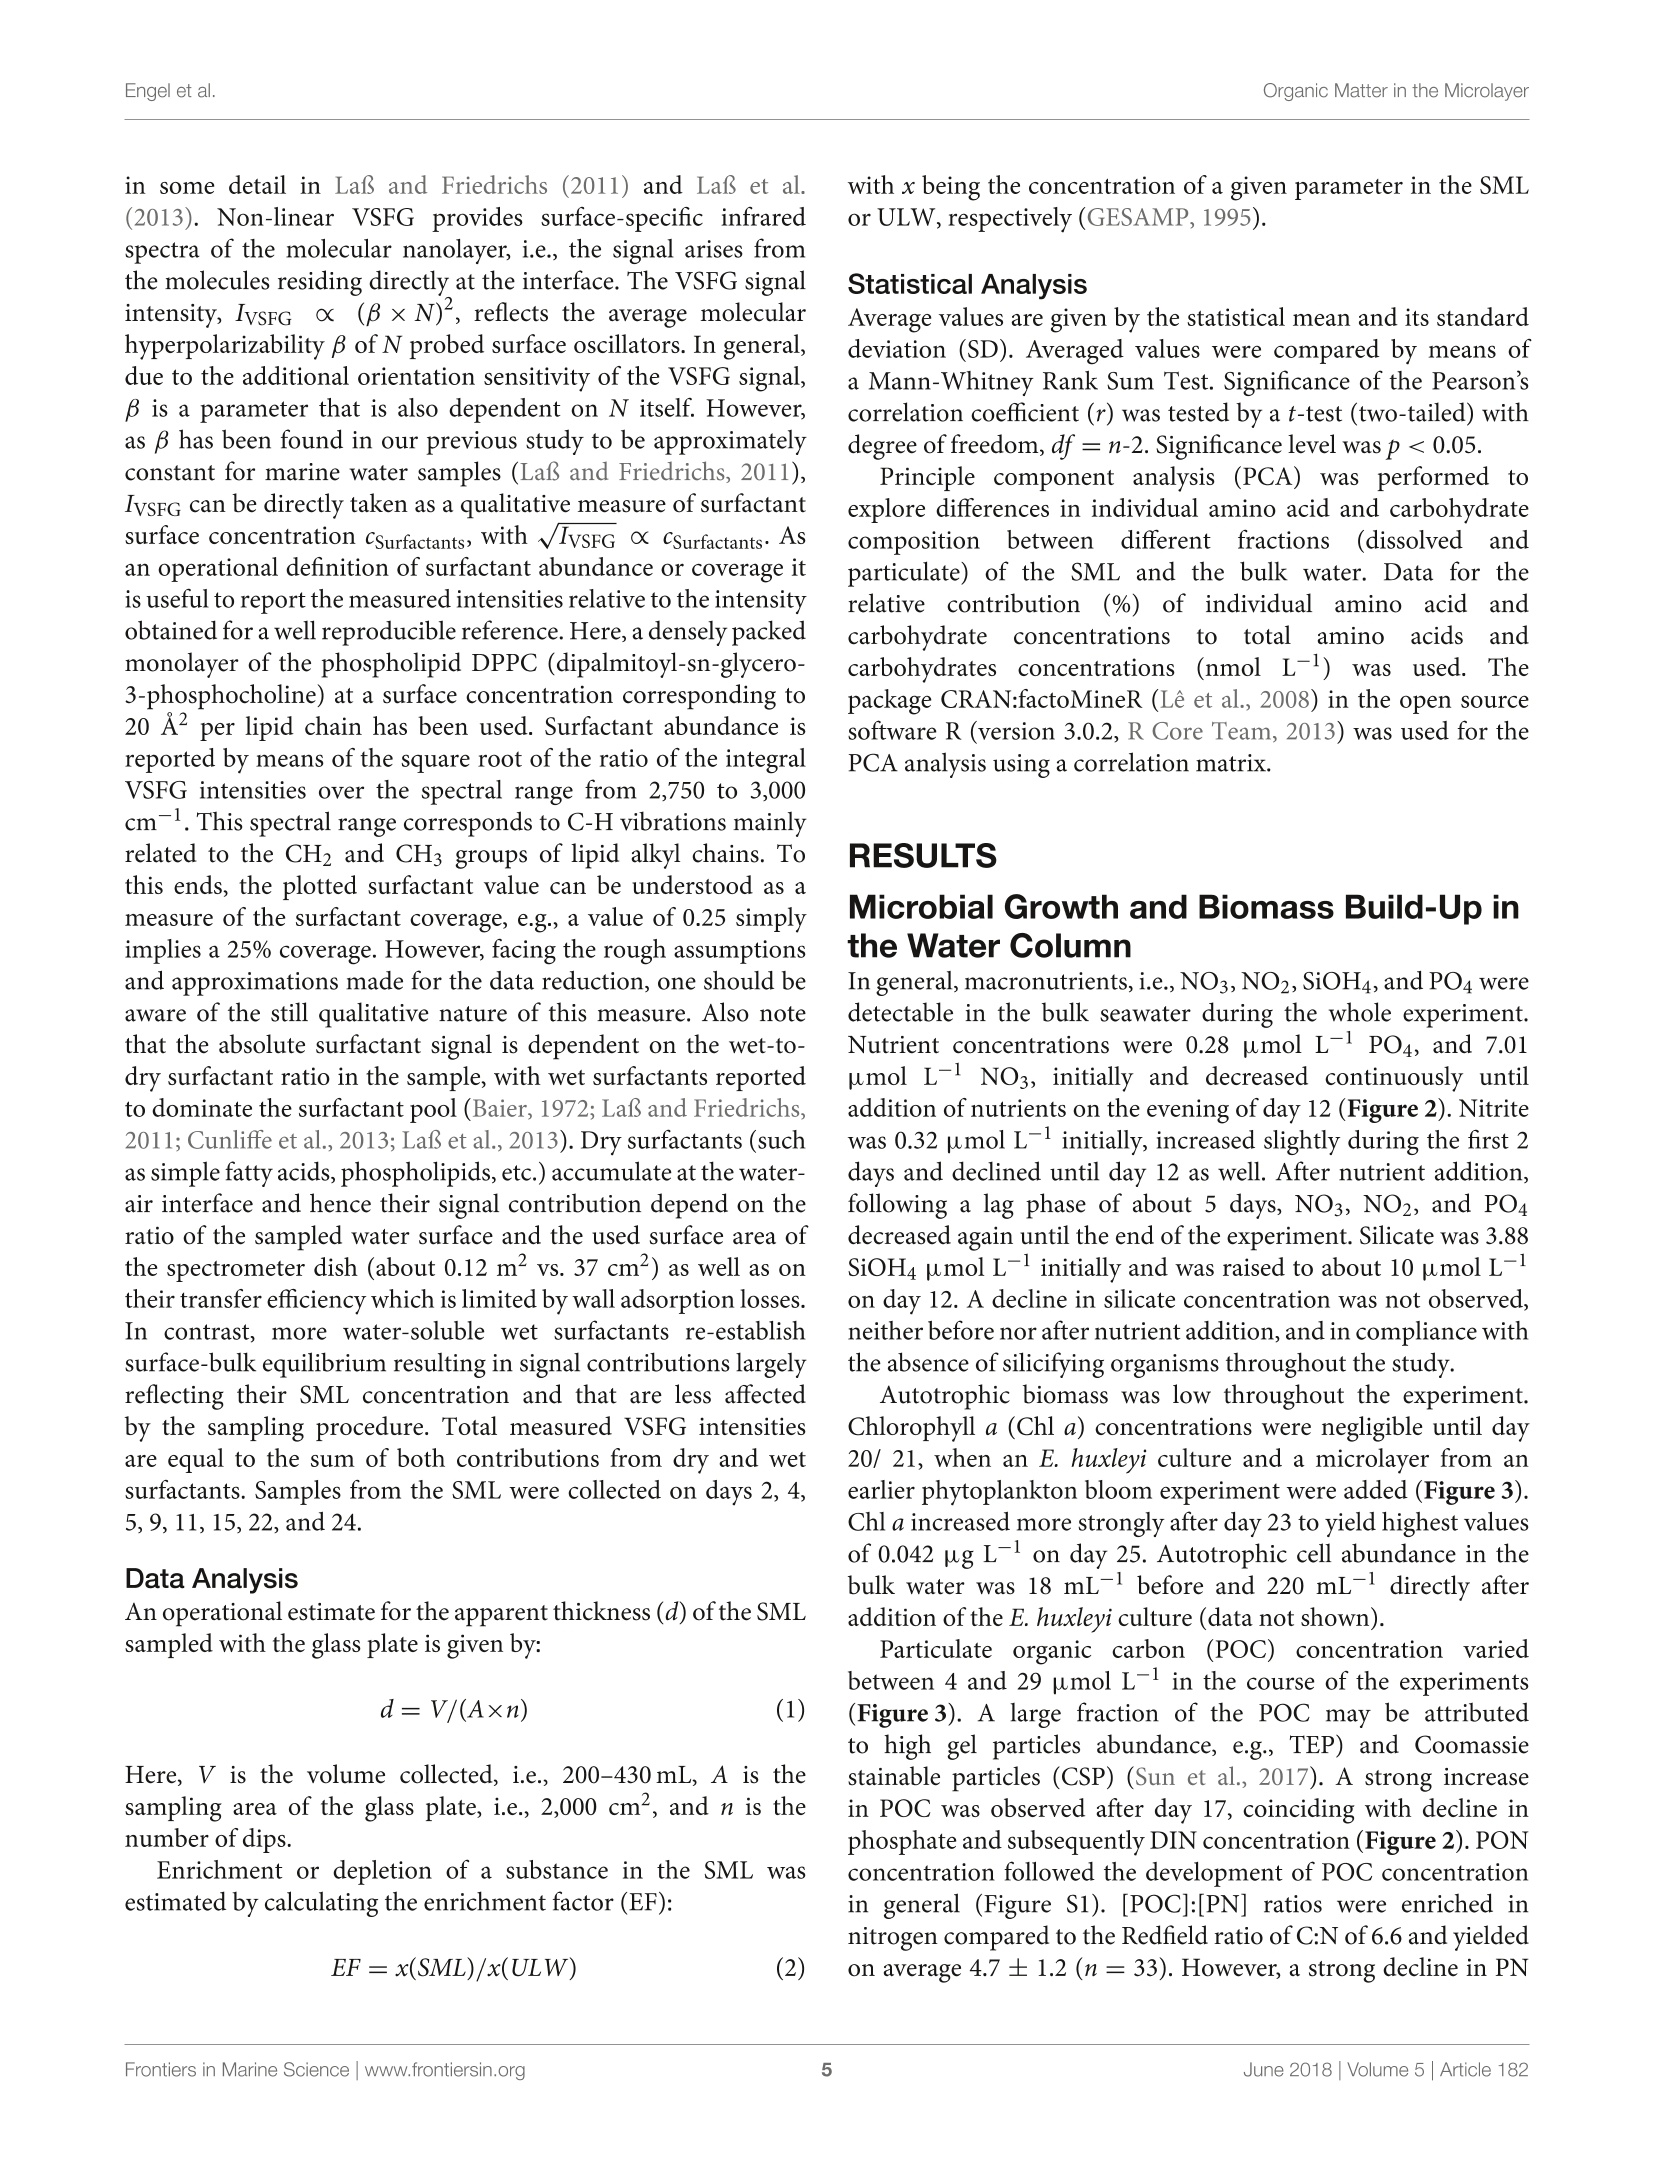
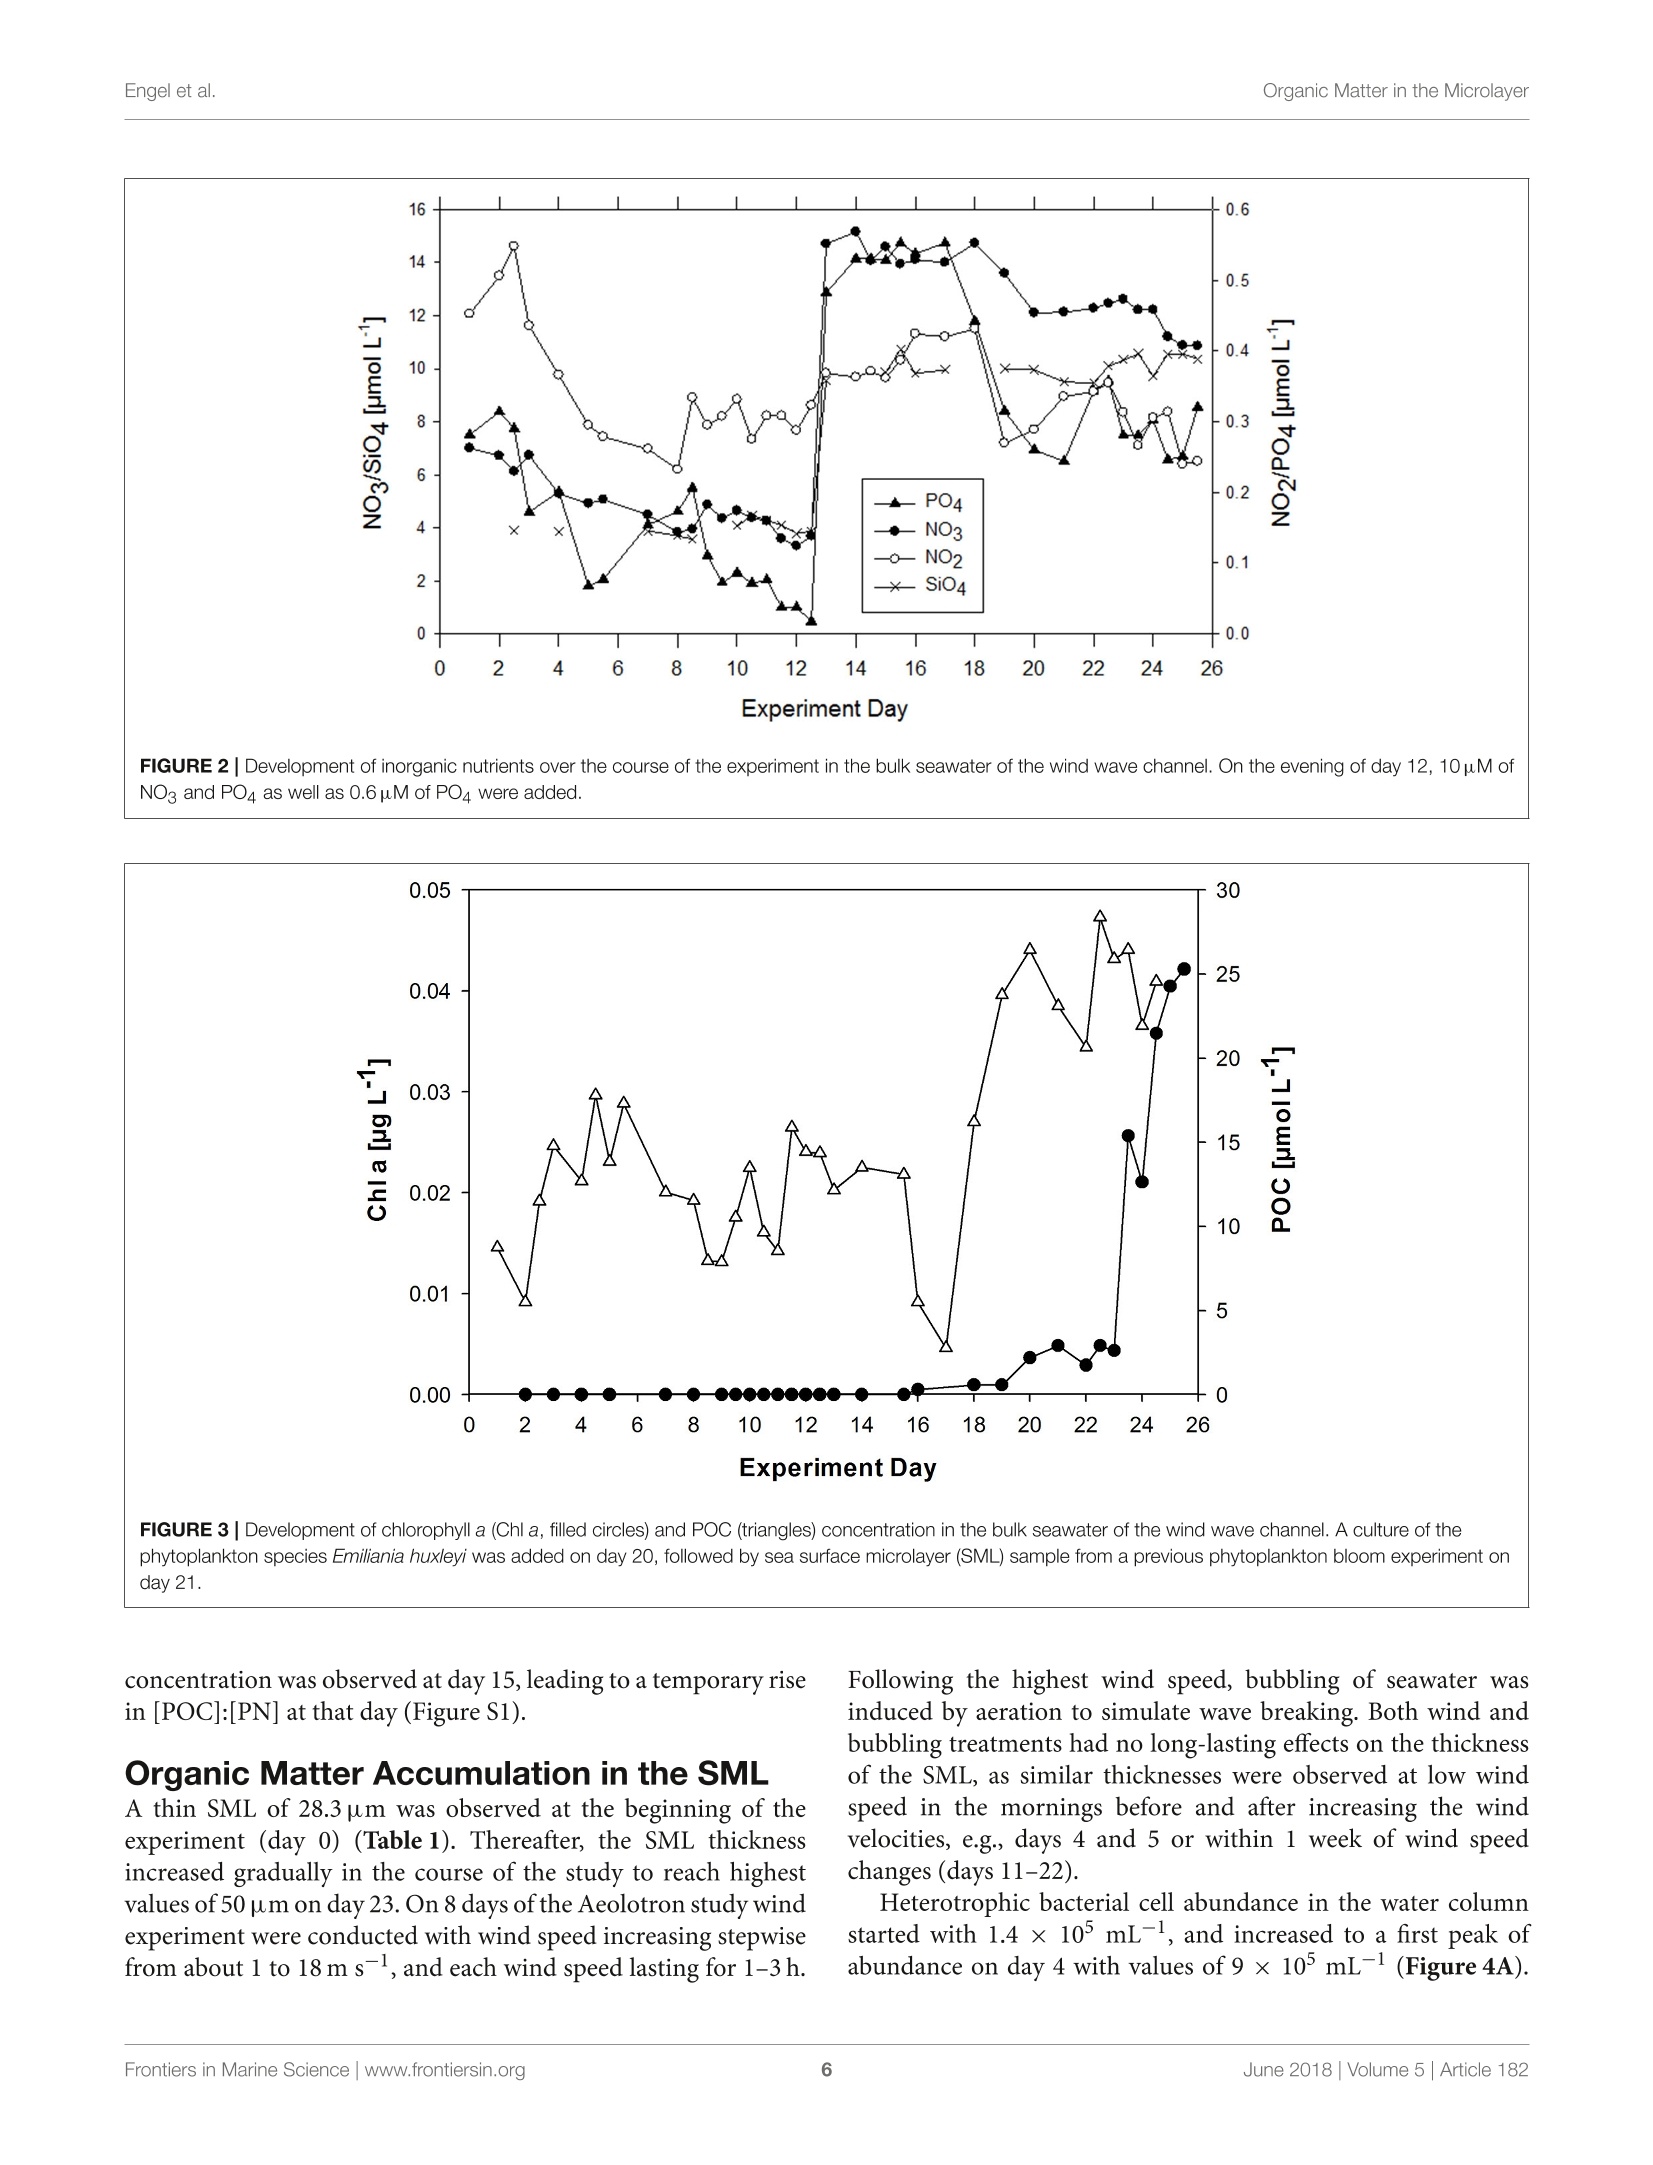
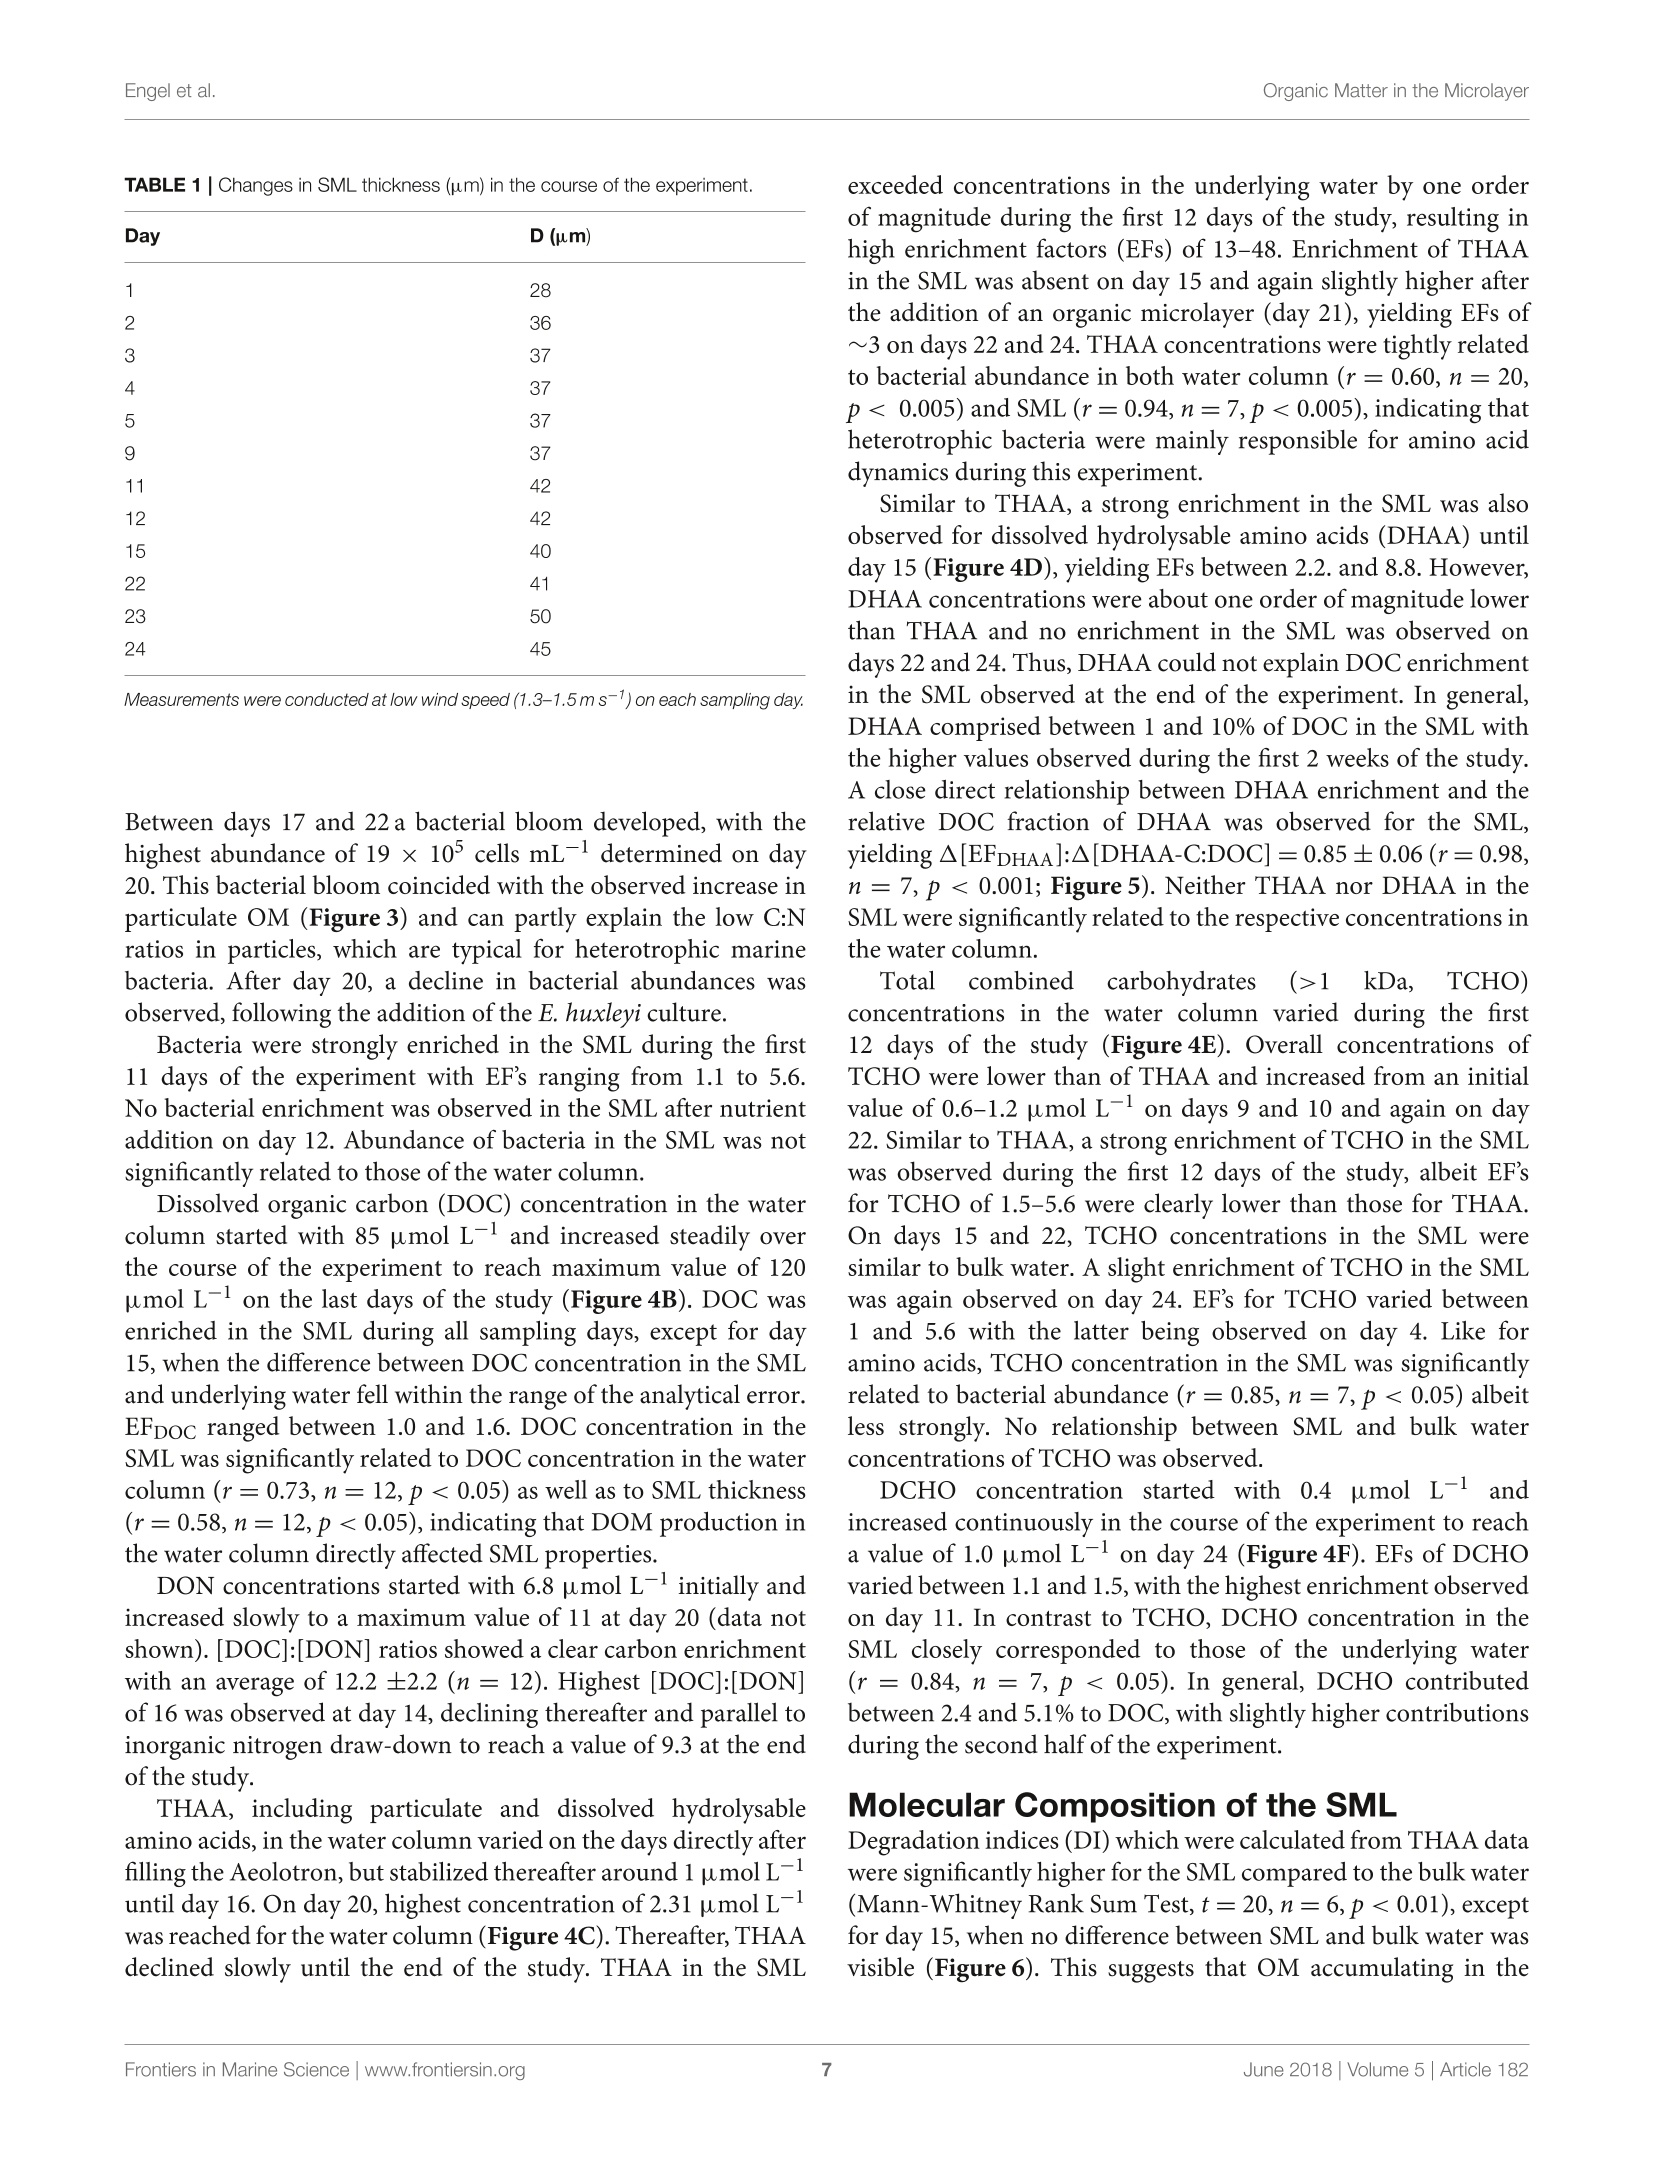
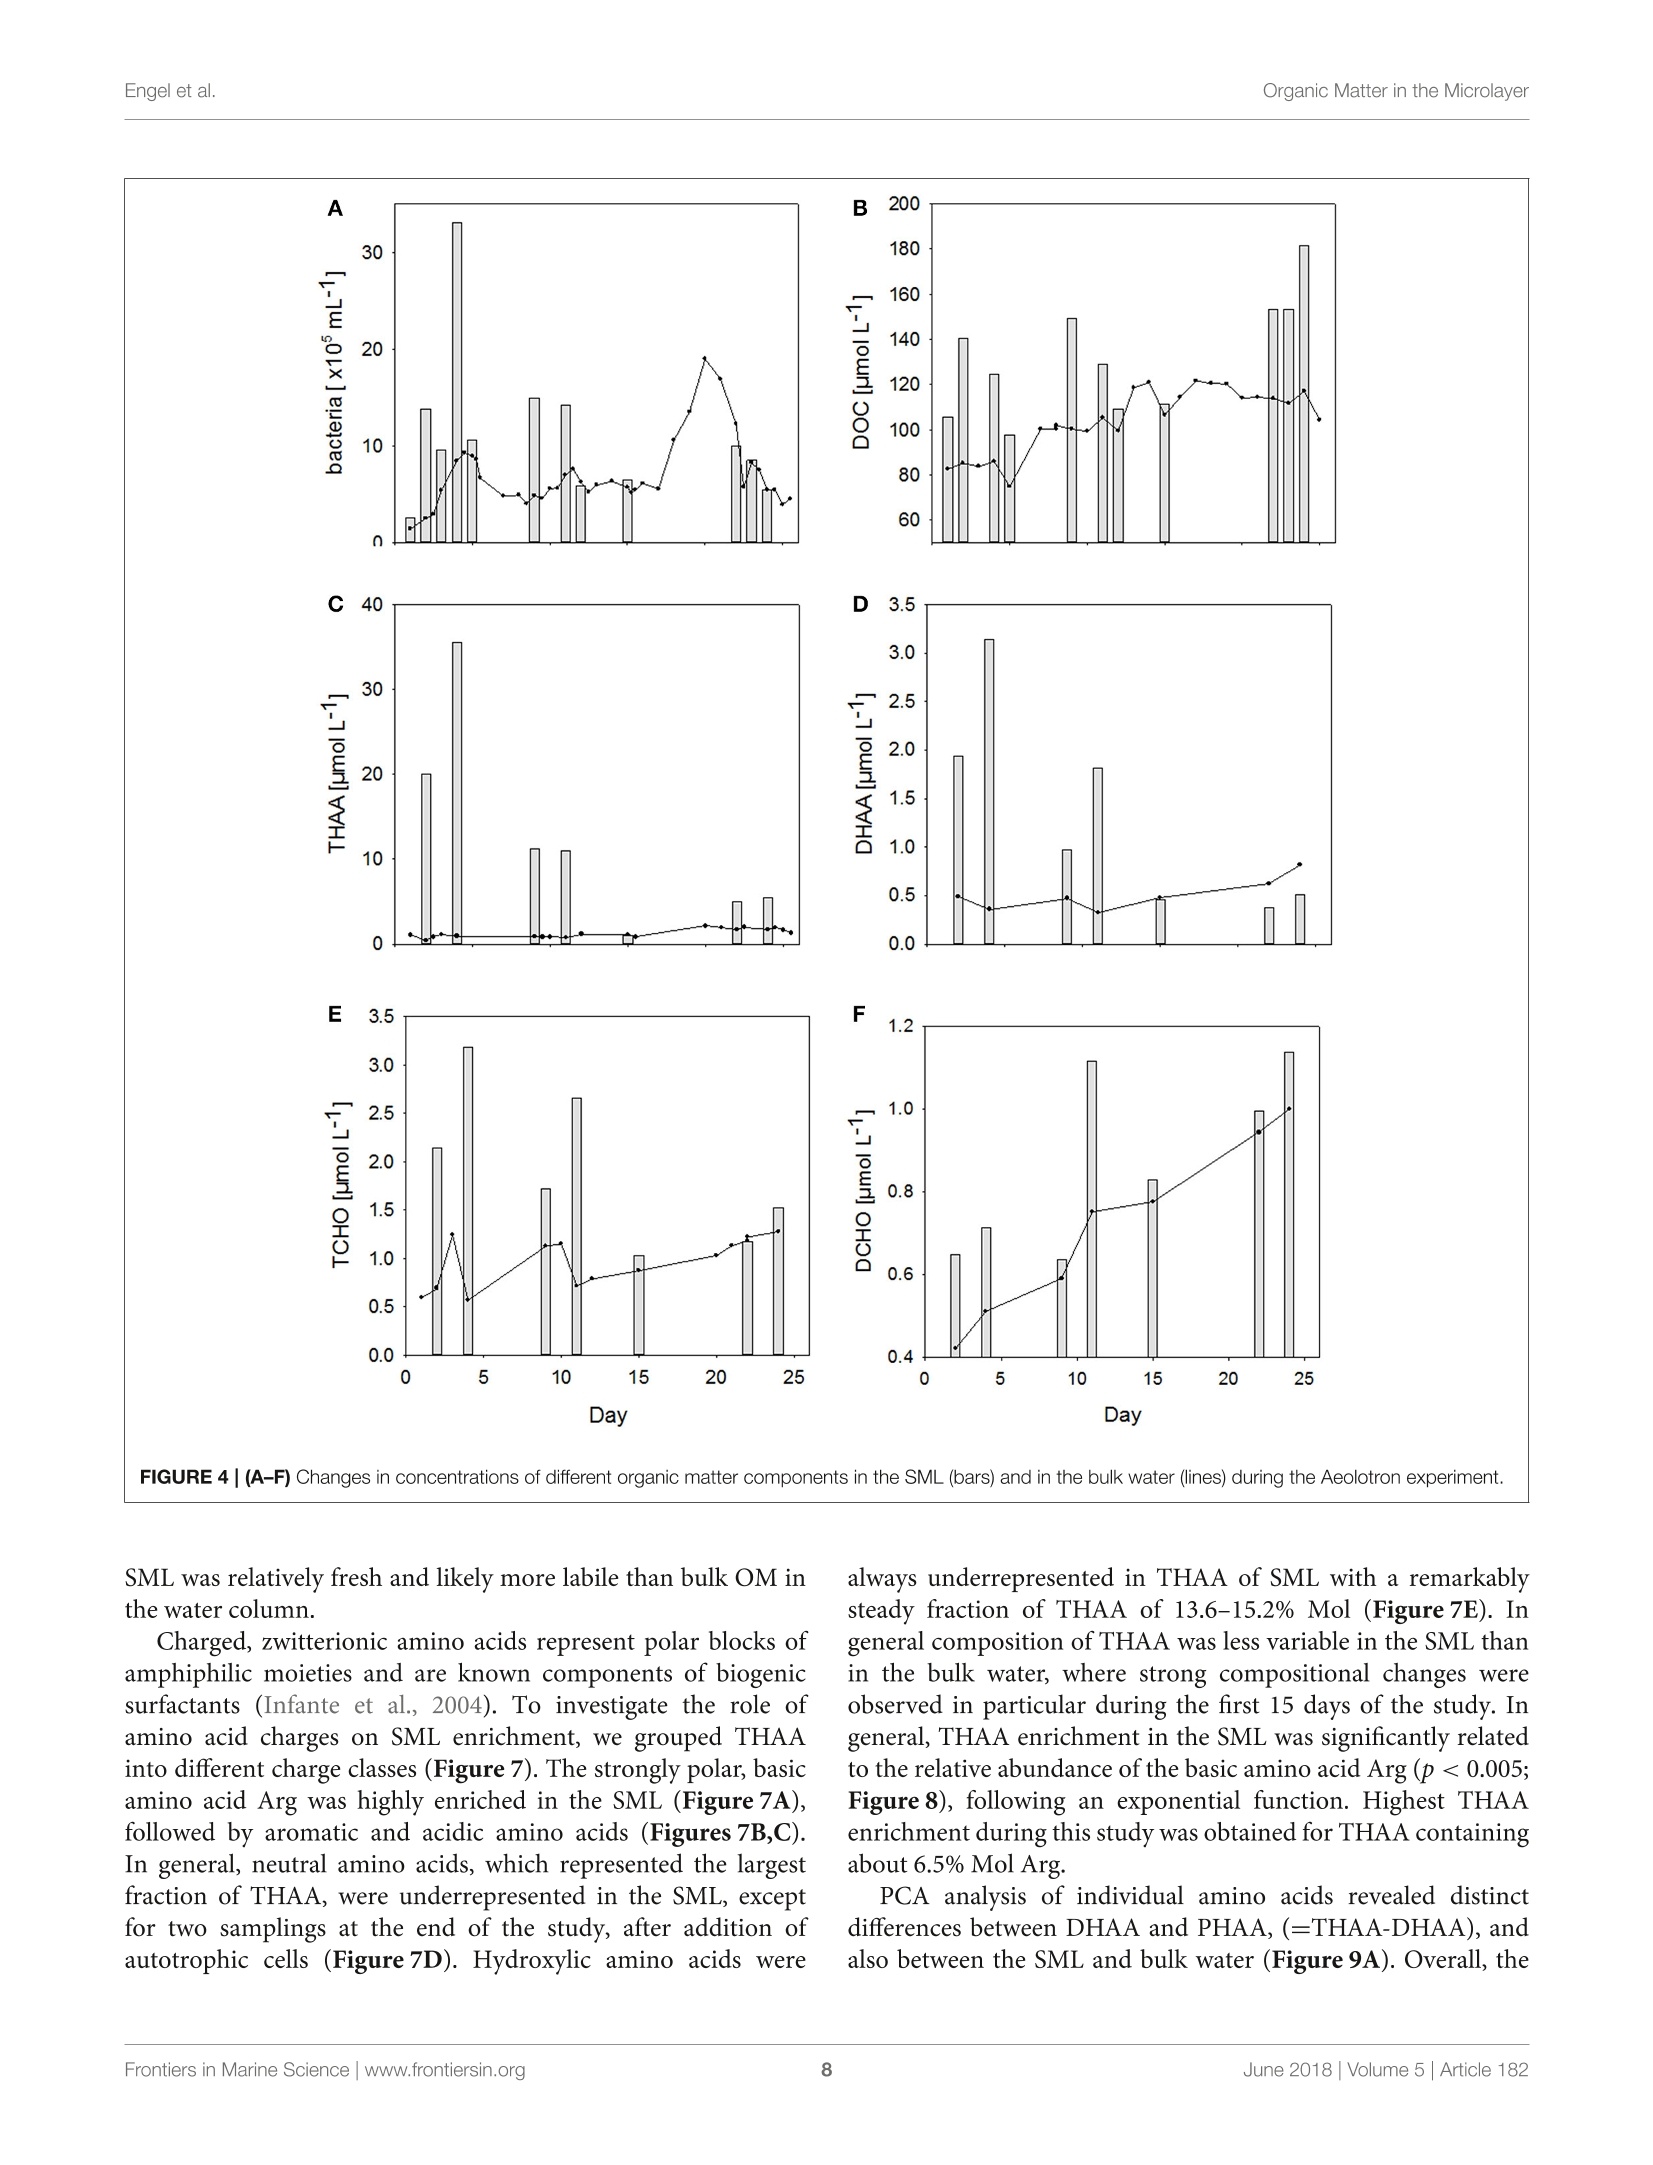
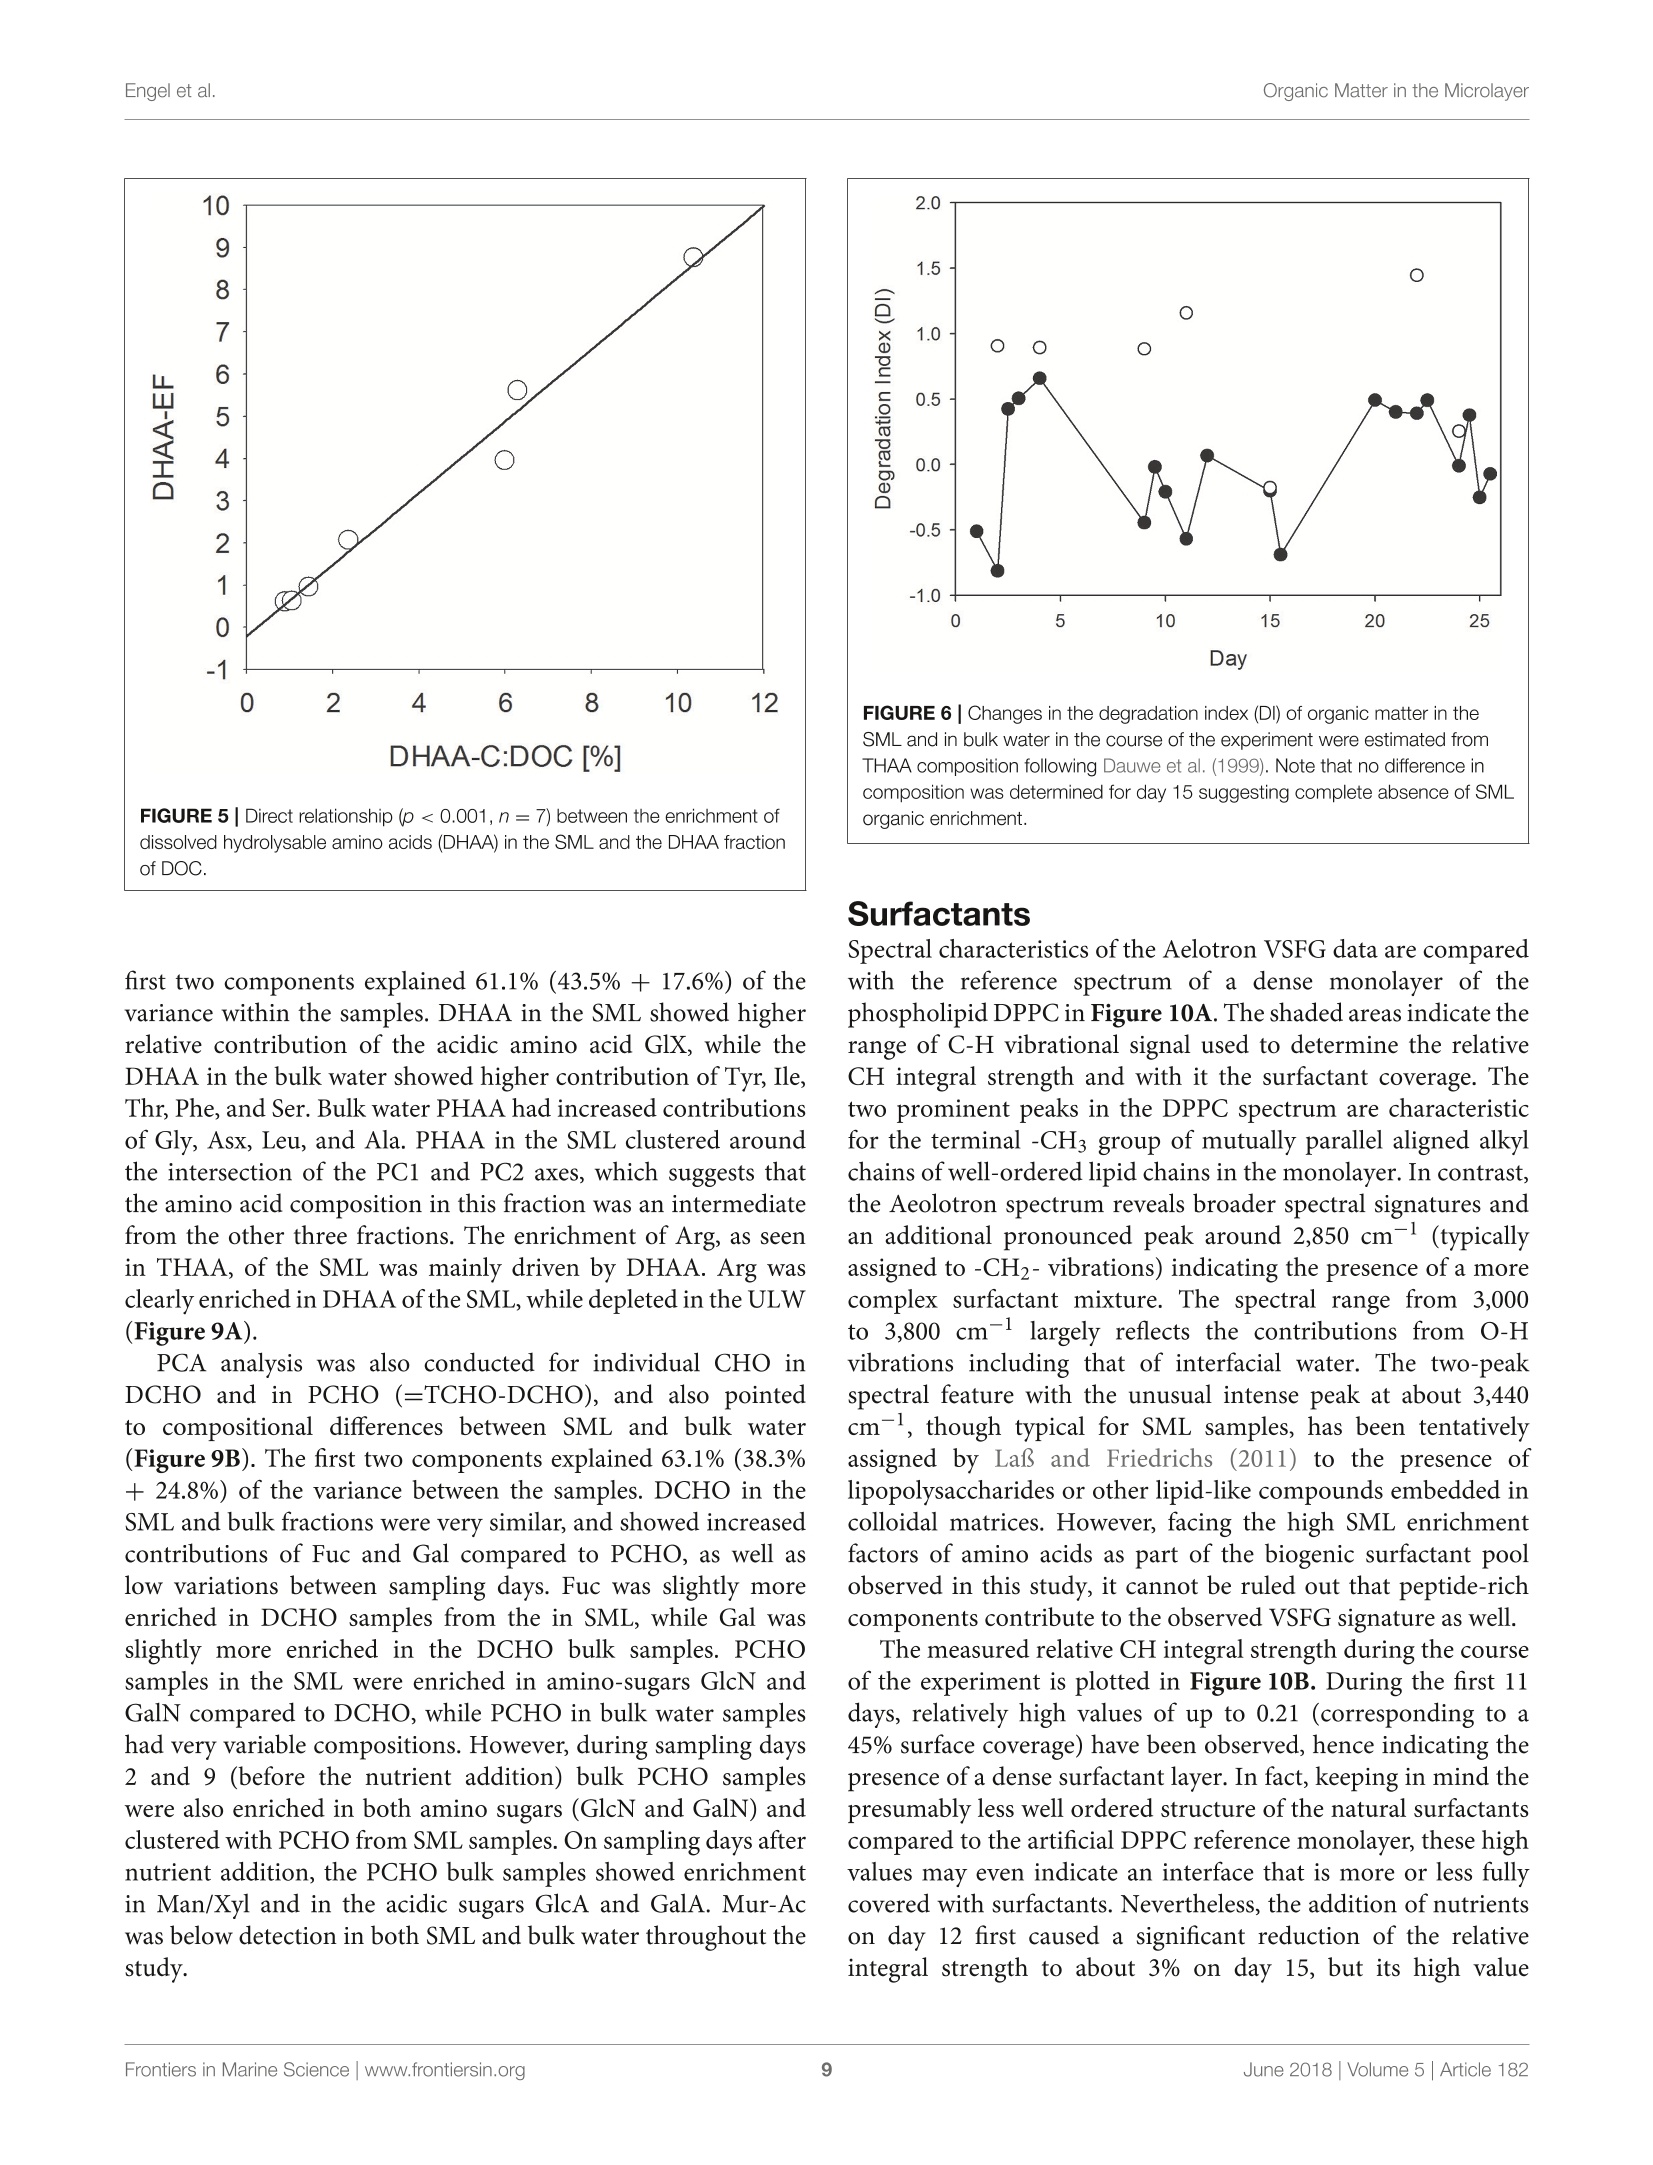
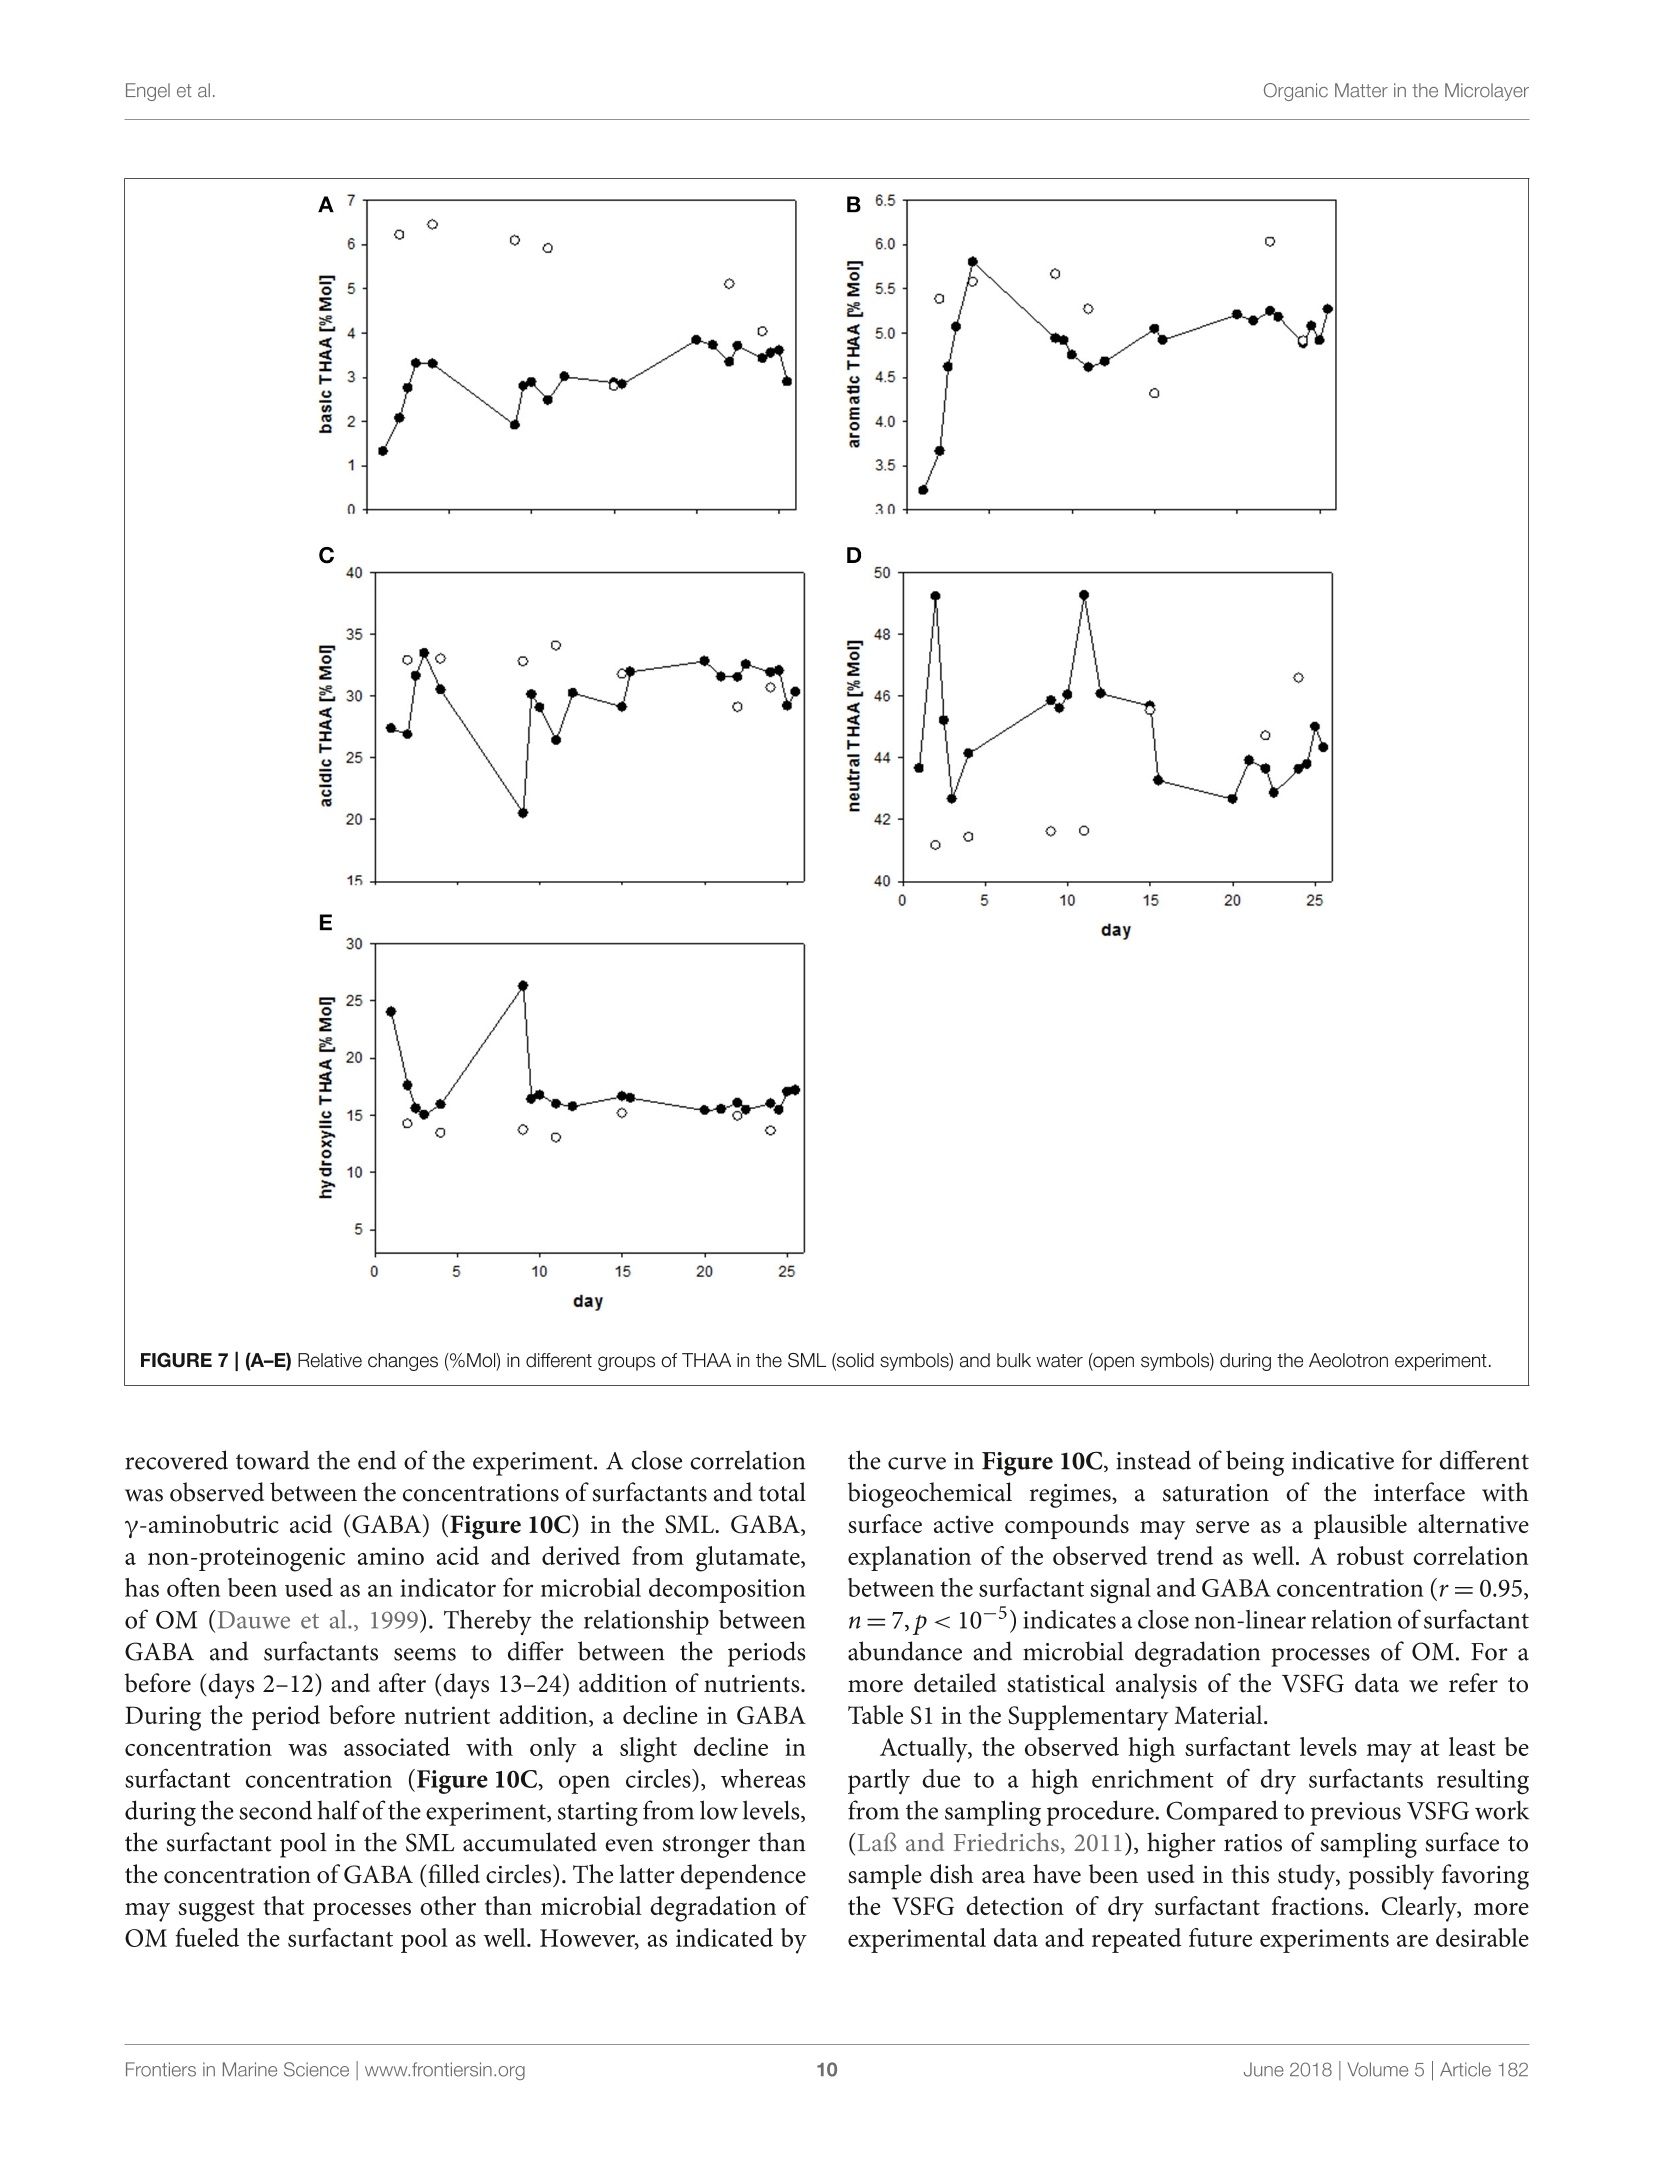
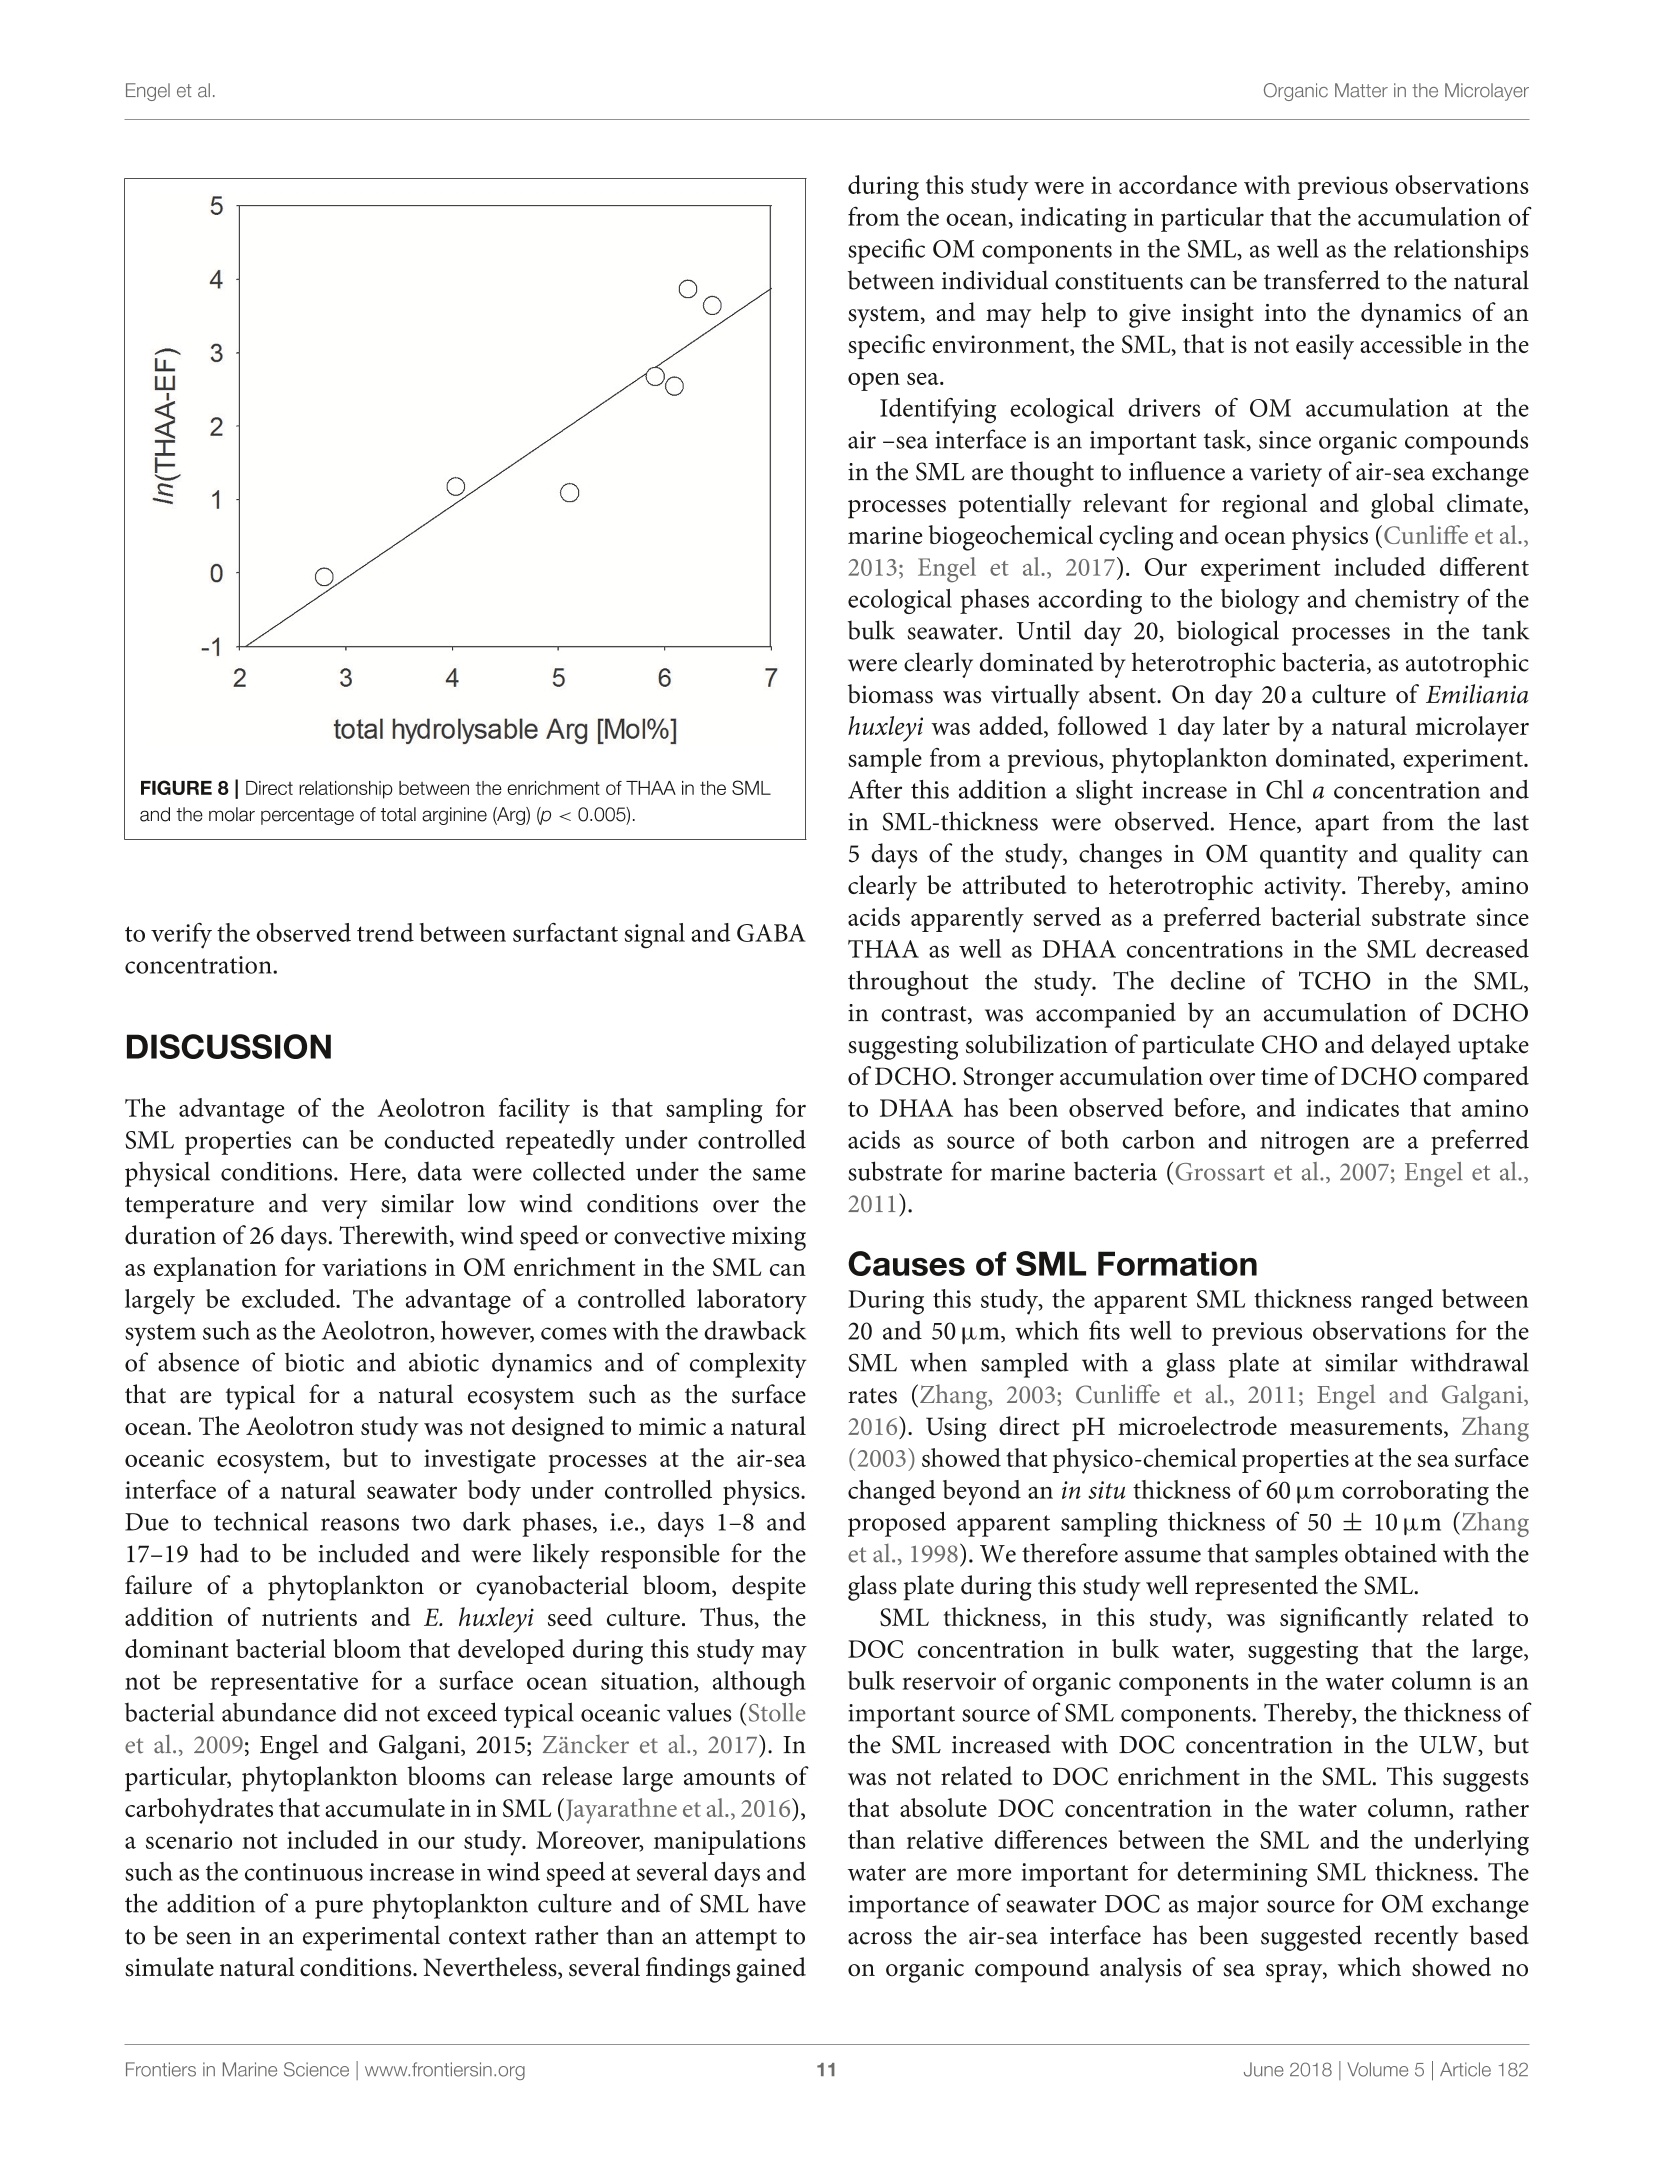
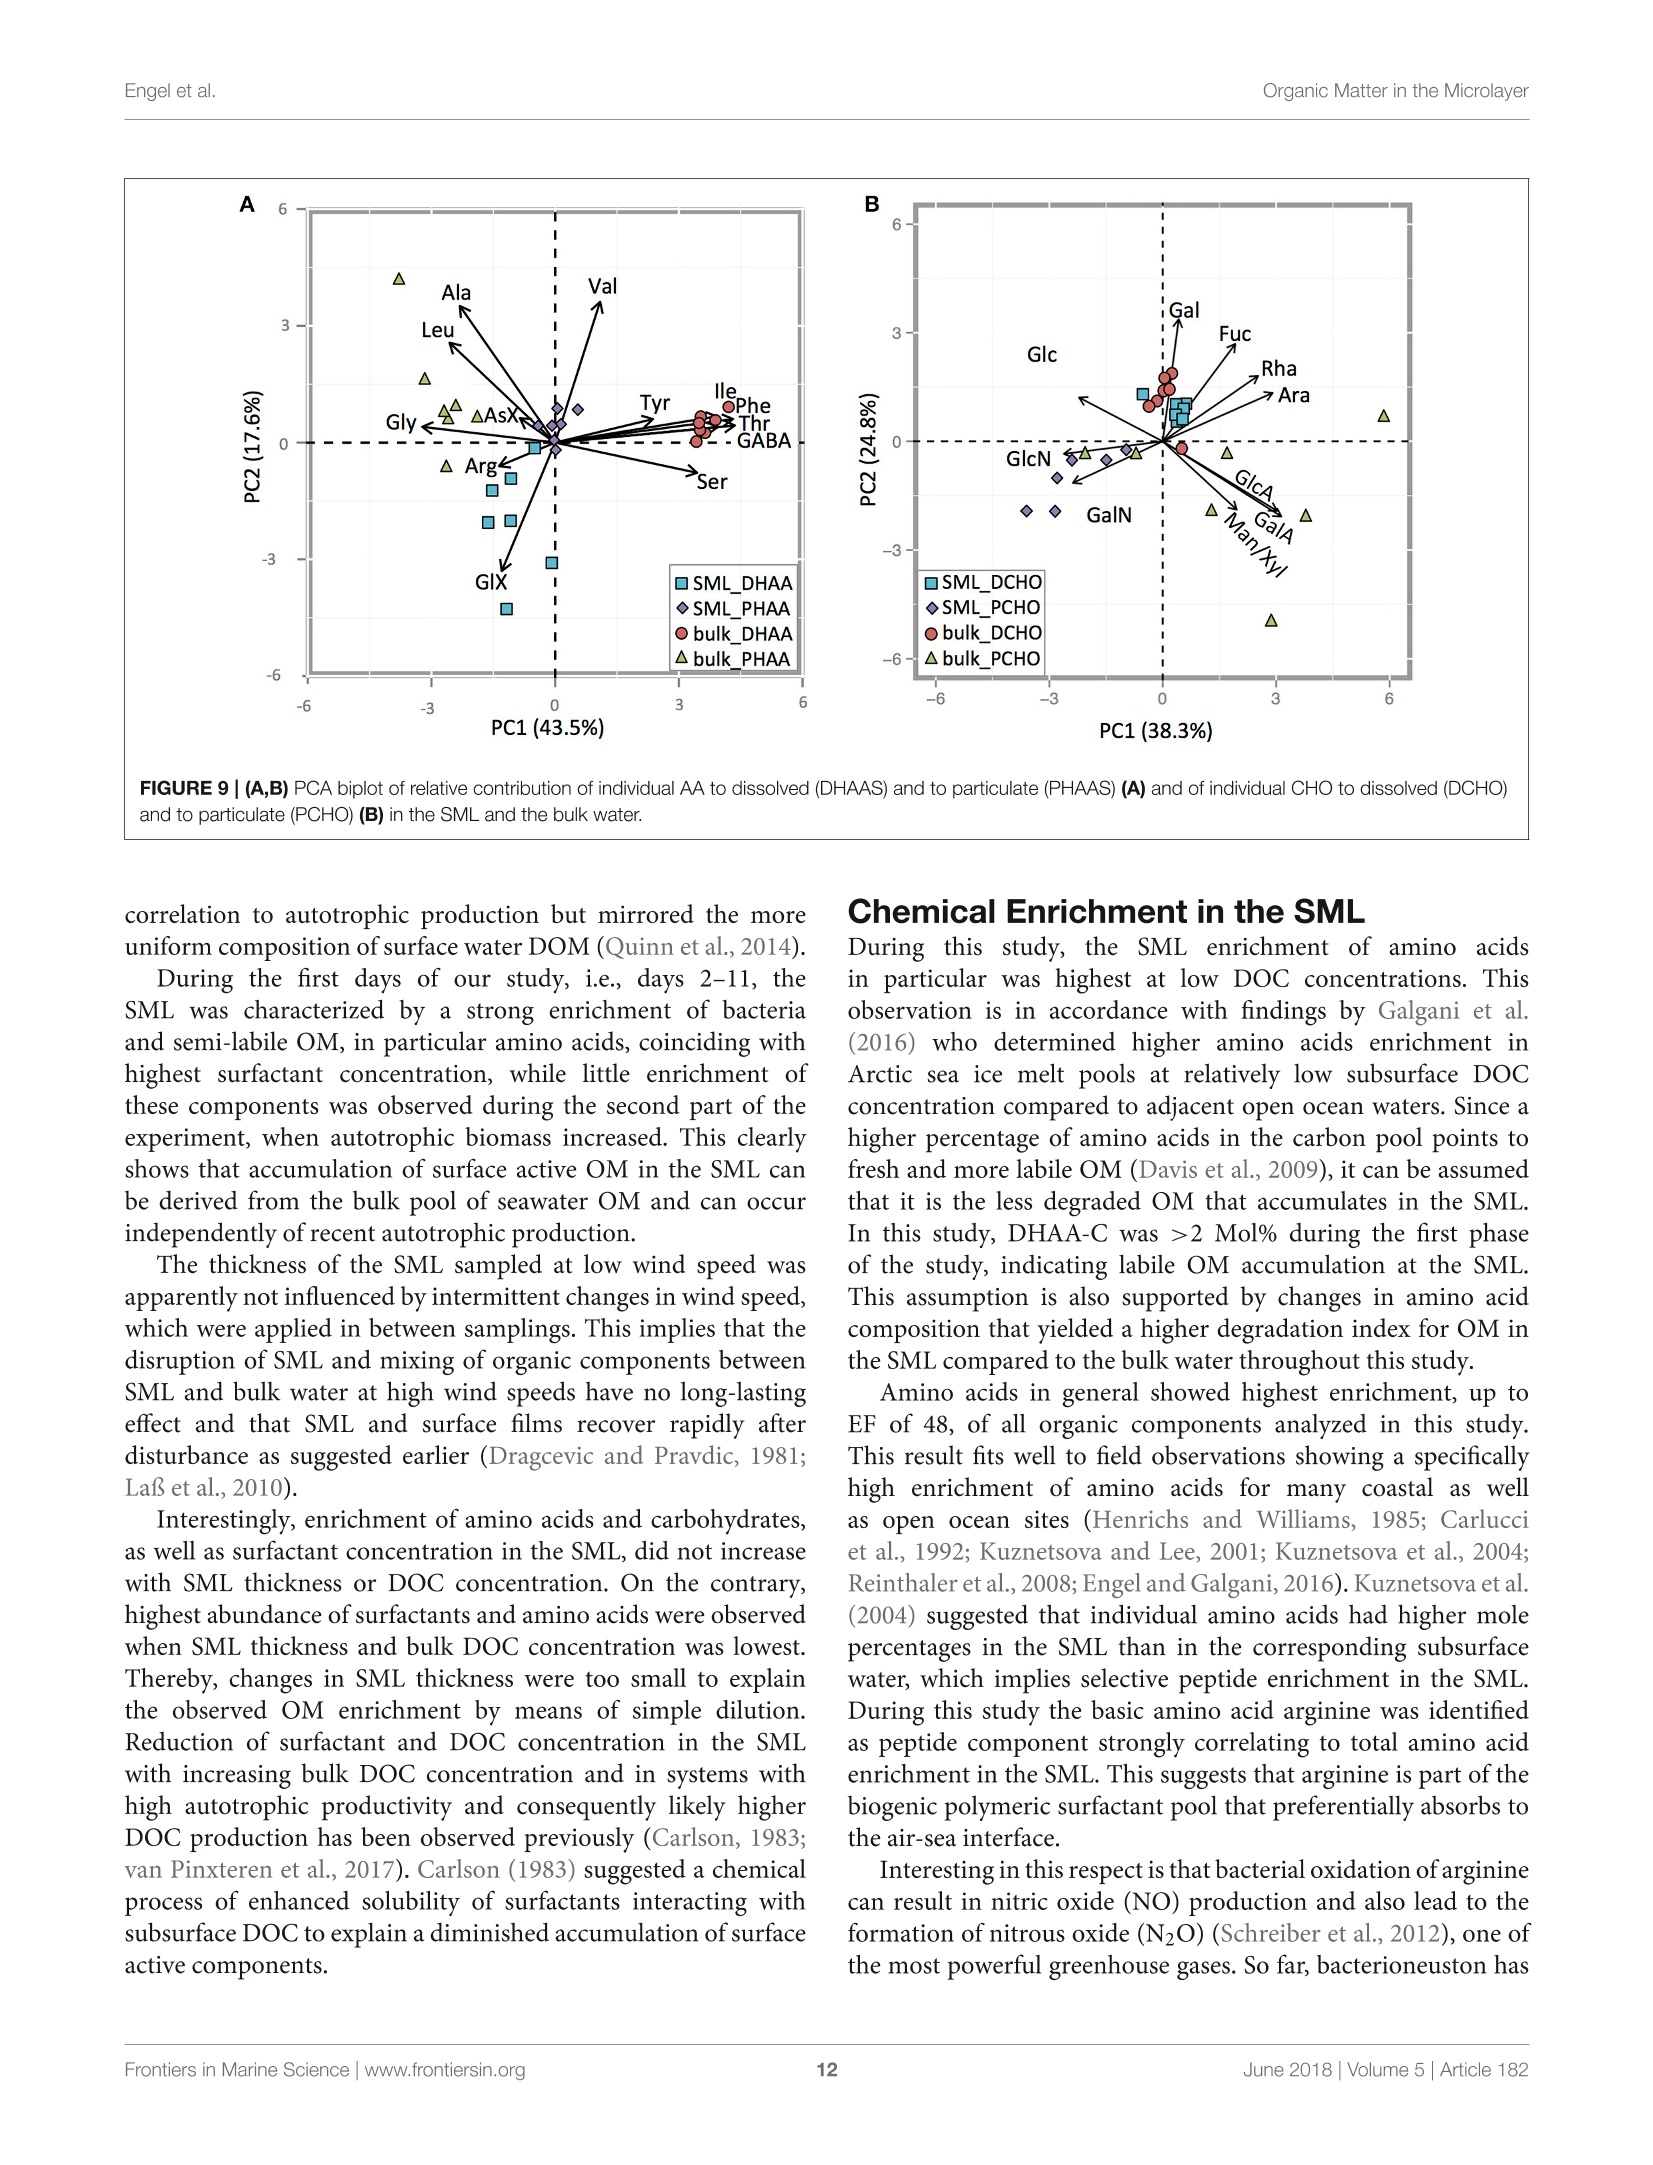
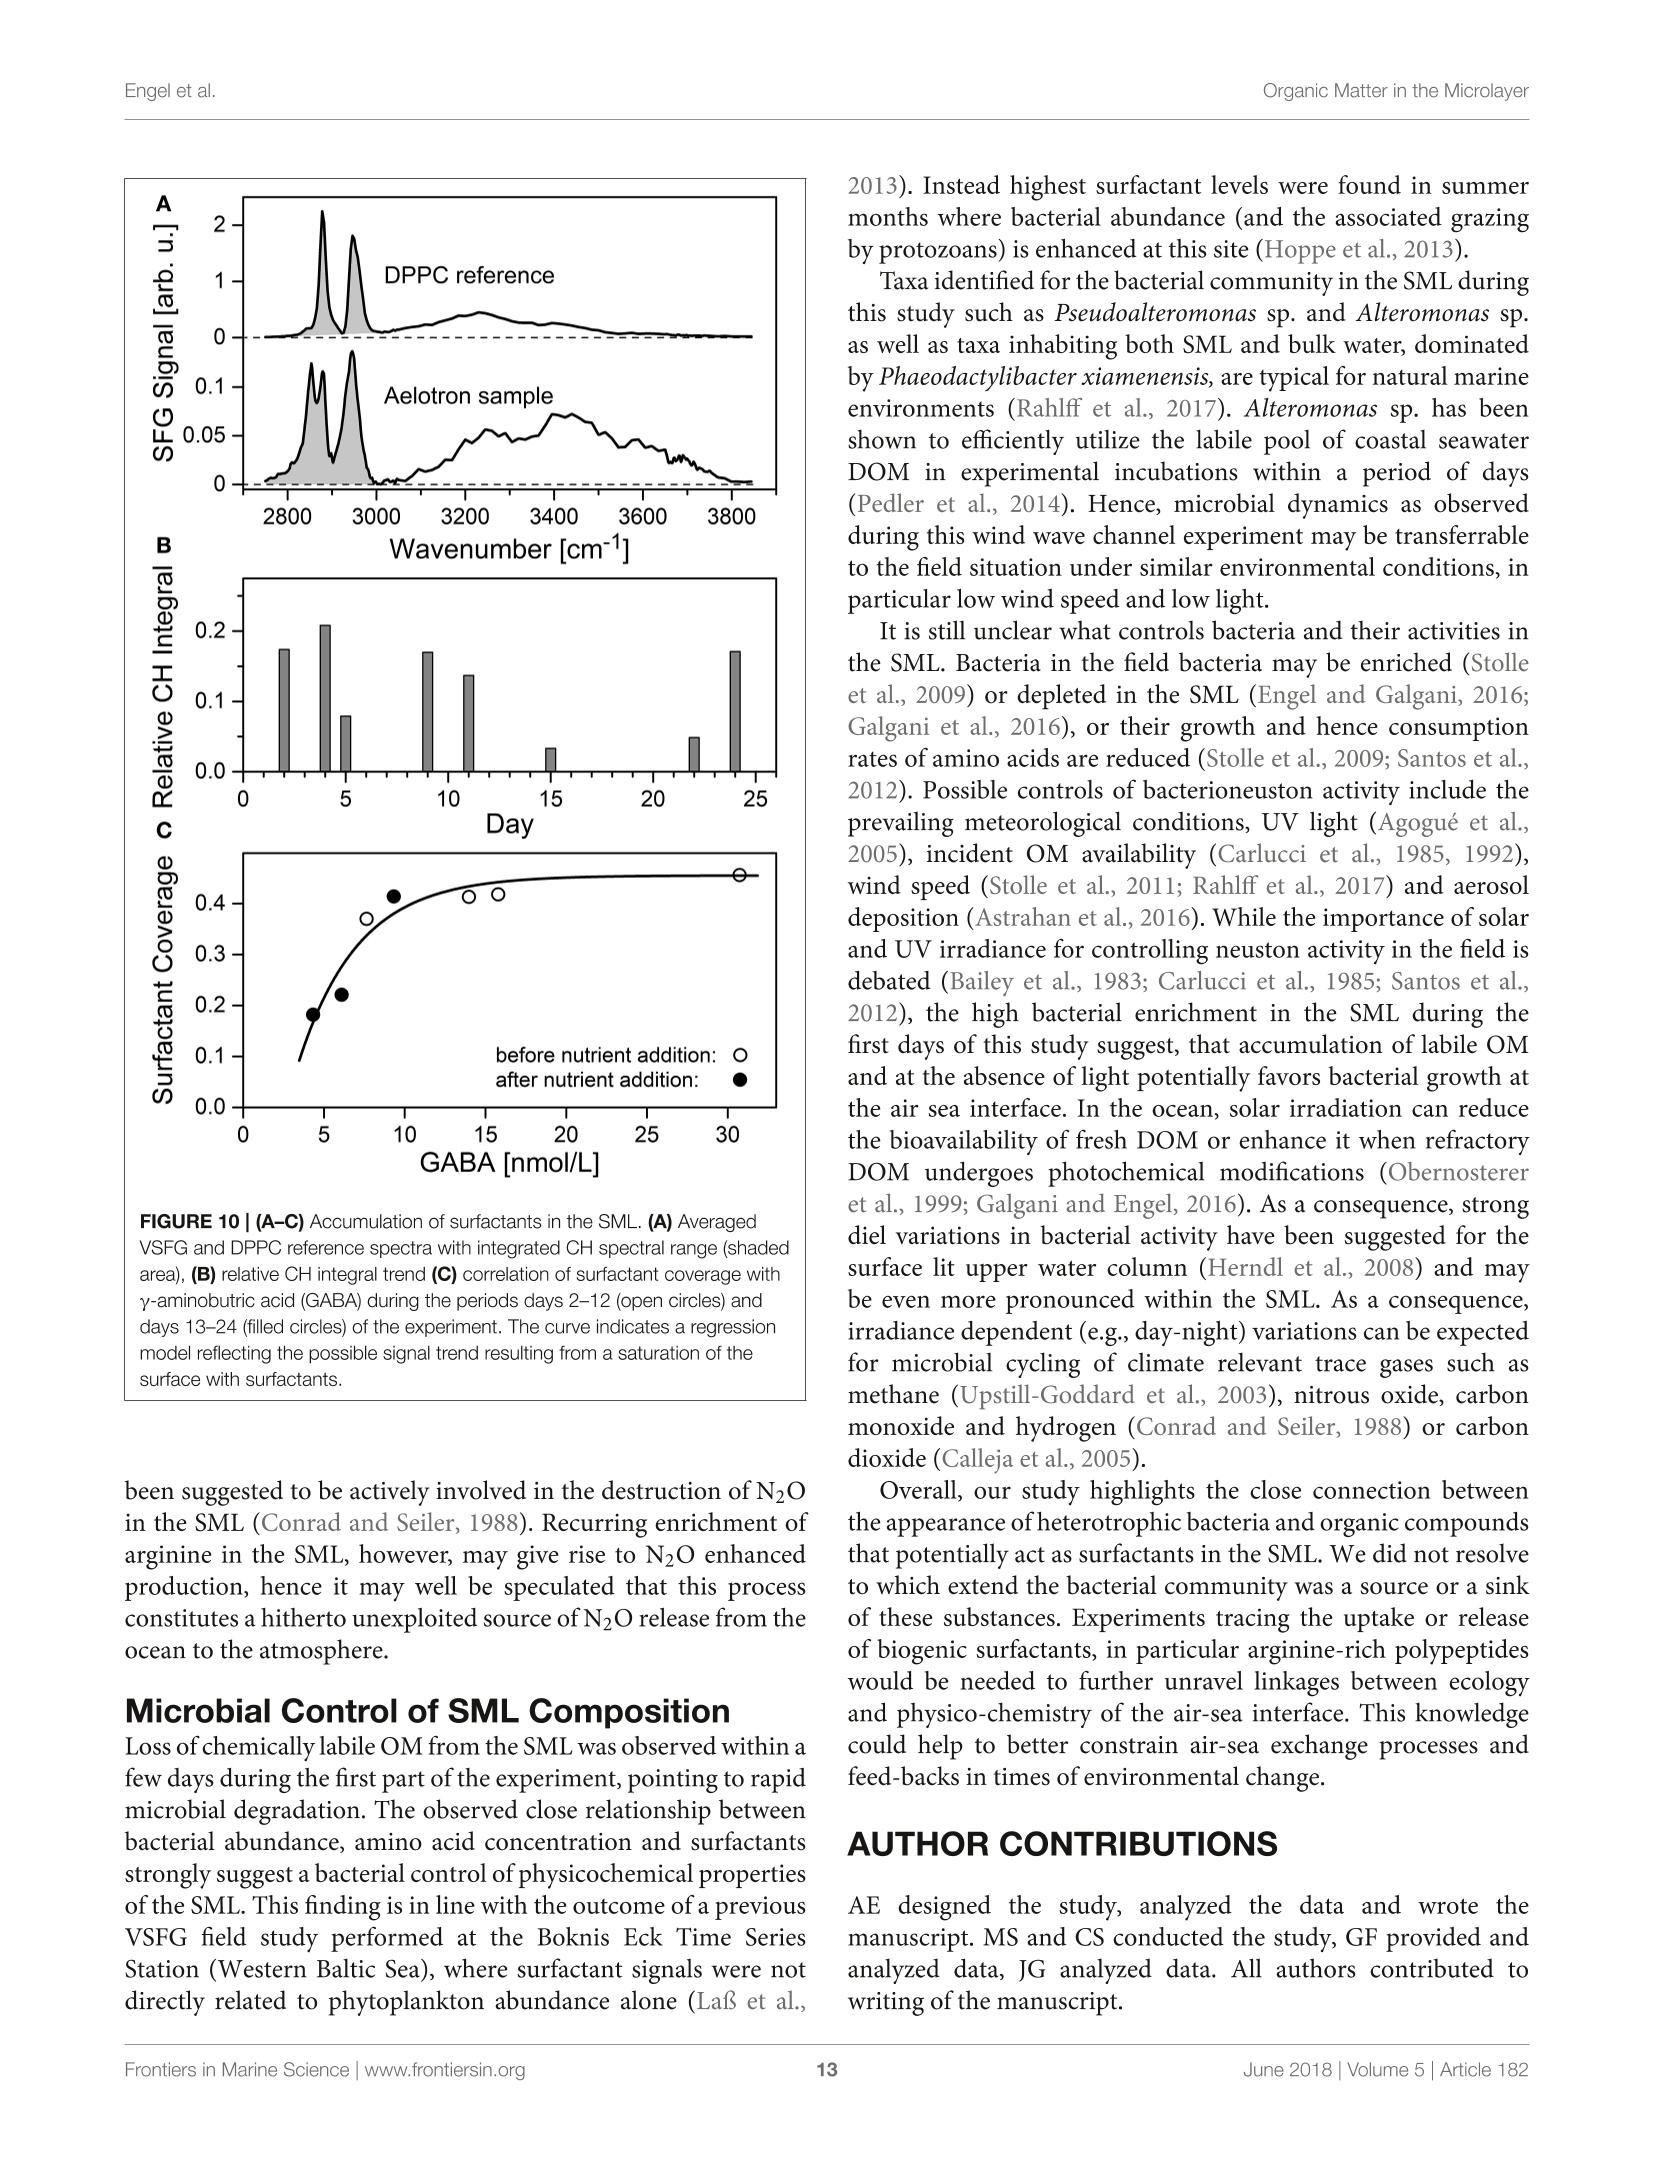
frontiersin Marine Sciencepublished: 05 June 2018doi:10.3389/fmars.2018.00182 Organic Matter in the MicrolayerEngel et al. OPEN ACCESS Edited by: Cecile Guieu, Centre National de la RechercheScientifique (CNRS), France Reviewed by:Marta Plavsic,Rudjer Boskovic Institute, Croatia Elvira Pulido-Villena,UMR7294 Institut Mediterraneend'Oceanographie (MIO), FranceJanina Rahlff. Universitat Duisburg-Essen, Germany *Correspondence: Anja Engelaengel@geomar.de Specialty section: This article was submitted toMarine Biogeochemistry,a section of the journalFrontiers in Marine Science Received: 02 February 2018 Accepted: 07 May 2018 Published: 05 June 2018 Citation: Enge/ A, Sperling M, Sun C, Grosse Jand Friedrichs G (2018) OrganicInsights From a Wind Wave Channel Matter in the Surface Microlayer:Experiment. Front. Mar. Sci. 5:182.doi: 10.3389/fmars.2018.00182 Organic Matter in the SurfaceMicrolayer: Insights From a WindWave Channel Experiment Anja Engel 1*, Martin Sperling, Cuici Sun12,3, Julia Grosse' and Gernot Friedrichs45 'GEOMAR Helmholtz Centre for Ocean Research Kiel, Kiel, Germany,2 State Key Laboratory of Tropical Oceanography,South China Sea Institute of Oceanology, Chinese Academy of Sciences, Guangzhou, China,3 Daya Bay Marine BiologyResearch Station, Chinese Academy of Sciences,Shenzhen, China, 4Institute of Physical Chemistry, Kiel University, Kiel,Germany, 5 KMS Kiel Marine Science-Centre for Interdisciplinary Marine Science, Kiel University, Kiel, Germany The surface microlayer (SML) is the uppermost thin layer of the ocean and influencinginteractions between the air and sea, such as gas exchange,atmospheric deposition andaerosol emission. Organic matter (OM) plays a key role in air-sea exchange processes,but studying how the accumulation of organic compounds in the SML relates tobiological processes is impeded in the field by a changing physical environment, inparticular wind speed and wave breaking. Here, we studied OM dynamics in the SMLunder controlled physical conditions in a large annular wind wave channel, filled withnatural seawater, over a period of 26 days. Biology in both SML and bulk water wasdominated by bacterioneuston and -plankton, respectively, while autotrophic biomassin the two compartments was very low. In general, SML thickness was related tothe concentration of dissolved organic carbon (DOC) but not to enrichment of DOCor of specific OM components in the SML. Pronounced changes in OM enrichmentand molecular composition were observed in the course of the study and correlatedsignificantly to bacterial abundance. Thereby, hydrolysable amino acids, in particulararginine, were more enriched in the SML than combined carbohydrates. Amino acidcomposition indicated that less degraded OM accumulated preferentially in the SML.A strong correlation was established between the amount of surfactants coverageand y-aminobutric acid, suggesting that microbial cycling of amino acids can controlphysiochemical traits of the SML. Our study shows that accumulation and cycling ofOM in the SML can occur independently of recent autotrophic production, indicating awidespread biogenic control of process across the air-sea exchange. Keywords: air-sea interface, dissolved organic carbon,amino acids,carbohydrates, prokaryotes, surfactants INTRODUCTION Wind, waves and temperature are expected to control the exchange of heat, mass and momentumbetween the surface ocean and the lower atmosphere. Besides these physical factors, the thininterfacial layer between the air and the ocean, referred to as sea surface microlayer (SML), hasincreasingly gathered attention in modulating air-sea gas exchange (Upstill-Goddard et al., 2003;Frew, 2005; Cunliffe et al., 2013) as well as for the emission of primary organic aerosols that mayact as cloud condensation nuclei (CCN) in the atmosphere, and even induce ice-crystal formation (Russell et al., 2010; Quinn and Bates, 2011; Wilson et al., 2015).High wind speed conditions typically induce wave breaking andbubble entrainment. When bubbles burst at the sea surface,sea spray emitted to the atmosphere includes organic matter(OM) from the bubble film as well as from the SML. Thismaterial can dry out in air and become nuclei for water vaporcondensation, i.e., marine primary organic aerosol. Biogeniccompounds released by microorganisms inhabiting the SML,referred to as neuston, or inhabiting the water column below,referred to as plankton, can accumulate in the SML andmodify air-sea gas exchange rates in several ways: particulateOM may act as a physical barrier, while dissolved surfaceactive agents (surfactants) may lower the surface tension andthereby damp small capillary waves, subsequently affecting seasurface hydrodynamics (McKenna and McGillis, 2004). Biogenicproduction or consumption of gaseous compounds within theSML can also directly enhance or reduce the air-sea exchangeas demonstrated for CO,H2, CH4, N20 (Conrad and Seiler,1988; Frost, 1999; Upstill-Goddard et al., 2003; Nakajima et al.,2013). Extracellular enzymes that catalyze chemical reactions,such as extracellular carbonic anhydrase that enhances theinterconversion of HCO, and CO2, may be enriched in the SML,resulting in air-sea CO2 fluxes higher than expected from surfacewater carbonate chemistry (Mustaffa et al.,2017). At present, there is little information about the chemicalnature of surfactants in seawater, and how they relate tobiological productivity. Laboratory experiments have suggesteda strong suppression of gas exchange by exudates that arereleased by phytoplankton, such as carbohydrates (Goldmanet al., 1988; Frew et al.,1990), similar to the effect observed forsynthetic surfactants (Bock et al., 1999; Frew, 2005) added toseawater. Other studies have demonstrated that marine bacteriacan be potent producers of surfactants (see review by Satputeet al., 2010). In particular under low wind speed, slick-typeaccumulations of OM in the SML can form and have beenhypothesized to reduce gas exchange rates by 15% (Wurl et al.,2016). Quantifying effects of surface films on gas-exchange inthe ocean, however, remains challenging due to a high spatialand temporal variability in the total amount of surfactants andin the chemical composition of the SML (Engel et al., 2017)Moreover, surfactant accumulations, visible as slicks, tend todissipate quickly under turbulent conditions (Frew et al., 1990;Bock et al., 1999). Organic components in the SML are furthermore expectedto chemically interact with compounds entering the ocean viathe atmosphere such as nutrients and dust (Astrahan et al.,2016). Organic macromolecules in the SML are known to formcomplexes with trace metals and may thus bind metal ions fromatmospheric depositions, e.g.,iron, before these enter deeper intothe water column (Hardy et al., 1985).Moreover, heterogeneousoxidation processes as well as surface specific photosensitizedreactions can transform OM into volatile compounds (Carpenterand Nightingale, 2015; Ciuraru et al., 2015). Hence, OM in theSML plays a pivotal role in exchange processes between theocean and atmosphere under a wide range of physical conditions,including low as well as high wind speeds. Due to frequent variations in environmental conditions, suchas in wind speed, precipitation, solar radiation, temperatureand waves, the current understanding of processes controllingthe chemical and biological composition of the SML in marineenvironments is rather poor. How accumulations of specificorganic components in the SML relate to biological processes inthe water column is largely unknown. Despite the fact that theSML is a distinct habitat for neuston species living preferentiallyat the air-sea interface, it is clearly linked to the chemistry andbiology of the underlying water (Kuznetsova and Lee, 2001;Matrai et al., 2008; Lindroos et al., 2011). Previous studiesshowed that the accumulation of some organic components,such as carbohydrates, transparent exopolymere particles (TEP)and cell abundances in the SML can be directly related to theirabundance in the surface water column(Wurl et al., 2011a; Engeland Galgani, 2016; Galgani et al.,2016). A coupling betweenautotrophic production in the water column and accumulationof OM in the SML could explain high organic aerosol emissionover the ocean at times of phytoplankton blooms (O’Dowdet al., 2004). Especially under calm weather conditions, algaecan accumulate and influence OM composition in the SML(Joux et al., 2006). Other studies reported that the high organicenrichment in aerosols can be correlated to the abundance ofheterotrophic bacteria and to dimethyl sulfide concentrationas an indicator for oxidative stress and phytoplankton celllysis (Bates et al, 2012; Prather et al., 2013). Earlier studieson visible surface films, i.e., slicks in coastal areas suggestedthat systems with high productivity supported by eutrophicconditions, favor SML formation with consequences for air-seaexchange processes (Frew, 2005). More recent studies insteademphasized a global pattern of OM enrichment in the SML,with surfactant activity in the open ocean being comparableto coastal sites even at high wind speed (Wurl et al., 2011b;Sabbaghzadeh et al., 2017; van Pinxteren et al., 2017).Hence,evidence from field studies on what controls SML formationand composition, and how variations in SML characteristicmay influence air-sea exchange processes is sporadic and ratherconflicting. In order to investigate air-sea exchange processes undercontrolled wind conditions for seawater containing biogenicmatter in both dissolved and particulate form, as well as tobetter understand influences of changes in seawater biologyand chemistry on1 aair-sea exchange processes, the SOPRANAeolotron study was conducted in 2014. The Aeolotron at theUniversity of Heidelberg, Germany, is a large scale facility thatincludes an annular wind wave channel, where a wind speed(U10, scaled to the reference height of 10m) of up to 20 m scan be realized (Nagel et al., 2015). Here, we report on theaccumulation of organic components in the SML associatedwith heterotrophic and autotrophic microbial communities atlow wind condition (U1o: 1.3-1.5 m s-) and over severaldays. Particular attention was paid to biopolymers that havebeen suggested to affect air-sea exchanges processes, includinghydrolysable amino acids, high molecular weight combinedcarbohydrates and surfactants. MATERIALS AND METHODS Seawater Collection and Transport 22,000 L of sea water were collected in September 2014 by the RVPoseidon: about 14,000L were collected at 55 m depth near theSula Reef Complex in the North Atlantic (64°4,90'N8°2,03’E),an additional 8,000 L were collected from a surface water sourceat 5 m depth near the Island of Sylt in the German Bight, NorthSea. The water from both sources was mixed and stored in theship’s seawater tank in the dark until the end of the cruise. Inhome port, the water was pumped into a clean (“food safe") roadtanker on the 22.09.2014 and was simultaneously filtered througha rough gravel filter to remove larger particles. The water wasunloaded at the wind wave facility Aeolotron in Heidelberg thefollowing day and stored in the dark and cool (~10°C) until thestart of the experiment. Experimental Conditions and Treatments The Aeolotron is a circular tank facility, 8.68 m inner diameter,0.61 m width, and about 17.9 m’ water volume when filled tol m height. Total surface area of still seawater in the tank is18.4 m2. More detailed description of the facility is given byKrall (2013) and by Nagel et al. (2015). On November 3rd 2014(day 1) the experiment started. However,due to a break in thebubble generator, seawater was fully drained from the system onNovember 5th (day3) and refilled the same day. Sampling ofchemical and biological development in the bulk seawater andin the SML was conducted until November 27 (day25). Seawatertemperature over the course of the experiment was about 21°C. To assess variations in the composition of the SML in responseto environmental changes, we modified light, nutrients, andphytoplankton abundance during the study. In addition, SMLpreviously collected during a phytoplankton bloom experimentwas added to simulate slick coverage. A timeline of the study andof experimental interventions is given in Figure 1. Light sources were operated over the tank between days9 and 16 and days 20 and 25, with a light:dark cycle of 11h:13 d. When the light was switched on, Photosynthetically ActivePhoton Flux Density (PFD) at the water surface was about 115-120 umol m-2s- over about 20 m of the tank perimeter, theremaining about 20 umol m-s-1. The water inside the tankwas well mixed and circulated during daytime throughout the experiment by wind driven currents and bubbling, carried out ondays 2, 4, 5, 9, 11, 15, 22, and 23. At the evening of day 12, inorganic nutrients were added to thetank to increase the concentrations of nitrate (NO3) and silicate(SiO4) and phosphate(PO4) to 14.7, 9.5, and 0.48 umol L-,respectively. About 800 mL of a culture of Emiliania huxleyi(cell density: 4.6 × 10⁵ cells ml-l) was added on day 20 toinduce phytoplankton growth and exudation. In addition, 6 L ofbiogenic microlayer from a previous phytoplankton mesocosmexperiment, which had been stored frozen at -20°for about 6months was added on day 21. Wind in the air space (24.4 m) above the water was generatedby two axial fans mounted diametrically in the ceiling of theair space of the flume. During the Aeolotron study a total of9 wind experiments were conducted, with stepwise increase inwind speeds (U10) ranging from 1.4 to 23.7 m s 1. Followingthe highest wind speed, bubbling of seawater was induced for1 h to simulate wave breaking. Bubbles were generated with aprofiO2 oxygen diffuser hose. About 54 meters of this tubingwere installed at the bottom of the wind-wave channel and wereoperated with an over pressure of around 900 mbar with air takenfrom the air space of the Aeolotron at a flow rate of around100 L per minute. Results of the wind experiments, e.g., on gasexchange and surface dynamics, will be reported elsewhere. Sampling The SML inside the wind wave channel was sampled on 12days applying the glass plate technique (Harvey and Burzell,1972), described in more detail by Engel and Galgani (2016) andsummarized here briefly. An acid (HCl 10%) and Milli-Q cleanedplate of 500 × 200 × 5 mm made of borosilicate glass and withan effective sampling surface area of 2,000 cm²(considering bothsides) was inserted into the water perpendicular to the surfaceand withdrawn at a rate of ~20cm s-. For each sample, thisprocedure was repeated between 23 and 48 times and the exactnumber of dips and total volume of water were recorded. Thesamples were directly filled into an acid (HCl 10%) and Milli-Qcleaned borosilicate glass bottle, pre-rinsed with about 20 mL ofsample. All SML samples reported in this study were collected in themorning at low wind speed (u10, representing the calculated withspeed 10 m above the water surface) of 1.3-1.5 m s-. Bulk water FIGURE 1|Timeline of activities carried out during the Aeolotron experiment in 2014. Filled boxes: no light, open boxes: light, diagonal lines: SML sampling, circles:wind experiments, crossed circles: wind and bubbling experiments. Indicated are also the days when nutrients, a culture of Emiliania huxleyi or a SML sample from aprevious phytoplankton bloom experiment were added. was sampled at least once a day; i.e., always in the morning and atlow wind speed, and occasionally also in the evening, except forday 6. Bulk water samples were collected from an outlet at about50 cm depth equivalent to half the height of the water columnSamples of about 500 mL were filled into an acid (HCl 10%) andMilli-Q cleaned borosilicate glass bottle, pre-rinsed with about20 mL of sample. Analysis of Chemical ParametersInorganic Nutrients Nitrate, silicate and phosphate in bulk seawater were analyzedaccording to Hansen and Koroleff (1999). Twenty five millilitersamples were filtered in duplicate with 0.2 um syringe filters andstored frozen at -20°C until analysis on a spectrophotometer. Particulate Organic Carbon (POC) and ParticulateNitrogen (PN) Between 200 and 400 mL of bulk seawater were filtered (<200mbar) in duplicate, onto combusted (8h at 500°C) GF/Ffilters (Whatmann, 25mm) and stored frozen (-20°C) untilanalysis. To remove carbonate, filters were exposed to fuminghydrochloric acid in a fuming box for ~12h and driedsubsequently (60°C, 12 h). Filters were wrapped in tin cups andmeasured using an Euro EA elemental analyzer calibrated withan acetanilide standard. Dissolved Organic Carbon (DOC) For DOC, samples (20 ml) were collected in duplicate fromthe SML and bulk water, filtered through combusted (8h,500°C) GF/F filters and filled into combusted (8h, 500°C)glass ampoules. Samples were acidified with 80 pL of 85%phosphoric acid, heat sealed immediately, and stored at 4°Cin the dark until analysis. DOC samples were analyzed byhigh-temperature catalytic oxidation (TOC-VCSH, Shimadzu)modified from Sugimura and Suzuki (1988) and as described inmore detail in Engel and Galgani (2016). Total Dissolved Nitrogen (TDN) TDN was determined with the TNM-1 detector on the Shimadzuanalyzer. Here, nitrogen is combusted and converted to NOx,which chemiluminesces when mixed with ozone and detectedusing a photomultiplier (Dickson et al.,2007). Calibration was.done every 8-10 days with standard solutions of potassiumnitrate Suprapur@ (Merck 105065) yielding 0, 100, 250,500,and 800 ug N L-1. On every measurement day deep seawaterreference (DSR) material (Consensus Reference Materials Projectof RSMAS, University of Miami) was used, yielding values withinthe certified range of 31-33 umol N L-. Chlorophyll a (Chl a) Chl a was determined in duplicate from bulk seawater (200-400 mL), filtered onto GF/F filters (25 mm). Filters were placedin the dark immediately after filtrations and stored at-20°Cuntil analysis. Chl a was determined after extraction with 10 mLof acetone (90%) on a Turner fluorimeter after Welschmeyer(1994). Spinach extract standard (Sigma Aldrich) was used forcalibration. Phyto- and Bacterioplankton/ Neuston Autotrophic cells <20 um, and heterotrophic bacteria werecounted by flow-cytometry ona FACSCalibur (BectonDickinson) using BD CellQuest Pro-Software as describedin more detail by Engel and Galgani (2016). Duplicate 4mLsamples were fixed with 200 uL glutaraldehyde (5% finalconcentration). Samples for autotrophic cells were stored at-80°C those for bacteria at -20°C until enumeration. Prior tocounting, bacteria were stained with SYBR Green I (MolecularProbes). Samples from the SML were collected on days 1, 2, 3,4,5, 9, 11, 12, 15,22, 23, and 24. Total and Dissolved Hydrolysable Amino Acids Totalhhydrolysableamino acids (THAA))aand dissolvedhydrolysable amino acids (DHAA)) were determined frombulk water and on 7 sampling days from the SML using a1260 HPLC system (Agilent), following the methods describedby Lindroth and Mopper (1979) and Dittmar et al. (2009),with modifications as described in Engel and Galgani (2016).Duplicate samples (5 ml) were filled into pre-combusted glassvials (8h, 500°C) and stored at -20°C until analysis. For DHAA,samples were first filtered through 0.45 um Millipore Acrodiscsyringe filters. Samples from the SML were collected on days 2, 4,9, 11, 15,22,and24. A measure for the diagenetic state of OM is the amino acid-based degradation index (DI) (Dauwe and Middelburg, 1998;Dauwe et al.,1999). For the calculation of DI from THAA in thisstudy, mole percentages of amino acid were standardized usingaverages, and standard deviations and multiplied with factorcoefficients as given in Dauwe et al. (1999) based on PrincipalComponent Analysis. DI values often range between +2 and -2,with lower values indicating more degraded, higher values morefresh organic material. Total and Dissolved Combined Carbohydrates Totaland dissolved hydrolysable carbohydrates >1 kDa(THCHO and DHCHO) were determined from duplicate bulkseawater and on 7 sampling days from SML samples applyinghigh performance aniG..0on. exchange chromatography coupled withpulsed amperometric detection (HPAEC-PAD) using a DionexICS 3000, following the method by Engel and Handel (2011) withmodifications as described in Engel and Galgani (2016). Samplesof 20 mL were filled into pre-combusted glass vials (8 h, 500℃)and kept frozen at -20°C until analysis. Samples from the SMLwere collected on days 2, 4,9, 11, 15, 22,and 24. Surfactants Duplicate SML samples of about 50~mL were collected on 8days, transferred into polypropylene bottles and immediatelyfrozen at -40°C for transport and stored at -79°C priorto analysis by vibrational sum-frequency generation (VSFG)spectroscopy using a commercial picosecond VSFG spectrometer(EKSPLA, 532 nm up-conversion) as described elsewhere (Laland Friedrichs, 2011). The use of VSFG spectroscopy forenvironmental surfactant analysis has been introduced by LaBet al. (2010) and the interpretation of the measured spectra interms of surfactant abundance has been outlined and discussed in some detail in Laf and Friedrichs (2011) and Laf et al.(2013). Non-linear VSFG provides surface-specific infraredspectra of the molecular nanolayer, i.e., the signal arises fromthe molecules residing directly at the interface. The VSFG signalinter (B×N),reflects the averaIvSFG (B×N)ge molecularhyperpolarizability β of N probed surface oscillators. In general,due to the additional orientation sensitivity of the VSFG signal,Bis a parameter that is also dependent on N itself. However,as β has been found in our previous study to be approximatelyconstant for marine water samples (Laf and Friedrichs, 2011),lysFG can be directly taken as a qualitative measure of surfactantsurface concentration CSurfactants, with √IvsFG CSurfactants. Asan operational definition of surfactant abundance or coverage itis useful to report the measured intensities relative to the intensityobtained for a well reproducible reference. Here, a densely packedmonolayer of the phospholipid DPPC (dipalmitoyl-sn-glycero-3-phosphocholine) at a surface concentration corresponding to20 A2 per lipid chain has been used. Surfactant abundance isreported by means of the square root of the ratio of the integralVSFG intensities over the spectral range from 2,750 to 3,000cm-1. This spectral range corresponds to C-H vibrations mainlyrelated to the CH2 and CH3 groups of lipid alkyl chains. Tothis ends, the plotted surfactant value can be understood as ameasure of the surfactant coverage, e.g., a value of 0.25 simplyimplies a 25% coverage. However, facing the rough assumptionsand approximations made for the data reduction, one should beaware of the still qualitative nature of this measure. Also notethat the absolute surfactant signal is dependent on the wet-to-dry surfactant ratio in the sample, with wet surfactants reportedto dominate the surfactant pool (Baier, 1972; Laf and Friedrichs,2011; Cunliffe et al., 2013; Laf et al., 2013). Dry surfactants (suchas simple fatty acids, phospholipids, etc.) accumulate at the water-air interface and hence their signal contribution depend on theratio of the sampled water surface and the used surface area ofthe spectrometer dish (about 0.12 m’vs. 37 cm²) as well as ontheir transfer efficiency which is limited by wall adsorption losses.In contrast, more water-soluble wet surfactants re-establishsurface-bulk equilibrium resulting in signal contributions largelyreflecting their SML concentration and that are less affectedby the sampling procedure. Total measured VSFG intensitiesare equal to the sum of both contributions from dry and wetsurfactants. Samples from the SML were collected on days 2, 4,5,9,11,15,22,and 24. Data Analysis An operational estimate for the apparent thickness (d) of the SMIsampled with the glass plate is given by: Here, V is the volume collected, i.e., 200-430mL, A is thesampling area of the glass plate, i.e., 2,000 cm², and n is thenumber ofdips. Enrichment or depletion of a substance in the SML wasestimated by calculating the enrichment factor (EF): with x being the concentration of a given parameter in the SMLor ULW, respectively (GESAMP,1995). Statistical Analysis Average values are given by the statistical mean and its standarddeviation (SD). Averaged values were compared by means ofa Mann-Whitney Rank Sum Test. Significance of the Pearson’scorrelation coefficient (r) was tested by a t-test (two-tailed) withdegree of freedom, af = n-2. Significance level was p < 0.05. Principle component analysis (PCA) was performeddttoexplore differences in individual amino acid and carbohydratecompositionbetweendifferentfractions(dissolvedandparticulate) of the SML and the bulk water. Data for therelative contribution(%) of individual amino acidaandcarbohydratecconcentrations tototalilaaminoacids andcarbohydratesconcentrationsis((nmol L-l)vwassused.Thepackage CRAN:factoMineR (Le et al., 2008) in the open sourcesoftware R (version 3.0.2, R Core Team, 2013) was used for thePCA analysis using a correlation matrix. RESULTS Microbial Growth and Biomass Build-Up inthe Water Column In general, macronutrients, i.e.,NO3,NO2,SiOH4,and PO4 weredetectable in the bulk seawater during the whole experiment.Nutrient concentrations were 0.28 umol L- PO4, and 7.01umol L-1 NO3, initially and decreased continuously untiladdition of nutrients on the evening of day 12 (Figure 2). Nitritewas 0.32 umol L-l initially, increased slightly during the first 2days and declined until day 12 as well. After nutrient addition,following a lag phase of about 5 days, NO3,NO2, and PO4decreased again until the end of the experiment. Silicate was 3.88SiOH4 umol L- initially and was raised to about 10 umol L-on day 12. A decline in silicate concentration was not observed,neither before nor after nutrient addition, and in compliance withthe absence of silicifying organisms throughout the study. Autotrophic biomass was low throughout the experiment.Chlorophyll a (Chl a) concentrations were negligible until day20/ 21, when an E. huxleyi culture and a microlayer from anearlier phytoplankton bloom experiment were added (Figure 3).Chl a increased more strongly after day 23 to yield highest valuesof 0.042 ug L- on day 25. Autotrophic cell abundance in thebulk water was 18 mL- before and 220 mL-1 directly afteraddition of the E. huxleyi culture (data not shown). Particulate organic carbon i(POC) concentrationn variedbetween 4 and 29 umol L- in the course of the experiments(Figure 3). A large fraction of the POC may be attributedto high gel particles abundance, e.g., TEP) and Coomassiestainable particles (CSP) (Sun et al, 2017). A strong increasein POC was observed after day 17, coinciding with decline inphosphate and subsequently DIN concentration (Figure 2). PONconcentration followed the development of POC concentrationin general (Figure S1). [POC]:[PN] ratios were enriched innitrogen compared to the Redfield ratio of C:N of 6.6 and yieldedon average 4.7±1.2(n=33). However, a strong decline in PN Experiment Day FIGURE 2|Development of inorganic nutrients over the course of the experiment in the bulk seawater of the wind wave channel. On the evening of day 12, 10pM ofNOs and PO4 as well as 0.6 pM of PO4 were added. Experiment Day FIGURE 3|Development of chlorophyll a (Chl a, filled circles) and POC (triangles) concentration in the bulk seawater of the wind wave channel. A culture of thephytoplankton species Emiliania huxleyi was added on day 20, followed by sea surface microlayer (SML) sample from a previous phytoplankton bloom experiment onday 21. concentration was observed at day 15, leading to a temporary risein [POC]:[PN] at that day (Figure S1). Organic Matter Accumulation in the SML A thin SML of 28.3 um was observed at the beginning of theexperiment (day 0) (Table 1). Thereafter, the SML thicknessincreased gradually in the course of the study to reach highestvalues of 50 um on day 23. On 8 days ofthe Aeolotron study wind.experiment were conducted with wind speed increasing stepwisefrom about 1 to 18 m s-, and each wind speed lasting for 1-3 h Following the highest wind speed, bubbling of seawater wasinduced by aeration to simulate wave breaking. Both wind andbubbling treatments had no long-lasting effects on the thicknessof the SML, as similar thicknesses were observed at low windspeed in the mornings before and after increasing the windvelocities, e.g., days 4 and 5 or within 1 week of wind speedchanges (days 11-22). Heterotrophic bacterial cell abundance in the water columnstarted with 1.4 ×10⁵ mL-1, and increased to a first peak ofabundance on day 4 with values of9×10mL- (Figure 4A). TABLE 1 | Changes in SML thickness (um) in the course of the experiment. Day D (um) 2 3 37 4 37 5 37 9 37 11 42 42 40 41 Measurements were conducted at low wind speed (1.3-1.5ms-1) on each sampling day. Between days 17 and 22 a bacterial bloom developed, with thehighest abundance of 19 × 105 cells mL-determined on day20. This bacterial bloom coincided with the observed increase inparticulate OM (Figure 3) and can partly explain the low C:Nratios in particles, which are typical for heterotrophic marinebacteria. After day 20, a decline in bacterial abundances wasobserved, following the addition of the E. huxleyi culture. Bacteria were strongly enriched in the SML during the first11 days of the experiment with EFs ranging from 1.1 to 5.6.No bacterial enrichment was observed in the SML after nutrientaddition on day 12. Abundance of bacteria in the SML was notsignificantly related to those of the water column. Dissolved organic carbon (DOC) concentration in the watercolumn started with 85 umol L- and increased steadily overthe course of the experiment to reach maximum value of 120umolL- on the last days of the study (Figure 4B). DOC wasenriched in the SML during all sampling days, except for day15, when the difference between DOC concentration in the SMLand underlying water fell within the range of the analytical error.EFpoc ranged between 1.0 and 1.6. DOC concentration in theSML was significantly related to DOC concentration in the watercolumn (r=0.73, n= 12, p <0.05) as well as to SML thickness(r=0.58, n = 12, p<0.05), indicating that DOM production inthe water column directly affected SML properties. DON concentrations started with 6.8 umol L- initially andincreased slowly to a maximum value of 11 at day 20 (data notshown). [DOC]:[DON] ratios showed a clear carbon enrichmentwith an average of 12.2 ±2.2 (n =12). Highest [DOC]:[DON]of 16 was observed at day 14, declining thereafter and parallel toinorganic nitrogen draw-down to reach a value of 9.3 at the endof the study. THAA, including particulate and dissolved hydrolysableamino acids, in the water column varied on the days directly afterfilling the Aeolotron, but stabilized thereafter around 1 umol L-until day 16. On day 20, highest concentration of 2.31 umol L-was reached for the water column (Figure 4C). Thereafter, THAAdeclined slowly until the end of the study. THAA in the SMI exceeded concentrations in the underlying water by one orderof magnitude during the first 12 days of the study, resulting inhigh enrichment factors (EFs) of 13-48. Enrichment of THAAin the SML was absent on day 15 and again slightly higher afterthe addition of an organic microlayer (day 21), yielding EFs of~3 on days 22 and 24. THAA concentrations were tightly relatedto bacterial abundance in both water column (r=0.60, n=20,p< 0.005) and SML (r =0.94, n=7,p<0.005), indicating thatheterotrophic bacteria were mainly responsible for amino aciddynamics during this experiment. Similar to THAA, a strong enrichment in the SML was alsoobserved for dissolved hydrolysable amino acids (DHAA) untilday 15(Figure 4D), yielding EFs between 2.2. and 8.8. However,DHAA concentrations were about one order of magnitude lowerthan THAA and no enrichment in the SML was observed ondays 22 and 24. Thus, DHAA could not explain DOC enrichmentin the SML observed at the end of the experiment. In general,DHAA comprised between 1 and 10% of DOC in the SML withthe higher values observed during the first 2 weeks of the study.A close direct relationship between DHAA enrichment and therelative DOC fraction of DHAA was observed for the SML,yielding A[EFDHAA]:A[DHAA-C:DOC]=0.85±0.06(r=0.98,n= 7, p< 0.001; Figure 5). Neither THAA nor DHAA in theSML were significantly related to the respective concentrations inthe water column. Total combined carbohydrates (>1-1 kDa,TCHO)concentrations in the water column varied during the first12 days of the study (Figure 4E). Overall concentrations ofTCHO were lower than of THAA and increased from an initialvalue of 0.6-1.2 umol L- on days 9 and 10 and again on day22. Similar to THAA, a strong enrichment of TCHO in the SMLwas observed during the first 12 days of the study, albeit EF’sfor TCHO of 1.5-5.6 were clearly lower than those for THAA.On days 15 and 22, TCHO concentrations in the SML weresimilar to bulk water. A slight enrichment of TCHO in the SMLwas again observed on day 24. EF’s for TCHO varied betweenl and 5.6 with the latter being observed on day 4. Like foramino acids, TCHO concentration in the SML was significantlyrelated to bacterial abundance (r=0.85, n = 7,p <0.05) albeitless strongly. No relationship between SML and bulk waterconcentrations of TCHO was observed. DCHO concentration started with 0.4umol L-andincreased continuously in the course of the experiment to reacha value of 1.0 umol L-l on day 24 (Figure 4F). EFs of DCHOvaried between 1.1 and 1.5, with the highest enrichment observedon day 11. In contrast to TCHO, DCHO concentration in theSML closely corresponded to those of the underlying water(r = 0.84, n =7,p <0.05). In general, DCHO contributedbetween 2.4 and 5.1% to DOC, with slightly higher contributionsduring the second half of the experiment. Molecular Composition of the SML Degradation indices (DI) which were calculated from THAA datawere significantly higher for the SML compared to the bulk water(Mann-Whitney Rank Sum Test, t=20, n=6,p <0.01), exceptfor day 15, when no difference between SML and bulk water wasvisible (Figure6). This suggests that OM accumulating in the SML was relatively fresh and likely more labile than bulk OM inthe water column. Charged, zwitterionic amino acids represent polar blocks ofamphiphilic moieties and are known components of biogenicsurfactants (Infante et al., 2004). To investigate the role ofamino acid charges on SML enrichment, we grouped THAAinto different charge classes (Figure 7). The strongly polar, basicamino acid Arg was highly enriched in the SML (Figure 7A),followed by aromatic and acidic amino acids (Figures 7B,C).In general, neutral amino acids, which represented the largestfraction of THAA, were underrepresented in the SML, exceptfor two samplings at the end of the study, after addition ofautotrophic cells (Figure 7D). Hydroxylic amino acids were always underrepresented in THAA of SML with a remarkablysteady fraction of THAA of 13.6-15.2% Mol (Figure 7E). Ingeneral composition of THAA was less variable in the SML thanin the bulk water, where strong compositional changes wereobserved in particular during the first 15 days of the study. Ingeneral, THAA enrichment in the SML was significantly relatedto the relative abundance of the basic amino acid Arg (p <0.005;Figure 8), following an exponential function. Highest THAAenrichment during this study was obtained for THAA containingabout 6.5% Mol Arg. PCA analysis of individual amino acids revealed distinctdifferences between DHAA and PHAA, (=THAA-DHAA), andalso between the SML and bulk water (Figure 9A). Overall, the FIGURE 5|Direct relationship (p<0.001, n=7) between the enrichment ofdissolved hydrolysable amino acids (DHAA) in the SML and the DHAA fractionof DOC. first two components explained 61.1% (43.5%+17.6%) of thevariance within the samples. DHAA in the SML showed higherrelative contribution of the acidic amino acid GlX, while theDHAA in the bulk water showed higher contribution of Tyr, IleThr, Phe, and Ser. Bulk water PHAA had increased contributionsof Gly, Asx, Leu, and Ala. PHAA in the SML clustered aroundthe intersection of the PCl and PC2 axes, which suggests thatthe amino acid composition in this fraction was an intermediatefrom the other three fractions. The enrichment of Arg, as seenin THAA, of the SML was mainly driven by DHAA. Arg wasclearly enriched in DHAA of the SML, while depleted in the ULW(Figure 9A). PCA analysis was also conducted for individual CHO inDCHO and in PCHO (=TCHO-DCHO), and also pointedto compositional differences between SML and bulk water(Figure 9B). The first two components explained 63.1%(38.3%+ 24.8%) of the variance between the samples. DCHO in theSML and bulk fractions were very similar, and showed increasedcontributions of Fuc and Gal compared to PCHO, as well aslow variations between sampling days. Fuc was slightly moreenriched in DCHO samples from the in SML, while Gal wasslightly more enriched in the DCHO bulk samples. PCHOsamples in the SML were enriched in amino-sugars GlcN andGalN compared to DCHO, while PCHO in bulk water sampleshad very variable compositions. However, during sampling days2 and 9 (before the nutrient addition) bulk PCHO sampleswere also enriched in both amino sugars (GlcN and GalN) andclustered with PCHO from SML samples. On sampling days afternutrient addition, the PCHO bulk samples showed enrichmentin Man/Xyl and in the acidic sugars GlcA and GalA. Mur-Acwas below detection in both SML and bulk water throughout thestudy. FIGURE6| Changes in the degradation index (DI) of organic matter in theSML and in bulk water in the course of the experiment were estimated fromTHAA composition following Dauwe et al. (1999). Note that no difference incomposition was determined for day 15 suggesting complete absence of SMLorganic enrichment. Surfactants Spectral characteristics of the Aelotron VSFG data are comparedwith the reference spectrum of a dense monolayer of thephospholipid DPPC in Figure 10A. The shaded areas indicate therange of C-H vibrational signal used to determine the relativeCH integral strength and with it the surfactant coverage. Thetwo prominent peaks in the DPPC spectrum are characteristicfor the terminal -CH3 group of mutually parallel aligned alkylchains of well-ordered lipid chains in the monolayer.In contrast,the Aeolotron spectrum reveals broader spectral signatures andan additional pronounced peak around 2,850 cm-(typicallyassigned to -CH2-vibrations) indicating the presence of a morecomplex surfactant mixture. The spectral range from 3,000to 3,800 cm-1 largely reflects the contributions from O-Hvibrations including that of interfacial water. The two-peakspectral feature with the unusual intense peak at about 3,440cm-, though typical for SML samples, has been tentativelyassigned by Laf and Friedrichs (2011) to the presence oflipopolysaccharides or other lipid-like compounds embedded incolloidal matrices. However, facing the high SML enrichmentfactors of amino acids as part of the biogenic surfactant poolobserved in this study, it cannot be ruled out that peptide-rich, components contribute to the observed VSFG signature as well. The measured relative CH integral strength during the courseof the experiment is plotted iPHn Figure 10B. During the first 11days, relatively high values of up to 0.21 (corresponding to a45% surface coverage) have been observed, hence indicating thepresence of a dense surfactant layer. In fact,keeping in mind thepresumably less well ordered structure of the natural surfactantscompared to the artificial DPPC reference monolayer, these highvalues may even indicate an interface that is more or less fullycovered with surfactants. Nevertheless, the addition of nutrientson day 12 first caused a significant reduction of the relativeintegral strength to about 3% on day 15, but its high value FIGURE 7 |(A-E) Relative changes (%Mol) in different groups of THAA in the SML (solid symbols) and bulk water (open symbols) during the Aeolotron experiment. recovered toward the end of the experiment. A close correlationwas observed between the concentrations of surfactants and totaly-aminobutric acid (GABA) (Figure 10C) in the SML. GABA,a non-proteinogenic amino acid and derived from glutamate,has often been used as an indicator for microbial decompositionof OM (Dauwe et al., 1999). Thereby the relationship betweenGABA and surfactants seems to differ between the periodsbefore (days 2-12) and after (days 13-24) addition of nutrients.During the period before nutrient addition, a decline in GABAconcentration was associated with only a slight decline insurfactant concentration (Figure 10C, open circles), whereasduring the second half ofthe experiment, starting from low levels,the surfactant pool in the SML accumulated even stronger thanthe concentration of GABA (filled circles). The latter dependencemay suggest that processes other than microbial degradation ofOM fueled the surfactant pool as well. However, as indicated by the curve in Figure 10C, instead of being indicative for differentbiogeochemical regimes, a saturation of the interface withsurface active compounds may serve as a plausible alternativeexplanation of the observed trend as well. A robust correlationbetween the surfactant signal and GABA concentration (r=0.95,n=7,p<10-5) indicates a close non-linear relation of surfactantabundance and microbial degradation processes of OM. For amore detailed statistical analysis of the VSFG data we refer toTable S1 in the Supplementary Material. Actually, the observed high surfactant levels may at least bepartly due to a high enrichment of dry surfactants resultingfrom the sampling procedure. Compared to previous VSFG work(Lal and Friedrichs, 2011), higher ratios of sampling surface tosample dish area have been used in this study, possibly favoringthe VSFG detection of dry surfactant fractions. Clearly, moreexperimental data and repeated future experiments are desirable FIGURE 8| Direct relationship between the enrichment of THAA in the SMLand the molar percentage of total arginine (Arg) (p<0.005). to verify the observed trend between surfactant signal and GABAconcentration. DISCUSSION The advantage of the Aeolotron facility is that sampling forSML properties can be conducted repeatedly under controlledphysical conditions. Here, data were collected under the sametemperature and very similar low wind conditions over theduration of 26 days. Therewith, wind speed or convective mixingas explanation for variations in OM enrichment in the SML canlargely be excluded. The advantage of a controlled laboratorysystem such as the Aeolotron, however, comes with the drawbackof absence of biotic and abiotic dynamics and of complexitythat are typical for a natural ecosystem such as the surfaceocean. The Aeolotron study was not designed to mimic a naturaloceanic ecosystem, but to investigate processes at the air-seainterface of a natural seawater body under controlled physics.Due to technical reasons two dark phases, i.e., days 1-8 and17-19 had to be included and were likely responsible for thefailure of a phytoplankton or cyanobacterial bloom, despiteaddition of nutrients and E. huxleyi seed culture. Thus, thedominant bacterial bloom that developed during this study maynot be representative for a surface ocean situation, althoughbacterial abundance did not exceed typical oceanic values (Stolleet al., 2009; Engeland Galgani, 2015; Zancker et al., 2017). Inparticular, phytoplankton blooms can release large amounts ofcarbohydrates that accumulate in in SML (Jayarathne et al.,2016),.a scenario not included in our study. Moreover, manipulationssuch as the continuous increase in wind speed at several days andthe addition of a pure phytoplankton culture and of SML haveto be seen in an experimental context rather than an attempt tosimulate natural conditions. Nevertheless, several findings gained during this study were in accordance with previous observationsfrom the ocean, indicating in particular that the accumulation ofspecific OM components in the SML, as well as the relationshipsbetween individual constituents can be transferred to the naturalsystem, and may help to give insight into the dynamics of anspecific environment, the SML, that is not easily accessible in theopen sea. Identifying ecological drivers of OM accumulation at theair -sea interface is an important task, since organic compoundsin the SML are thought to influence a variety of air-sea exchangeprocesses potentially relevant for regional and global climate,marine biogeochemical cycling and ocean physics (Cunliffe et al.,2013; Engel et al., 2017). Our experiment included differentecological phases according to the biology and chemistry of thebulk seawater. Until day 20, biological processes in the tankwere clearly dominated by heterotrophic bacteria, as autotrophicbiomass was virtually absent. On day 20 a culture of Emilianiahuxleyi was added, followed 1 day later by a natural microlayersample from a previous, phytoplankton dominated, experiment.After this addition a slight increase in Chl a concentration andin SML-thickness were observed. Hence, apart from the last5 days of the study, changes in OM quantity and quality canclearly be attributed to heterotrophic activity. Thereby, aminoacids apparently served as a preferred bacterial substrate sinceTHAA as well as DHAA concentrations in the SML decreasedthroughout the study. The decline of TCHO in the SML,in contrast, was accompanied by an accumulation of DCHOsuggesting solubilization of particulate CHO and delayed uptakeofDCHO. Stronger accumulation over time of DCHO comparedto DHAA has been observed before, and indicates that aminoacids as source of both carbon and nitrogen are a preferredsubstrate for marine bacteria (Grossart et al., 2007; Engel et al.,2011). Causes of SML Formation During this study, the apparent SML thickness ranged between20 and 50 pm, which fits well to previous observations for theSML when sampled with a glass plate at similar withdrawalrates (Zhang, 2003; Cunliffe et al., 2011; Engel and Galgani,2016). Using direct pH microelectrode measurements, Zhang(2003) showed that physico-chemical properties at the sea surfacechanged beyond an in situ thickness of 60 um corroborating theproposed apparent sampling thickness of 50 ± 10 um (Zhanget al.,1998). We therefore assume that samples obtained with theglass plate during this study well represented the SML. SML thickness, in this study, was significantly related toDOC concentration in bulk water, suggesting that the large,bulk reservoir of organic components in the water column is animportant source of SML components. Thereby, the thickness ofthe SML increased with DOC concentration in the ULW, butwas not related to DOC enrichment in the SML. This suggeststhat absolute DOC concentration in the water column, ratherthan relative differences between the SML and the underlyingwater are more important for determining SML thickness. Theimportance of seawater DOC as major source for OM exchangeacross the air-sea interface has been suggested recently basedon organic compound analysis of sea spray, which showed no FIGURE 9| (A,B) PCA biplot of relative contribution of individual AA to dissolved (DHAAS) and to particulate (PHAAS) (A) and of individual CHO to dissolved (DCHO). and to particulate (PCHO) (B) in the SML and the bulk water. correlation to autotrophic production but mirrored the more .uniform composition of surface water DOM (Quinn et al., 2014)During the first days of our study, i.e., days 2-11, theSML was characterized by a strong enrichment of bacteriaand semi-labile OM, in particular amino acids, coinciding withhighest surfactant concentration, while little enrichment ofthese components was observed during the second part of theexperiment, when autotrophic biomass increased. This clearlyshows that accumulation of surface active OM in the SML canbe derived from the bulk pool of seawater OM and can occurindependently of recent autotrophic production The thickness of the SML sampled at low wind speed wasapparently not influenced by intermittent changes in wind speed,which were applied in between samplings. This implies that thedisruption of SML and mixing of organic components betweenSML and bulk water at high wind speeds have no long-lastingeffect and that SML and surface films recover rapidly afterdisturbance as suggested earlier (Dragcevic and Pravdic, 1981;Laf et al.,2010). Interestingly, enrichment of amino acids and carbohydrates,as well as surfactant concentration in the SML, did not increasewith SML thickness or DOC concentration. On the contrary,highest abundance of surfactants and amino acids were observed.when SML thickness and bulk DOC concentration was lowestThereby, changes in SML thickness were too small to explainthe observed OM enrichment by means of simple dilutionReduction of surfactant and DOC concentration in the SMLwith increasing bulk DOC concentration and in systems withhigh autotrophic productivity and consequently likely higherDOC production has been observed previously (Carlson, 1983;van Pinxteren et al., 2017). Carlson (1983) suggested a chemicalprocess of enhanced solubility of surfactants interacting withsubsurface DOC to explain a diminished accumulation of surfaceactive components. Chemical Enrichment in the SML During this study, the SML enrichment of amino acidsin particular was highest at low DOC concentrations. Thisobservation is in accordance with findings by Galgani et al.(2016) who determined higher amino acids enrichment inArctic sea ice melt pools at relatively low subsurface DOCconcentration compared to adjacent open ocean waters. Since ahigher percentage of amino acids in the carbon pool points tofresh and more labile OM (Davis et al., 2009), it can be assumedthat it is the less degraded OM that accumulates in the SML.In this study, DHAA-C was >2 Mol% during the first phaseof the study, indicating labile OM accumulation at the SML.This assumption is also supported by changes in amino acidcomposition that yielded a higher degradation index for OM inthe SML compared to the bulk water throughout this study. Amino acids in general showed highest enrichment, up toEF of 48, of all organic components analyzed in this study.This result fits well to field observations showing a specificallyhigh enrichment of amino acids for many coastal as wellas open ocean sites (Henrichs and Williams, 1985; Carlucciet al., 1992; Kuznetsova and Lee, 2001; Kuznetsova et al., 2004;Reinthaler et al.,2008; Engel and Galgani, 2016). Kuznetsova et al.(2004) suggested that individual amino acids had higher molepercentages in the SML than in the corresponding subsurfacewater, which implies selective peptide enrichment in the SML.During this study the basic amino acid arginine was identifiedas peptide component strongly correlating to total amino acidenrichment in the SML. This suggests that arginine is part of thebiogenic polymeric surfactant pool that preferentially absorbs tothe air-sea interface. Interesting in this respect is that bacterial oxidation of argininecan result in nitric oxide (NO) production and also lead to theformation of nitrous oxide (N2O) (Schreiber et al., 2012), one ofthe most powerful greenhouse gases. So far, bacterioneuston has DPPC reference 0 5 10 15 20 25 30 GABA [nmol/L] FIGURE 10| (A-C) Accumulation of surfactants in the SML. (A) AveragedVSFG and DPPC reference spectra with integrated CH spectral range (shadedarea), (B) relative CH integral trend (C) correlation of surfactant coverage withy-aminobutric acid (GABA) during the periods days 2-12 (open circles) anddays 13-24 (filled circles) of the experiment. The curve indicates a regressionmodel reflecting the possible signal trend resulting from a saturation of thesurface with surfactants. been suggested to be actively involved in the destruction of N2Oin the SML (Conrad and Seiler, 1988). Recurring enrichment ofarginine in the SML, however, may give rise to N2O enhancedproduction, hence it may well be speculated that this processconstitutes a hitherto unexploited source of N2O release from theocean to the atmosphere. Microbial Control of SML Composition Loss of chemically labile OM from the SML was observed within afew days during the first part ofthe experiment, pointing to rapidmicrobial degradation. The observed close relationship betweenbacterial abundance, amino acid concentration and surfactantsstrongly suggest a bacterial control of physicochemical propertiesof the SML. This finding is in line with the outcome of a previousVSFG field study performed at the Boknis Eck Time SeriesStation (Western Baltic Sea), where surfactant signals were notdirectly related to phytoplankton abundance alone (Las et al., 2013). Instead highest surfactant levels were found in summermonths where bacterial abundance (and the associated grazingby protozoans) is enhanced at this site (Hoppe et al., 2013). Taxa identified for the bacterial community in the SML duringthis study such as Pseudoalteromonas sp. and Alteromonas sp.as well as taxa inhabiting both SML and bulk water, dominatedby Phaeodactylibacter xiamenensis, are typical for natural marineenvironments (Rahlff et al., 2017). Alteromonas sp. has beenshown to efficiently utilize the labile pool of coastal seawaterDOM in experimental incubations within a period of days(Pedler et al., 2014). Hence, microbial dynamics as observedduring this wind wave channel experiment may be transferrableto the field situation under similar environmental conditions, inparticular low wind speed and low light. It is still unclear what controls bacteria and their activities inthe SML. Bacteria in the field bacteria may be enriched (Stolleet al., 2009) or depleted in the SML (Engel and Galgani, 2016;Galgani et al, 2016), or their growth and hence consumptionrates of amino acids are reduced (Stolle et al., 2009; Santos et al.,2012). Possible controls of bacterioneuston activity include theprevailing meteorological conditions, UV light (Agogue et al.,2005), incident OM availability (Carlucci et al., 1985, 1992),wind speed (Stolle et al., 2011; Rahlff et al.,2017) and aerosoldeposition (Astrahan et al., 2016). While the importance of solarand UV irradiance for controlling neuston activity in the field isdebated (Bailey et al., 1983; Carlucci et al., 1985; Santos et al.,2012), the high bacterial enrichment in the SML during thefirst days of this study suggest, that accumulation of labile OMand at the absence of light potentially favors bacterial growth atthe air sea interface. In the ocean, solar irradiation can reducethe bioavailability of fresh DOM or enhance it when refractoryDOM undergoes photochemical modifications (Obernostereret al., 1999; Galgani and Engel, 2016). As a consequence, strongdiel variations in bacterial activity have been suggested for thesurface lit upper water column (Herndl et al., 2008) and maybe even more pronounced within the SML. As a consequence,irradiance dependent (e.g., day-night) variations can be expectedfor microbial cycling of climate relevant trace gases such asmethane (Upstill-Goddard et al., 2003), nitrous oxide, carbonmonoxide and hydrogen (Conrad and Seiler, 1988) or carbondioxide (Calleja et al.,2005). Overall, our study highlights the close connection betweenthe appearance of heterotrophic bacteria and organic compoundsthat potentially act as surfactants in the SML. We did not resolveto which extend the bacterial community was a source or a sinkof these substances. Experiments tracing the uptake or releaseof biogenic surfactants, in particular arginine-rich polypeptideswould be needed to further unravel linkages between ecologyand physico-chemistry of the air-sea interface. This knowledgecould help to better constrain air-sea exchange processes andfeed-backs in times of environmental change. AUTHOR CONTRIBUTIONS AE designed the study, analyzed the data and wrote themanuscript. MS and CS conducted the study, GF provided andanalyzed data, JG analyzed data. All authors contributed towriting of the manuscript. ACKNOWLEDGMENTS We thank Bernd Jahne and Kerstin Krall for hospitality andorganization during the Aeolotron study. Many thanksgoto the captain and crew of R/V POSEIDON as well丑asto Armin Form for seawater collection. Thanks to KristianLaB for making available the VSFG data through the projectCP1212 of the Kiel cluster of excellence The Future OceanJon Roa, Ruth Flerus, Katja Laf, and Tania Kluver are greatlyacknowledged for technical support. This work was supported REFERENCES ( Agogue, H., Joux, F., Obernosterer, I., and Lebaron , P. (2005).Resistance of marine bacterioneuston to solar radiation. A p pl. Environ. Microbiol. 71, 528 2 -5289. doi: 10 .1 128/AEM. 7 1.9.5282-5289.2005 ) ( Astrahan, P . , Herut, B ., Payton, A ., a nd R a hav, E . ( 2 016). T h e im p actof d ry atmospheric d e position o n th e sea-surface mi c rolayer in th e se mediterranean sea: an neexperimental a pproach. Front. M ar. Sci. 3 : 2 2 2. doi: 10.3389/fmars.2016.00222 ) ( Baier, R. E. ( 1972), O rganic fi lms o n natural wa t ers: th e ir retrieval, identification , and modes of elimination, J . G eophys. R e s. 7 7 , 5 0 62-5075. doi: 10.1029/JC077i027p05062 ) ( B ailey, C. A ., N eihof, R . A . , a n d Ta b or, P. S. (1983). Inh i bitory effect of s olar radiation o n a mino acid up t ake in Chesapeake Bay bacteria. Appl . Envi r on.Microbiol. 46,44-49. ) ( B ates, T. S ., Quinn, P . K.,Frossard, A. A. , Russell, L. M., Hakala,J., P e ta j a, T., et al.(2012). Measurements of ocean derived aerosol off the coa s t of C alifornia. J.Geophys. Res. 1 1 7 ,1-13. d oi: 10.1029/2012JD017588 ) ( B ock, E. J., Hara, T . , Frew,N . M., an d McGillis, W . R.(1999) . Relationship betweenair-sea gas transfer and short wind w aves. J. Geophys. Res. 1 04,25821-25831. doi: 10.1029/1999JC900200 ) ( Calleja, M. L ., Duarte, C . M., N a varro, N. , an d Agu s ti, S. ( 2 0 0 5). Con t rol of air-sea CO2 d isequilibria in the subtropica l NE Atlantic by planktonic metabolism under the o cean s S kin. G eophys . RRes. Lett. 32:L08606.doi: 10.1029/2004GL022120 ) ( C arlson, D. J. (1983). Dissolved o rganic materials in surface microlayers: temporal and spatial variability in relation to sea state. Limnol. Oceanogr. 28, 415-431. doi: 10.4319/lo.1983.28.3.0415 ) ( Carlucci, A., Craven, D ., and Henrichs, S. (1985). Surface-film microheterotrophs:amino acid metabolism and solar radiation effects on their activities. Mar. Biol. 85,13-22. doi: 10.1007/BF00396410 ) ( Carlucci, A. F . , Wolgast, D. M., and Craven, D . B . ( 1992). Microbial p opulations in surface films: amino acid dynamics i n n e arshore and of f shore waters of f Southern California. J. Geophys. Res . 97, 5271-5280. doi : 10.1029/ 9 1JC02614 ) ( Carpenter, L. J., and Nightingale, P. D. (2015). Chemistry and release of gases from the surface ocean. Chem.Rev. 1 15, 4 015-4034. doi:10.1021/cr5007123 ) ( Ciuraru, R., Fine , L. , va n Pinxteren , M. , DAnna, B., Herrmann, H., andGeorge, C. ( 2 015). U n ravelling new processes at interfaces: pho t ochemicalisoprene production at t h e sea surface.E n viron. Sci. T e chnol. 49,13199-13205. doi: 10.1021/acs.est.5b02388 ) ( C onrad, R.,and Seiler, W. (19 8 8).In f luence of t he surface microlayer on the flux of nonconservative trace gases (CO,H2,CH4,N2O) across the ocean-atmosphere i nterface. J. Atmos . Chem. 6 , 83-94. doi: 1 0.1007/BF00048333 ) ( Cunliffe, M., E ngel, A., F r ka, S., G a sparovic, B. , G ui tart, C . , Murrell, J. C., et al. (2013) . Sea surface microlayers : a unifie d physicochemica l andbiological perspect i ve of the air-ocean interface. Prog. Oceanogr. 109, 104-116. d oi: 10.1016/j.pocean. 2 012.08.004 ) ( C unliffe, M.,Up s till-Goddard, R . C ., and M urrell, J . C. (2011). Microbiology of aquatic surface m icrolayers. F EMS Microbiol. Rev . 35, 2 33-246.doi: 10.1111/j. 1 574-6976.2010.00246.x ) ( D auwe, B . , a nd M i ddelburg, J . J . ( 1998). A mino acids a n d hexosamines as indicators of organic matter degradation state in North Sea sediments. Limnol. Oceanogr. 43,782-798. doi: 1 0.4319/lo.1998.43.5.0782 ) by the BMBF project SOPRAN III (Surface Ocean Processes inthe Anthropocene 03F0662A-TP2.2). The study is a contributionto the international Surface Ocean Lower Atmosphere Study(SOLAS). SUPPLEMENTARY MATERIAL The Supplementary Material for this article can be foundonlinee at:https://www.frontiersin.org/articles/10.3389/fmars.2018.00182/full#supplementary-material Dauwe, B., Middelburg,J.J., Herman, P. M. J., and Heip, C. H. R. (1999). Linkingdiagenetic alteration of amino acids and bulk organic matter reactivity. Limnol.Oceanogr. 44, 1809-1814.doi: 10.4319/lo.1999.44.7.1809 Davis, J., Kaiser, K., and Benner, R. (2009). Amino acid and amino sugar yieldsand compositions as indicators of dissolved organic matter diagenesis. Org.Geochem. 40, 343-352. doi: 10.1016/j.orggeochem.2008.12.003 ( Dickson, A. G., Sabine, C. L. , a nd Christian, J., R. (2007). Guide to B e st PracticesF o r Ocean CO2 Measurements. Sidney, BC: PICES. ) Dittmar, T., Cherrier,J., and Ludwichowski, K. (2009).“The analysis of aminoacids in seawater,in Practical Guidelines for the Analysis of Seawate,ed O. Wurl(Boca Raton, FL:CRC-Press), 67-78. Dragcevic, D., and Pravdic, V. (1981). Properties of seawater-air interfaces: ratesof surface film formation under steady state conditions. Limnol. Oceanogr. 26,492-499. doi: 10.4319/lo.1981.26.3.0492 ( Engel, A., B ange, H . W., Cu n l i ffe, M. , B u rrows, S.M. , Fr eid r ichs, G., Galgani, L., et al . (2017). The ocean’s vital skin: towards an integrated understanding of the sea surface microlayer. Front. Mar. Sci. 4:165. doi : 10.3389/fmars.2017.00165 ) ( Engel, A ., a nd Galgani, L. (2016). The organic se a -surface mi c rolayer in the upwelling r egion o ff t he c oast o f P eru and p o tential i m plications f o r air- sea exchange processes. Biogeosciences 13, 989-1007. doi: 10.5194/bg-13-989- 2016 ) ( Engel, A., and H andel, N . ( 2 011). A no v el pr o t ocol for det e rmining theconcentration and c o mposition of sugars in particulate and i n h i gh molecular weight dissolved organic matter (HMW-DOM) in sea w ater. Mar. Chem. 127, 180-191. doi: 10.1016/j.marchem.2011.09.004 ) ( Engel, A ., Handel,N., W o hlers, J. , Lunau, M., Gr o ssart, H. P., and Riebesell, U. (201 1 ). Effects of sea surfac e warming on t he p roduction and c o mposition of d issolved organic matter during phytoplankton blooms: r e sults f rom a m esocosm study. J. Plankton Res. 33 , 357-372. doi: 10.1093/plankt/fbq122 ) ( Frew,N. M. (2005).“T h e role of organic fi l ms in air-sea gas exchange, in The S e aSurface and Global Change, eds S. Pliss and R. A . Duce (Cambridge: CambridgeUniversity Press), 121-163. ) ( Frew, N. M., Goldman, J. C., Dennett, M. R., and Johnson, A. S. ( 1990). Impact of phytoplankton-generated surfactants on air - sea gas exchange. J. Geophys. Res. Oceans 95, 3337-3352.doi: 10.1029/JC095iC03p03337 ) ( F rost,T. (1999). Environmental Controls of Air-Water Gas Exchange. University ofNewcastle upon T y ne, UK. ) ( Galgani, L., and E ngel, A . (2016). C hanges in op t ical ch a racteristics o f surfacemicrolayers hint to photochemically and microbially mediated DOM turnover i n t he u pwelling region of f the coast of Peru. Biogeosciences 13, 245 3 -2473. doi: 1 0.5194/bg-13-2453-2016 ) ( Galgani, L ., Piontek, J. , and Engel, A. (2016). Biopolymers f orm a g e latinous m icrolayer at the air-s e a interface when Arctic sea ice melts. Sci . Rep. 6:29465. doi: 10.1038/srep29465 ) ( GESAMP (19 9 5). The Sea - Sur f ace Mic r olayer and its Rol e in Glo b al Cha n ge. Reports and Studies No . 59.WMO. ) ( Goldman, J. C., Dennett, M. R . , and F r ew, N. M . ( 1 988). Surfactant effects on air-sea gas exchange under turbulent conditions. Deep Sea Res. Part A. Oceanograp.Res. Papers 35, 1953-1970. doi: 10.1016/0198-0149(88)90119-7 ) ( Grossart, H., Engel, A., Arnosti, C., C. L ., De La Rocha, Murray, A. E., and Passow, U. ( 2007). Microbial dynamics i n a utotrophic and h eterotrophic seawater m esocosms. I I I. O rganic m a tter f l uxes. A qua. M i crob. Ecol. 4 9 , 1 4 3-156.doi: 10.3354/ame01140 ) ( Hansen, H. P . , and K o roleff, F. (1999).“ D etermination of n utrients, in M ethods of seawater analysis, 3rd Edn. eds K . Grasshoff,K. Kremling, and M. E h rhardt(Weinheim: Wiley). ) ( H ardy, J. T., Apts, C. W., Crecelius, E. A., and Fellingham, G. W. ( 1985). The s ea-surface microlayer: fate and residence times of atmospheric met a ls. Lim n ol.Oceanogr. 30,93-101. d o i: 10.4319/lo.1985.30.1.0093 ) ( Harvey, G. W., and Burzell, L. A. (1972 ) . A simple microlayer method for small samples.Limnol. O c eanogr. 11 , 608-614. doi: 10.4319/lo.1966.11.4.0608 ) ( H enrichs, S . M., and W illiams, P . M. (1985). D issolved a nd particulate amino acids and carbohydrates in t he sea surface microlayer. Mar. Chem. 17, 141- 1 63. doi: 10 . 1016/0304-4203(85)90070-2 ) ( H erndl, G. J., Agogue,H. , Ba l tar, F., Reinthaler, T., Sintes, E., and Varela, M. M. (2008). R egulation o f aquatic microbial pr o cesses: th e ‘microbial loo p ’of t h e sunlit surface waters and the dark ocean dissected. Aqua. M icrob. Ecol. 53, 59-68. doi: 10.3354/ame01225 ) ( H oppe, H . -G.,Giesenhagen, H. C. , Koppe, R., Hansen, H.-P. , and Gocke, K. (2013). Impact of change in c limate a nd policy f rom 1 9 88 to 2007 on environmental and m icrobial v a riables at the t i me s e ries s t ation B o knis Eck, Ba l tic Se a . Biogeosciences 10, 4 529-45 4 6. doi:10.519 4 /bg-10-4529-2013 ) ( Infante, M . R ., P erez, L., P inazo, A., C lapes, P., M orán, M. C., an d Vin a r d ell,M. T . ( 2004). Amino acid-b a sed s u rfactants. C . R . C himie 7 , 583-592. doi: 10.1016/j.crci.2004.02.009 ) ( Jayarathne, T., Sultana , C. M., Lee, C., Malfatti , F . K. , and Cox, J . L .(2016). E nrichment of saccharides and divalent ca t ions in se a sp r ay aerosolduring t wo phytoplankton blooms. En v iron. Sc i . Te c hnol.50, 1151 1 -115 2 0 . doi: 10.1021/acs.est.6b02988 ) ( J oux, F. J., Agogué, H ., O bernosterer, I., Dupuy, C.,Reinthaler, T. J ., and Lebaron, P. (2006).Microbial community structur e in the se a surface microlayer at two c ontrasting coastal sites in the northwestern M e diterranean Sea. Aqu a . Micr o b. Ecol.42,91-104. doi: 10.3354/ame042091 ) ( K rall, K. (2013). Laboratory I n vestigations of Air-Sea G a s Tr a nsfer under a WideRange of Water Surface Co n ditions. Di s s ertation, F a culties f o r t h e N a tural Sciences and for Mathematics of the Ruperto-Carola Un i versity of Heidelberg,Germany, 152, ) ( Kuznetsova, M., and Le e, C. (2001). En hanced extracellular e nzymaticpeptide hydrolysis in the sea-surface microlayer . Mar. Chem. 7 3, 3 19-332.doi: 10.1016/S0304-4203(00)00116-X ) ( Kuznetsova, M., Lee, C., A ller, J ., and F rew, N. ( 2 004). E nrichment o f amino acids i n the sea surface m icrolayer a t c oastal and o pen o c ean site s in the North A tlantic Ocean. Limnol. Oceanogr. 49, 1605-1619. d oi: 10.4319/lo.2004.49.5.1605 ) ( L af, K ., B ange, H ., a nd F r iedrichs, G . ( 2 013). S e asonal s i gnatures in S F G vibrational spectra of the sea surface nanolayer at boknis eck t ime seriesstation (SWBaltic S ea). B iogeosciences 1 0, 5 325-5334. doi: 10 . 5194/bg-10-5325-2013 ) ( L af, K . , and F riedrichs, G.(2011). Revealing s t ructural p roperties of the m arine nanolayer from vibrational sum frequency generation spectra.J. Geop h ys. Res. 1 1 6, 1-15.doi: 10.1029/2010JC006609 ) ( L af, K ., K leber, J ., and F riedrichs, G. (2010). Vibrationa l sum-frequency generation as a probe for composition, chemical reactivity, and film formationdynamics of the s e a surface nanolayer. Limnol. Oceanogr. Methods 8, 216-228.doi: 10.4319/lom.2010.8.216 ) ( L e, S., Josse, J., an d Husson, F. (2008). FactoMineR: an R package for m ultivariate a nalysis. J. Sta t . Softw. 25,1-18. doi: 10.18637/jss.v025.i01 ) ( L indroos, A ., Szabo, H. M. , Nikinmaa,M., and Le s kinen,P. ( 2011). Co m parison of sea surface microlayer and subsurface water bacterial communities in the Baltic Sea. Aqua. M icrob. Ecol. 65, 29-42. doi: 10.3354/ame01532 ) ( Lindroth, P., and Mopper, K . ( 1 979). High performance l i quid c hromatographic determination of subpicomole amounts of amino a cids b y precolumnfluorescence derivatization 1 with h o-phthaldialdehyde. Anal. Chem. 51, 1667- 1 674.doi: 10.1021/ac50047a019 ) ( M atrai, P. A.,Tranvik, L., Leck, C., and K nulst,J. C. ( 2008). Are high Arctic surface microlayers a potential source of aerosol organic precursors? Mar. Chem. 108, 109-122. doi: 10.1016/j.marchem.2007.11.001 ) ( McKenna, S. P., a n d McGillis, W. R. (2004). The r o le of free - surface turbulenceand surfactants in a i r-water gas transfer. Int. J . H eat Mass Transf. 47, 539-553.doi: 10.1016/j.ijheatmasstransfer.2003.06.001 ) ( M ustaffa, N . I. H., Striebel , M . , and Wurl, O.(2017). Enrichment of extracellularcarbonic a nhydrase i n t h e sea surface microlayer and its effect o n ai r -seaexchange. Geophys. Res. L ett. 4 4, 12324-12330. doi: 1 0.1002/2017GL075797 ) ( N agel, L ., Krall, K. E. , and Jahne, B. (2015). Comparative heat and g a s exchange m easurements in the Heidelberg Aeolotron, a large a n nular wind-wave tank. Ocean Sci. 11, 11 1-120. doi : 10.5194/os-11-111-2015 ) ( Nakajima, R . , Tsuchiya, K., N akatomi, N., Y o shida, T., T a da, Y . , Konno, F. , et al.(2013). Enrichment o f microbial abundance in the sea-surface mi c rolayer over a coral reef: implications for biogeochemical c ycles i n reef ecosystems. M ar. Ecol. Prog.Ser. 490,1 1 -22. doi: 10.3354/meps10481 ) ( Obernosterer, I , R eitner, B ., and H erndl, G . J. ( 1 999). Contrasting effectsof solar r adiation o n dissolved or ganic matter and its bi oa vailability to marine B acterioplankton. 1 . Limnol. Oceanogr. 4 4. 1645-1654. doi: 10.4319/lo.1999. 4 4.7.1645 ) ( O’Dowd, C. D., Facchini, M. C ., Cavalli, F., Ceburnis, D., Mi r cea, M., Decesari, S.,et al.(2004). Biogenically driven organic contribution to marine aerosol. Nature 431,676-680. doi: 1 0.1038/nature02959 ) ( Pedler, B. E ., Aluwihare, L. I., and A zam, F. F . ( 20 14). Single b a cterialstrain c apable o f significant c ontribution to carbon cy c ling in th e sur f ace ocean. P roc. N atl. Acad. Sci. U.S.A. 1 11, 7202-7207. doi: 1 0 .1073/pnas.14018 87111 ) ( Prather, K ., B ertram, T. H. , Grassian, V . H . , D e ane, G. B. , St o kes, M. D., De M ott, P. J.,et al. (2013). Bringing the ocea n into the laboratory to probe the chemical complexity of sea spray aerosol. Proc. N atl. Acad. S ci. U.S.A. 110, 7550- 7 555. doi: 10.1073/pnas.1300262110 ) ( Quinn, P . K . , B a tes, T . S . , S chulz, K. S., Coffman, D. J. , F r ossard, A. A., Russel,L. M., et al. (2014). Contribution o f sea surface carbon pool t o organic matter enrichment in s e a spray aerosol. Nat. G eosci . 7,228-232. doi: 10.1038/ngeo2092 ) ( Quinn, P. K ., a nd B a tes, T . S . ( 2 011). The case against c l imate regulation via oceanic p hytoplankton sulphur em issions. Nature 480, 51-56doi: 1 0.1038/nature10580 ) ( Rahlff, J ., Stolle, C ., Giebel, H.-A., Brinkhoff , T., Ribas-Ribas, M., H o dapp, D., et al. (2017) . High wind speeds prevent formation of a distinct bacterioneustoncommunity in th e sea-surface m i crolayer. F E MS Microbiol. Ecol. 9 3 :fix041. doi: 10.1093/femsec/fix041 ) ( R Core Team (2013). R : A Language and Environment for Statistical Computing.R Foundation fo r St a tistical Computing, Vienna, Austria. Available online at: http://www.R-project. o rg/ ) ( Reinthaler, T . , Sintes, E., and H erndl, G . J. (2008). D i ssolved organic matter and b acterial production and respiration in t he sea surface microlayer of t he open Atlantic and the western M editerranean Sea. Limnol. Oceanogr. 5 3 , 122-136. doi: 10.4319/lo.2008.53.1.0122 ) ( R ussell, L. M. , Hawkins, L . N . , F r ossard, A. A ., Quinn, P. K ., and Bates, T. S.(2010). Carbohydrate-like composition of submicron atmospheric particles and their production from ocean bubble bur s ting. Proc. Natl. Acad. Sci. U. S .A. 107, 6652 - 6657. doi: 10.1073/pnas.0908905107 ) ( Sabbaghzadeh, B ., ,Upstill-Goddard, R. C ., B eale, R ., P ereira, R., andNightingale, P. D. ( 2017). T he A t lantic O cean su r face mi c rolayer fr o m 5 0° N to 50°S i s u b iquitously e nriched i n s urfactants at wind speeds u p to 13m s - . Geophys. Re s . Lett. 44 , 28 5 2-2858. do i : 10 . 1002/2017GL0 .72988 ) ( Santos, A. L., Oliveira, V ., B aptista, I .,Henriques, I . , G omes, N. C., Almeida, A., e t al. (2012). Effects of UV- B r adiation o n the s t ructural and p h ysiological diversity of bacterioneuston and bacterioplankton. Appl. Environ. Microbiol. 78,2066- 2 069. doi: 10.1128/AEM.06344- 1 1 ) ( Satpute, S. K., Banat, I . M., Dhakephalkar, P. K., Banpurkar, A. ( G., and Chopade, B. A. (2010). Biosurfactants, b ioemulsifiers and exopolysaccharides from marine microorganisms. iS . Biotechnol . Adv. . 2 2 8, 436- 45 0. doi: 1 0.1016/j.biotechadv.2010.02. 0 06 ) ( S chreiber, F ., Wunderlin, P . , U dert, K. M., and Wells, G. F. (2012). Nitricoxide and nitrousoxide turnover in natural and engineered microbial communities:biological pathways, c h emical re a ctions,and no v el technologies. Front. Microbiol. 3 :372. doi: 10.3389/fmicb.2012.00372 ) ( S tolle, C . , Labrenz, M., Meeske, C., and J urgens, K. (2011). Bacterioneuston community s t ructure i n the southern b altic s ea a ndits dependence on meteorological conditions. Appl. Environ. M icrob. b . 77, 3726-3733. doi: 10.1128/AEM.00042-11 ) ( Stol l e, C., Nagel, K., Labrenz, M., and Jurgens, K. (2009). Bacterial activity i n thesea-surface microlayer: in situ investigations in the Baltic Sea and th e influenceof sampling d evices. Aqua. Microb. Ecol.5 8 , 67-78. doi: 1 0.3354/ame01351 ) ( S ugimura, Y. , a nd S u zuki, Y . ( 1 9 8 8). A h i gh-temperature catalytic o xidationmethod f o r t h e determination of non-volatile d i ssolved organic carbon i n seawater b y d irect injection of a liqui d sample. Mar. Chem. 24, 1 05-131.doi: 10.1016/0304 - 4203(88)90043-6 ) ( S un, C. C., Sperling, M., and Engel, A. (2 0 17). Effect of wind spe e d on t h e size distribution o f biogenic gel particles i n the sea surface mi c rolayer: ins i ghts from a wind wave ch a nnel experiment. Bio g eosci. Di s cuss. doi: 1 0 .5194/bg-2017-419 ) ( Upstill-Goddard, R. C. , Fr o st, T. , He n ry, G. R ., Franklin, M., Murrell, J. C. , andOwens,N. J. (2003). Bacterioneuston control of air-water methane exchangedetermined with a laboratory gas exchange t ank. Global Biogeochem. Cycles 1 7:1108. doi : 10.1029/2003GB002043 ) ( van P inxteren, M ., B arthel , S. , Fomba, K. W., Muller, K. , von Tumpling, W., and H errmann, H. (2 0 17). The inf l uence of environmental dri v ers on t heenrichment o f o r ganic carbon in the sea surface microlayer and in submicron aerosol particles - measurements f rom the Atlantic Ocean. E lem. S ci. Anth. 5:35. d oi: 10.1525/elementa.225 ) ( Welschmeyer, N. A. (1994). Fluometric analysis of chlorophyll a in t h e p res e nceof c hlorophyll b and pheopigments. L i mnol. O c e anogr. 39 , 1985-1992. d oi: 10.4319/lo.1994.39.8.1985 ) ( W ilson, T. W., Ladino,L. A., A l pert, P. A., B reckels,M. N., Brooks, I. M., B r owse,J. , et al. (2015).A m arine biogenic source of a tmospheric ice n u cleating particles. Nature 525, 234-238. doi: 10.1038/nature14986 ) ( Wurl, O. , Miller, L. , a nd Vagle, S . ( 2011a). Production and f a te of transparentexopolymer particles i n t he ocean. J . G eophys. R e s. Oceans 11 6 :C00H13. doi: 10.1029/2011JC007342 ) ( W url, O., S tolle, C., Van Thuoc, C., The Thu, P. , and Mari,X. (2016). B iofilm-likeproperties o f t he s ea s urface and p r edicted e f fects on a i r-sea CO2 ex c hange. Prog. Oceanogr. 144, 15-2 4 . doi: 10.1016/j.pocean.2016.03.002 ) Wurl, O., Wurl, E., Miller, L., Johnson, K., and Vagle, S. (2011b). Formationand global distribution of sea-surface microlayers. Biogeosciences 8, 121-135.doi:10.5194/bg-8-121-2011 ( Zancker, B ., Bracher, A. , Rottgers, R., and Engel, A. (2017). Variations of theorganic m atter composition i n th e se a su r face microlayer: a c o m parison between o p en ocean, coastal, and upwelling sites of f the peruvian coast. Front. Microbiol.8:2369. doi: 10.3389/fmicb.2017.02369 ) ( Zhang, Z. ( 2003). Studies on t he s ea surface microlayer II. The layer of suddenchange o f physical and ch e mical pro p erties, J. C oll. In t er. Sci. 2 6 4, 148-159. doi: 10.1016/S0021-9797(03)00390- 4 ) ( Zhang, Z., L iu, L., W u, Z . , Li, J., a nd D i ng, H. (1998). Ph y sicochemical studies o f t he s e a s u rface mi c rolayer: I . th i ckness of the sea surf a ce microlayer and i t s e xperimental determination. J. Coll. Inter. Sci. 204,294-299.doi: 10.1006/jcis.1998.5538 ) ( Conflict of Interest Statement: T he a u thors declare t h at the research w asconducted in the absence of an y commercial or financial rela t ionships that coul d be construed as a potential conflict of interest. ) ( Copyright @ 2 018 Engel, Sperli n g, Sun, G r osse and Friedrichs. T h i s i s an open-access article distributed under the terms of the Creative Commons Attribution License (CCBY). T he use, d istribution or reproduction in other forums i s permitted, provided the o riginal author(s) a n d th e copyright owner are credited and t h at t h e or i gin a l p ublication in this journal is c ited, in accordance w i th accepted academic prac t ice.No use, d istribution o r reproduction is permitted w h ich d o es not comply with these terms. ) une Volume |Article rontiers in Marine Science|www.frontiersin.org Frontiers in Marine Sciencewww.frontiersin.orgJune Volume | Article The surface microlayer (SML) is the uppermost thin layer of the ocean and influencinginteractions between the air and sea, such as gas exchange, atmospheric deposition andaerosol emission. Organic matter (OM) plays a key role in air-sea exchange processes,but studying how the accumulation of organic compounds in the SML relates tobiological processes is impeded in the field by a changing physical environment, inparticular wind speed and wave breaking. Here, we studied OM dynamics in the SMLunder controlled physical conditions in a large annular wind wave channel, filled withnatural seawater, over a period of 26 days. Biology in both SML and bulk water wasdominated by bacterioneuston and -plankton, respectively, while autotrophic biomassin the two compartments was very low. In general, SML thickness was related tothe concentration of dissolved organic carbon (DOC) but not to enrichment of DOCor of specific OM components in the SML. Pronounced changes in OM enrichmentand molecular composition were observed in the course of the study and correlatedsignificantly to bacterial abundance. Thereby, hydrolysable amino acids, in particulararginine, were more enriched in the SML than combined carbohydrates. Amino acidcomposition indicated that less degraded OM accumulated preferentially in the SML.A strong correlation was established between the amount of surfactants coverageand g-aminobutric acid, suggesting that microbial cycling of amino acids can controlphysiochemical traits of the SML. Our study shows that accumulation and cycling ofOM in the SML can occur independently of recent autotrophic production, indicating awidespread biogenic control of process across the air-sea exchange.
确定
还剩14页未读,是否继续阅读?

产品配置单

北京欧兰科技发展有限公司为您提供《表面有机物微层中振动和频光谱(VSFG)检测方案(其它光谱仪)》,该方案主要用于环境水(除海水)中物理指标检测,参考标准--,《表面有机物微层中振动和频光谱(VSFG)检测方案(其它光谱仪)》用到的仪器有Ekspla SFG 表面和频光谱分析系统
推荐专场

相关方案
更多
该厂商其他方案
更多