


本文提出了一种测定石英中48Ti质量分数的新方法,即在1lg/g水平上用LA-ICP-MS测定石英中48Ti的质量分数。我们建议天然石英,如Bishop Tuff凝灰岩石英(由EPMA测定;41±2 lg/gTi级,2 s)比NIST参考更适合作为低钛的质量分数,因为参考材料基体效应有限,Ca元素干扰得以避免,质量数为48的干扰元素的量可以忽略不计,从而允许使用归一化的48Ti质量。钛的平均质量分数是0.9±0.2 lg/g(2 s),这是从捷克Erzgebirge的33个低温石英通过48钛作为归一化质量和Bishop Tuff凝灰岩石英作为参考材料而得到的。对于50 lm个单点的48Ti的2s分析其不确定度为8%,当测量100lm个单点时其不确定度为7%,比使用49Ti作为分析物时产生的21-41%的不确定度(2s)要高得多。
方案详情

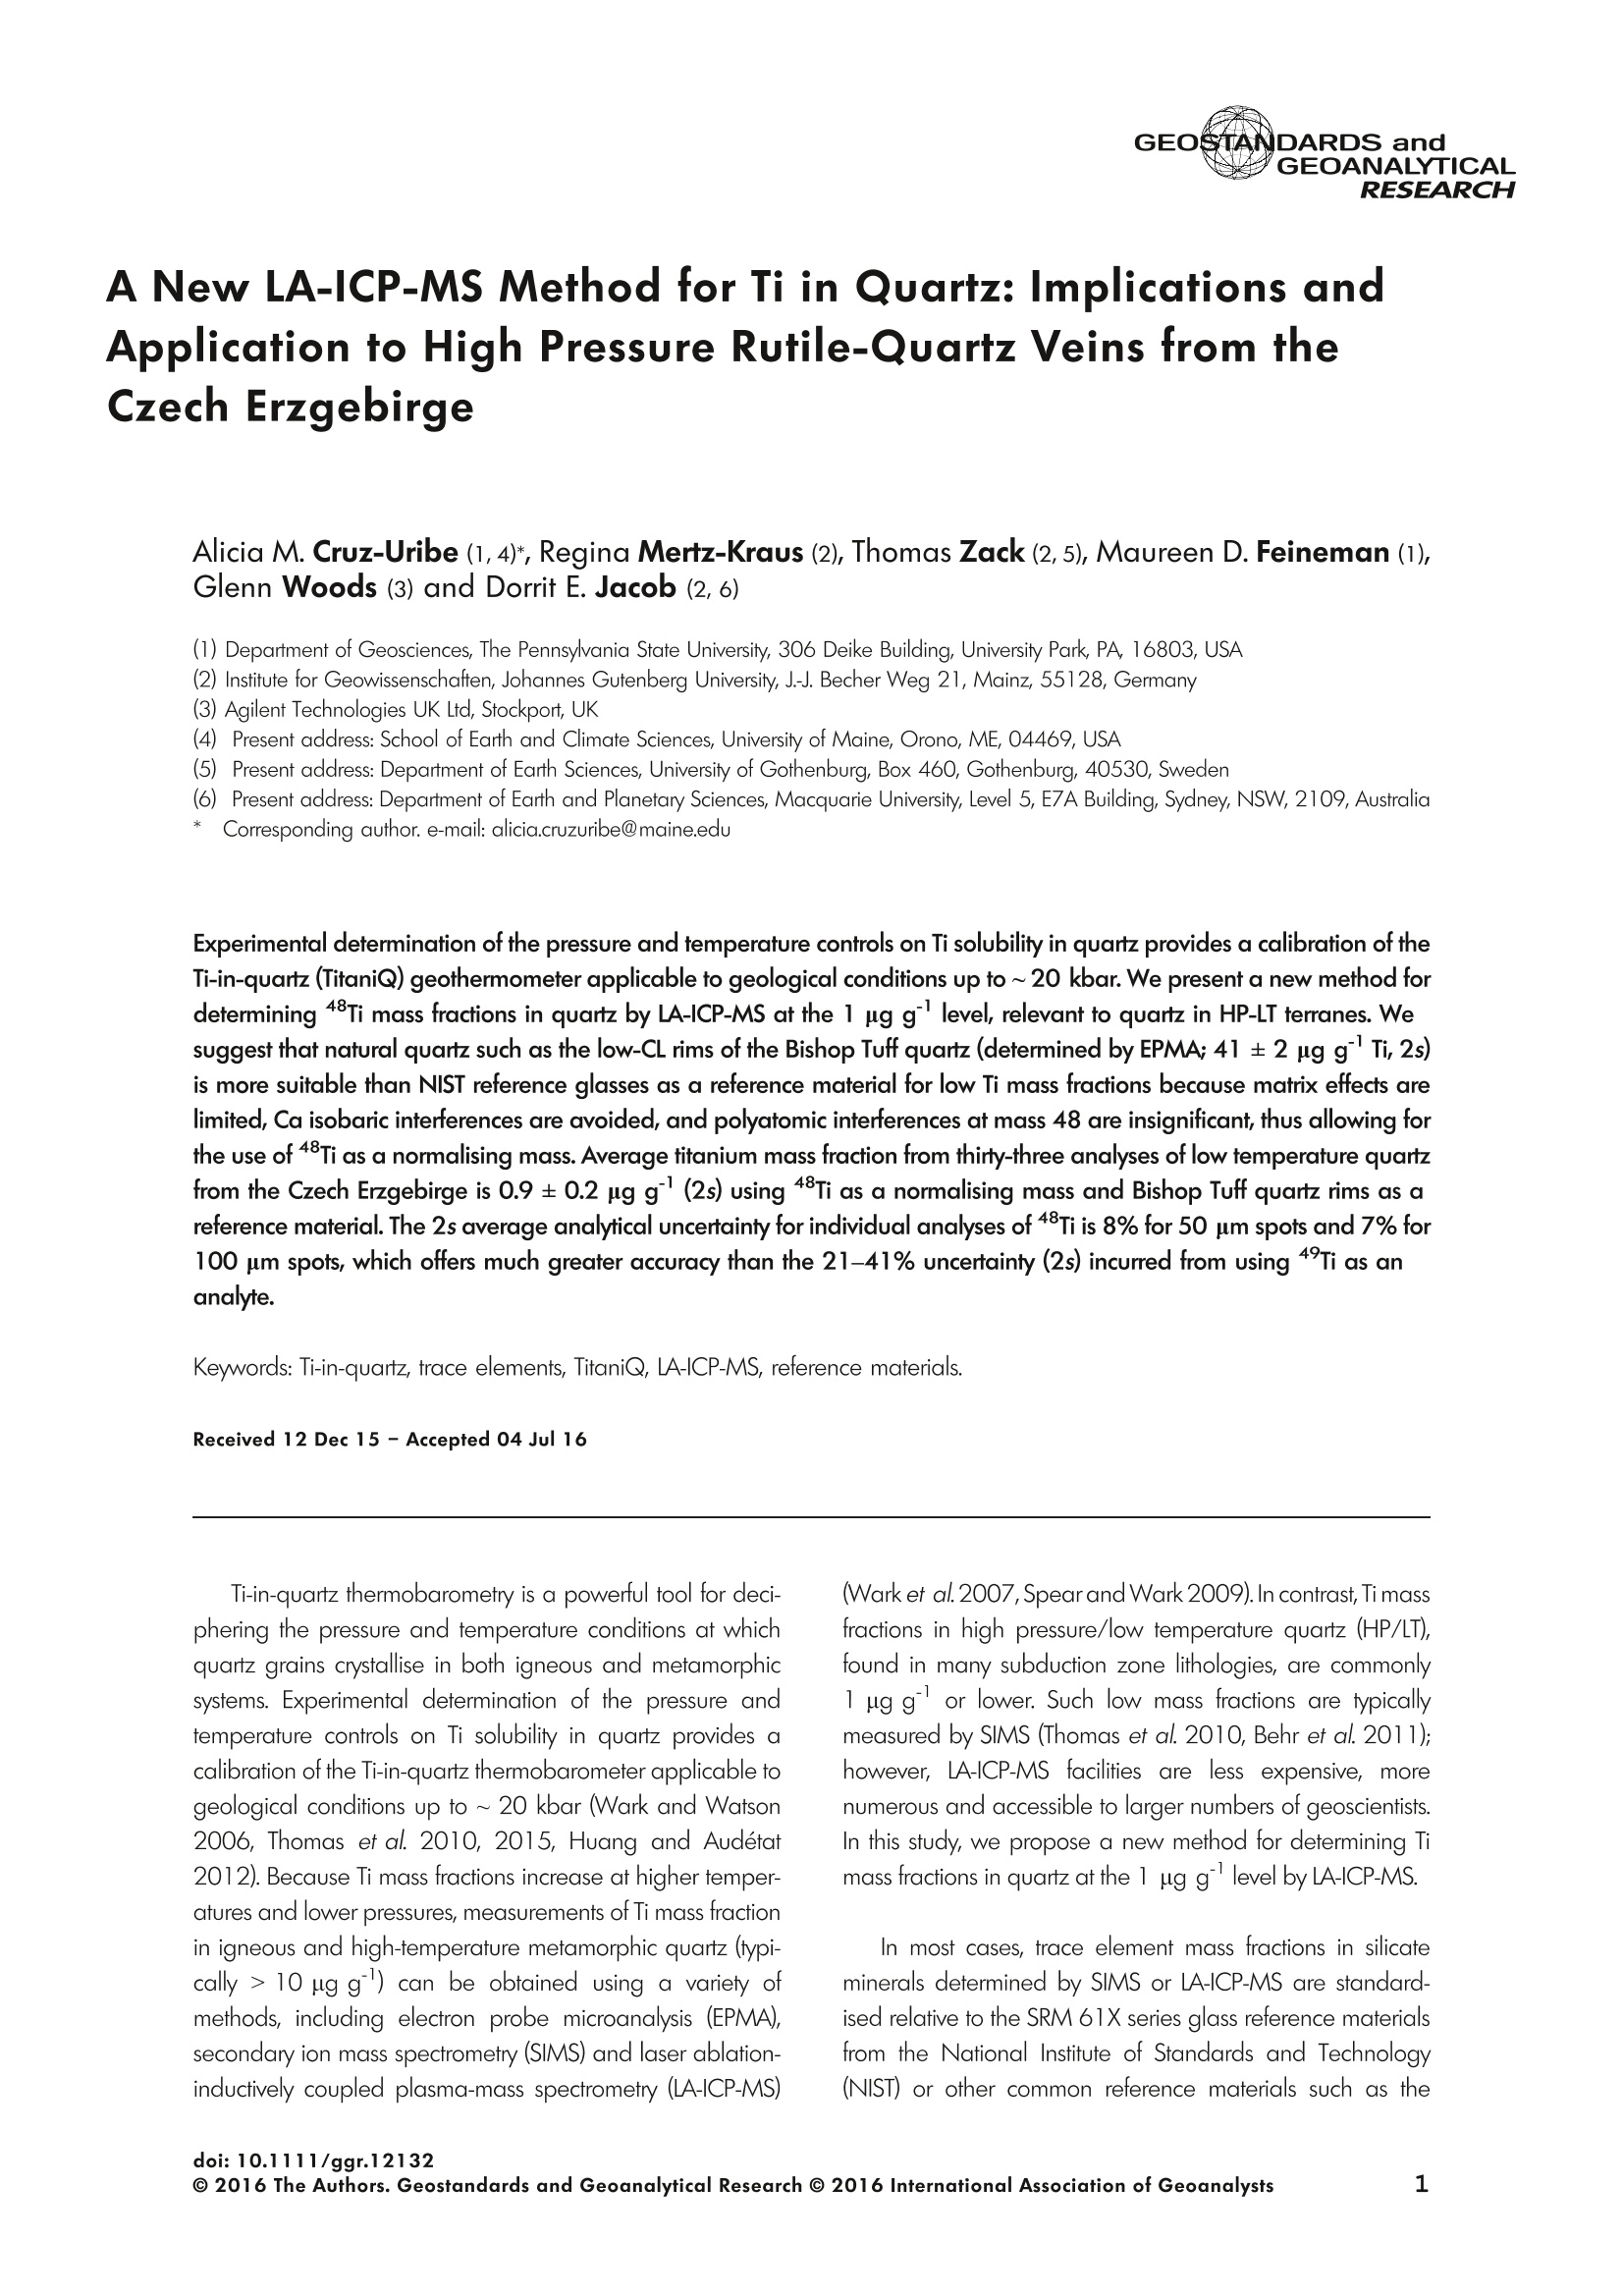
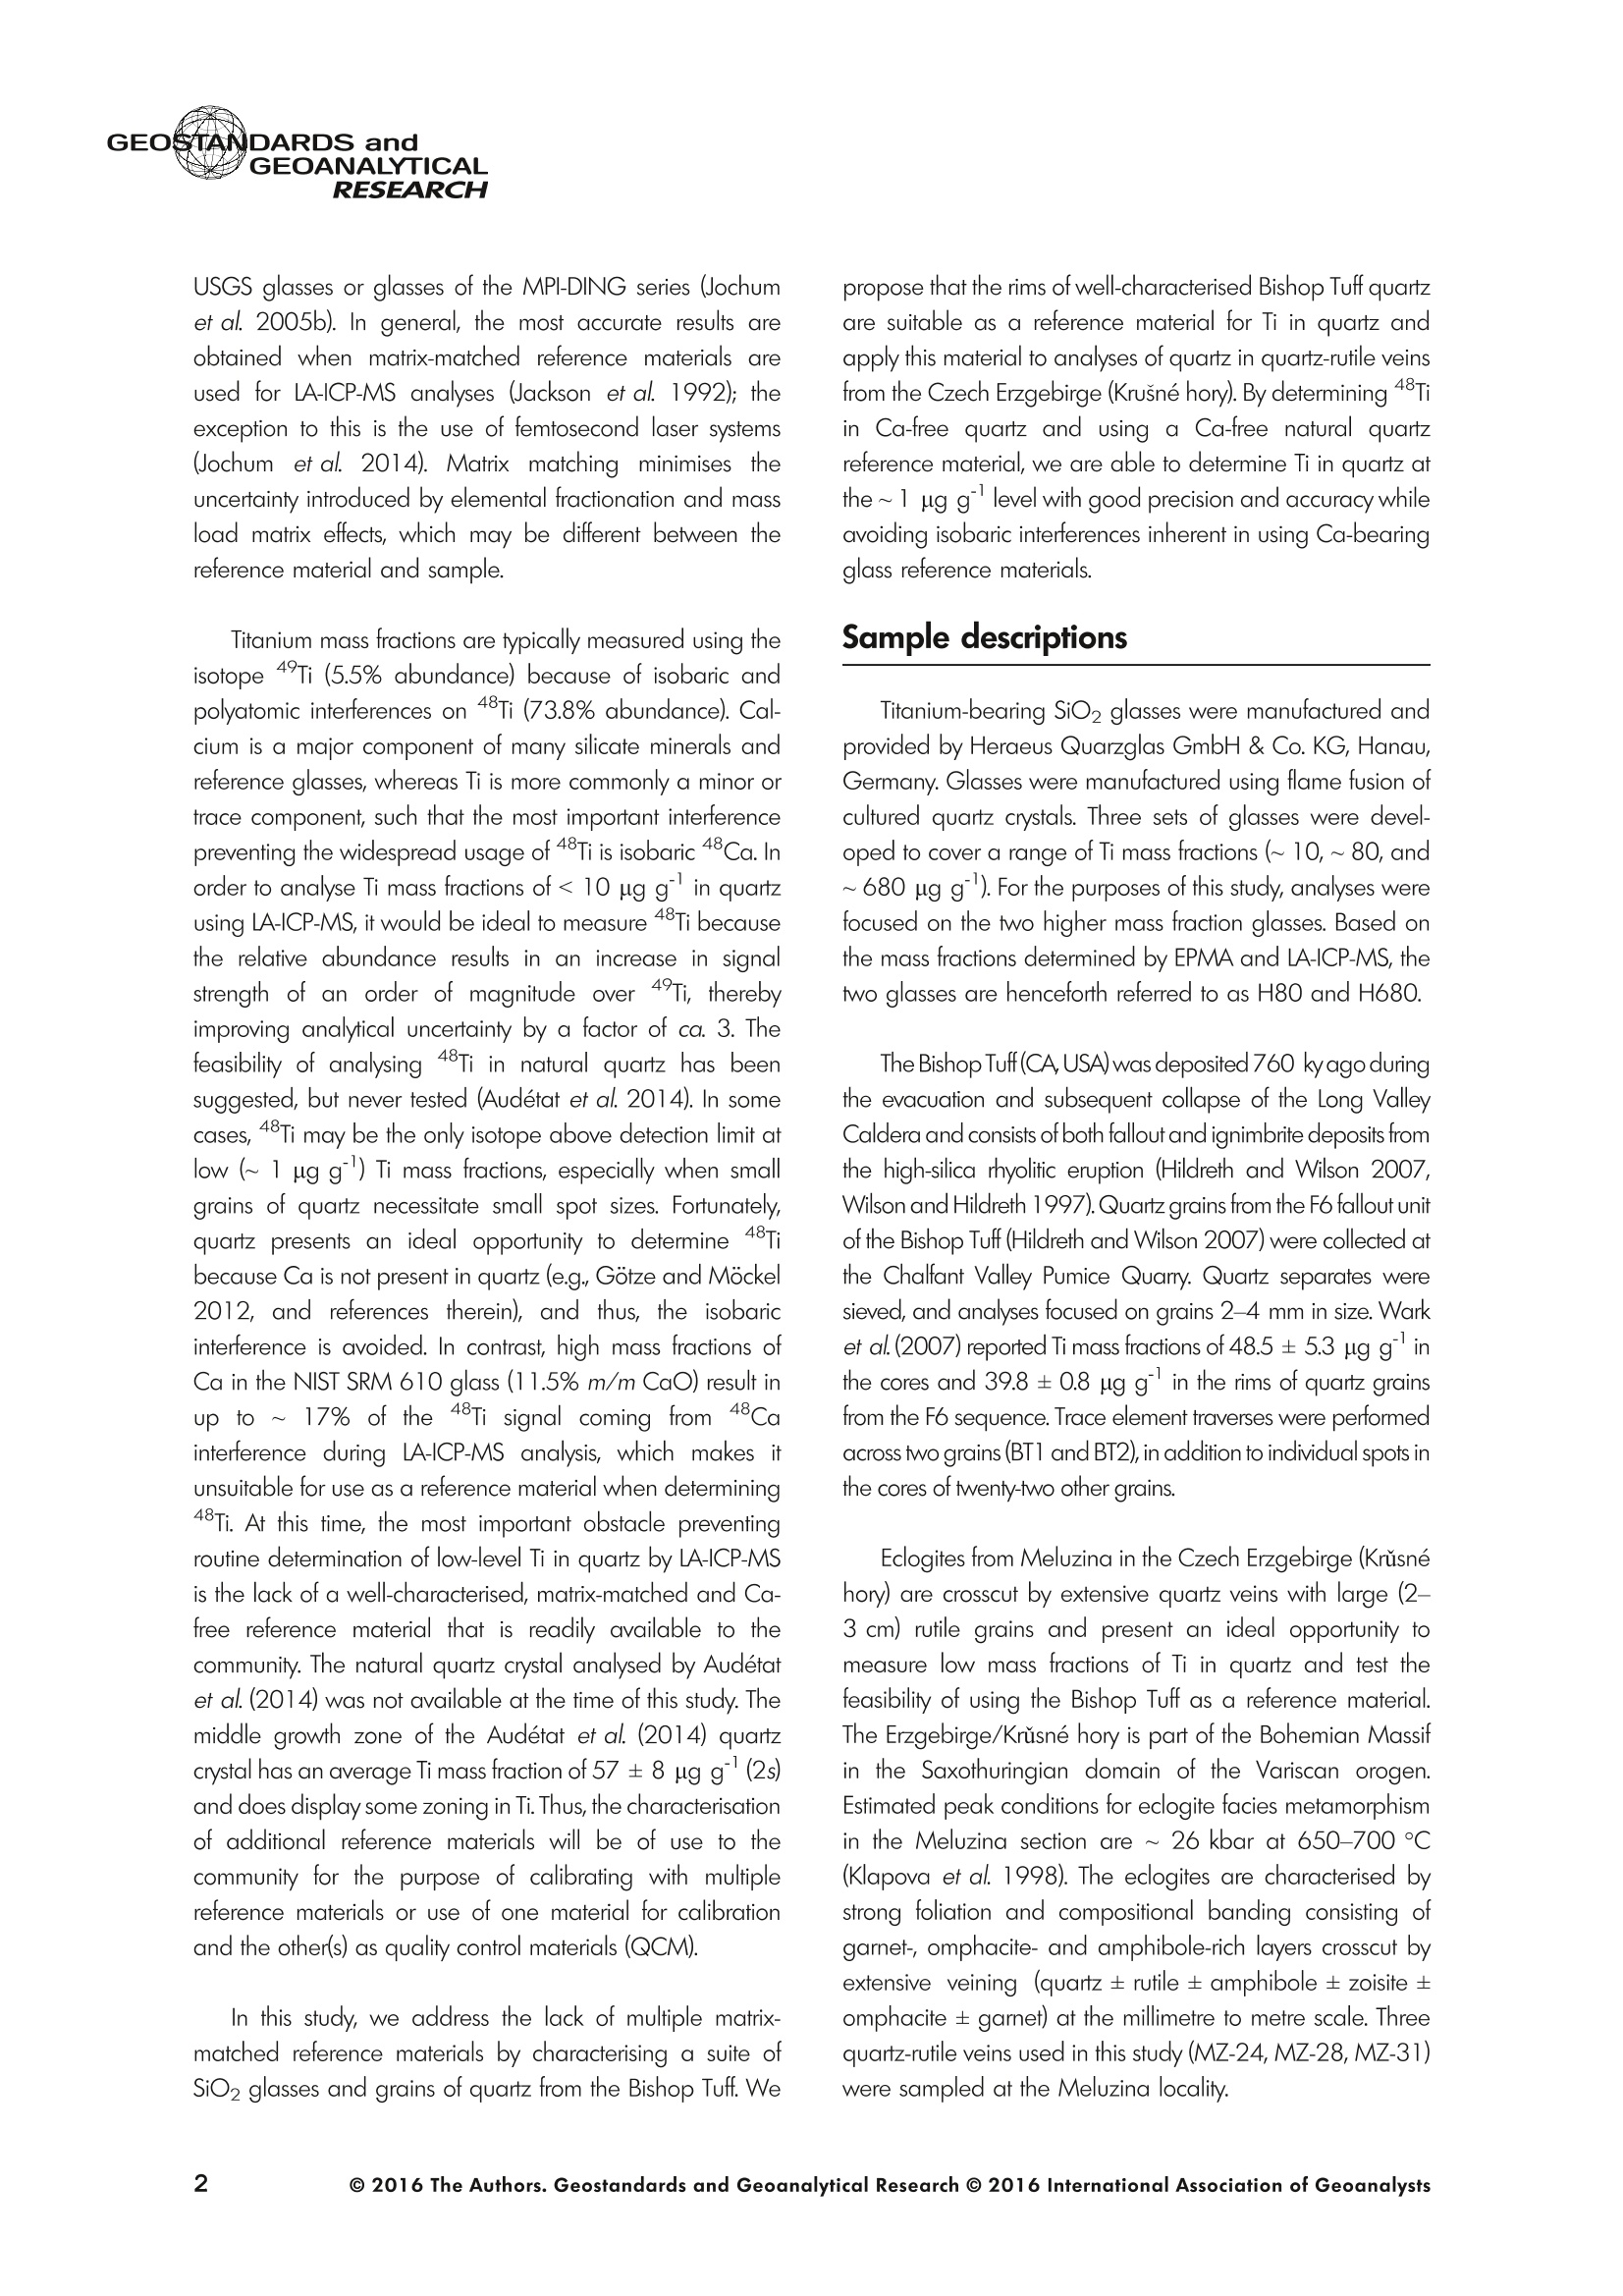
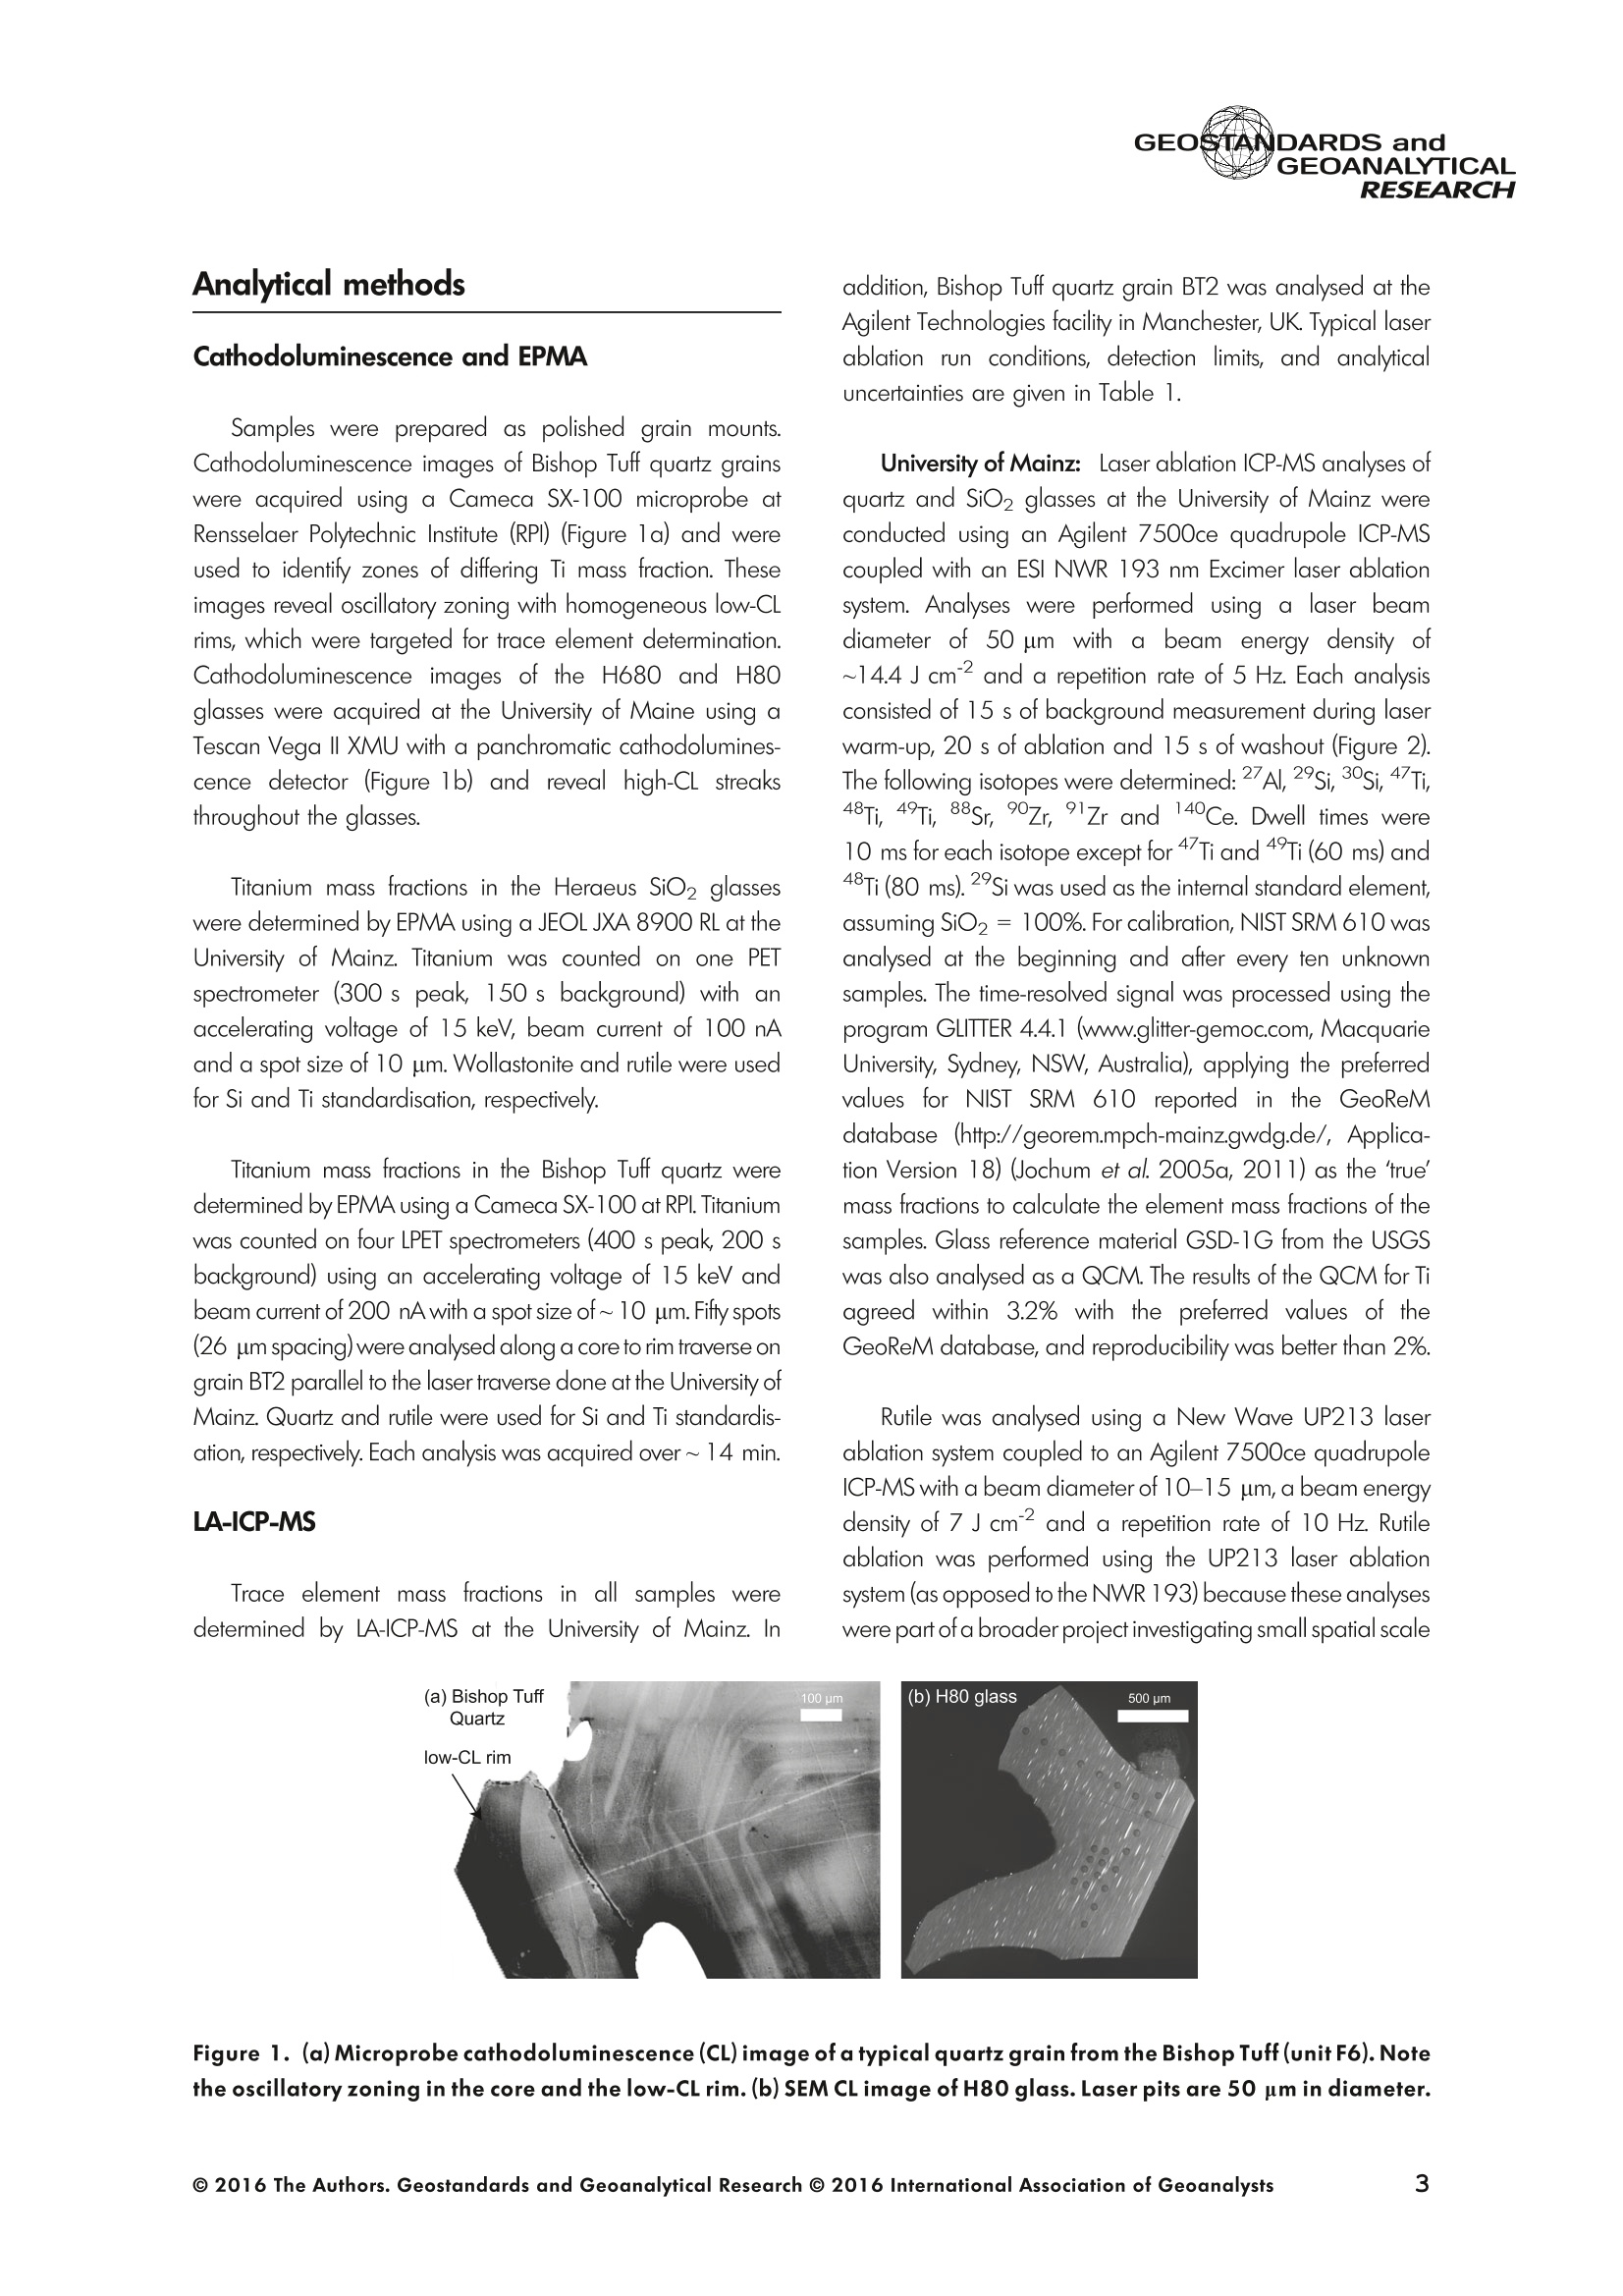
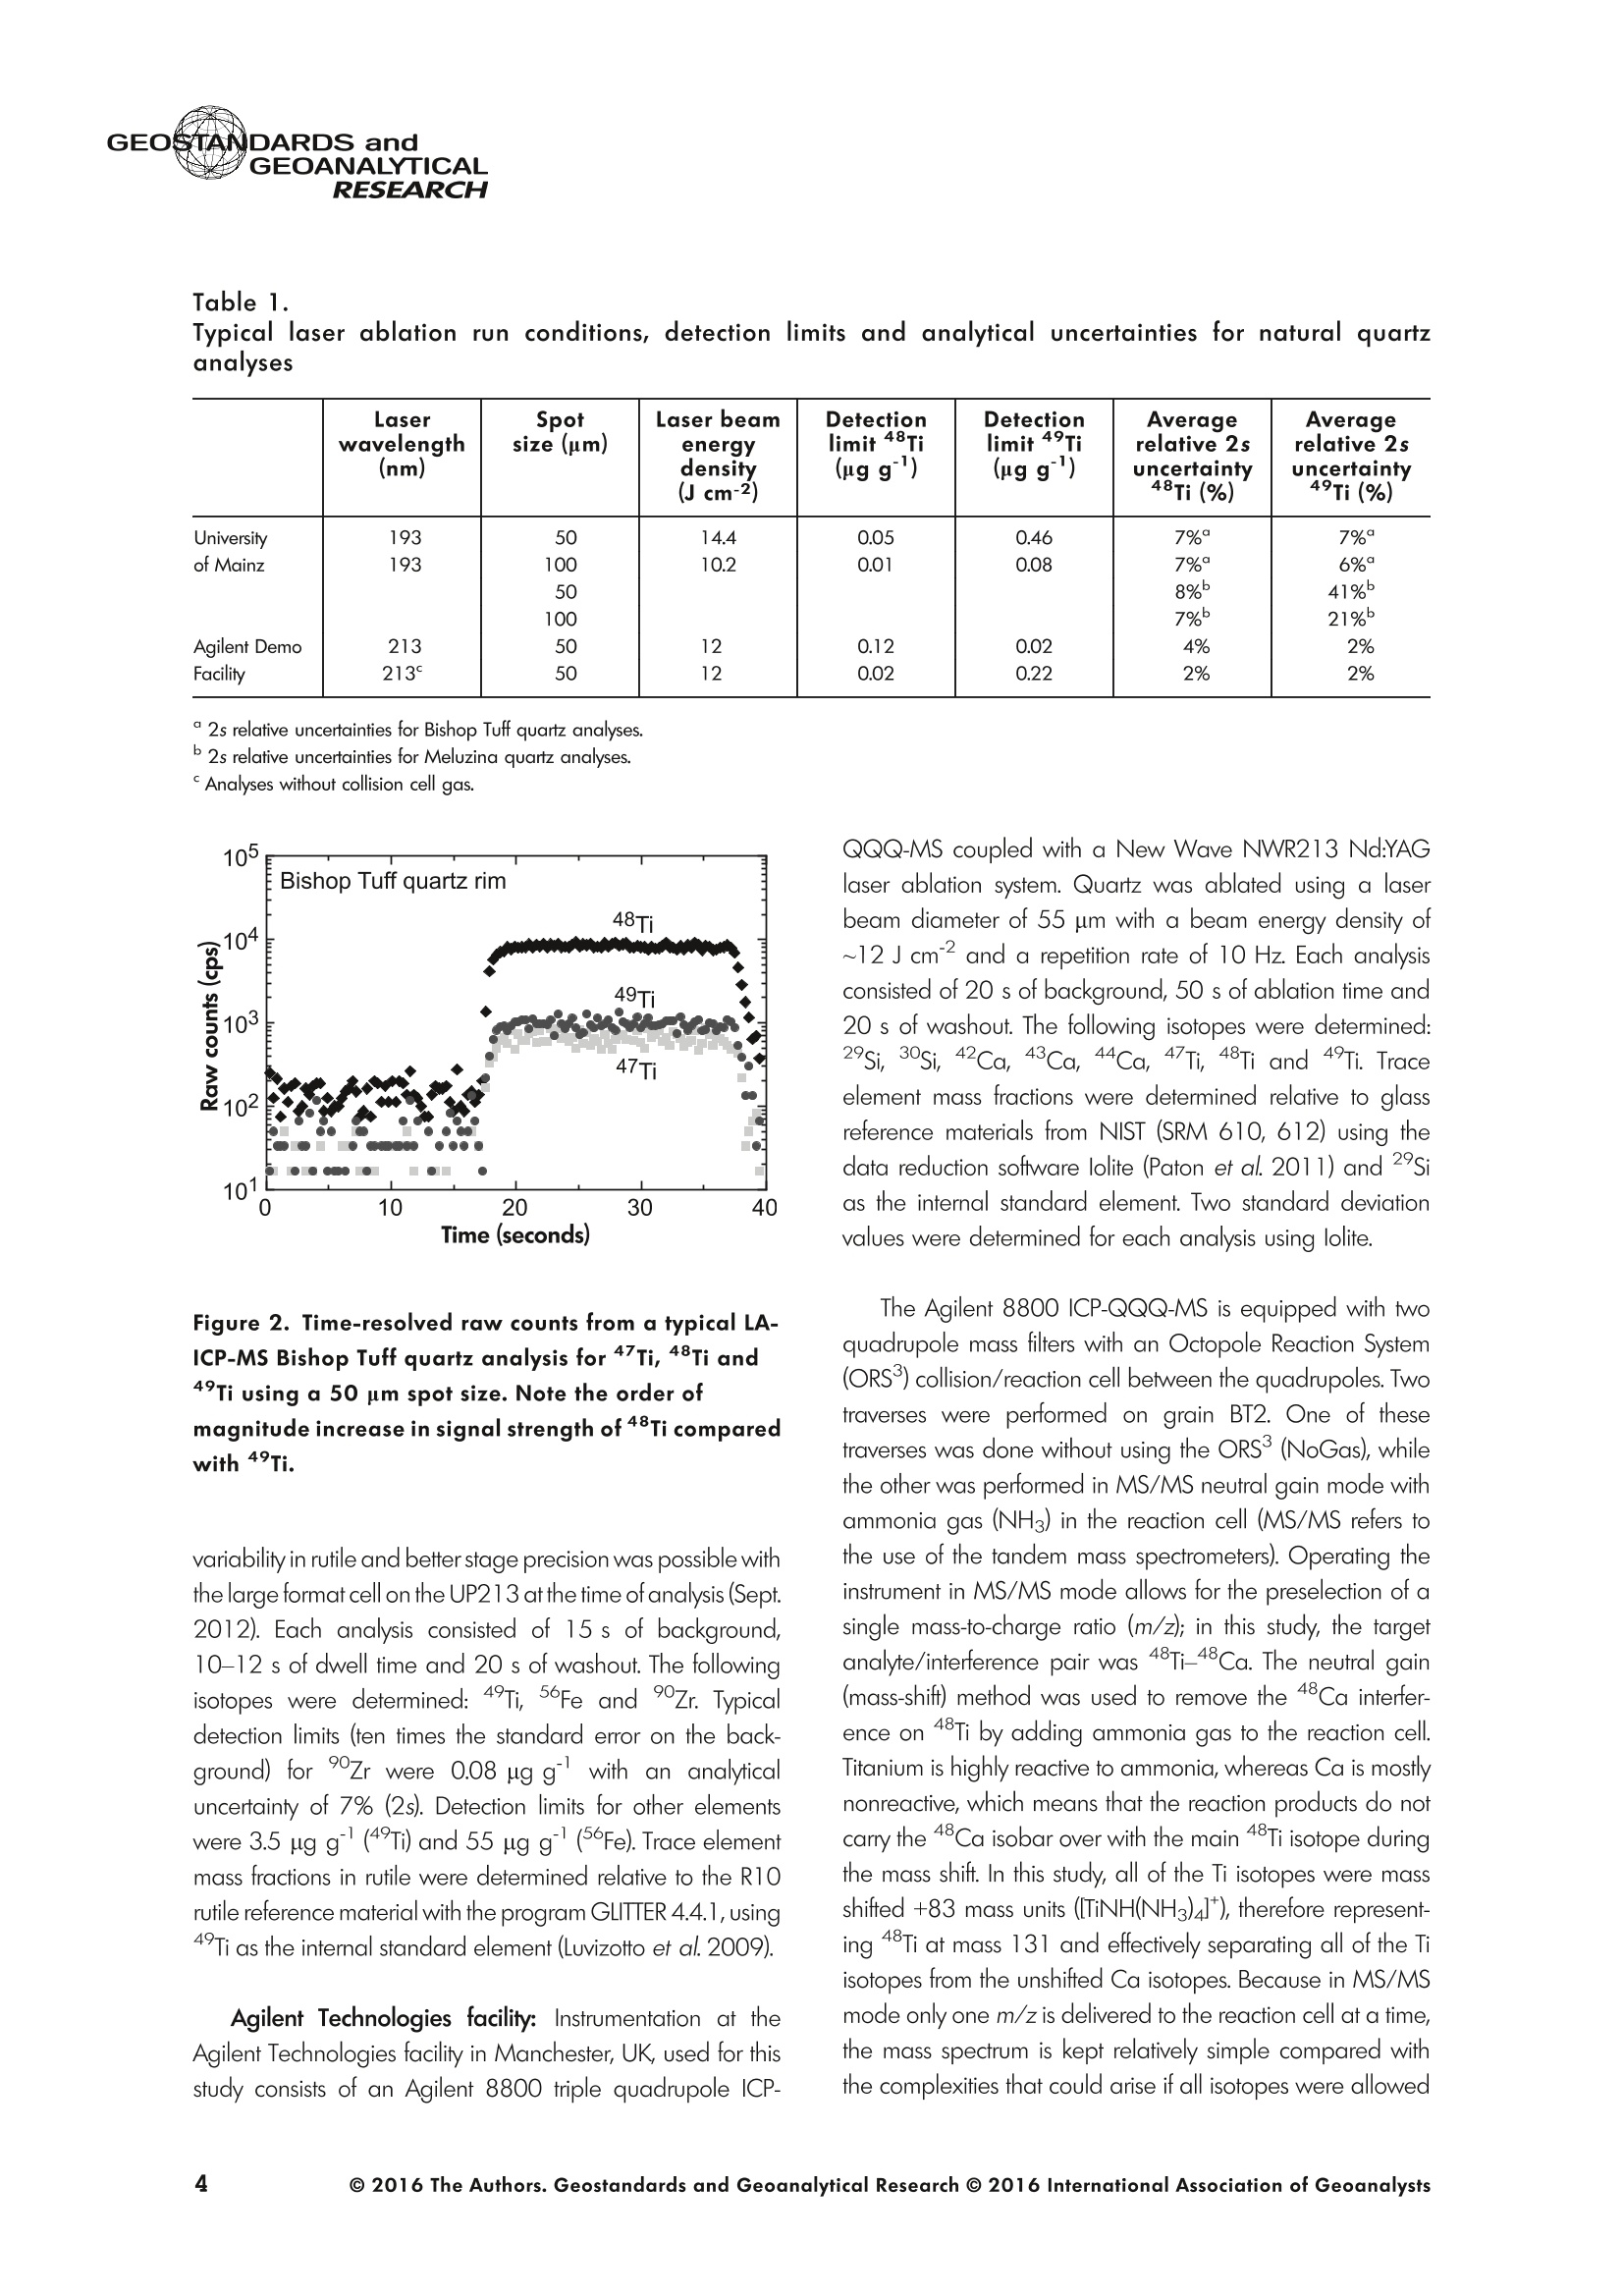
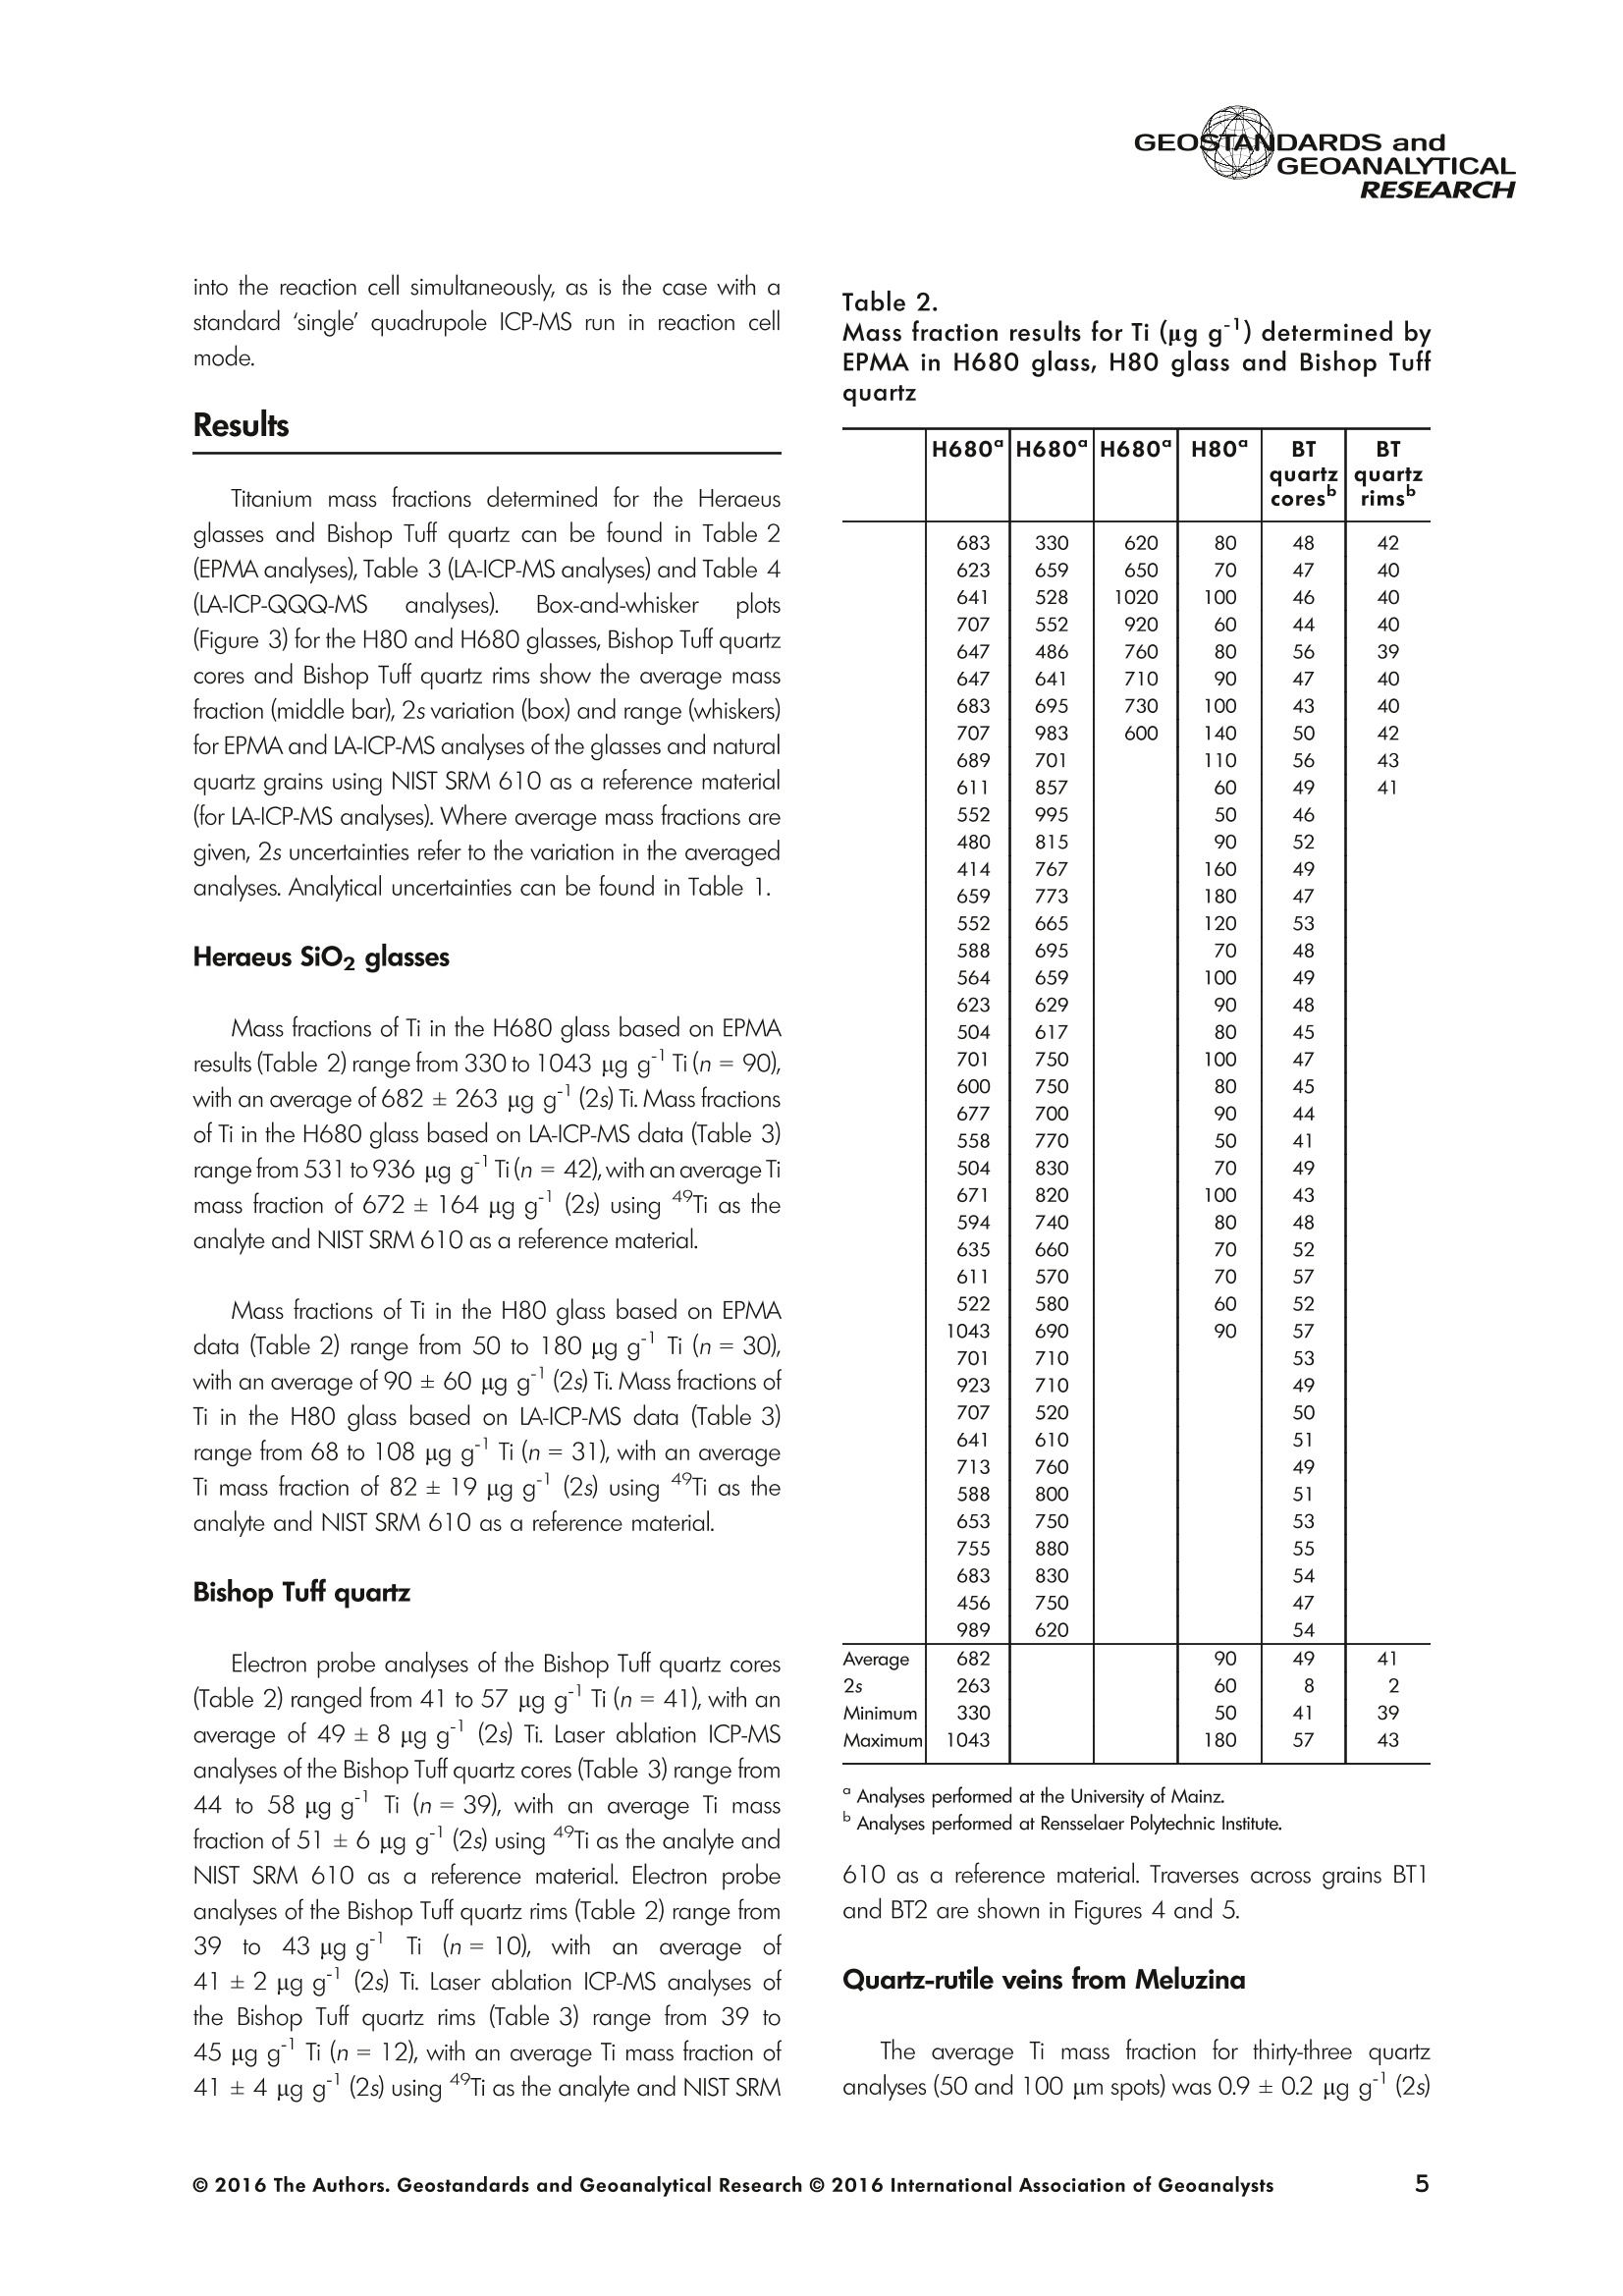
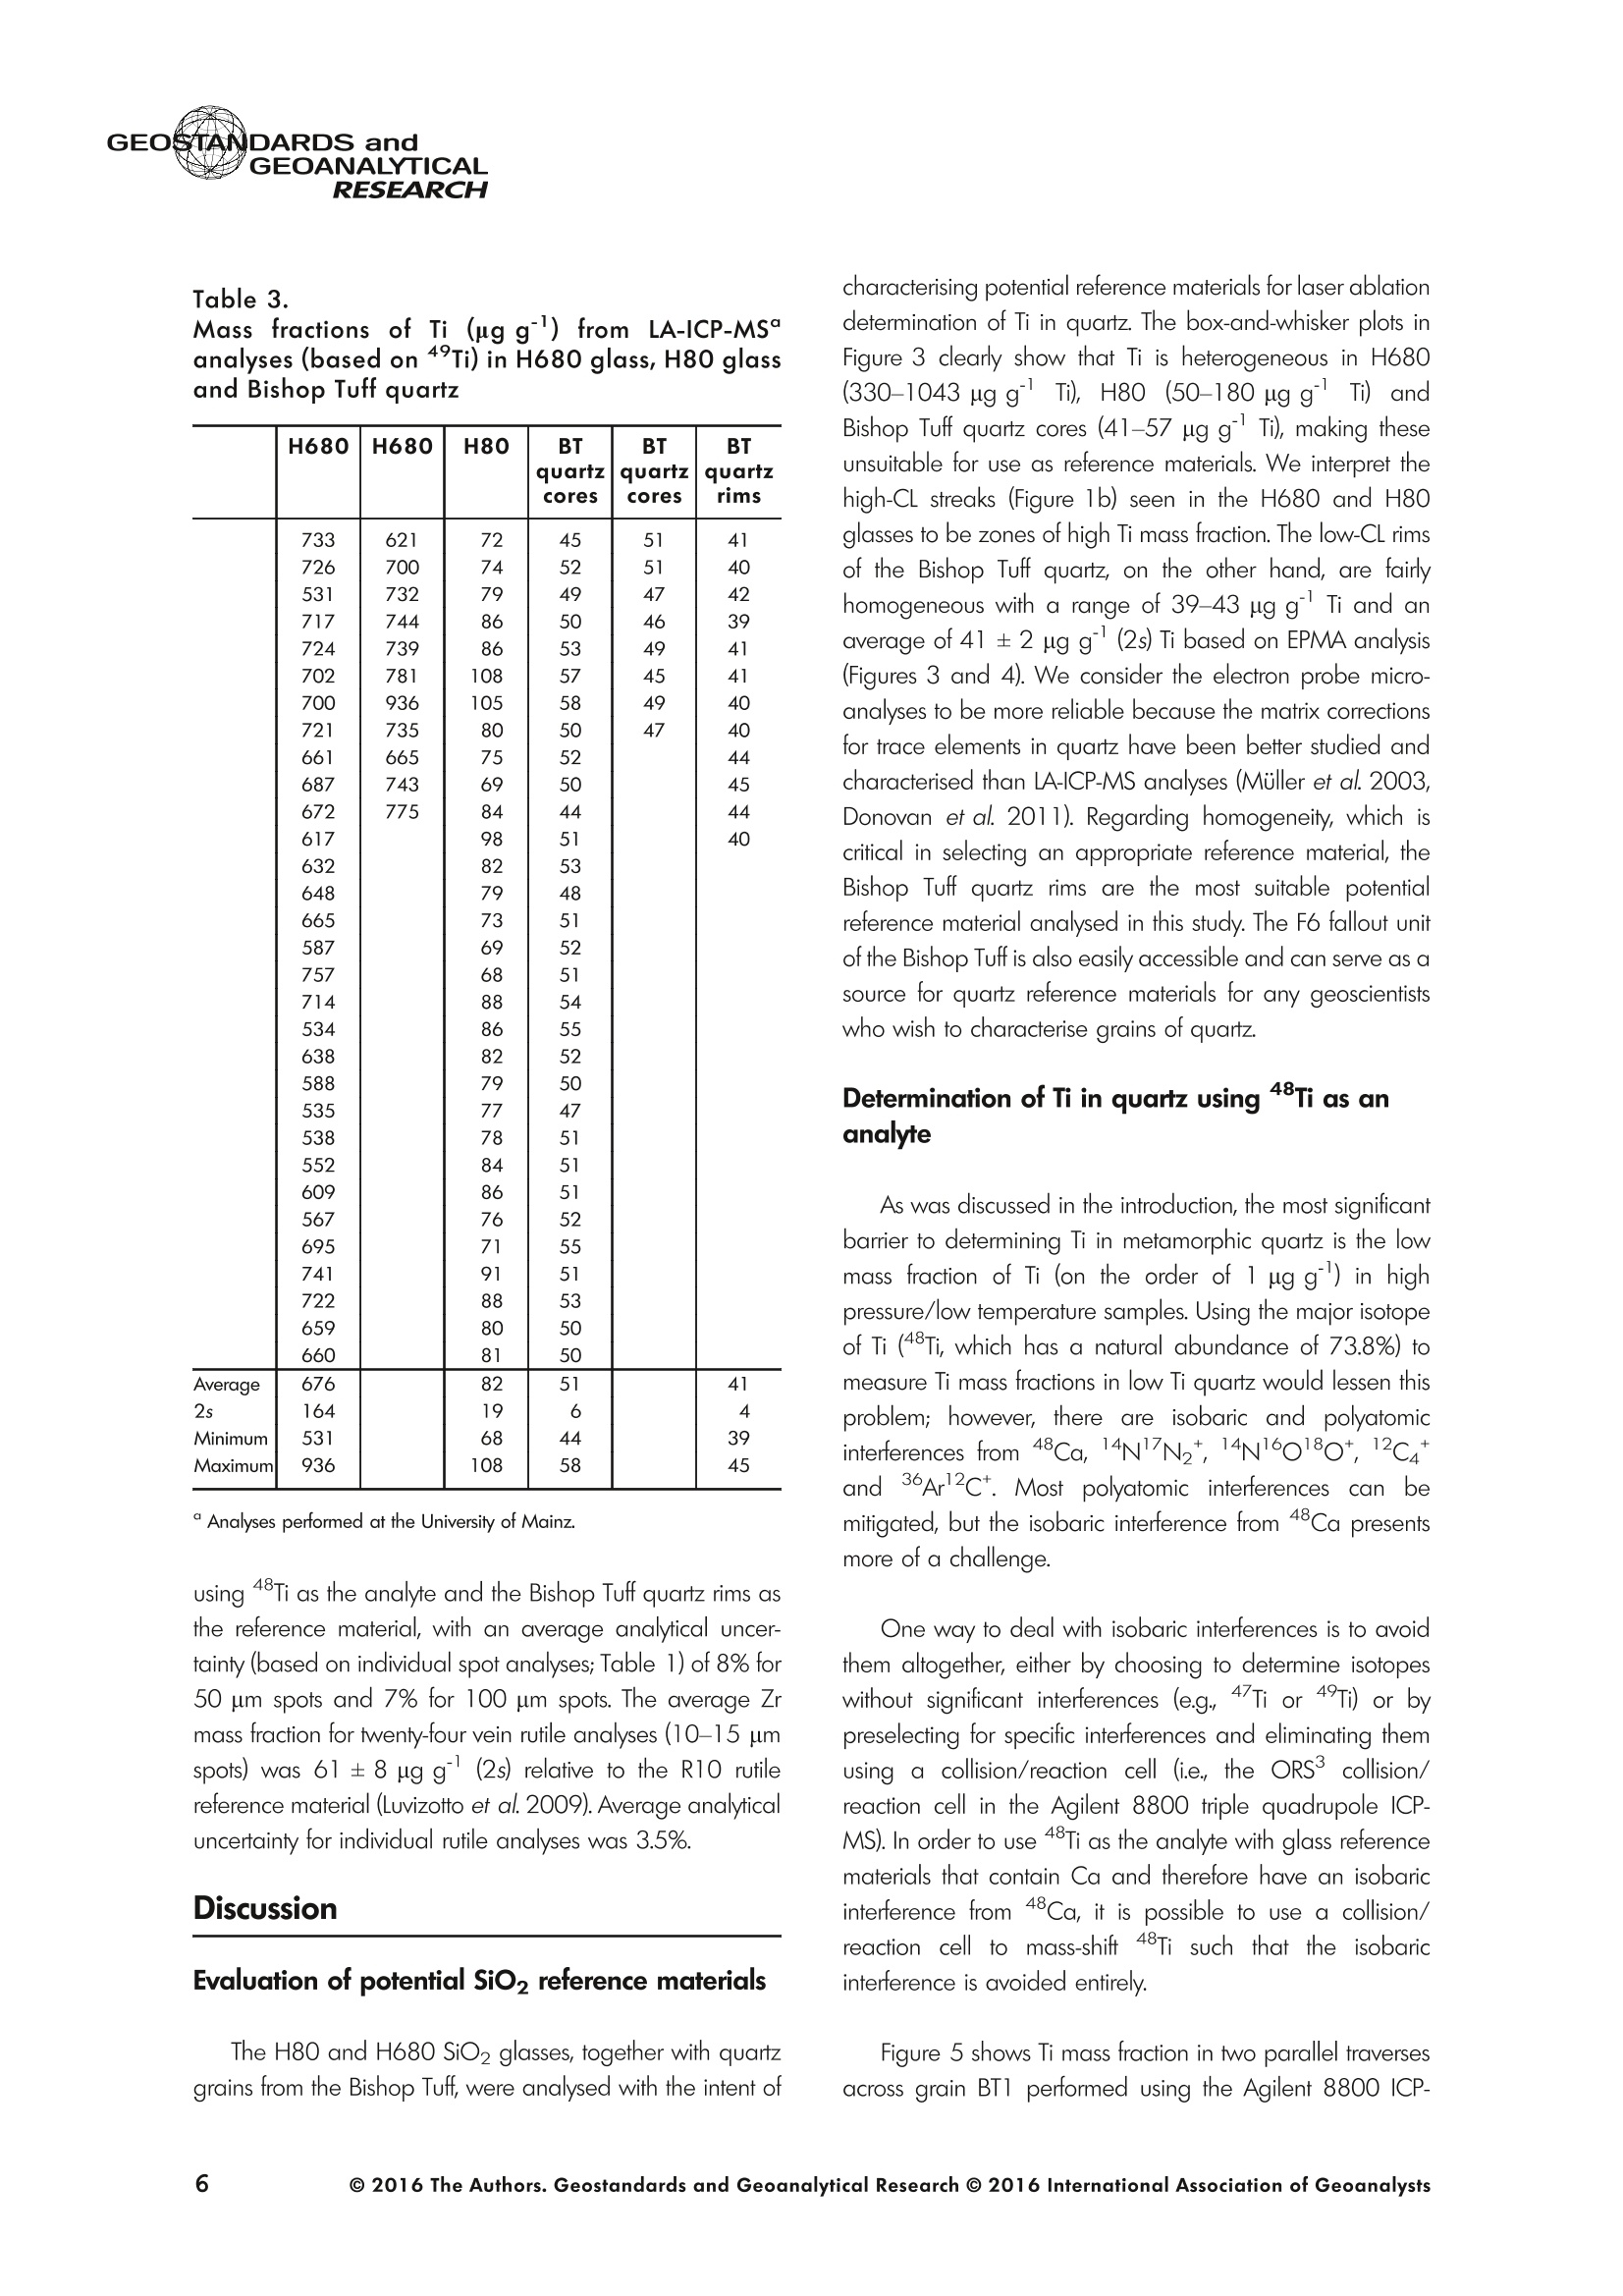
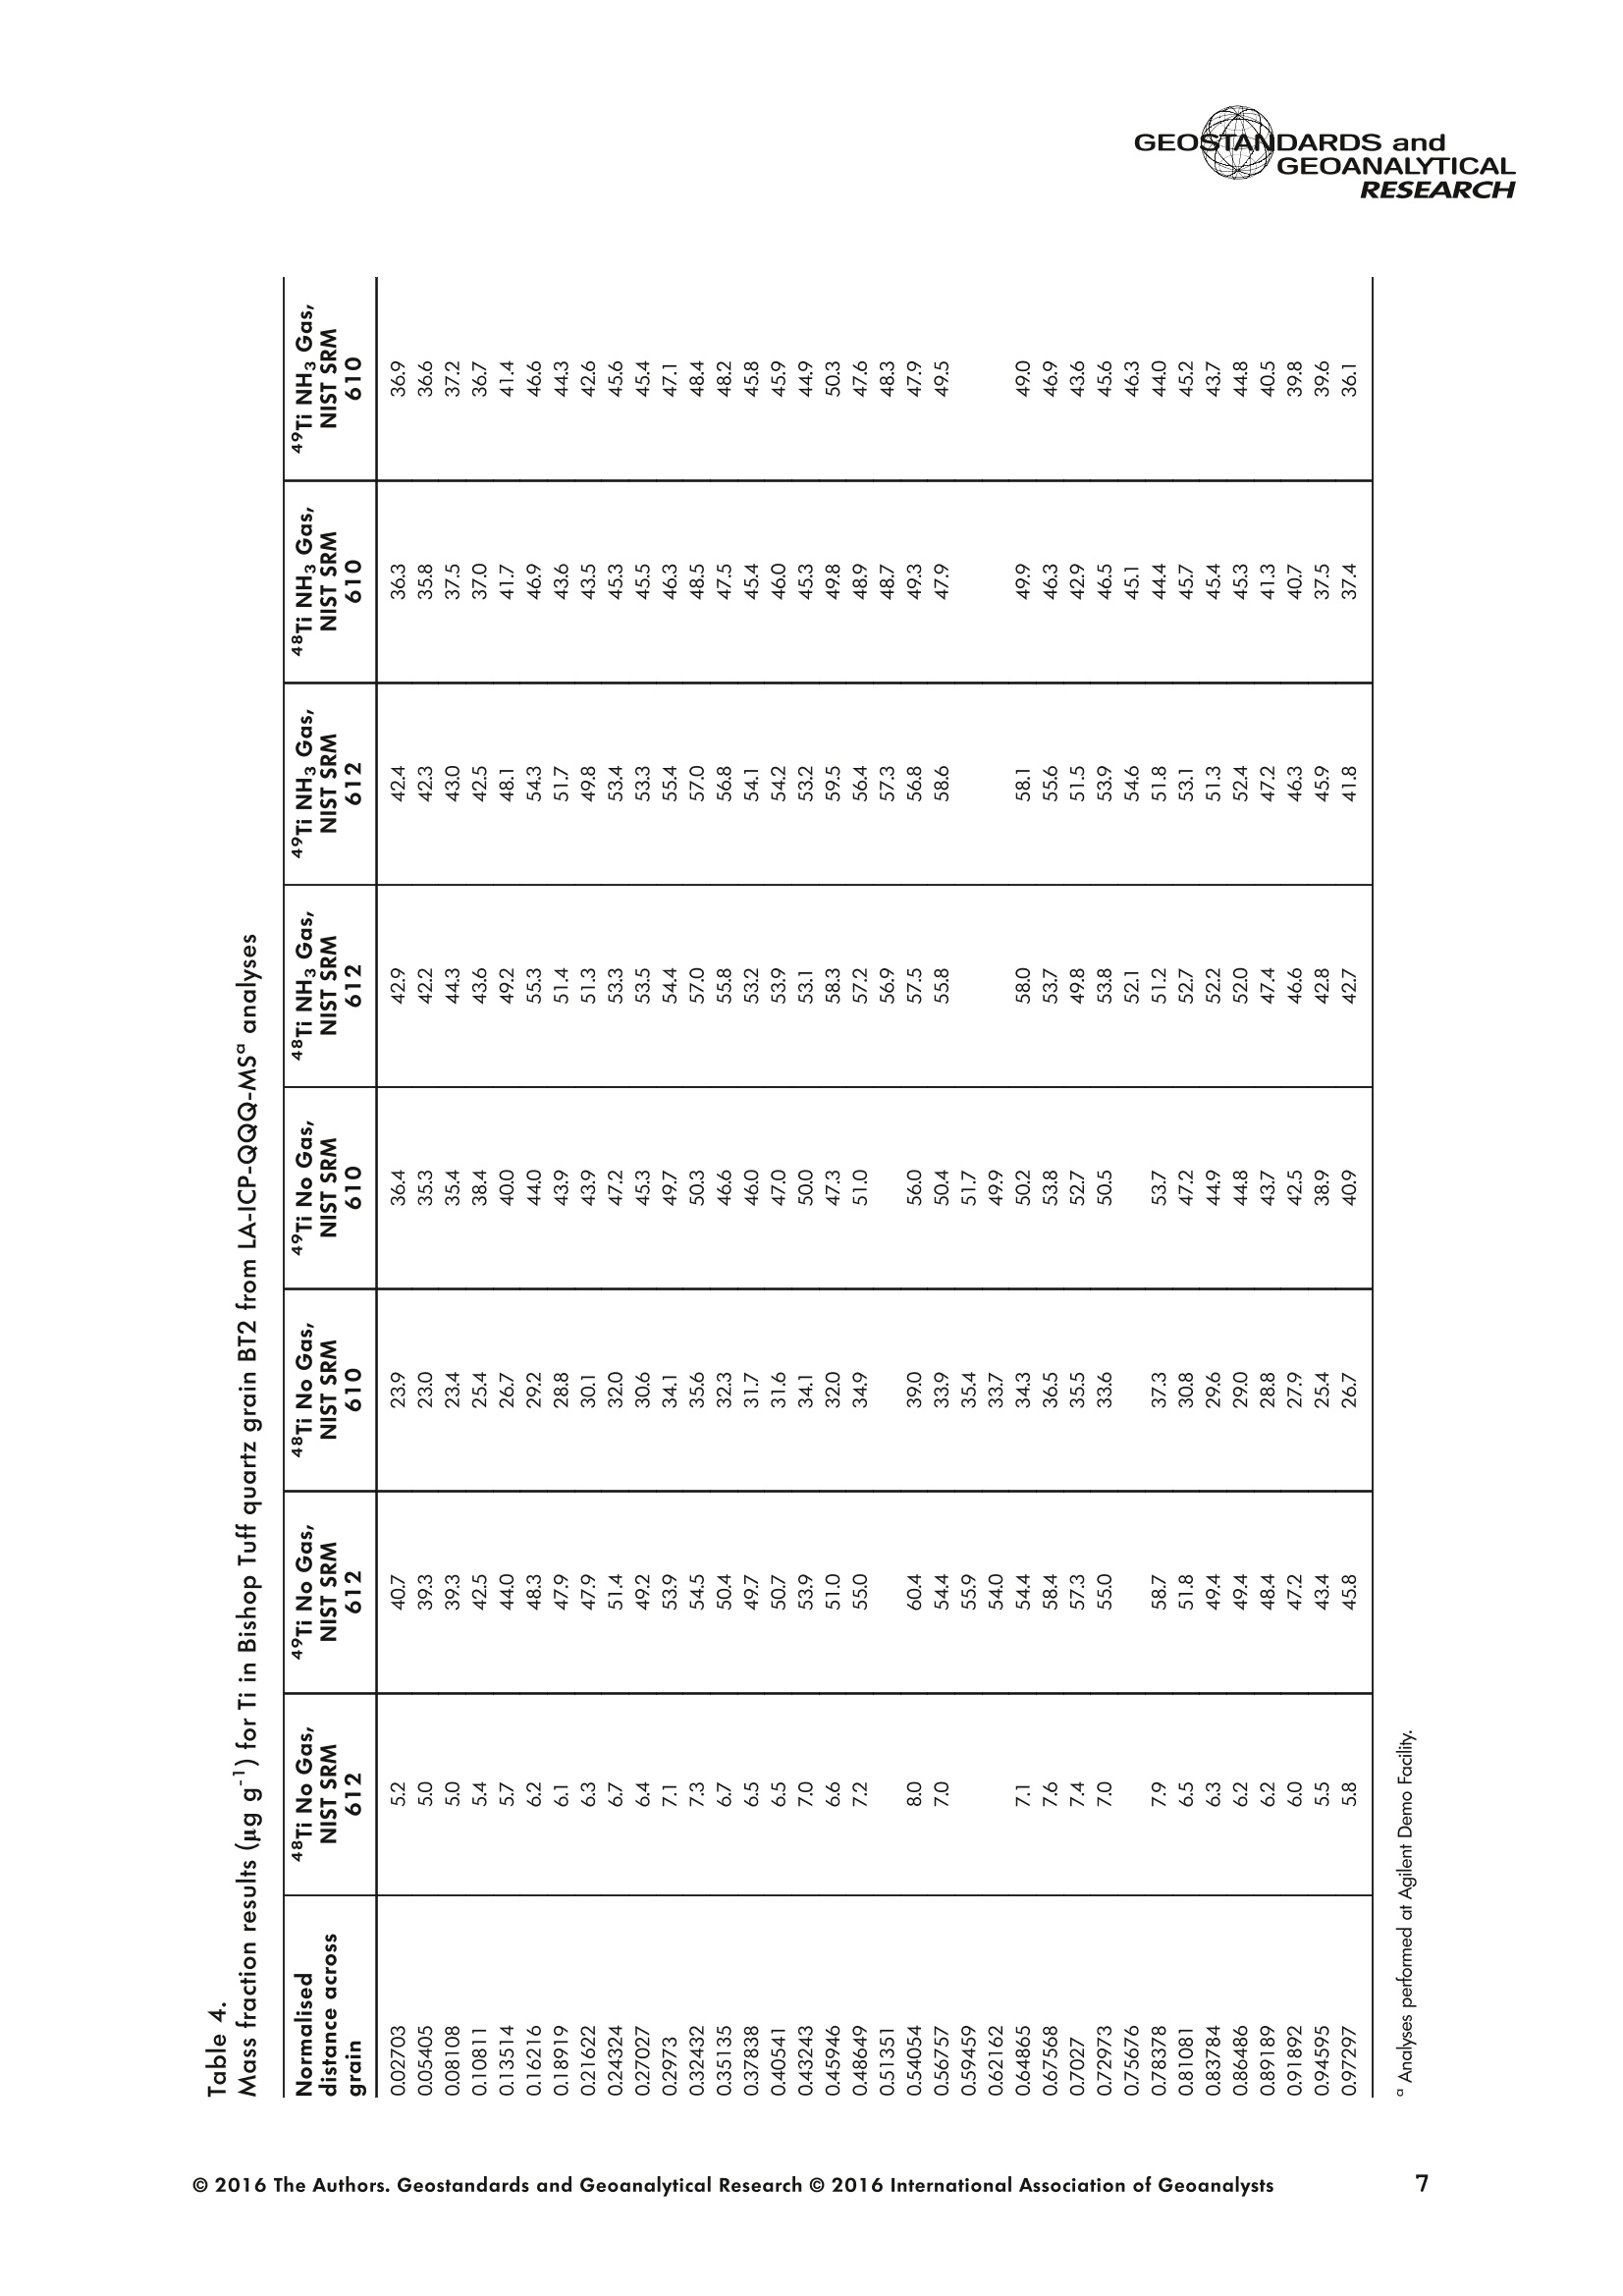
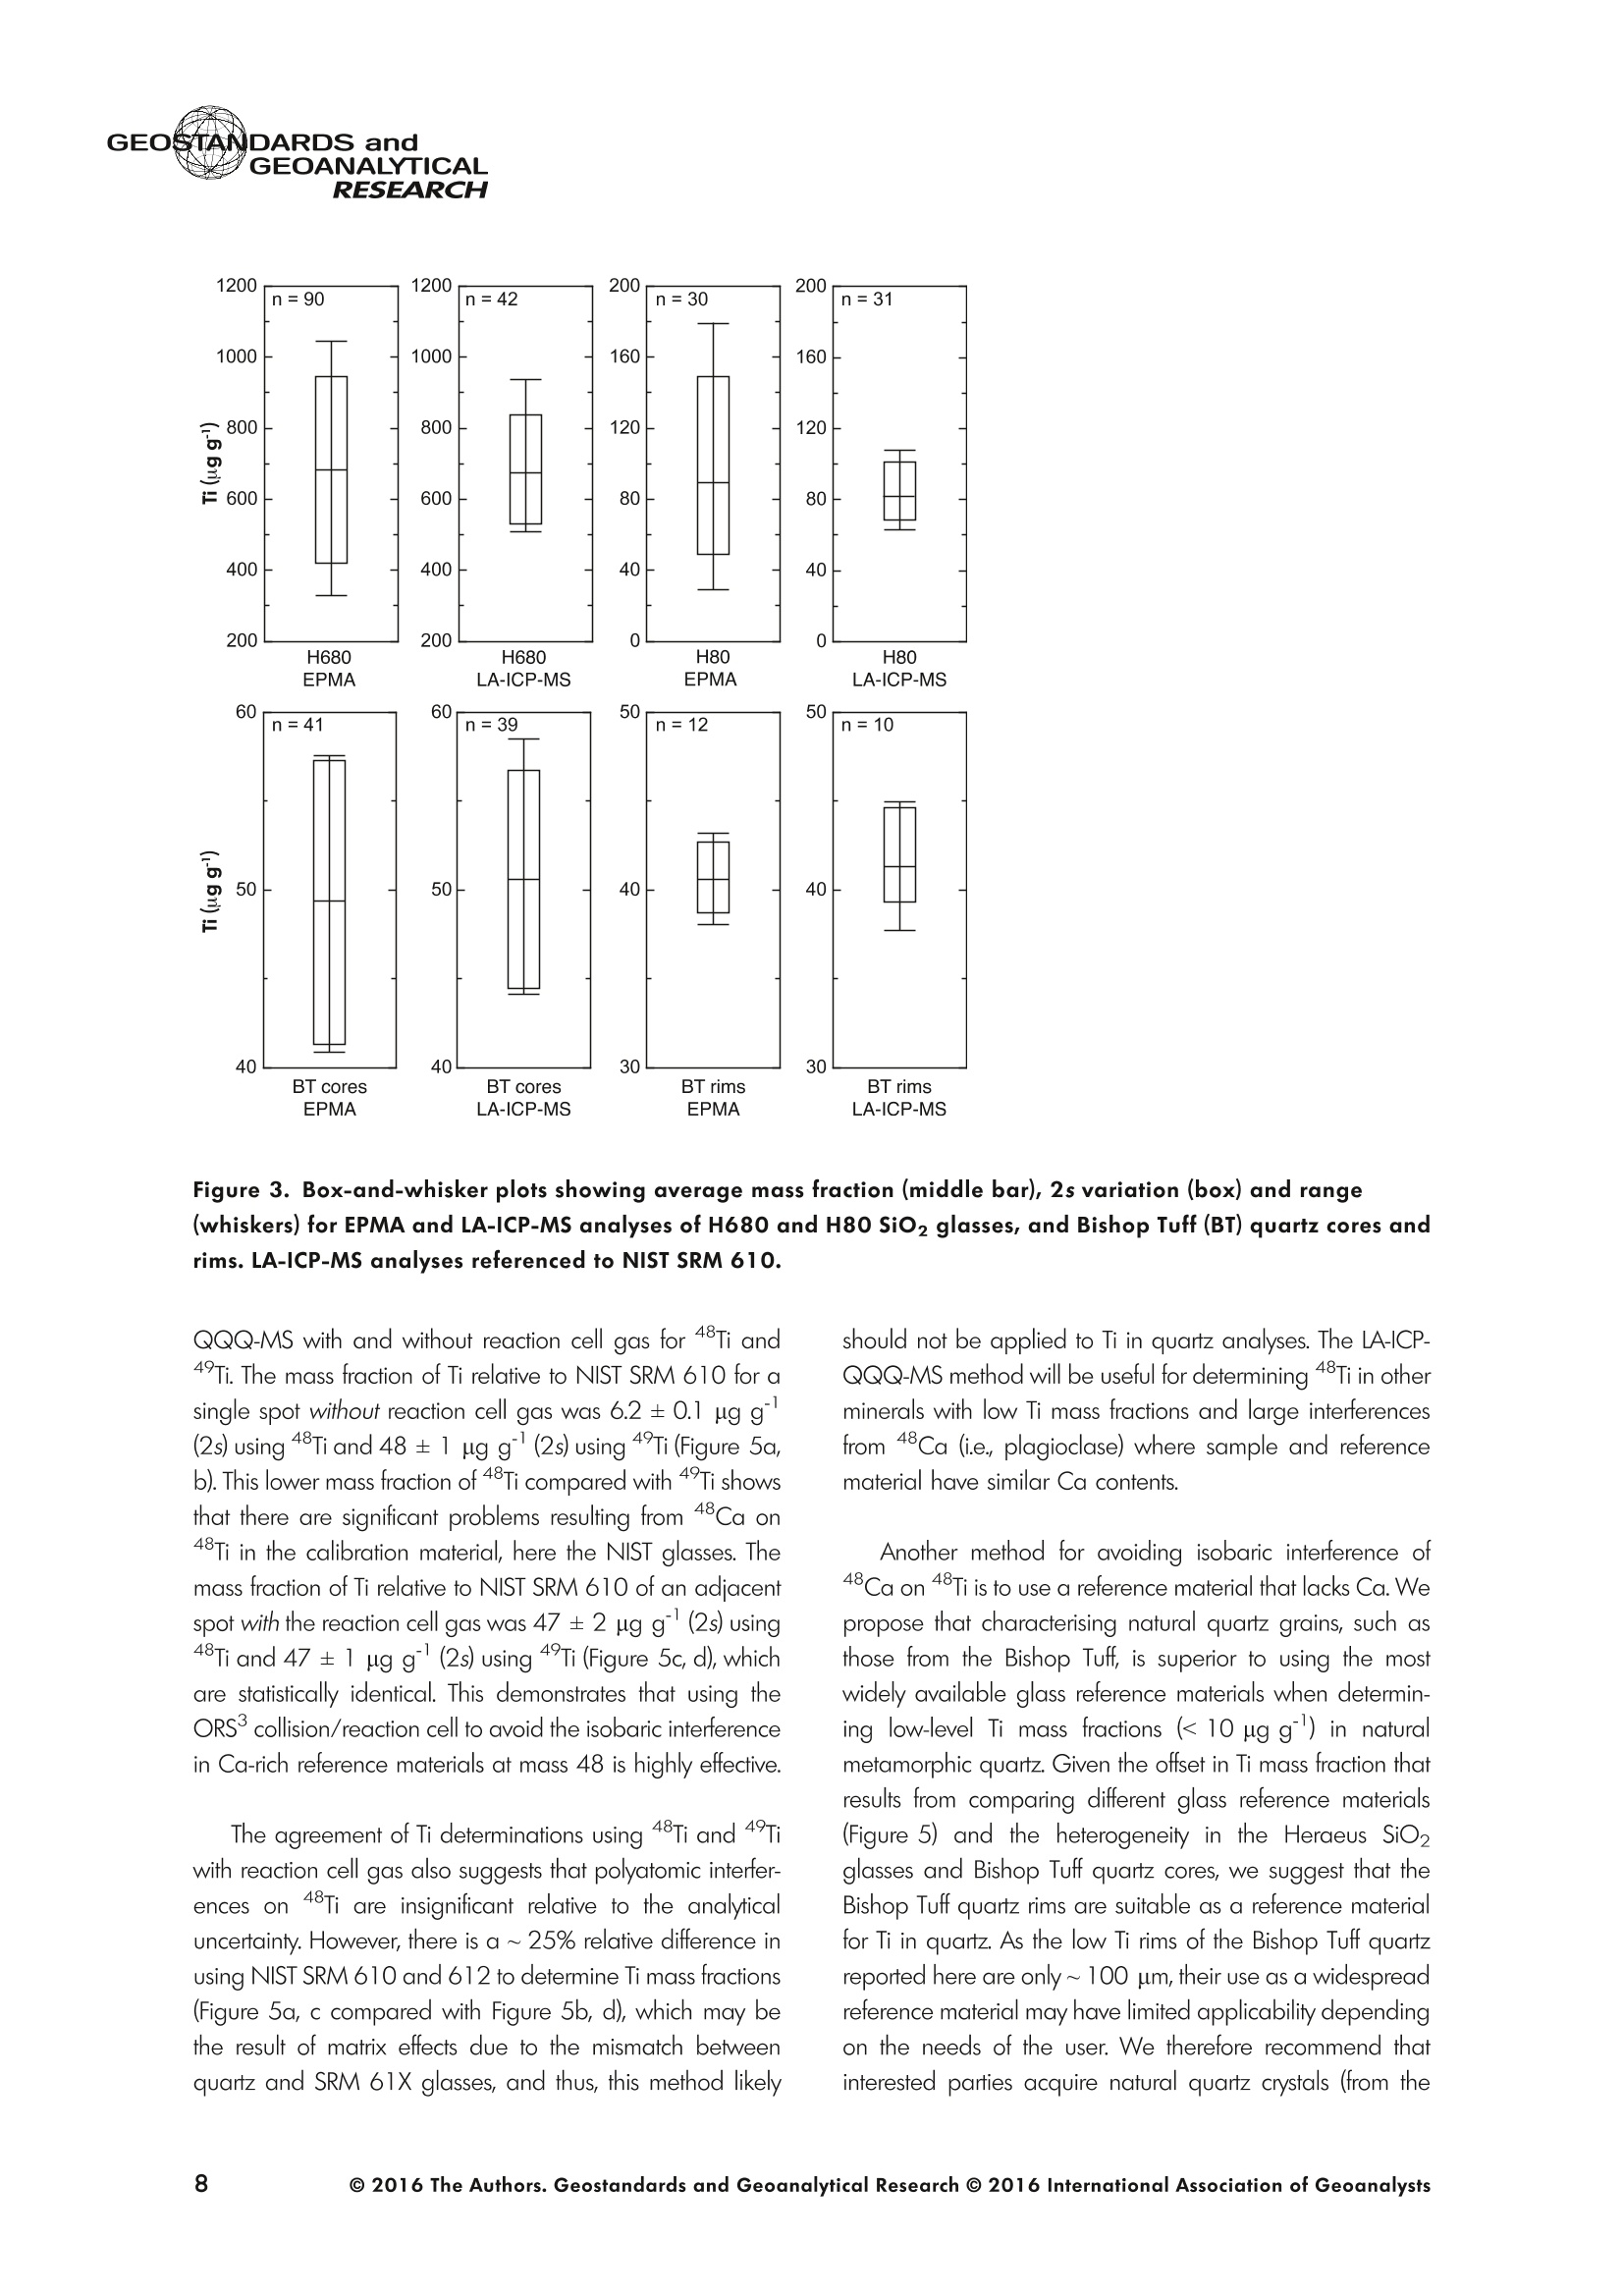
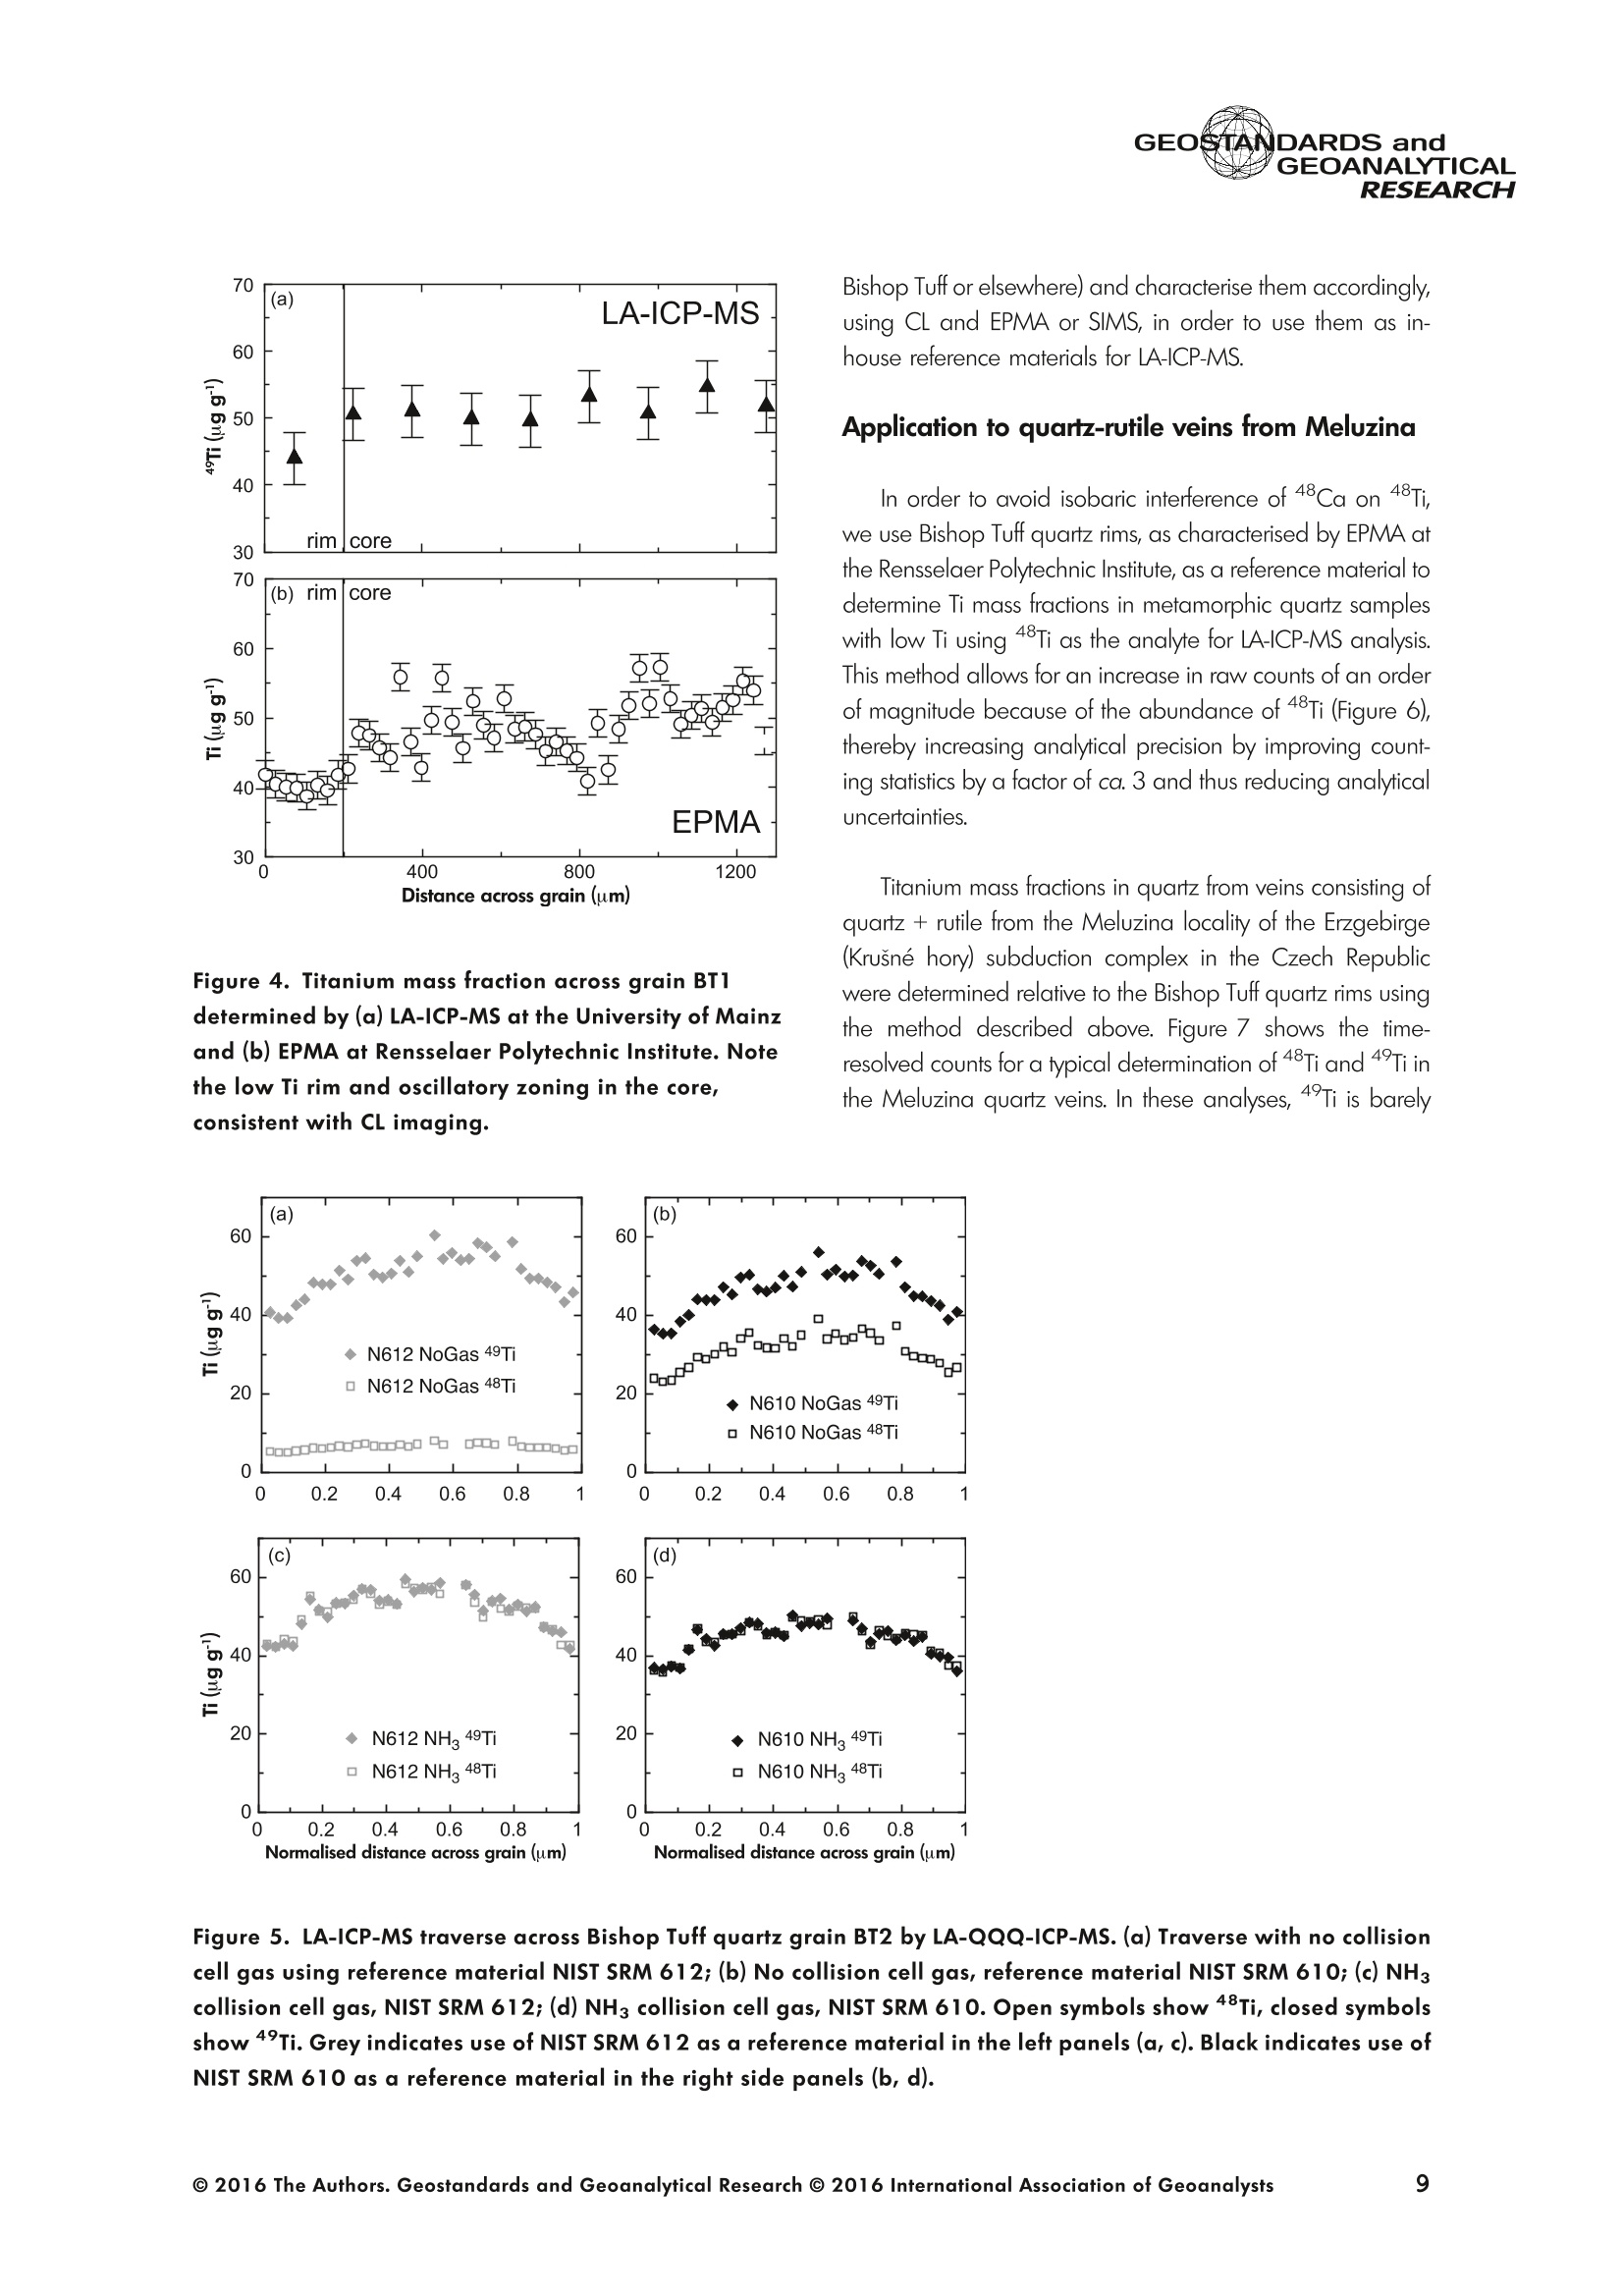
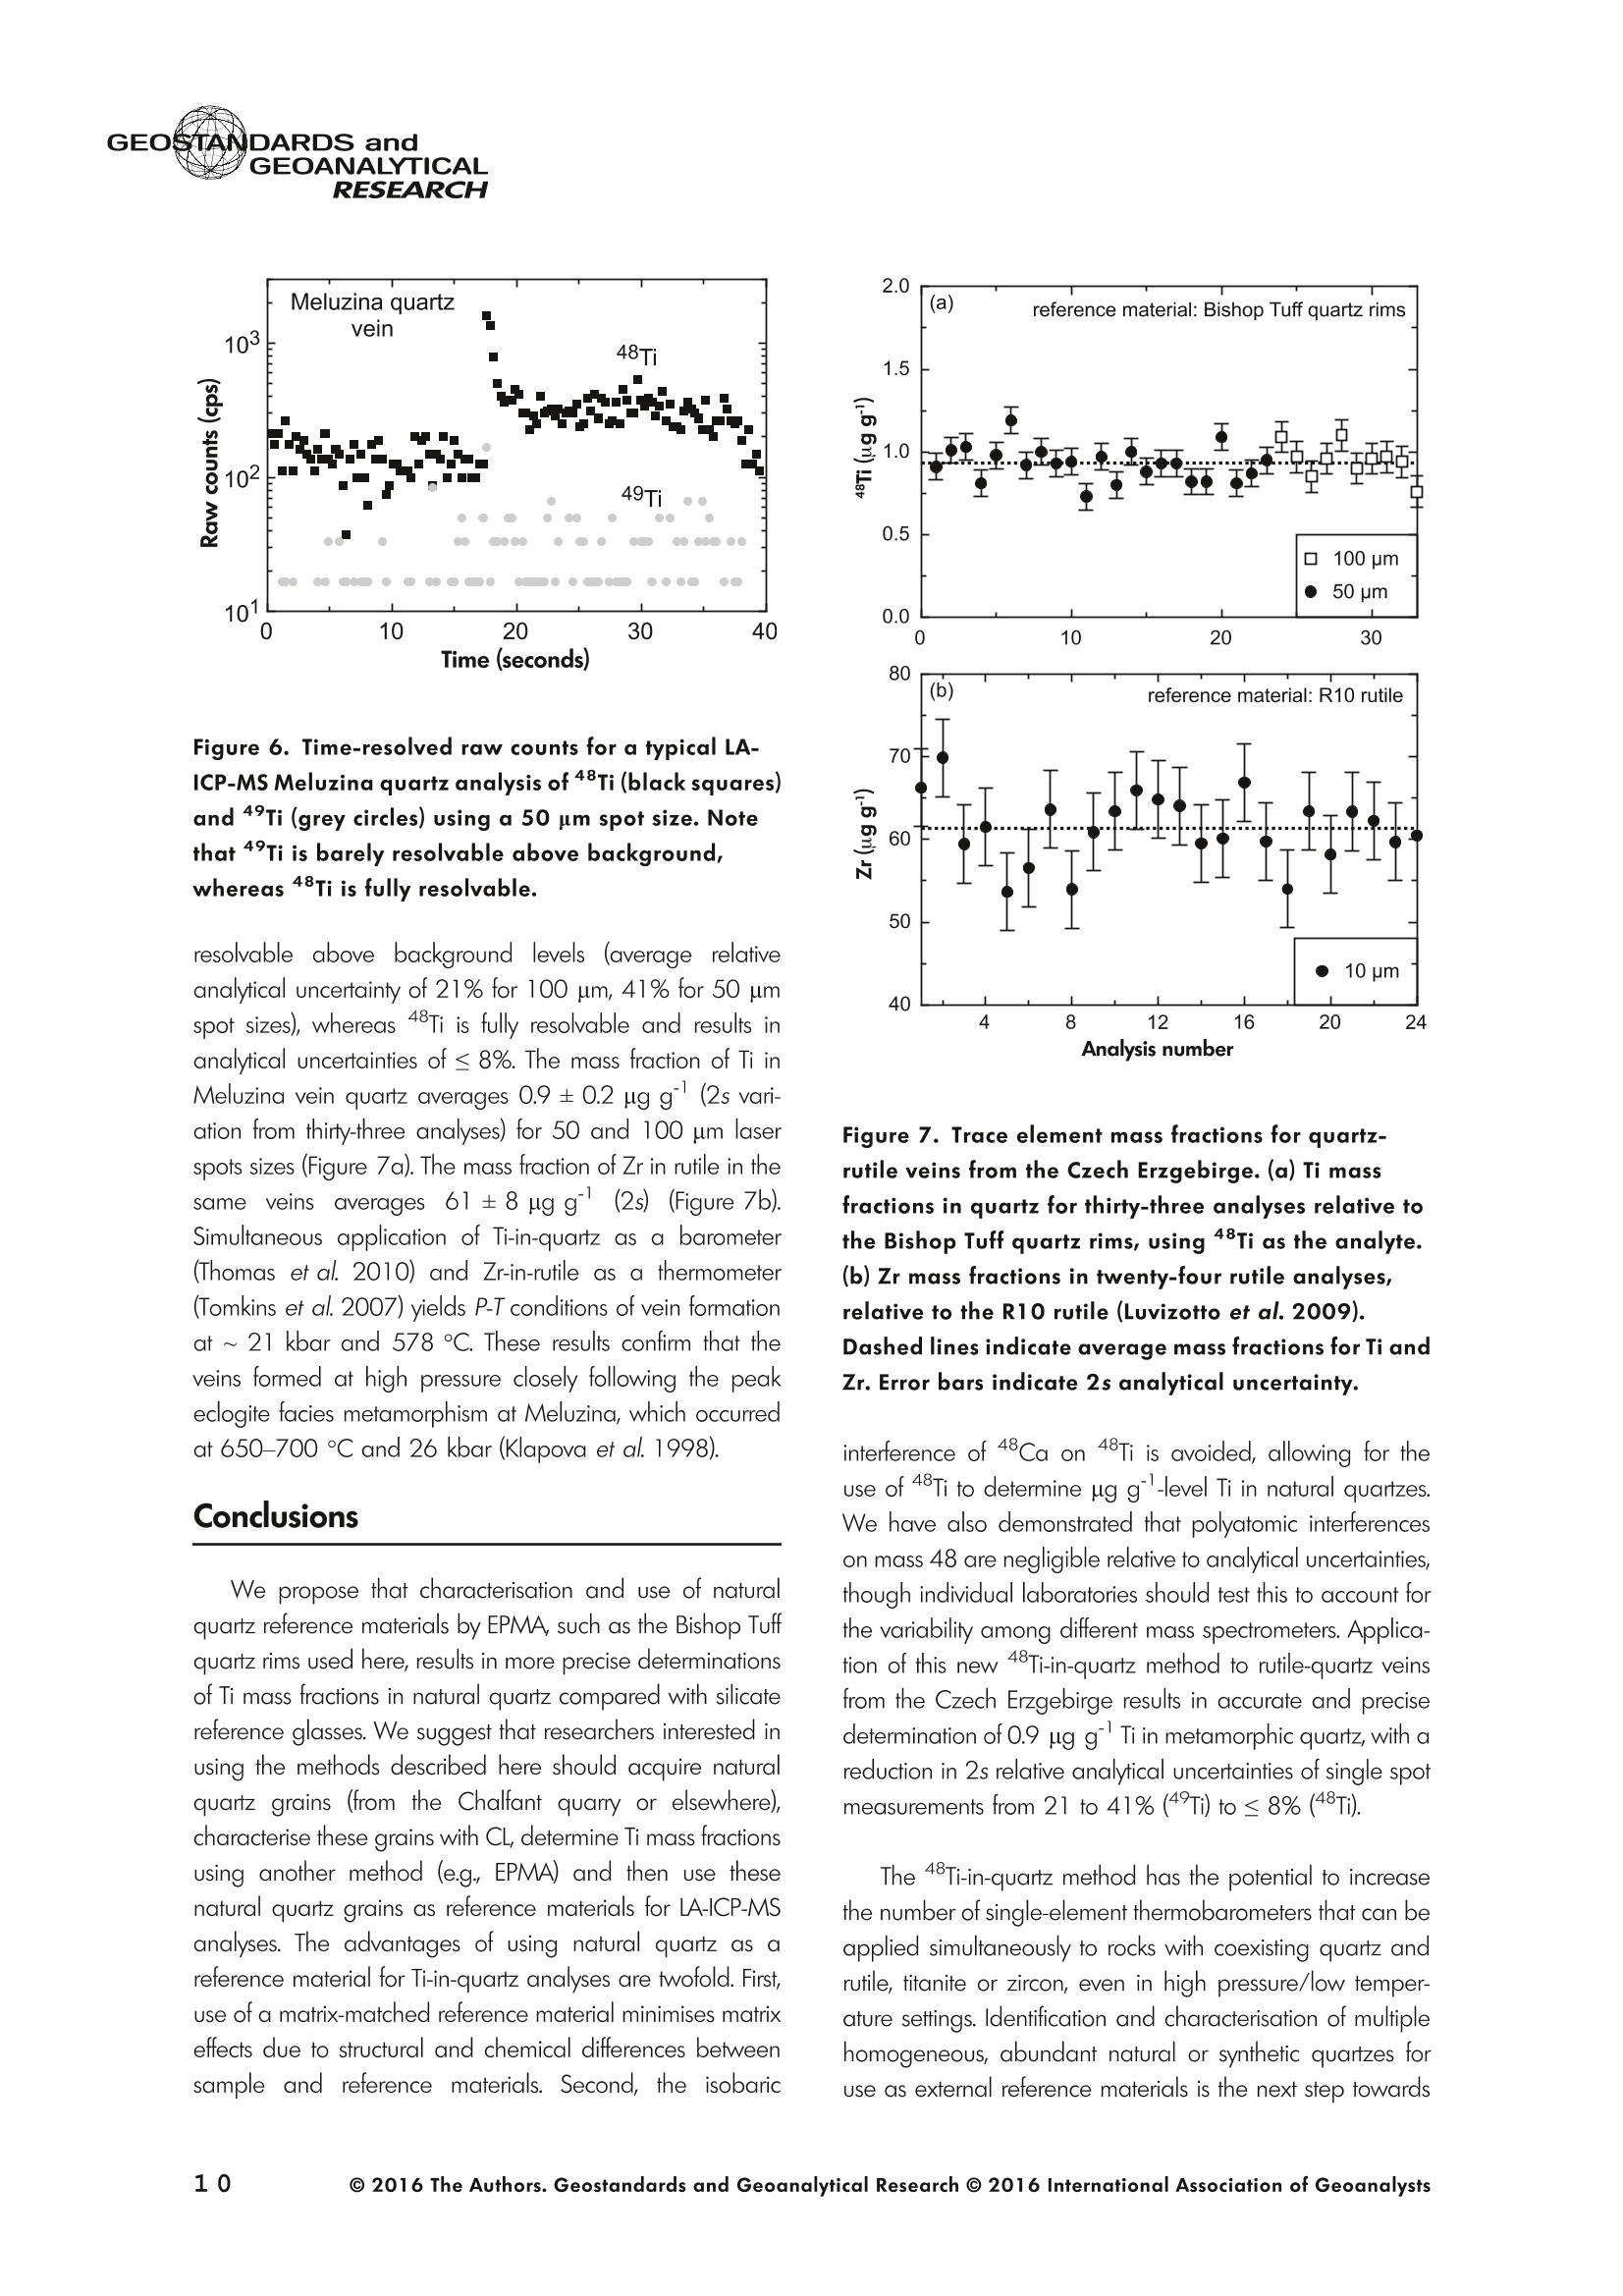
GEOSTANPARaS andALRESEARCH tngeonSandicAlRESEARCH A New LA-ICP-MS Method for Ti in Quartz: Implications andApplication to High Pressure Rutile-Quartz Veins from theCzech Erzgebirge Alicia M. Cruz-Uribe (1, 4)*, Regina Mertz-Kraus (2), Thomas Zack (2, 5), Maureen D. Feineman (1),Glenn Woods (3) and Dorrit E. Jacob (2, 6) (1) Department of Geosciences, The Pennsylvania State University, 306 Deike Building, University Park, PA, 16803, USA (2) Institute for Geowissenschaften, Johannes Gutenberg University, J.-J. Becher Weg 21, Mainz, 55128, Germany (3) Agilent Technologies UK Ltd, Stockport, UK (4) Present address: School of Earth and Climate Sciences, University of Maine, Orono, ME, 04469, USA (5)Present address: Department of Earth Sciences, University of Gothenburg, Box 460, Gothenburg, 40530, Sweden (6) Present address: Department of Earth and Planetary Sciences, Macquarie University, Level 5, E7A Building, Sydney, NSW, 2109, Australia *Corresponding author. e-mail: alicia.cruzuribe@maine.edu Experimental determination of the pressure and temperature controls on Ti solubility in quartz provides a calibration of theTi-in-quartz (TitaniQ) geothermometer applicable to geological conditions up to ~20 kbar. We present a new method fordetermining 48Ti mass fractions in quartz by LA-ICP-MS at the 1 pgg level, relevant to quartz in HP-LT terranes. Wesuggest that natural quartz such as the low-CL rims of the Bishop Tuff quartz (determined by EPMA; 41 ±2 pg gTi,2s)is more suitable than NIST reference glasses as a reference material for low Ti mass fractions because matrix effects arelimited, Ca isobaric interferences are avoided, and polyatomic interferences at mass 48 are insignificant, thus allowing forthe use of 48Ti as a normalising mass. Average titanium mass fraction from thirty-three analyses of low temperature quartzfrom the Czech Erzgebirge is 0.9±0.2 ng pgg( 2sg)C using 48Ti as a normalising mass and Bishop Tuff quartz rims as areference material. The 2s average analytical uncertainty for individual analyses of 48Ti is 8% for 50 um spots and 7% for100 um spots, which offers much greater accuracy than the 21-41% uncertainty (2s) incurred from using 49Ti as ananalyte. Keywords: Ti-in-quartz, trace elements, TitaniQ, LA-ICP-MS, reference materials Received 12 Dec 15 - Accepted 04 Jul 16 Ti-in-quartz thermobarometry is a powerful tool for deci-phering the pressure and temperature conditions at whichquartz grains crystallise in both igneous and metamorphicsystems. Experimental determination of the pressure andtemperature controls on Ti solubility in quartz provides acalibration of the Ti-in-quartz thermobarometer applicable togeological conditions up to ~ 20 kbar (Wark and Watson2006, Thomas et al. 2010, 2015, Huang and Audetat2012). Because Ti mass fractions increase at higher temper-atures and lower pressures, measurements of Ti mass fractionin igneous and high-temperature metamorphic quartz (typi-cally> 10 ug gl) can be obtained using a variety ofmethods, including electron probe microanalysis (EPMA),secondary ion mass spectrometry (SIMS) and laser ablation-inductively coupled plasma-mass spectrometry (LA-ICP-MS) (Warket al.2007,Spear and Wark 2009). In contrast, Ti massfractions in high pressure/low temperature quartz (HP/LT),found in many subduction zone lithologies, are commonly1 ug gor lower. Such low mass fractions are typicallymeasured by SIMS (Thomas et al. 2010, Behr eft al.2011);however, LA-ICP-MS facilities are less expensive, morenumerous and accessible to larger numbers of geoscientists.In this study, we propose a new method for determining Timass fractions in quartz at the 1 ug glevel by LA-ICP-MS. In most cases, trace element mass fractions in silicateminerals determined by SIMS or LA-ICP-MS are standard-ised relative to the SRM 61X series glass reference materials. from the National Institute of Standards and Technology(NIST) or other common reference materials such as the USGS glasses or glasses of the MPI-DING series (Jochumet al. 2005b). In general, the most accurate results areobtained when matrix-matched reference materials areused for LA-ICP-MS analyses (Jackson et al. 1992); theexception to this is the use of femtosecond laser systems(Jochum et al. 2014). Matrix matching minimises theuncertainty introduced by elemental fractionation and massload matrix effects, which may be different between thereference material and sample. Titanium mass fractions are typically measured using theisotope 49Ti (5.5% abundance) because of isobaric andpolyatomic interferences on 48Ti (73.8% abundance). Cal-cium is a major component of many silicate minerals andreference glasses, whereas Ti is more commonly a minor ortrace component, such that the most important interferencepreventing the widespread usage of 48Ti is isobaric 48Ca. Inorder to analyse Ti mass fractions of <10 ug g in quartzusing LA-ICP-MS, it would be ideal to measure 48Ti becausethe relative abundance results in an increase in signalstrength of an order of magnitude over ‘49Ti, therebyimproving analytical uncertainty by a factor of ca. 3. Thefeasibility of analysing 48Ti in natural quartz has beensuggested, but never tested (Audetat et al. 2014). In somecases, 48Ti may be the only isotope above detection limit atlow (~ 1 ug g) Ti mass fractions, especially when smallgrains of quartz necessitate small spot sizes. Fortunately,quartz presents an ideal opportunity to determine48mibecause Ca is not present in quartz (e.g., Gotze and Mockel2012, and references therein), and thus, the isobaricinterference is avoided. In contrast, high mass fractions ofCa in the NIST SRM 610 glass (11.5% m/m CaO) result inup to ~17% of the 48Ti signal coming from 48Cainterference during LA-ICP-MS analysis, which makes itunsuitable for use as a reference material when determining48Ti. At this time, the most important obstacle preventingroutine determination of low-level Ti in quartz by LA-ICP-MSis the lack of a well-characterised, matrix-matched and Ca-free reference material that is readily available to thecommunity. The natural quartz crystal analysed by Audetatet al. (2014) was not available at the time of this study. Themiddle growth zone of the Audetat et al. (2014) quartzcrystal has an average Ti mass fraction of 57 ±8 ug g(2s)and does display some zoning in Ti. Thus, the characterisationof additional reference materials will be of use to thecommunity for the purpose of calibrating with multiplereference materials or use of one material for calibrationand the other(s) as quality control materials (QCM). In this study, we address the lack of multiple matrix-matched reference materials by characterising a suite ofSiO2 glasses and grains of quartz from the Bishop Tuff. We propose that the rims of well-characterised Bishop Tuff quartzare suitable as a reference material for Ti in quartz andapply this material to analyses of quartz in quartz-rutile veinsfrom the Czech Erzgebirge (Krusne hory). By determining 48Tiin Ca-free quartz and using a Ca-free natural quartzreference material, we are able to determine Ti in quartz atthe~1 ug glevel with good precision and accuracy whileavoiding isobaric interferences inherent in using Ca-bearingalass reterence materials. Sample descriptions Titanium-bearing SiO2 glasses were manufactured andprovided by Heraeus Quarzglas GmbH & Co. KG, Hanau,Germany. Glasses were manufactured using flame fusion ofcultured quartz crystals. Three sets of glasses were devel-oped to cover a range of Ti mass fractions (~10,~80, and~680 ngg). For the purposes of this study, analyses werefocused on the two higher mass fraction glasses. Based onthe mass fractions determined by EPMA and LA-ICP-MS, thetwo glasses are henceforth referred to as H80 and H680. The Bishop Tuff (CA, USA) was deposited 760 ky ago duringthe evacuation and subsequent collapse of the Long ValleyCaldera and consists of both fallout and ignimbrite deposits fromthe high-silica rhyolitic eruption (Hildreth and Wilson 2007,Wilson and Hildreth 1997). Quartz grains from the F6 fallout unitof the Bishop Tuff (Hildreth and Wilson 2007) were collected atthe Chalfant Valley Pumice Quany. Quartz separates weresieved, and analyses focused on grains 2-4 mm in size. Warket al.(2007) reported Ti mass fractions of 48.5±5.3 ug ginthe cores and 39.8±0.8 ug g’ in the rims of quartz grainsfrom the F6 sequence. Trace element traverses were performedacross two grains (BT1 and BT2), in addition to individual spots inthe cores of twenty-two other grains. Eclogites from Meluzina in the Czech Erzgebirge (Krǔsnehory) are crosscut by extensive quartz veins with large (2-3 cm) rutile grains and present an ideal opportunity tomeasure low mass fractions of Ti in quartz and test thefeasibility of using the Bishop Tuff as a reference material.The Erzgebirge/Krǔsne hory is part of the Bohemian Massifin the Saxothuringian domain of the Variscan orogen.Estimated peak conditions for eclogite facies metamorphismin the Meluzina section are ~ 26 kbar at 650-700C(Klapova et al. 1998). The eclogites are characterised bystrong foliation and compositional banding consisting ofgaret-, omphacite- and amphibole-rich layers crosscut byextensive veining (quartz ± rutile± amphibole ± zoisite ±omphacite ± garet) at the millimetre to metre scale. Threequartz-rutile veins used in this study (MZ-24,MZ-28, MZ-31)were sampled at the Meluzina locality. Cathodoluminescence and EPMA Samples were prepared as polished grain mounts.Cathodoluminescence images of Bishop Tuff quartz grainswere acquired using a Cameca SX-100 microprobe atRensselaer Polytechnic Institute (RPl) (Figure 1a) and wereused to identily zones of differing Ti mass fraction. Theseimages reveal oscillatory zoning with homogeneous low-CLrims, which were targeted for trace element determination.Cathodoluminescence images of the H680 and H80glasses were acquired at the University of Maine using aTescan Vega II XMU with a panchromatic cathodolumines-cence detector (Figure 1b) and revealhhigh-CL streaksthroughout the glasses. Titanium mass fractions in the Heraeus SiO2 glasseswere determined by EPMA using a JEOL JXA 8900 RL at theUniversity of Mainz. Titanium was counted on one PETspectrometer (300 s peak, 150 s background) with anaccelerating voltage of 15 keV, beam current of 100 nAand a spot size of 10 um. Wollastonite and rutile were usedfor Si and Ti standardisation, respectively. Titanium mass fractions in the Bishop Tuff quartz weredetermined by EPMA using a Cameca SX-100 at RPI. Titaniumwas counted on four LPET spectrometers (400 s peak, 200 sbackground) using an accelerating voltage of 15 keV andbeam current of 200 nA with a spot size of~10 um. Fifty spots(26 um spacing) were analysed along a core to rim traverse ongrain BT2 parallel to the laser traverse done at the University ofMainz. Quartz and rutile were used for Si and Ti standardis-ation, respectively. Each analysis was acquired over~ 14 min. LA-ICP-MS Trace element mass fractions in all samples weredetermined by LA-ICP-MS at the University of Mainz. In addition, Bishop Tuff quartz grain BT2 was analysed at theAgilent Technologies facility in Manchester, UK. Typical laserablation run conditions, detection limits, and analyticaluncertainties are given in Table 1. University of Mainz: Laser ablation ICP-MS analyses ofquartz and SiO2 glasses at the University of Mainz wereconducted using an Agilent 7500ce quadrupole ICP-MScoupled with an ESI NWR 193 nm Excimer laser ablationsystem. Analyses were performed using a laser beamdiameter of 50 um witha beam energy density of~14.4J cm and a repetition rate of 5 Hz. Each analysisconsisted of 15 s of background measurement during laserwarm-up, 20 s of ablation and 15 s of washout (Figure 2).The following isotopes were determined: 27Al,29si, 30si,47Ti,48Ti, 49Ti, 88sr, 90zr,?Zr and 140Ce. Dwell times were10 ms for each isotope except for 4Ti and 49Ti(60 ms) and48Ti (80ms). 2Si was used as the internal standard element,assuming SiO2=100%. For calibration, NIST SRM 610 wasanalysed at the beginning and after every ten unknownsamples. The time-resoived signal was processed using theprogram GLITTER 4.4.1 (www.glitter-gemoc.com, MacquarieUniversity, Sydney,NSW, Australia), applying the preferredvalues for NIST SRM 610 reported in the GeoReMdatabase (http://georem.mpch-mainz.gwdg.de/, Applica-tion Version 18) (Jochum et al.2005a, 2011) as the true’mass fractions to calculate the element mass fractions of thesamples. Glass reference material GSD-1G from the USGSwas also analysed as a QCM. The results of the QCM for Tiagreed within 3.2% with the preferred values of theGeoReM database, and reproducibility was better than 2%. Rutile was analysed using a New Wave UP213 laserablation system coupled to an Agilent 7500ce quadrupoleICP-MS with a beam diameter of 10-15 um,a beam energydensity of 7 J cm’ and a repetition rate of 10 Hz. Rutileablation was performed using the UP213 laser ablationsystem (as opposed to the NWR 193) because these analyseswere part of a broader project investigating small spatial scale Figure 1. (a) Microprobe cathodoluminescence (CL) image of a typical quartz grain from the Bishop Tuff(unit F6). Notethe oscillatory zoning in the core and the low-CL rim.(b) SEM CLimage of H80 glass. Laser pits are 50 pm in diameter. Table 1. Typical laser ablation run conditions, detection limits and analytical uncertainties for natural quartzanalyses Laserwavelength(nm) Spotsize (um) Laser beamenergydensity(J cm-2) Detectionlimit 48Ti(pg g') Detectionlimit 49Ti(ugg) Averagerelative 2suncertainty48Ti (%) Averagerelative 2suncertainty 49Ti (%) University of Mainz Agilent DemoFacility 193193 213213° 50100501005050 14.410.21212 0.050.01 0.120.02 0.460.08 0.020.22 7%7%°8%7%4%2% 7%°6%°41%°21%2% 2% °2s relative uncertainties for Bishop Tuff quartz analyses. 2s relative uncertainties for Meluzina quartz analyses. Figure 2. Time-resolved raw counts from a typical LA-ICP-MS Bishop Tuff quartz analysis for 47Ti, 48Ti and49Ti using a 50 um spot size. Note the order ofmagnitude increase in signal strength of 48Ti comparedwith 49Ti. variability in rutile and better stage precision was possible withthe large format cell on the UP21 3 at the time of analysis (Sept.2012). Each analysis consisted of 15 s of background,10-12 s of dwell time and 20 s of washout. The followingisotopes were determined: 49Ti, 56Fe and 9ozr. Typicaldetection limits (ten times the standard error on the back-ground) for 90zr were 0.08 ug gwith an analyticaluncertainty of 7% (2s). Detection limits for other elementswere 3.5 ug g(4Ti) and 55 ug g(56Fe). Trace elementmass fractions in rutile were determined relative to the R10rutile reference material with the program GLITTER 4.4.1, using4Ti as the internal standard element (Luvizotto et al. 2009). Agilent Technologies facility: Instrumentation at theAgilent Technologies facility in Manchester, UK, used for thisstudy consists of an Agilent 8800 triple quadrupole ICP- QQQ-MS coupled with a New Wave NWR213 Nd:YAGlaser ablation system. Quartz was ablated using a laserbeam diameter of 55 um with a beam energy density of~12 J cm’ and a repetition rate of 10 Hz. Each analysisconsisted of 20 s of background, 50 s of ablation time and20 s of washout. The following isotopes were determined:29Si, 30si, 42ca, 43Ca,44Ca, 47Ti, 48Ti and 49Ti. Traceelement mass fractions were determined relative to glassreference materials from NIST (SRM 610, 612) using thedata reduction software lolite (Paton et al. 2011) and 29Sias the internal standard element. Two standard deviationvalues were determined for each analysis using lolite. The Agilent 8800 ICP-QQQ-MS is equipped with twoquadrupole mass filters with an Octopole Reaction System(ORS) collision/reaction cell between the quadrupoles. Twotraverses were performed on grain BT2. One of thesetraverses was done without using the ORS (NoGas), whilethe other was performed in MS/MS neutral gain mode withammonia gas (NH3) in the reaction cell (MS/MS refers tothe use of the tandem mass spectrometers). Operating theinstrument in MS/MS mode allows for the preselection of csingle mass-to-charge ratio (m/z); in this study, the targetanalyte/interference pair was 48Ti48Ca. The neutral gain(mass-shift) method was used to remove the: 48Ca interfer-ence on 48Ti by adding ammonia gas to the reaction cell.Titanium is highly reactive to ammonia, whereas Ca is mostlynonreactive, which means that the reaction products do notcarry the 48Ca isobar over with the main 48Ti isotope duringthe mass shift. In this study, all of the Ti isotopes were massshifted +83 mass units ([TiNH(NH3)l), therefore represent-ing48Ti at mass 131 and effectively separating all of the Tiisotopes from the unshifted Ca isotopes. Because in MS/MSmode only one m/z is delivered to the reaction cell at a time,the mass spectrum is kept relatively simple compared withthe complexities that could arise if all isotopes were allowed into the reaction cell simultaneously, as is the case with astandard 'single’ quadrupole ICP-MS run in reaction cellmode. Results Titanium mass fractions determined for the Heraeusglasses and Bishop Tuff quartz can be found in Table 2(EPMA analyses), Table 3 (LA-ICP-MS analyses) and Table 4(LA-ICP-QQQ-MS analyses). Box-and-whiskerrplots(Figure 3) for the H80 and H680 glasses, Bishop Tuff quartzcores and Bishop Tuff quartz rims show the average massfraction (middle bar), 2s variation (box) and range (whiskers)for EPMA and LA-ICP-MS analyses of the glasses and naturalquartz grains using NIST SRM 610 as a reterence material(for LA-ICP-MS analyses). Where average mass fractions aregiven, 2s uncertainties refer to the variation in the averagedanalyses. Analytical uncertainties can be found in Table 1. Heraeus SiO2 glasses Mass fractions of Ti in the H680 glass based on EPMAresults (Table 2) range from 330 to 1043 ug gTi(n=90),with an average of 682 ±263 ug g(2s) Ti. Mass fractionsof Ti in the H680 glass based on LA-ICP-MS data (Table 3)range from 531 to 936 ug gTi(n=42), with an average Timass fraction of 672 ±164 ug g(2s) using 49Ti as theanalyte and NIST SRM 610 as a reterence material. Mass fractions of Ti in the H80 glass based on EPMAdata (Table 2) range from 50 to 180 ug g Ti (n=30),with an average of 90 ± 60 ug g(2s) Ti. Mass fractions ofTi in the H80 glass based on LA-ICP-MS data (Table 3)range from 68 to 108 ug gTi (n=31), with an averageTi mass fraction of 82±19 ug g (2s) using 49Ti as theanalyte and NIST SRM 610 as a reterence material. Bishop Tuff quartz Electron probe analyses of the Bishop Tuff quartz cores(Table 2) ranged from 41 to 57 ug gTi (n=41), with anaverage of 49 ±8 ug g(2s) Ti. Laser ablation ICP-MSanalyses of the Bishop Tuff quartz cores (Table 3) range from44 to 58 ug gTi (n=39), with an average Ti massfraction of 51 ±6 ug g(2s) using 4Ti as the analyte andNIST SRM 610 as a reference material. Electron probeanalyses of the Bishop Tuff quartz rims (Table 2) range from399to 43 ug g TTii (n=10), with(an average of41 ± 2 ug g(2s) Ti. Laser ablation ICP-MS analyses ofthe Bishop Tuff quartz rims (Table 3) range from 39 to45 uggTi (n=12), with an average Ti mass fraction of41 ±4 ug g(2s) using 4°Ti as the analyte anc5NIST SRM Table 2. Mass fraction results for Ti (ugg) determined byEPMA in H680 glass, H80 glass and Bishop Tuffqu artz 56 47435056494652494753484948454745444149434852575257534950514951535554 47 54 40 100 43 43 H680° 683 H680° 330 H680° H80° BTquartzcoresb quartzrims° 41 6236417076476476837076896115524804146595525885646235047016006775585046715946356115221043701923707641713588653755683 456 989 659528552486641695983701857995815767773665695659629617750750700770830820740660570580690710710520610760800750880830 750 620 6206501020920760710730600 Average 2sMinimumMaximum 6822633301043 906050180 4984157 " Analyses performed at the University of Mainz. Analyses performed at Rensselaer Polytechnic Institute. 610 as a reterence material. Traverses across grains BT1and BT2 are shown in Figures 4 and 5. Quartz-rutile veins from Meluzina The average Ti mass fraction for thirty-three quartzanalyses (50 and 100 um spots) was 0.9 ±0.2 ug g(2s) Table 3. Mass fractions of Ti (ug g) from LA-ICP-MS"analyses (based on 49Ti) in H680 glass, H80 glassand Bishop Tuff quartz H680 H680 H80 BTquartzcores BT quartzcores BT quartz rims 733 726 531717724702700721661687672617632648665587757714534638588535538552609567695741 722 659 660 621700732744739781936735665743775 72747986861081058075698498827973696888868279777884867671918880 81 45 52495053575850525044515348515251545552504751515152555153 50 50 51 514746494549 47 Average2sMinimumMaximum 676164531936 821968108 5164458 41439 45 °Analyses performed at the University of Mainz. using 48Ti as the analyte and the Bishop Tuff quartz rims asthe reference material, with an average analytical uncer-tainty (based on individual spot analyses; Table 1) of 8% for50 um spots and 7% for 100 um spots. The average Zrmass fraction for twenty-four vein rutile analyses (10-15 umspots) was 61±8 ug g(2s) relative to the R10 rutilereference material (Luvizotto et al.2009). Average analyticaluncertainty for individual rutile analyses was 3.5%. Discussion Evaluation of potential SiO2 reference materials The H80 and H680 SiO2 glasses, together with quartzgrains from the Bishop Tuff, were analysed with the intent of characterising potential reference materials for laser ablationdetermination of Ti in quartz. The box-and-whisker plots inFigure 3 clearly show that Ti is heterogeneous in H680(330-1043 ug g Ti), H80 (50-180 ug gTi) andBishop Tuff quartz cores (41-57 ng gTi), making theseunsuitable for use as reterence materials. We interpret thehigh-CL streaks (Figure 1b) seen in the H680 and H80glasses to be zones of high Ti mass fraction. The low-CL rimsof the Bishop Tuff quartz, on the other hand, are fairlyhomogeneous with a range of 39-43 ug gTi and anaverage of 41 ±2 ug g(2s) Ti based on EPMA analysis(Figures 3 and 4). We consider the electron probe micro-analyses to be more reliable because the matrix correctionsfor trace elements in quartz have been better studied andcharacterised than LA-ICP-MS analyses (Muller et al.2003,Donovan et al. 2011). Regarding homogeneity, which iscritical in selecting an appropriate reterence material, theBishop Tuff quartz rims are the most suitable potentialreference material analysed in this study. The F6 fallout unitof the Bishop Tuff is also easily accessible and can serve as asource for quartz reference materials for any geoscientistswho wish to characterise grains of quartz. Determination of Ti in quartz using 48Ti as ananalyte As was discussed in the introduction, the most significantbarrier to determining Ti in metamorphic quartz is the lowmass fraction of Ti (on the order of 1 ug g) in highpressure/low temperature samples. Using the major isotopeof Ti (48Ti, which has a natural abundance of 73.8%) tomeasure Ti mass fractions in low Ti quartz would lessen thisproblem; however, there are isobaric and polyatomicinterferences from 48Ca,14N17N2*,14N160180*, 12c*and 36Ar2ct. Most polyatomic interferences can bemitigated, but the isobaric interference from 48Ca presentsmore of a challenge. One way to deal with isobaric interferences is to avoidthem altogether, either by choosing to determine isotopeswithout significant interferences (e.g., 4Ti or 4Ti) or bypreselecting for specific interferences and eliminating themusing a collision/reaction cell (ie., the ORS collision/reaction cell in the Agilent 8800 triple quadrupole ICP-MS). In order to use 48Ti as the analyte with glass referencematerials that contain Ca and therefore have an isobaricinterference from 48Ca, it is possible to use a collision/reaction cell to mass-shift 48Ti such that the isobaricinterference is avoided entirely. Figure 5 shows Ti mass fraction in two parallel traversesacross grain BT1 performed using the Agilent 8800 ICP- 0 oc 3's ZoQs ZoQ Z工Q ZT Z工Q Z工Q 9 工 5. ZoQ w 48 ww Zo OO O9 O .一 Ow 44 55 94899 O OO Zo3iQaO Figure 3. Box-and-whisker plots showing average mass fraction (middle bar), 2s variation (box) and range(whiskers) for EPMA and LA-ICP-MS analyses of H680 and H80 SiO2 glasses, and Bishop Tuff (BT) quartz cores andrims. LA-ICP-MS analyses referenced to NIST SRM 610. QQQ-MS with and without reaction cell gas for 48Ti and49Ti. The mass fraction of Ti relative to NIST SRM 610 for asingle spot without reaction cell gas was 6.2±0.1 ug g(2s) using 48Ti and 48 ±1 ug g(2s) using 49Ti (Figure 5a,b). This lower mass fraction of 48Ti compared with 4?Ti showsthat there are significant problems resulting from 48ca on48Ti in the calibration material, here the NIST glasses. Themass fraction of Ti relative to NIST SRM 610 of an adjacentspot with the reaction cell gas was 47 ±2 ug g(2s) using48Ti and 47 ±1 ugg(2s) using 49Ti (Figure 5c, d), whichare statistically identical. This demonstrates that using theORS’collision/reaction cell to avoid the isobaric interferencein Ca-rich reference materials at mass 48 is highly effective. The agreement of Ti determinations using 48Ti and 49T;with reaction cell gas also suggests that polyatomic interfer-ences onn448Ti are insignificant relative to the analyticaluncertainty. However, there is a~25% relative difference inusing NIST SRM 610 and 612 to determine Ti mass fractions(Figure 5a, c compared with Figure 5b, d), which may bethe result of matrix effects due to the mismatch betweenquartz and SRM 61X glasses, and thus, this method likely should not be applied to Ti in quartz analyses. The LA-ICP-QQQ-MS method will be useful for determining 48Ti in otherminerals with low Ti mass fractions and large interferencesfrom 48Ca (i.e., plagioclase) where sample and referencematerial have similar Ca contents. Another method for avoiding isobaric interference of48Ca on 48Ti is to use a reference material that lacks Ca. Wepropose that characterising natural quartz grains, such asthose from the Bishop Tuff, is superior to using the mostwidely available glass reference materials when determin-ing low-level Ti mass fractions (< 10 ug g) in naturalmetamorphic quartz. Given the offset in Ti mass fraction thatresults from comparing different glass reference materials(Figure 5) and the heterogeneity in the Heraeus SiO2glasses and Bishop Tuff quartz cores, we suggest that theBishop Tuff quartz rims are suitable as a reference materialfor Ti in quartz. As the low Ti rims of the Bishop Tuff quartzreported here are only~ 100 um, their use as a widespreadreference material may have limited applicability dependingon the needs of the user. We therefore recommend thatinterested parties acquire natural quartz crystals (from the Figure 4. Titanium mass fraction across grain BT1determined by (a) LA-ICP-MS at the University of Mainzand(b) EPMA at Rensselaer Polytechnic Institute. Notethe low Ti rim and oscillatory zoning in the core,consistent with CL imaging. Bishop Tuff or elsewhere) and characterise them accordingly,using CL and EPMA or SIMS, in order to use them as in-house reference materials for LA-ICP-MS. Application to quartz-rutile veins from Meluzina In order to avoid isobaric interference of 48Ca on 48Ti,we use Bishop Tuff quartz rims, as characterised by EPMA atthe Rensselaer Polytechnic Institute, as a reterence material todetermine Ti mass fractions in metamorphic quartz sampleswith low Ti using 48Ti as the analyte for LA-ICP-MS analysis.This method allows for an increase in raw counts of an orderof magnitude because of the abundance of 48Ti (Figure 6),thereby increasing analytical precision by improving count-ing statistics by a factor of ca. 3 and thus reducing analyticaluncertainties. Titanium mass fractions in quartz from veins consisting ofquartz + rutile from the Meluzina locality of the Erzgebirge(Kruine hory) subduction complex in the Czech Republicwere determined relative to the Bishop Tuff quartz rims usingthe method described above. Figure 7 shows the time-resolved counts for a typical determination of 48Ti and 49Ti irthe Meluzina quartz veins. In these analyses, 49Ti is barely Figure 5. LA-ICP-MS traverse across Bishop Tuff quartz grain BT2 by LA-QQQ-ICP-MS.(a) Traverse with no collisioncell gas using reference material NIST SRM 612; (b) No collision cell gas, reference material NIST SRM 610; (c) NH3collision cell gas, NIST SRM 612; (d) NH3 collision cell gas, NIST SRM 610. Open symbols show 48Ti, closed symbolsshow 49Ti. Grey indicates use of NIST SRM 612 as a reference material in the left panels (a, c). Black indicates use ofNIST SRM 610 as a reference material in the right side panels (b, d). Figure 6. Time-resolved raw counts for a typical LA-ICP-MS Meluzina quartz analysis of 48Ti (black squares)and 49Ti (grey circles) using a 50 pm spot size. Notethat 49Ti is barely resolvable above background,whereas 48Ti is fully resolvable. resolvable above background levels (average relativeanalytical uncertainty of 21% for 100 um, 41% for 50 umspot sizes), whereas 48Ti is fully resolvable and results inanalytical uncertainties of ≤ 8%. The mass fraction of Ti inMeluzina vein quartz averages 0.9±0.2 ug g(2s vari-ation from thirty-three analyses) for 50 and 100 um laserspots sizes (Figure 7a). The mass fraction of Zr in rutile in thesame veins averages 61±8 ug g (2s) ((Figure 7b).Simultaneous application of Ti-in-quartz as a barometer(Thomas et al. 2010) and Zr-in-rutile as a thermometer(Tomkins et al. 2007) yields P-T conditions of vein formationat ~21 kbar and 578C. These results confirm that theveins formed at high pressure closely following the peakleclogite facies metamorphism at Meluzina, which occurredat 650-700 C and 26 kbar (Klapova et al. 1998). Conclusions We propose that characterisation and use of naturalquartz reference materials by EPMA, such as the Bishop Tufquartz rims used here, results in more precise determinationsof Ti mass fractions in natural quartz compared with silicatereference glasses. We suggest that researchers interested inusing the methods described here should acquire naturalquartz grains (from the Chalfant quarry or elsewhere),characterise these grains with CL, determine Ti mass fractionsusing another method (e.g., EPMA) and then use thesenatural quartz grains as reference materials for LA-ICP-MSanalyses. The advantages of using natural quartz as areterence material for Ti-in-quartz analyses are twofold. First,use of a matrix-matched reference material minimises matrixeffects due to structural and chemical differences betweensample and reference materials. Second, the isobaric 2.0 Figure 7. Trace element mass fractions for quartz-rutile veins from the Czech Erzgebirge. (a) Ti massfractions in quartz for thirty-three analyses relative tothe Bishop Tuff quartz rims, using 48Ti as the analyte.(b) Zr mass fractions in twenty-four rutile analyses,relative to the R10 rutile (Luvizotto et al. 2009).Dashed lines indicate average mass fractions for Ti and Zr. Error bars indicate 2s analytical uncertainty. interference of 48Ca on 48Ti is avoided, allowing for theuse of 48Ti to determine ug g-level Ti in natural quartzes.We have also demonstrated that polyatomic interferenceson mass 48 are negligible relative to analytical uncertainties,though individual laboratories should test this to account forthe variability among different mass spectrometers. Applica-tion of this new 48Ti-in-quartz method to rutile-quartz veinsfrom the Czech Erzgebirge results in accurate and precisedetermination of 0.9 ug gTi in metamorphic quartz, with creduction in 2s relative analytical uncertainties of single spotmeasurements from 21 to 41%(49Ti) to≤ 8%(48Ti). The 48Ti-in-quartz method has the potential to increasethe number of single-element thermobarometers that can beapplied simultaneously to rocks with coexisting quartz andrutile, titanite or zircon, even in high pressure/low temper-ature settings. Identification and characterisation of multiplehomogeneous, abundant natural or synthetic quartzes foruse as external reference materials is the next step towards widespread use of 48Ti-in-quartz analyses by LA-ICP-MSthroughout the geological community. Acknowledgements The authors thank N. Groschopf for EPMA analysis of theHeraeus glasses at the University of Mainz and D. Ruscitto forhelp with EPMA and LA-ICP-MS analyses of the Bishop Tuffquartz at RPI. The authors thank Heraeus Quarzglas GmbH& Co. for providing SiO2 glasses. Many thanks are due to J.Thomas and an anonymous reviewer for their helpful andconstructive suggestions, which improved the manuscriptgreatly. This research was supported by National ScienceFoundation grant OISE-1036477 to M.F. and fellowshipsfrom the Ford and Sloan Foundations to A.C. References ( Audetat A., Garbe-Schonberg D., Kro n z A., Pet t ke T., Rusk B., Donovan J.J. and Lowers H.A. (2014) Characterisation o f a n a tural quartz crystal a s a reference m aterial f o r m i croanalytical de t ermination of T i , A l, Li, F e, Mn, G a and G e . Geostandards and Ge o analytical Research, 39, 171-184. ) Behr W.M., Thomas J.B. and Hervig R.L. (2011)Calibrating Ti concentrations in quartz for SIMS determi-nations using NIST silicate glasses and application to theTitaniQ geothermobarometer. American Mineralogist, 96,1100-1106. ( Donovan J.J., Lowers H.A. and Rusk B.G. (2011) I mproved electron probe microanalysis of trace elements i n quartz. American Mineralogist , 96, 274-282. ) ( Gotze J. and M ockel R. ( editors) (2012) Q uartz: D eposits, m ineralogy a n d analytics. Springer Geology ( B erlin, Heidelberg), 360pp. ) ( Hildreth W. and Wilson C.J.N. ( 2007) C ompositional zoning of the Bishop Tuff. Jo u rnal of Petrology,48, 951-999. ) Huang R. and Audetat A. (2012) ( T he titanium-in-quartz (TitaniQ) thermobarometer: A cr i tical examination and re-calibration. Geochimica et Cos-mochimica Acta, 84, 75-89. ) ( Jackson S.E., L ongerich H.P., Dunning G.R. and Fryer B.J. (1992) ) ( T he application o f laser-ablation m i croprobe-inductively coupled plasma-mass spectrometry (LAM-ICP-MS) to in situ trace-element determinations i n mineral s . The Canadian Mineralogist , 30 , 1049-1064. ) Jochum K.P., Nohl U., Herwig K., Lammel E., Stoll B. and H2005Henofmann A.W. (2005a) GeoReM: A new geochemical database for reference materials and isotopic standards. Geostandards and Geoanalytical Research, 29, 333-338. Jochum K.P., Pfander J., Woodhead J.D., Willbold M.,Stoll B., Herwig K., Amini M., Abouchami W. andHofmann A.W. (2005b)MPI-DING glasses: New geological reference materials forin situ Pb isotope analysis. Geochemistry GeophysicsGeosystems, 6, Q10008. Jochum K.P., Weis U., Stoll B., Kuzmin D., Yang Q.,Raczek I.,Jacob D.E., Stracke A., Birbaum K., Frick D.A.,Gunther D. and Enzweiler J.(2011)Determination of reference values for NIST SRM 610-617glasses following ISO guidelines. Geostandards andGeoanalytical Research,35,397-429. Jochum K.P., Stoll B., Weis U., Jacob D.E., Mertz-Kraus R. ( and Andreae M.O. (2014) hod Non-matrix-matched ca l ibration f o r the multi-elementanalysis of geological and environmental samples using 200 nm femtosecond LA-ICP-MS: A c omparison w ith nanosecond lasers. Geostandards and Geoanalytical Research, 38,265-292. ) ( Klapova H., Konopasek J. a nd Schulmann K. (1998) E clogites from the Czech p a rt of the Erzgebirge: Multi-stage m etamorphic and structural evolution. Journal of th e Geological Society London, 155, 567-583. ) ( Luvizotto G.L., Z ack T., Meyer H.P., Ludwig T., Trie b old S., Kronz A., Munker C., S tockli D.F., Prowatke S . andKlemme S. (2009) Rutile crystals a s potential trace element and isotope m ineral s tandards f o r micr o analysis. C hemical G e ology, 261, 346- 3 69. ) ( Muller A., Wiedenbeck M., van d en Kerkhof A.M., KronzA. and Simon K . (2003) T race elements in quartz -A combined electron micro- p robe, secondary io n ma s s spectrometry, las e r-ablation ICP-MS, and cathodoluminescence study. European Jour- nal of Mineralogy, 15 , 747-763. ) Paton C., Hellstrom J., Paul B., Woodhead J. and Hergt J. (2011) lolite: Freeware for the visualisation and processing of mass spectrometric data. Journal of Analytical Atomic Spec- trometry, 26,2508. Spear F.S. and Wark D.A. (2009) Cathodoluminescence imaging and titanium thermometry in metamorphic quartz. Journal of Metamorphic Geology, 27,187-205. Thomas J., Watson E.B. and Spear F. (2010)TitaniQ under pressure: The efect of pressure andtemperature on the solubility of Ti in quartz. Contributions toMineralogy and Petrology, 160,743-759. Thomas J.B., Watson E.B., Spear F.S. and Wark D.A. ( (2015) T itaniQ r ecrystallized: Experimental confirmation of t he o riginal Ti-in-quartz calibrations. Contribution s t o Mineral- ogy and Petrology, 169,27. ) Tomkins H., Powell R. and Ellis D.J. (2007)The pressure dependence of the zirconium-in-rutile ther-mometer. Journal of Metamorphic Geology,25, 703-713. Wark D.A. and Watson E.B. (2006) TitaniQ: A titanium-in-quartz geothermometer. Contribu-tions to Mineralogy and Petrology, 152, 743-754. Wark D.A., Hildreth W., Spear F.S., Cherniak D.J. andWatson E.B. (2007) Pre-eruption recharge of the Bishop magma system.Geology, 35, 235-238. Wilson C.J.N. and Hildreth W.(1997) The Bishop Tuf: New insights from eruptive stratigraphy. The Journal of Geology, 105,407-440. doi: ggr. The Authors. Geostandards and Geoanalytical Research @ International Association of Geoanalysts 本文提出了一种测定石英中48Ti质量分数的新方法,即在1lg/g水平上用LA-ICP-MS测定石英中48Ti的质量分数。我们建议天然石英,如Bishop Tuff凝灰岩石英(由EPMA测定;41±2 lg/gTi级,2 s)比NIST参考更适合作为低钛的质量分数,因为参考材料基体效应有限,Ca元素干扰得以避免,质量数为48的干扰元素的量可以忽略不计,从而允许使用归一化的48Ti质量。钛的平均质量分数是0.9±0.2 lg/g(2 s),这是从捷克Erzgebirge的33个低温石英通过48钛作为归一化质量和Bishop Tuff凝灰岩石英作为参考材料而得到的。对于50 lm个单点的48Ti的2s分析其不确定度为8%,当测量100lm个单点时其不确定度为7%,比使用49Ti作为分析物时产生的21-41%的不确定度(2s)要高得多。
确定
还剩10页未读,是否继续阅读?

产品配置单
上海凯来仪器有限公司为您提供《高压石英脉中石英中钛检测方案(激光剥蚀进样)》,该方案主要用于珠宝/玉石中石英中钛检测,参考标准--,《高压石英脉中石英中钛检测方案(激光剥蚀进样)》用到的仪器有ESL213 灵活的激光剥蚀系统
推荐专场
相关方案
更多
该厂商其他方案
更多