


采用4千赫兹重复频率的Nd:YAG激光器的紫外355nm输出,对气体燃料燃烧火焰的外部几何形态,形貌随时间的变化及其和燃烧不稳定性的关系进行了测量,记录和分析。得到了许多重要的规律。
方案详情

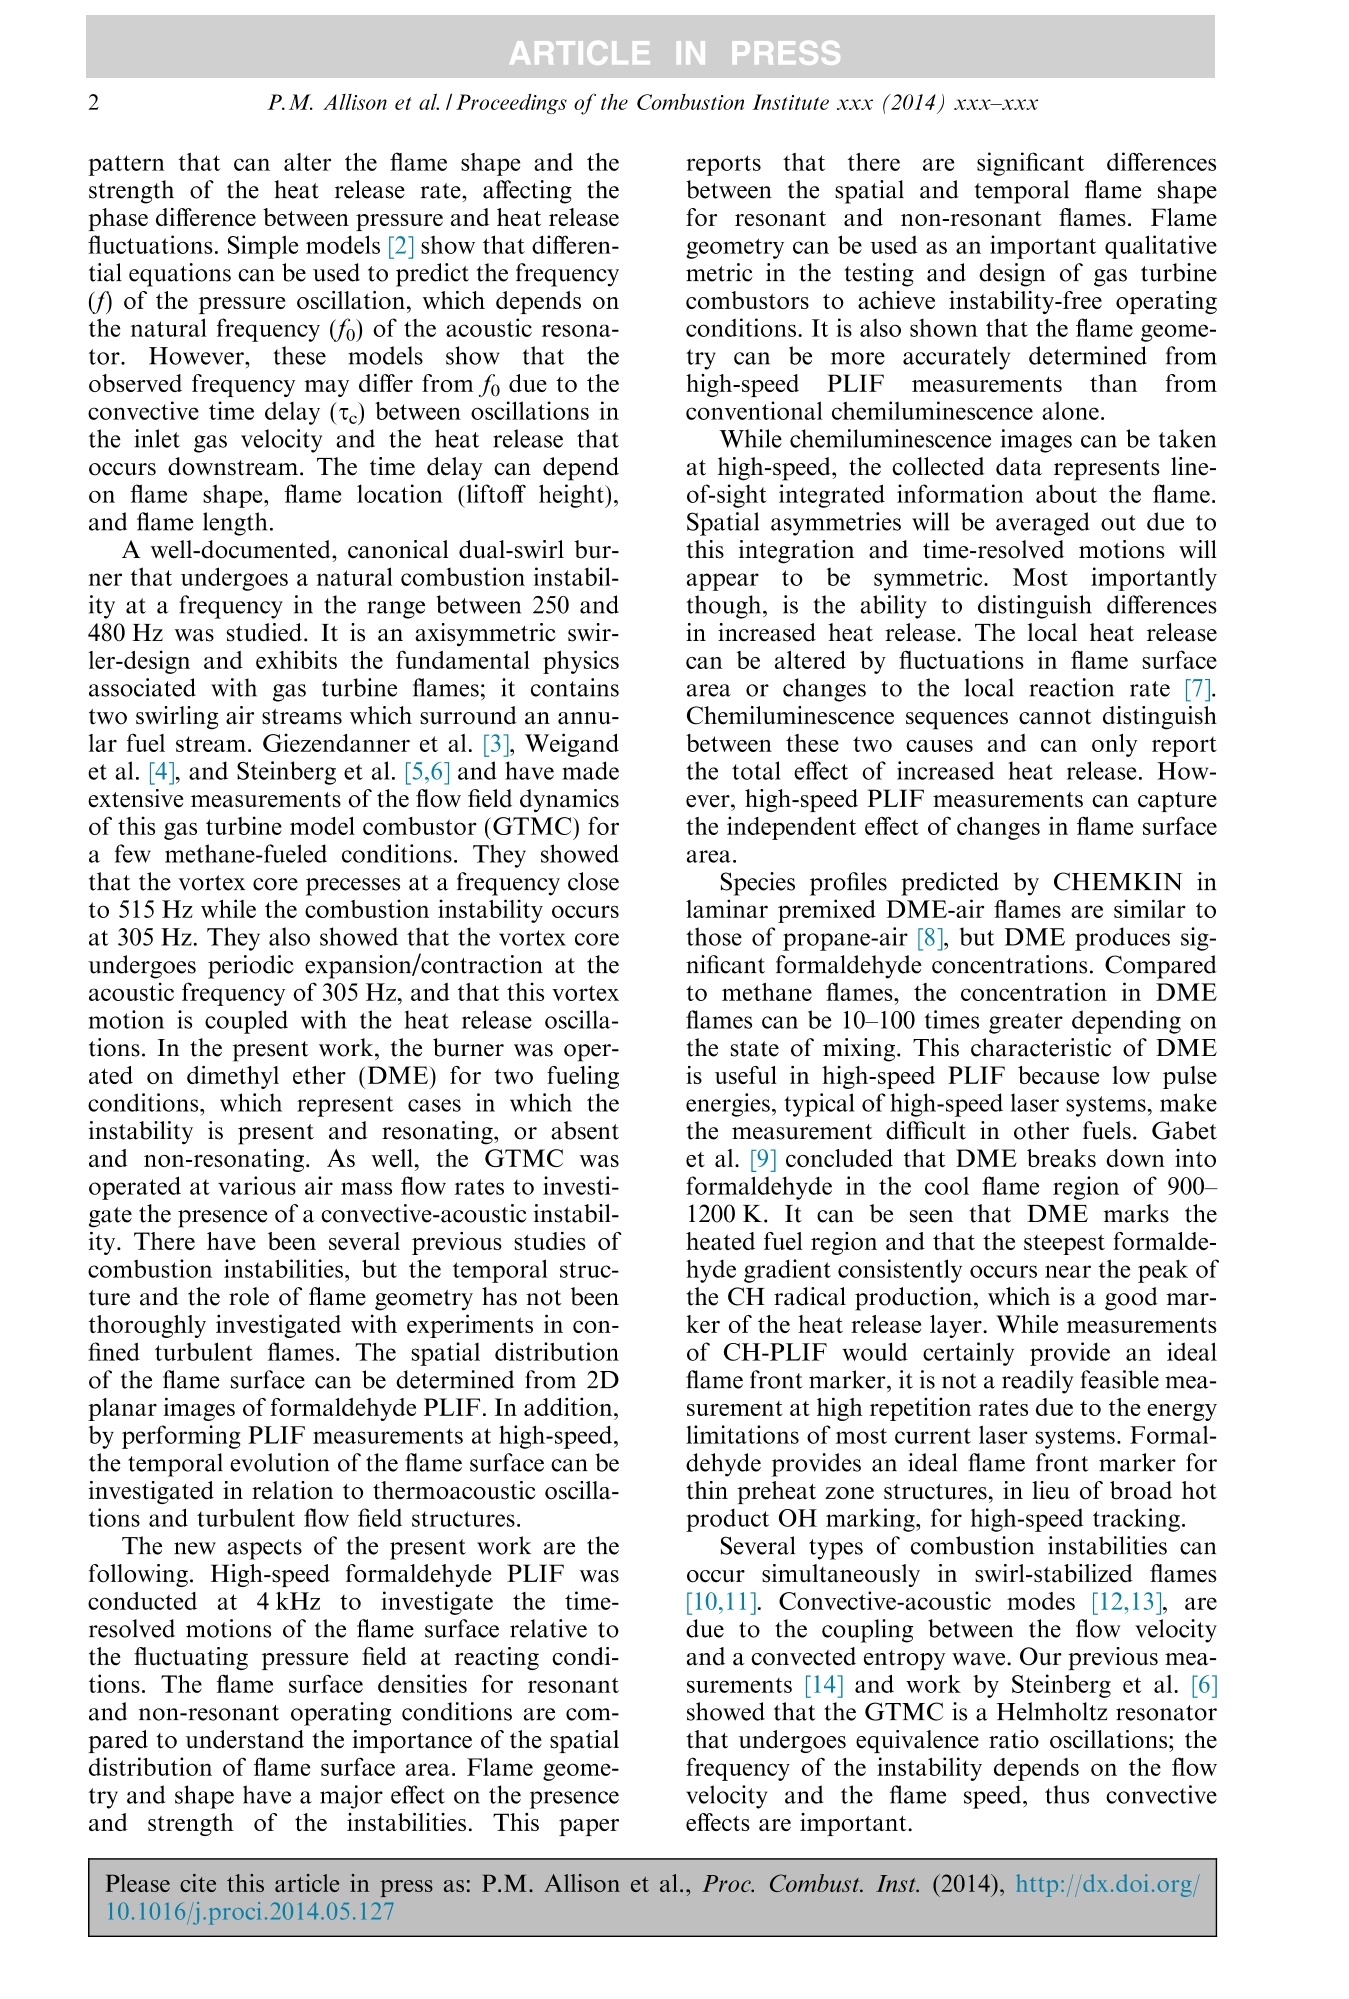
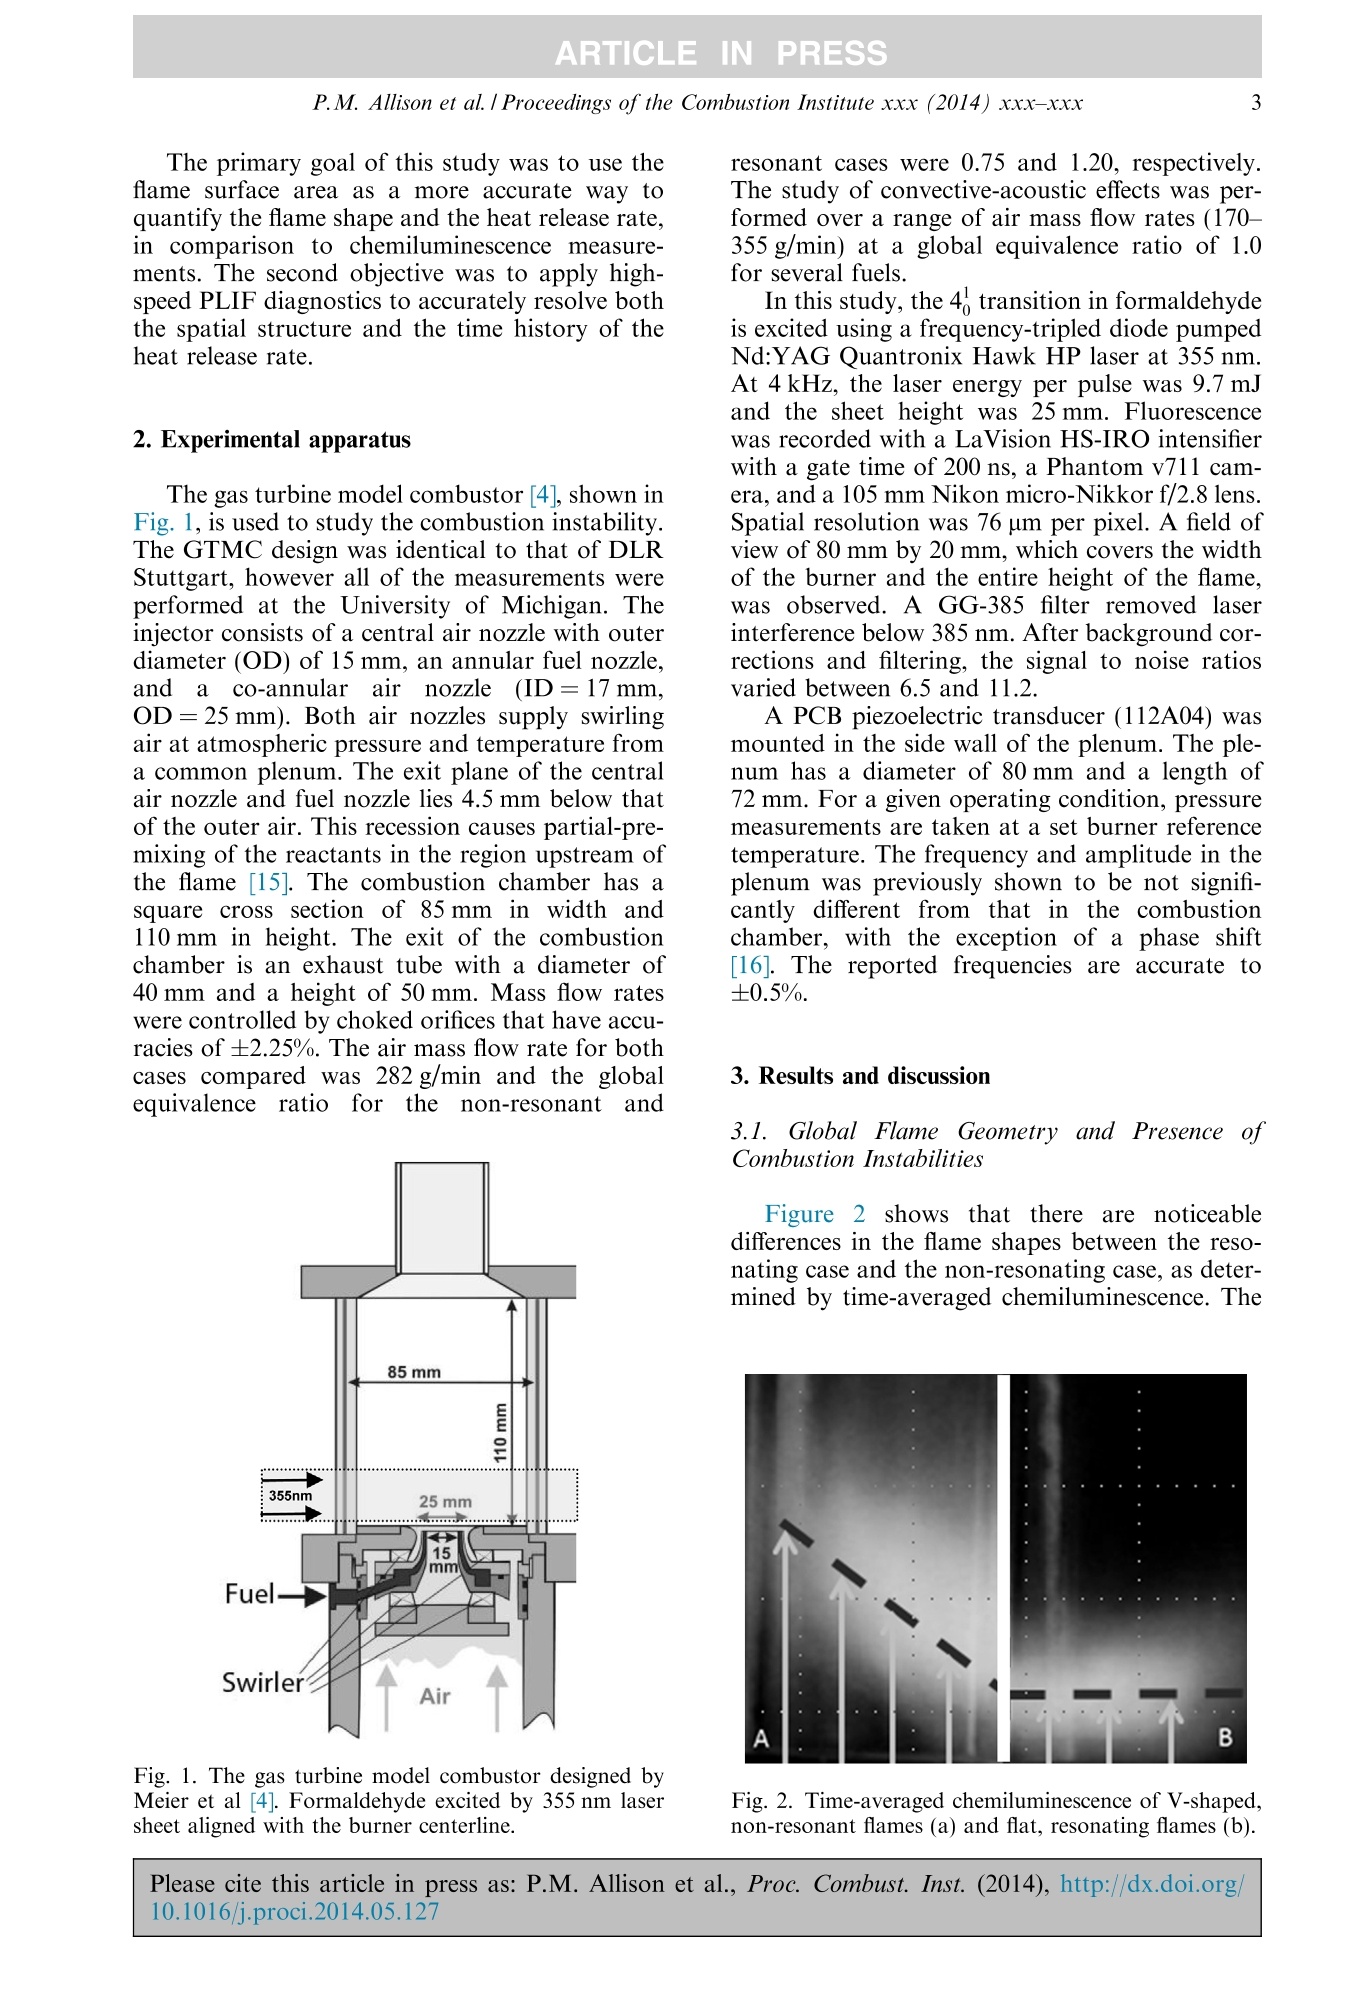
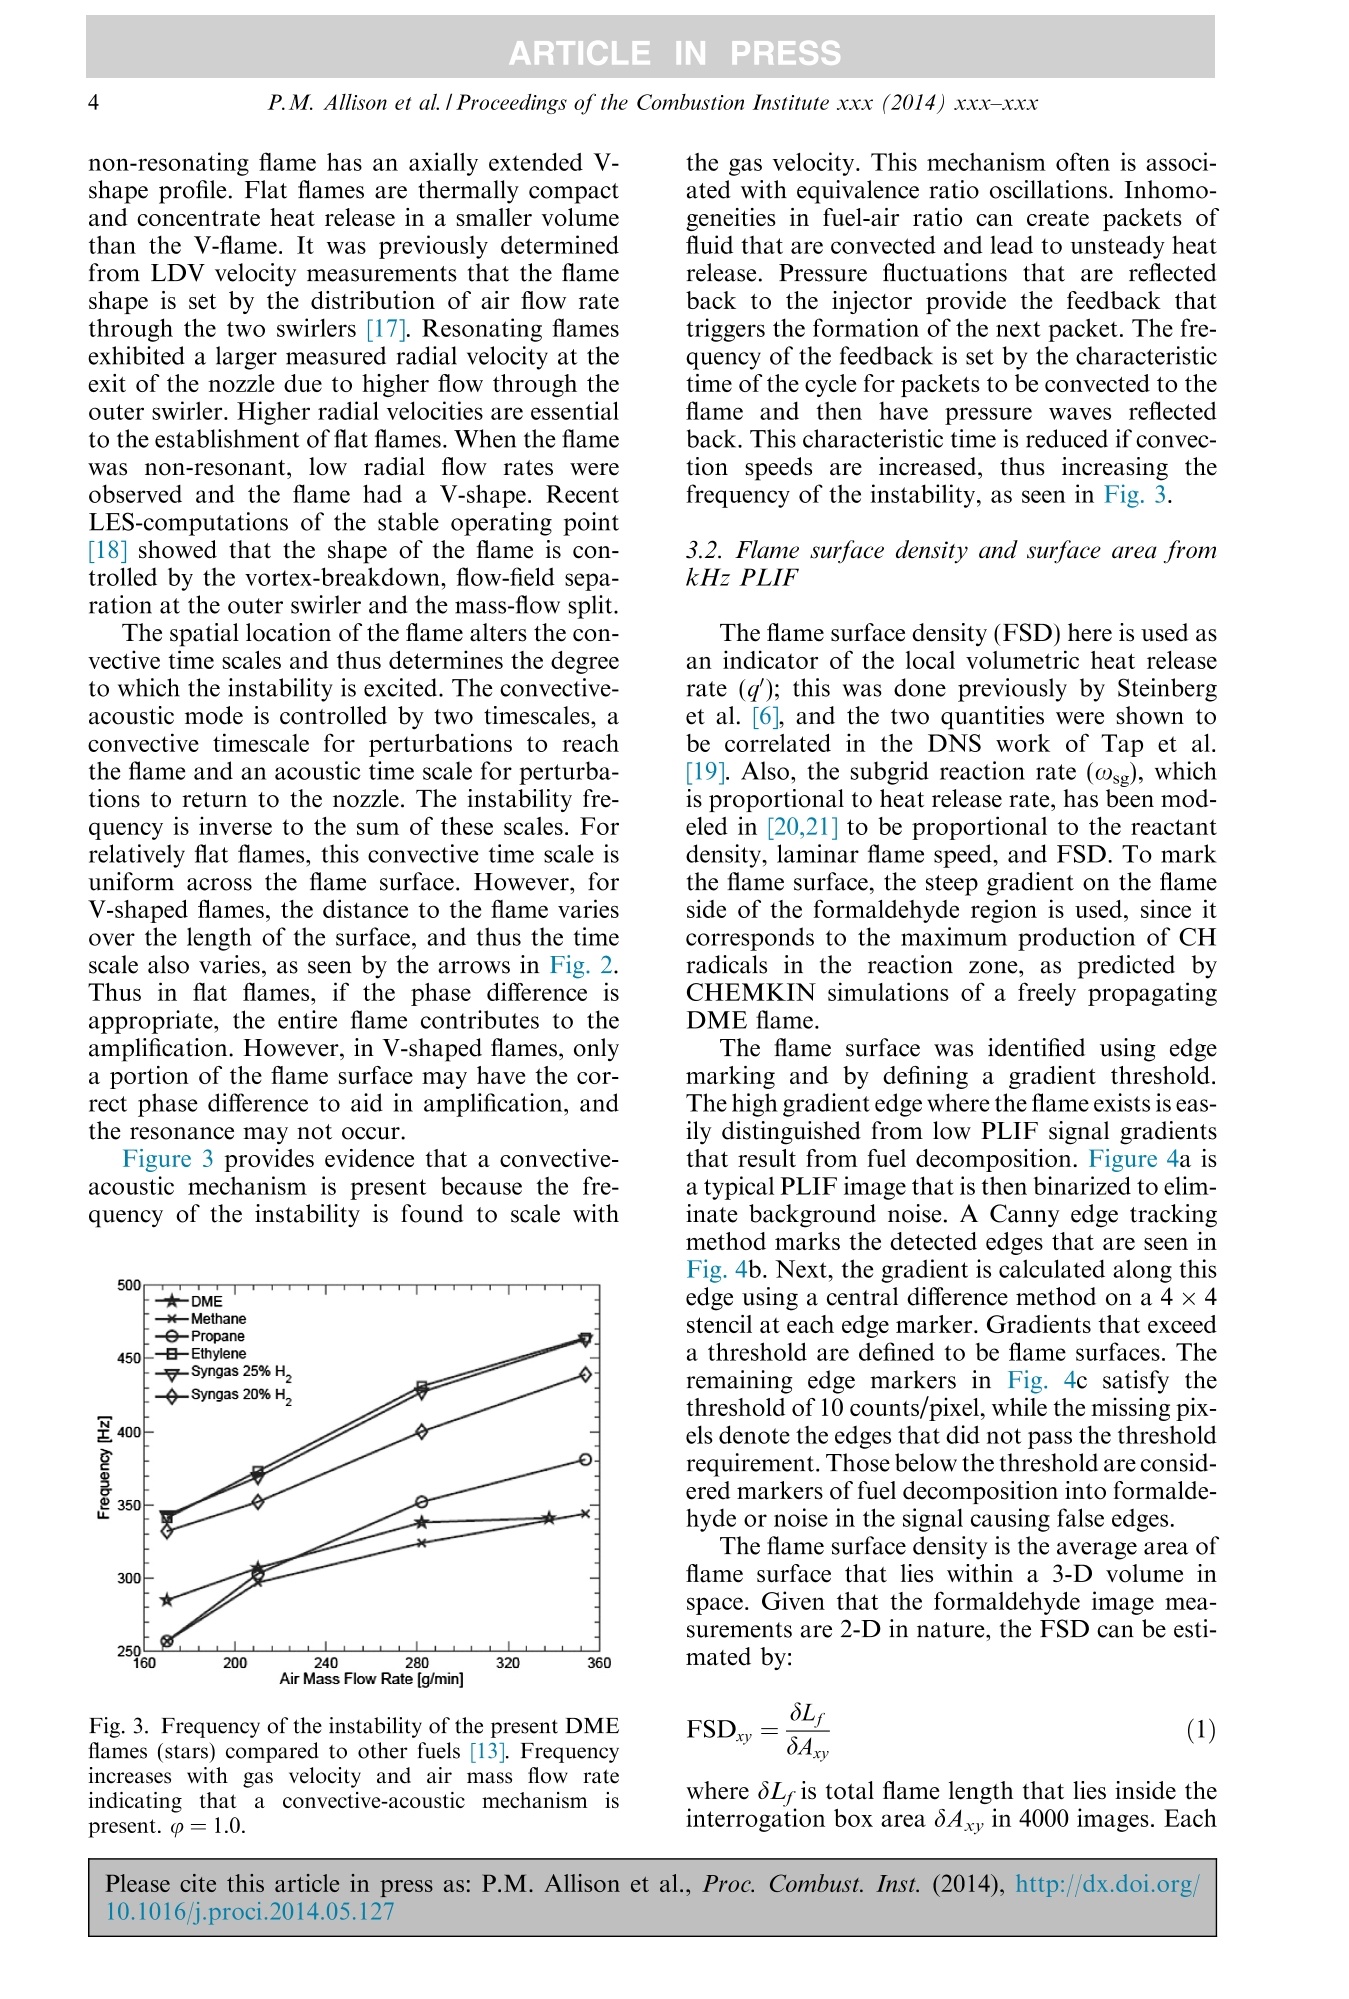
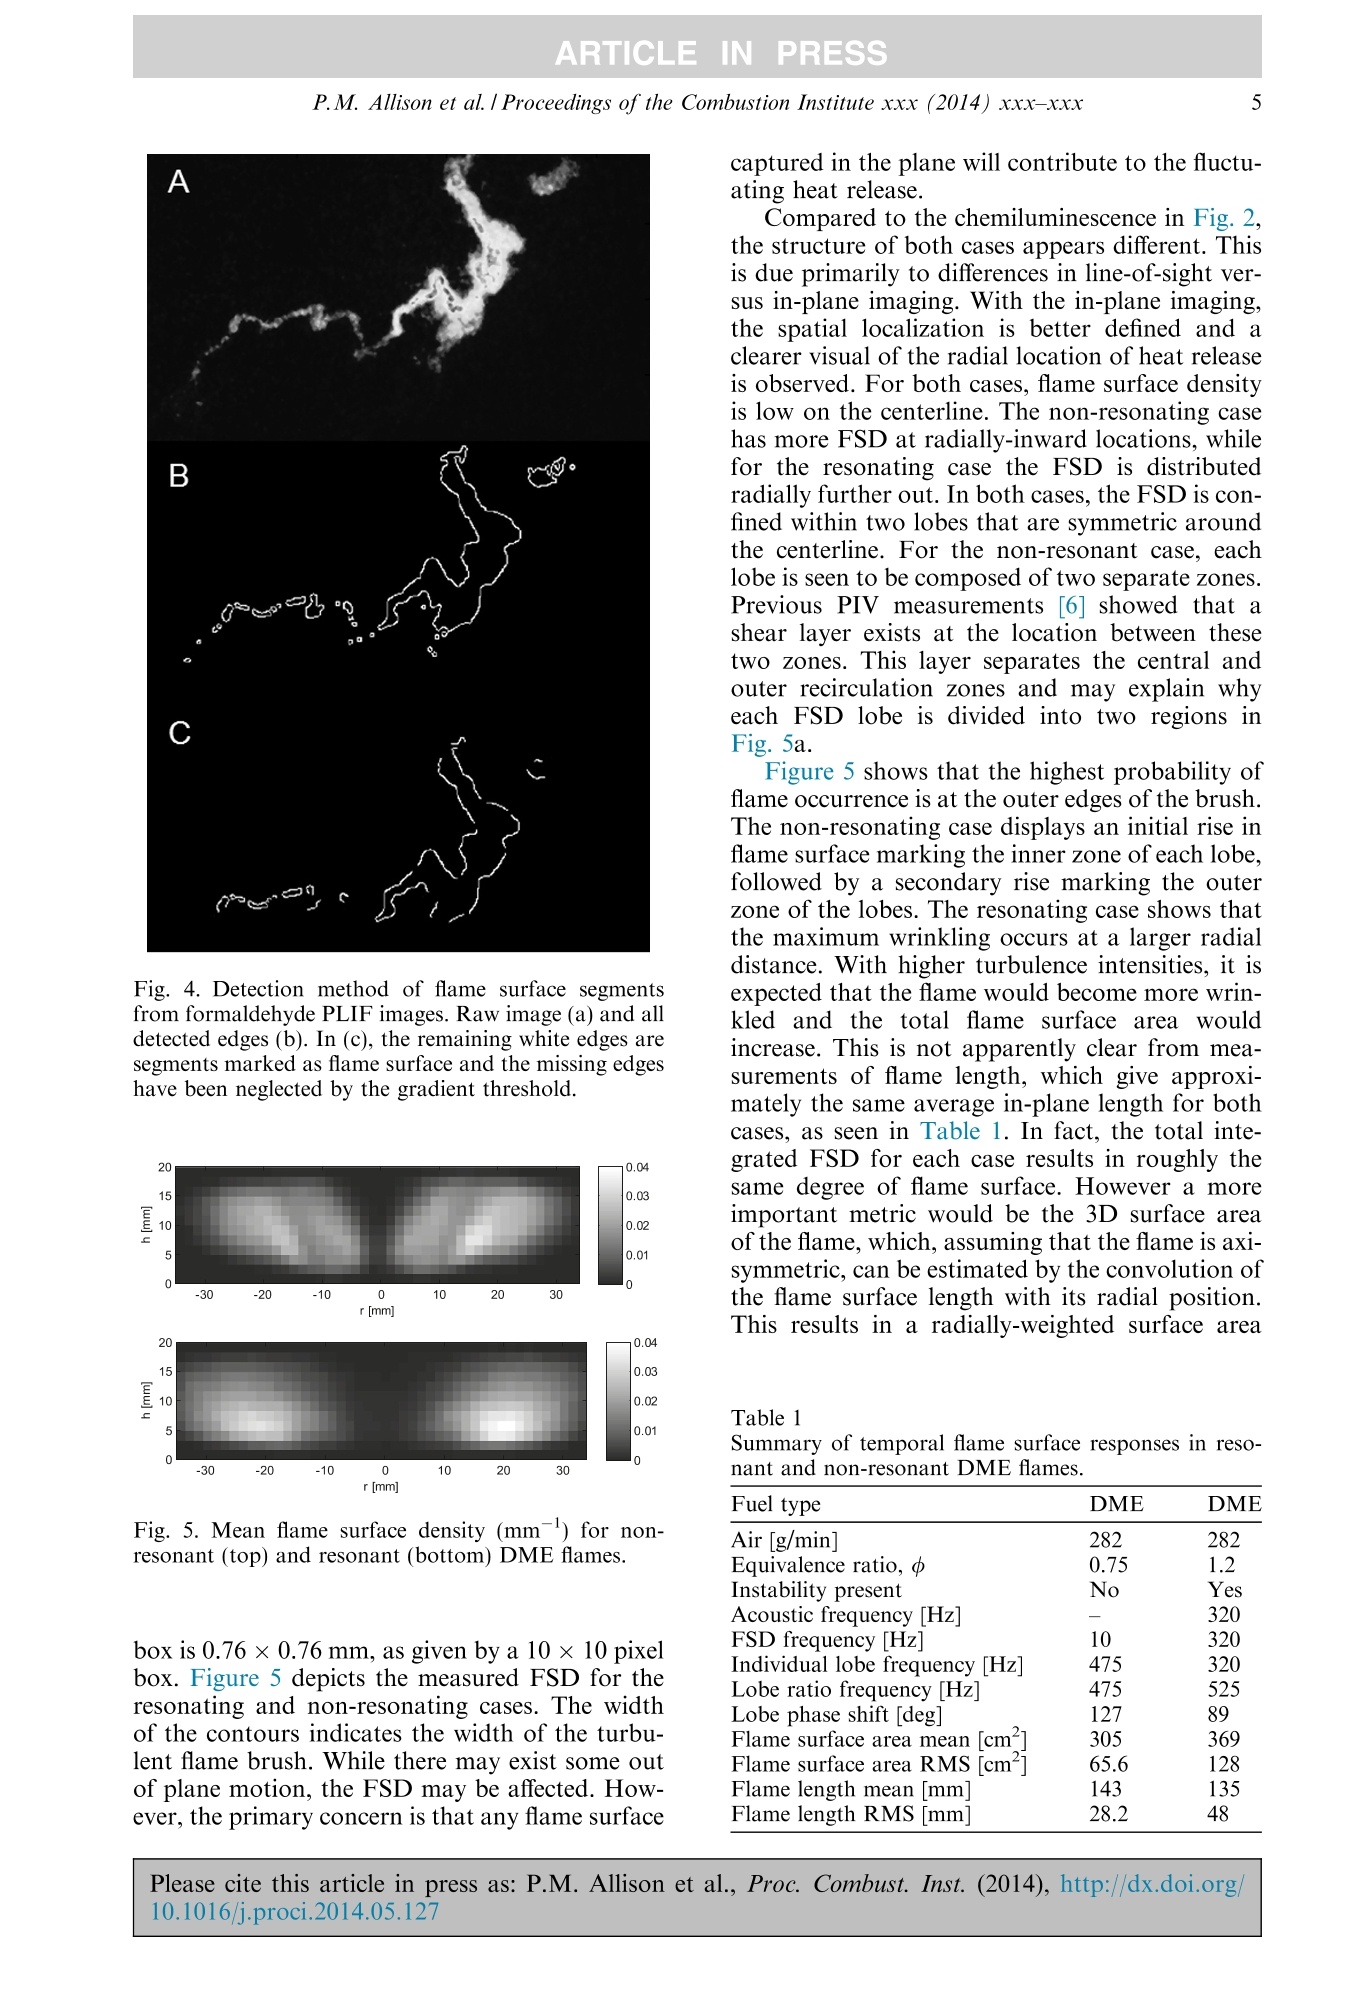
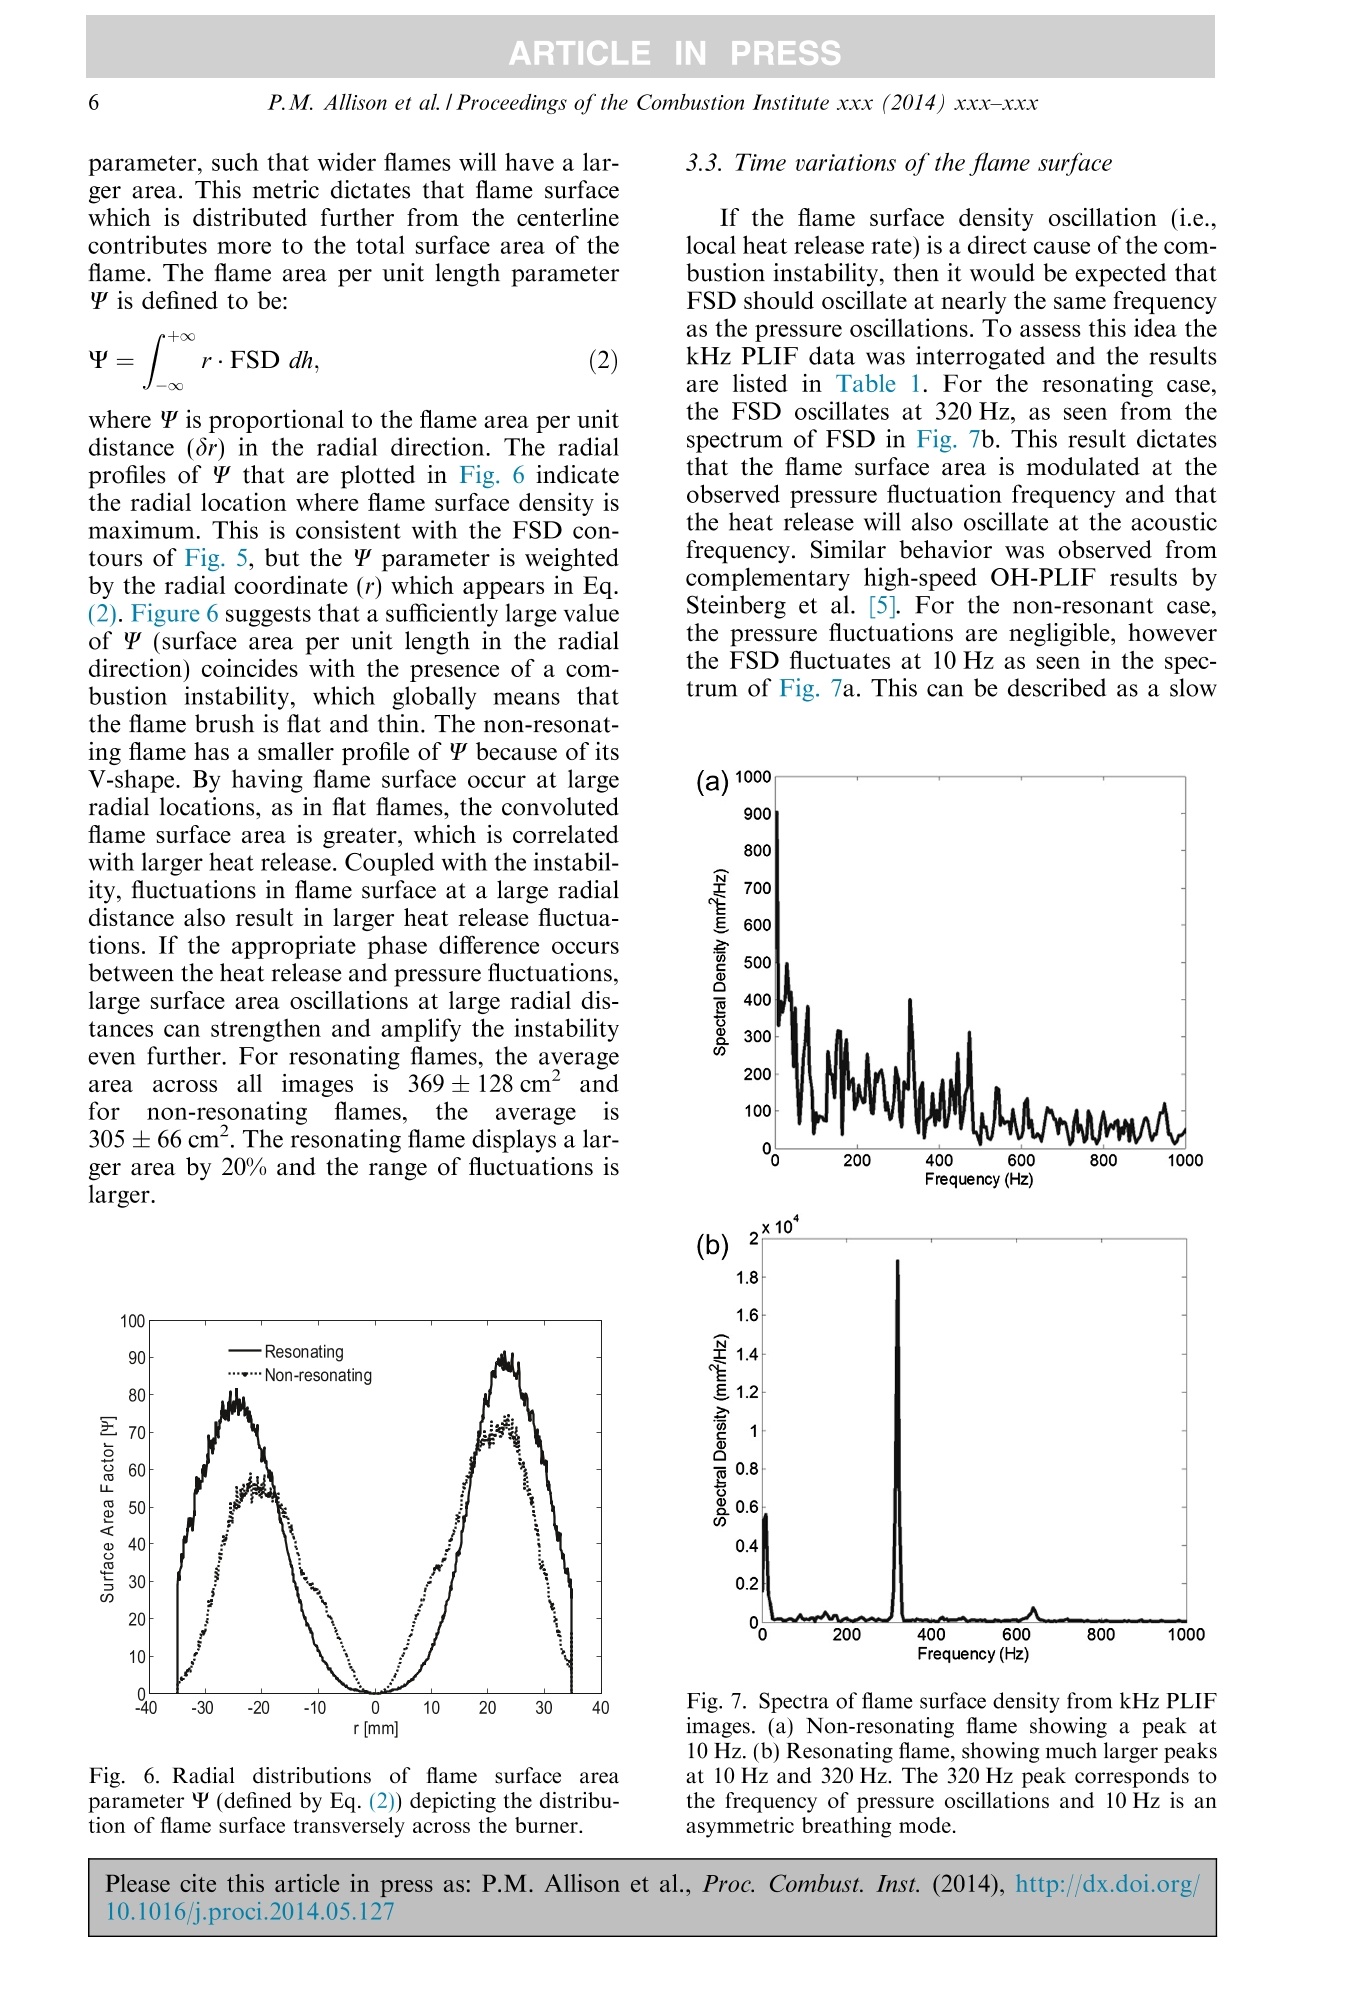
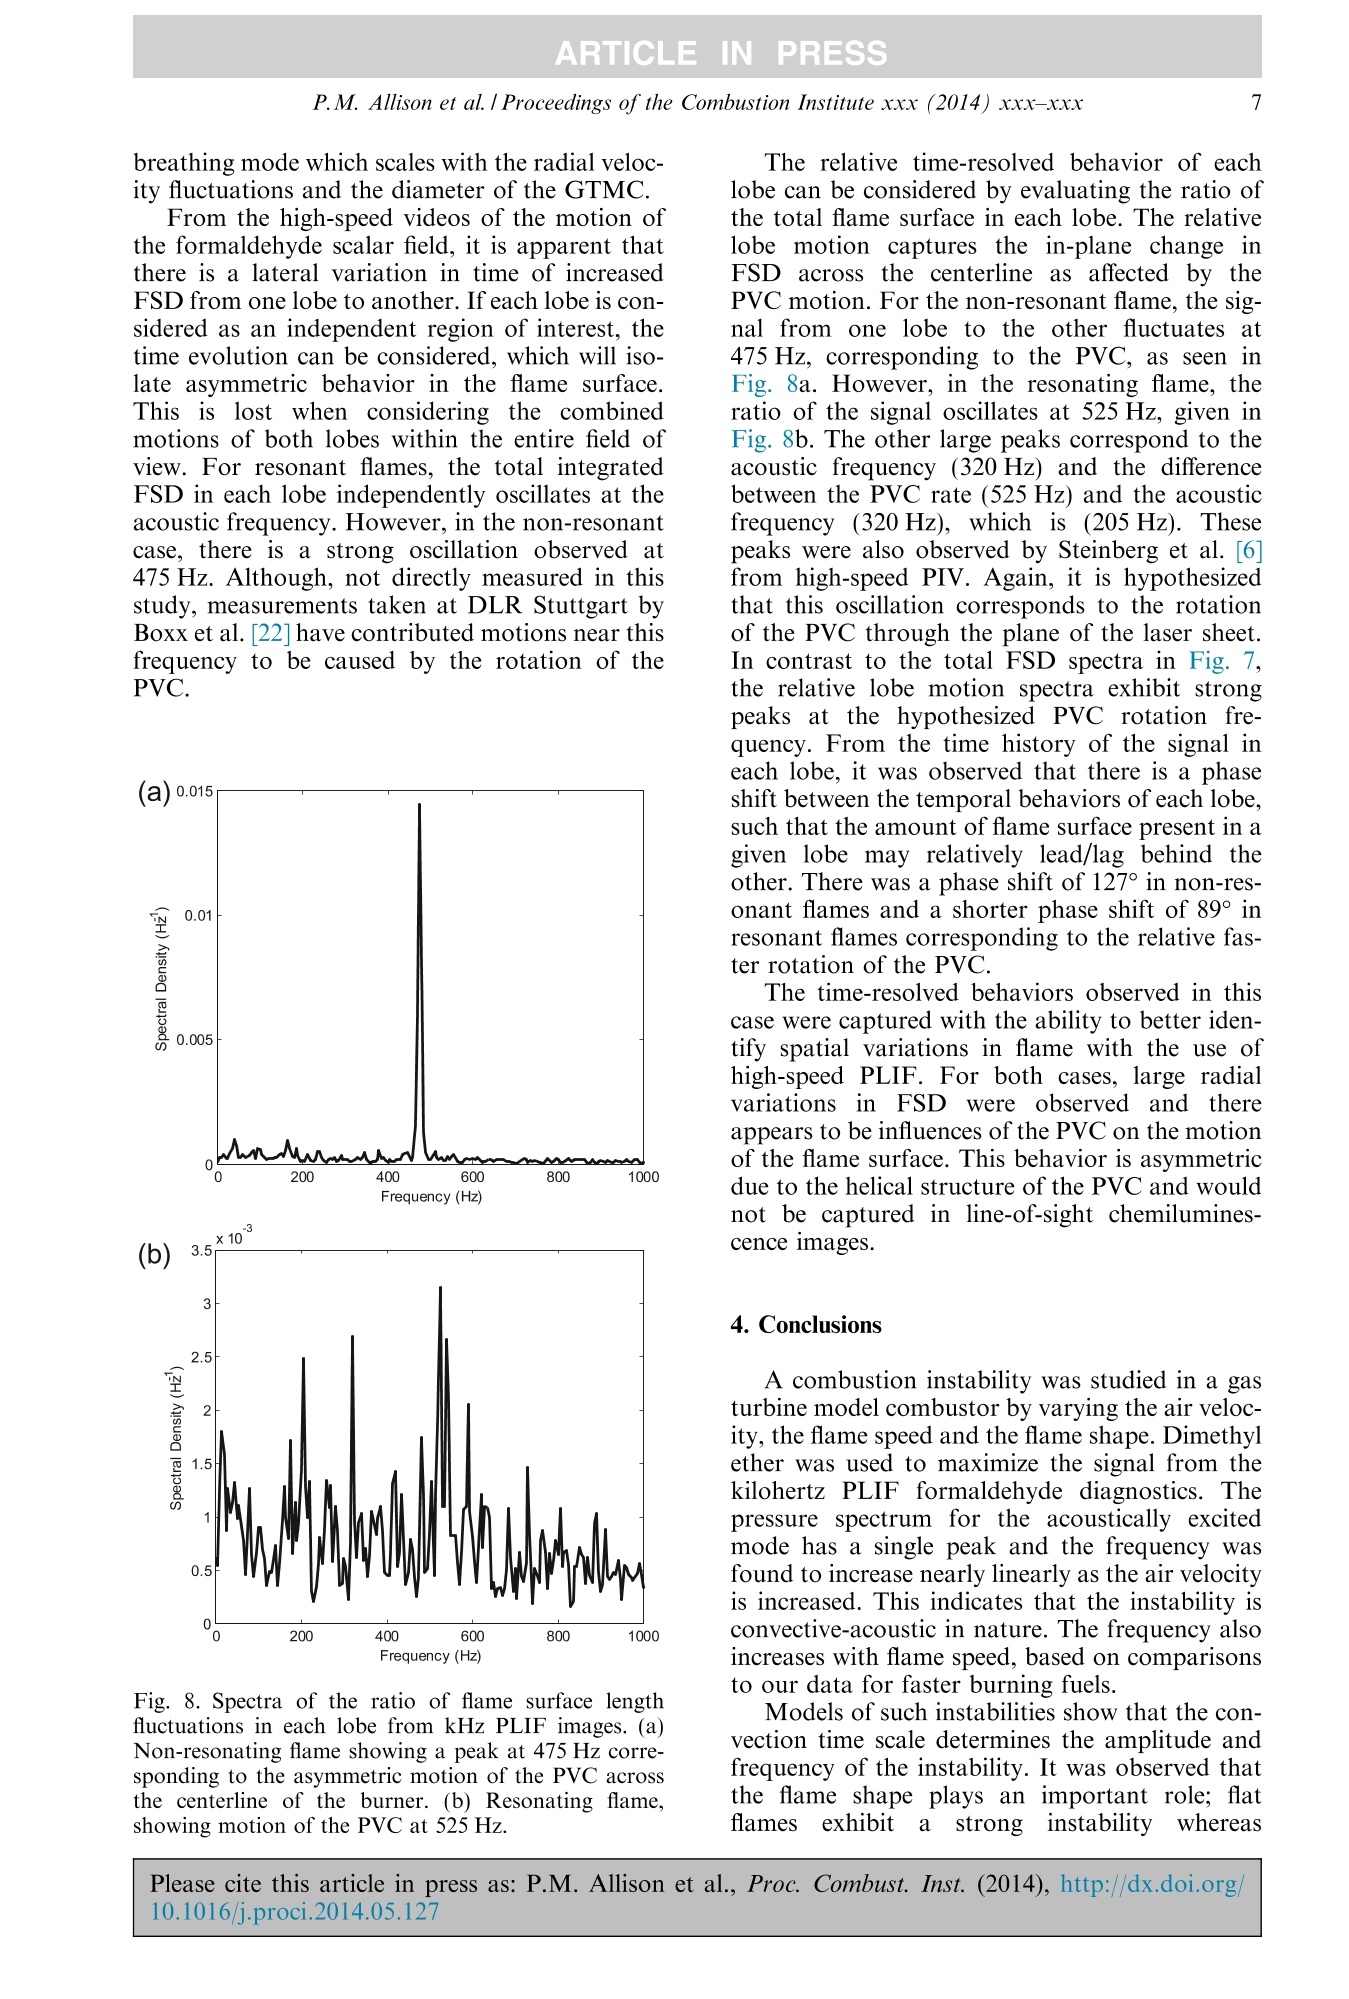
ARTICLE INPRESSAvailable online at www.sciencedirect.comScienceDirectProceedings of the Combustion Institute xxx (2014) xxx-xxx ARTICLE INPRESS Proceedings of theCombustionInstitute www.elsevier.com/locate/proc Coupling of flame geometry and combustioninstabilities based on kilohertz formaldehydePLIF measurements Patton M. Allison*, Yuntao Chen, Matthias Ihme, James F. Driscoll Department ofAerospace Engineering, University of Michigan, Ann Arbor, MI 48109, United StatesDepartment of Mechanical Engineering, Stanford University, Stanford, CA 94305, United States Abstract In the past, flame geometry was found to play an important role in determining when strong pressurefluctuations associated with a combustion instability occur in a gas turbine model combustor. The goals ofthis study were to use flame surface area as a more accurate way to quantify the flame shape and the hearelease rate, in lieu of chemiluminescence; to accurately resolve both the spatial structure and the time his-tory ofthe heat release fluctuations, and to show that kilohertz formaldehyde planar laser-induced fluores-cence provides a new way to achieve these goals. The dual-swirl burner, developed at DLR Stuttgart byMeier et al. was operated using dimethyl ether (DME) to study fluctuations in the flame surface area, flamebrush, flame length, and heat release rate. To understand the instability, accurate measurements are neededof the correlation between heat release rate fluctuations and pressure fluctuations. Thus heat release ratemust be recorded as a function of time and space. However conventional chemiluminescence offers onlya line-of-sight measurement. High-speed CH2O PLIF was applied to study the motion of flame surfacesin response to the pressure oscillations. Results show that the flame surface density fluctuated at the acous-tic frequency (typically 320 Hz). The frequency of the combustion instability was found to increase aseither the gas velocity or the flame speed was increased. These trends are consistent with previous n-t the-t ories that model the convective time delay. Strong pressure oscillations occur for conditions when the flameis nearly flat; the instability disappears when the flame becomes V-shaped. The explanation is that all pointson a flatter flame have the same convective time delay but this is not true for the V-flame geometry.@ 2014 The Combustion Institute. Published by Elsevier Inc. All rights reserved. Keywords: Instability; Dimethyl ether; Formaldehyde PLIF; High-speed; Gas turbine combustor 1. Introduction * Corresponding author. E-mail addresses: patton.allison@gmail.com, allison.253@osu.edu (P.M. Allison). Swirl flames are known to experience combus-tion instabilities when the heat released by com-bustion oscillatesinphase with pressureoscillations, such that the Rayleigh criterion ismet [1]. However, swirl creates a complicated flow http://dx.doi.org/10.1016/j.proci.2014.05.127 1540-7489/@ 2014 The Combustion Institute. Published by Elsevier Inc. All rights reserved. pattern that can alter the flame shape and thestrength of the heat release rate, affecting thephase difference between pressure and heat releasefluctuations. Simple models [2] show that differen-tial equations can be used to predict the frequency(f) of the pressure oscillation, which depends onthe natural frequency (fo) of the acoustic resona-tor. However.thesemodels show that theobserved frequency may differ from fo due to theconvective time delay (tc) between oscillations inthe inlet gas velocity and the heat release thatoccurs downstream. The time delay can dependon flame shape, flame location (liftoff height),and flame length. A well-documented, canonical dual-swirl bur-ner that undergoes a natural combustion instabil-ity at a frequency in the range between 250 and480 Hz was studied. It is an axisymmetric swir-ler-design and exhibits the fundamental physicsassociated with gas turbine flames; it containstwo swirling air streams which surround an annu-lar fuel stream. Giezendanner et al. [3], Weigandet al. [4], and Steinberg et al. [5,6] and have madeextensive measurements of the flow field dynamicsof this gas turbine model combustor (GTMC) fora few methane-fueled conditions. They showedthat the vortex core precesses at a frequency closeto 515 Hz while the combustion instability occursat 305 Hz. They also showed that the vortex coreundergoes periodic expansion/contraction at theacoustic frequency of 305 Hz, and that this vortexmotion is coupled with the heat release oscilla-tions. In the present work, the burner was oper-ated on dimethyl ether (DME) for two fuelingconditions, which represent cases in which theinstability is present and resonating, or absentand non-resonating. As well, the GTMC wasoperated at various air mass flow rates to investi-gate the presence of a convective-acoustic instabil-ity. There have been several previous studies ofcombustion instabilities, but the temporal struc-ture and the role of flame geometry has not beenthoroughly investigated with experiments in con-fined turbulent flames. The spatial distributionof the flame surface can be determined from 2Dplanar images of formaldehyde PLIF. In addition,by performing PLIF measurements at high-speed,the temporal evolution of the flame surface can beinvestigated in relation to thermoacoustic oscilla-tions and turbulent flow field structures. The new aspects of the present work are thefollowing. High-speed formaldehyde PLIF wasconducted at 4kHz to investigate the time-resolved motions of the flame surface relative tothe fluctuating pressure field at reacting condi-tions. The flame surface densities for resonantand non-resonant operating conditions are com-pared to understand the importance of the spatialdistribution of flame surface area. Flame geome-try and shape have a major effect on the presenceandstrength of the instabilities. Thisppaper reports thatthere aresignificant differencesbetween the spatial and temporal flame shapefor resonant and non-resonant flames. Flamegeometry can be used as an important qualitativemetric in the testing and design of gas turbinecombustors to achieve instability-free operatingconditions. It is also shown that the flame geome-try can be more accurately determined fromhigh-speed PLIF imeasurements than fromconventional chemiluminescence alone. While chemiluminescence images can be takenat high-speed, the collected data represents line-of-sight integrated information about the flame.Spatial asymmetries will be averaged out due tothis integration and time-resolved motions willappearto be symmetric. Most importantlythough, is the ability to distinguish differencesin increased heat release. The local heat releasecan be altered by fluctuations in flame surfacearea or changes to the local reaction rateChemiluminescence sequences cannot distinguishbetween these two causes and can only reportthe total effect of increased heat release. How-ever, high-speed PLIF measurements can capturethe independent effect of changes in flame surfacearea. Species profiles predicted by CHEMKIN inlaminar premixed DME-air flames are similar tothose of propane-air [8], but DME produces sig-nificant formaldehyde concentrations. Comparedto methane flames, the concentration in DMEflames can be 10-100 times greater depending onthe state of mixing. This characteristic of DMEis useful in high-speed PLIF because low pulseenergies, typical of high-speed laser systems, makethe measurement difficult in other fuels. Gabetet al. [9] concluded that DME breaks down intoformaldehyde in the cool flame region of 900-1200 K. It can be seen that DME marks theheated fuel region and that the steepest formalde-hyde gradient consistently occurs near the peak ofthe CH radical production, which is a good mar-ker of the heat release layer. While measurementsof CH-PLIF would certainly provide an idealflame front marker, it is not a readily feasible mea-surement at high repetition rates due to the energylimitations of most current laser systems. Formal-dehyde provides an ideal flame front marker forthin preheat zone structures, in lieu of broad hotproduct OH marking, for high-speed tracking. The primary goal of this study was to use theflame surface area as a more accurate way toquantify the flame shape and the heat release rate,in comparison to chemiluminescence measure-ments. The second objective was to apply high-speed PLIF diagnostics to accurately resolve boththe spatial structure and the time history of theheat release rate. 2. Experimental apparatus The gas turbine model combustor [4], shown inFig. 1, is used to study the combustion instability.The GTMC design was identical to that of DLRStuttgart, however all of the measurements wereperformed at the University of Michigan. Theinjector consists of a central air nozzle with outerdiameter (OD) of 15 mm, an annular fuel nozzle,anda co-annular air nozzle (ID=17mm,OD=25 mm). Both air nozzles supply swirlingair at atmospheric pressure and temperature froma common plenum. The exit plane of the centralair nozzle and fuel nozzle lies 4.5 mm below thatof the outer air. This recession causes partial-pre-mixing of the reactants in the region upstream ofthe flame[15]. The combustion chamber has asquare cross section of 85 mm in width and110 mm in height. The exit of the combustionchamber is an exhaust tube with a diameter of40 mm and a height of 50 mm. Mass flow rateswere controlled by choked orifices that have accu-racies of ±2.25%. The air mass flow rate for bothcases compared was 282 g/min and the globalequivalenceratio for thenon-resonant: and Fig. 1. The gas turbine model combustor designed byMeier et al [4]. Formaldehyde excited by 355 nm lasersheet aligned with the burner centerline. resonant cases were 0.75 and 1.20, respectively.The study of convective-acoustic effects was per-formed over a range of air mass flow rates (170-355 g/min) at a global equivalence ratio of 1.0for several fuels. In this study, the 4transition in formaldehydeis excited using a frequency-tripled diode pumpedNd:YAG Quantronix Hawk HP laser at 355 nm.At 4 kHz, the laser energy per pulse was 9.7 mJand the sheet height was 25 mm. Fluorescencewas recorded with a LaVision HS-IRO intensifierwith a gate time of 200 ns, a Phantom v711 cam-era, and a 105 mm Nikon micro-Nikkor f/2.8 lens.Spatial resolution was 76 um per pixel. A field ofview of 80 mm by 20 mm, which covers the widthof the burner and the entire height of the flame,was observed.A GG-385 filter removed laserinterference below 385 nm. After background cor-rections and filtering, the signal to noise ratiosvaried between 6.5 and 11.2. A PCB piezoelectric transducer (112A04) wasmounted in the side wall of the plenum. The ple-num has a diameter of 80 mm and a length of72 mm. For a given operating condition, pressuremeasurements are taken at a set burner referencetemperature. The frequency and amplitude in theplenum was previously shown to be not signifi-cantly different from that in the combustionchamber, with the exception of a phase shift[16]. The reported frequencies are accurate to±0.5%. 3. Results and discussion 3.1. Global Flame Geometry and Presence ofCombustion Instabilities Figure22shows that there are noticeabledifferences in the flame shapes between the reso-nating case and the non-resonating case,as deter-mined by time-averaged chemiluminescence. The Fig. 2. Time-averaged chemiluminescence of V-shaped,non-resonant flames (a) and flat, resonating flames (b). Please cite this article in press as: P.M. Allison et al., Proc. Combust. Inst. (2014), http://dx.doi.org/10.1016/j.proci.2014.05.127 P. M. Allison et al. / Proceedings of the Combustion Institute xxx (2014) xxx-xxx non-resonating flame has an axially extended V-shape profile. Flat flames are thermally compactand concentrate heat release in a smaller volumethan the V-flame. It was previously determinedfrom LDV velocity measurements that the flameshape is set by the distribution of air flow ratethrough the two swirlers [17]. Resonating flamesexhibited a larger measured radial velocity at theexit of the nozzle due to higher flow through theouter swirler. Higher radial velocities are essentialto the establishment of flat flames. When the flamewas non-resonant, low radial flow rates wereobserved and the flame had a V-shape. RecentLES-computations of the stable operating point[18] showed that the shape of the flame is con-trolled by the vortex-breakdown, flow-field sepa-ration at the outer swirler and the mass-flow split. The spatial location of the flame alters the con-vective time scales and thus determines the degreeto which the instability is excited. The convective-acoustic mode is controlled by two timescales, aconvective timescale for perturbations to reachthe flame and an acoustic time scale for perturba-tions to return to the nozzle. The instability fre-quency is inverse to the sum of these scales.Forrelatively flat flames, this convective time scale isuniform across the flame surface. However, forV-shaped flames, the distance to the flame variesover the length of the surface, and thus the timescale also varies, as seen by the arrows in Fig. 2.Thus in flat flames, if the phase difference isappropriate, the entire flame contributes to theamplification. However, in V-shaped flames, onlya portion of the flame surface may have the cor-rect phase difference to aid in amplification, andthe resonance may not occur. Figure 3 provides evidence that a convective-acoustic mechanism is present because the fre-quency of the instability is found to scale with Fig. 3. Frequency of the instability of the present DMEflames (stars) compared to other fuels [13]. Frequencyincreases with gas velocity and air mass flow rateindicating that a convective-acoustic mechanism ispresent. p=1.0. the gas velocity. This mechanism often is associ-ated with equivalence ratio oscillations. Inhomo-geneities in fuel-air ratio can create packets offluid that are convected and lead to unsteady heatrelease. Pressure fluctuations that are reflectedback to the injector provide the feedback thattriggers the formation of the next packet. The fre-quency of the feedback is set by the characteristictime of the cycle for packets to be convected to theflame and then have pressure waves reflectedback. This characteristic time is reduced if convec-tion speeds are increased, thus increasing thefrequency of the instability, as seen in Fig. 3. 3.2. Flame surface density and surface area fromkHz PLIF The flame surface density (FSD) here is used asan indicator of the local volumetric heat releaserate(q); this was done previously by Steinberget al. [6], and the two quantities were shown tobe correlated in the DNS work of Tap et al.[19]. Also, the subgrid reaction rate (@sg), whichis proportional to heat release rate, has been mod-eled in [20,21] to be proportional to the reactantdensity, laminar flame speed, and FSD. To markthe flame surface, the steep gradient on the flameside of the formaldehyde region is used, since itcorresponds to the maximum production of CHradicals in the reaction zone, as predicted byCHEMKIN simulations of a freely propagatingDME flame. The flame surface was identified using edgemarking and by defining a gradient threshold.The high gradient edge where the flame exists is eas-ily distinguished from low PLIF signal gradientsthat result from fuel decomposition. Figure 4a isa typical PLIF image that is then binarized to elim-inate background noise. A Canny edge trackingmethod marks the detected edges that are seen inFig. 4b. Next, the gradient is calculated along thisedge using a central difference method on a 4×4stencil at each edge marker. Gradients that exceeda threshold are defined to be flame surfaces. Theremaining edge markers in Fig. 4c satisfy thethreshold of 10 counts/pixel, while the missing pix-els denote the edges that did not pass the thresholdrequirement. Those below the threshold are consid-ered markers of fuel decomposition into formalde-hyde or noise in the signal causing false edges. The flame surface density is the average area offlame surface that lies within a 3-D volume inspace. Given that the formaldehyde image mea-surements are 2-D in nature, the FSD can be esti-mated by: where 8L is total flame length that lies inside theinterrogation box area 8Axy in 4000 images. Each Please cite this article in press as: P.M. Allison et al., Proc. Combust. Inst. (2014), http://dx.doi.org/10.1016/j.proci.2014.05.127 Fig. 4. Detection method of flame surface segmentsfrom formaldehyde PLIF images. Raw image (a) and alldetected edges (b). In (C), the remaining white edges aresegments marked as flame surface and the missing edgeshave been neglected by the gradient threshold. Fig. 5. Mean flame surface density (mm-l) for non-resonant (top) and resonant (bottom) DME flames. box is 0.76×0.76 mm, as given by a 10× 10 pixelbox. Figure 5 depicts the measured FSD for theresonating and non-resonating cases. The widthof the contours indicates the width of the turbu-lent flame brush. While there may exist some outof plane motion, the FSD may be affected. How-ever, the primary concern is that any flame surface captured in the plane will contribute to the fluctu-ating heat release. Compared to the chemiluminescence in Fig. 2,the structure of both cases appears different. Thisis due primarily to differences in line-of-sight ver-sus in-plane imaging. With the in-plane imaging,the spatial localization is better defined and aclearer visual of the radial location of heat releaseis observed. For both cases, flame surface densityis low on the centerline. The non-resonating casehas more FSD at radially-inward locations, whilefor the resonating case the FSD is distributedradially further out. In both cases, the FSD is con-fined within two lobes that are symmetric aroundthe centerline. For the non-resonant case, eachlobe is seen to be composed of two separate zones.Previous PIV measurements[6] showed that ashear layer exists at the location between thesetwo zones. This layer separates the central andouter recirculation zones and may explain whyeach FSD lobe is divided into two regions inFig. 5a. Figure 5 shows that the highest probability offlame occurrence is at the outer edges of the brush.The non-resonating case displays an initial rise inflame surface marking the inner zone of each lobe,followed by a secondary rise marking the outerzone of the lobes. The resonating case shows thatthe maximum wrinkling occurs at a larger radialdistance.With higher turbulence intensities, it isexpected that the flame would become more wrin-kled and the total flame surface area wouldincrease. This is not apparently clear from mea-surements of flame length, which give approxi-mately the same average in-plane length for bothcases, as seen in Table 1. In fact, the total inte-grated FSD for each case results in roughly thesame degree of flame surface. However a moreimportant metric would be the 3D surface areaof the flame, which, assuming that the flame is axi-symmetric, can be estimated by the convolution ofthe flame surface length with its radial position.This results in a radially-weighted surface area Table 1 Summary of temporal flame surface responses in resonant and non-resonant DME flames. Fuel type DME DME Air [g/min] 282 282 Equivalence ratio, o 0.75 1.2 Instability present No Yes Acoustic frequency [Hz] 320 FSD frequency [Hz] 10 320 Individual lobe frequency [Hz] 475 320 Lobe ratio frequency [Hz] 475 525 Lobe phase shift [deg] 127 89 Flame surface area mean [cm 305 369 Flame surface area RMS S[cm 65.6 128 Flame length mean [mm] 143 135 Flame length RMS [mmj 28.2 48 parameter, such that wider flames will have a lar-ger area. This metric dictates that flame surfacewhich is distributed further from the centerlinecontributes more to the total surface area of theflame. The flame area per unit length parameter is defined to be: where ¥ is proportional to the flame area per unitdistance (8r) in the radial direction. The radialprofiles of Y that are plotted in Fig. 6 indicatethe radial location where flame surface density ismaximum. This is consistent with the FSD con-tours of Fig. 5, but the Y parameter is weightedby the radial coordinate (r) which appears in Eq.(2). Figure 6 suggests that a sufficiently large valueof Y (surface area per unit length in the radialdirection) coincides with the presence of a com-bustion instability, which globally means thatthe flame brush is flat and thin. The non-resonat-ing flame has a smaller profile of because of itsV-shape. By having flame surface occur at largeradial locations, as in flat flames, the convolutedflame surface area is greater, which is correlatedwith larger heat release. Coupled with the instabil-ity, fluctuations in flame surface at a large radialdistance also result in larger heat release fluctua-tions. If the appropriate phase difference occursbetween the heat release and pressure fluctuations,large surface area oscillations at large radial dis-tances can strengthen and amplify the instabilityeven further. For resonating flames, the averageareaacrossall imagesis369 2±128 cmdfornon-resonatingflames, theaverageis305±66 cm. The resonating flame displays a lar-ger area by 20% and the range of fluctuations islarger. Fig.6. Radial distributions of flame surface areaparameter (defined by Eq. (2)) depicting the distribu-tion of flame surface transversely across the burner. If the flame surface density oscillation (i.e.,local heat release rate) is a direct cause of the com-bustion instability, then it would be expected thatFSD should oscillate at nearly the same frequencyas the pressure oscillations. To assess this idea thekHz PLIF data was interrogated and the resultsare listed inTable 1. For the resonating case,the FSD oscillates at 320 Hz, as seen from thespectrum of FSD in Fig. 7b. This result dictatesthat the flame surface area is modulated at theobserved pressure fluctuation frequency and thatthe heat release will also oscillate at the acousticfrequency. Similar behavior was observed fromcomplementary high-speed OH-PLIF results bySteinberg et al. [5]. For the non-resonant case,the pressure fluctuations are negligible, howeverthe FSD fluctuates at 10 Hz as seen in the spec-trum of Fig. 7a. This can be described as a slow Frequency (Hz) Fig. 7. Spectra of flame surface density from kHz PLIFimages. (a) Non-resonating flame showing a peak at10 Hz. (b) Resonating flame, showing much larger peaksat 10 Hz and 320 Hz. The 320 Hz peak corresponds tothe frequency of pressure oscillations and 10 Hz is anasymmetric breathing mode. Please cite this article in press as: P.M. Allison et al., Proc. Combust. Inst. (2014), http://dx.doi.org/10.1016/j.proci.2014.05.127 breathing mode which scales with the radial veloc-ity fluctuations and the diameter of the GTMC. From the high-speed videos of the motion ofthe formaldehyde scalar field, it is apparent thatthere is a lateral variation in time of increasedFSD from one lobe to another. If each lobe is con-sidered as an independent region of interest, thetime evolution can be considered, which will iso-late asymmetric behavior in the flame surface.This islost when considering the combinedmotions of both lobes within the entire field ofview. For resonant flames, the total integratedFSD in each lobe independently oscillates at theacoustic frequency. However, in the non-resonantcase, there is a strong oscillation observed at475 Hz. Although, not directly measured in thisstudy, measurements taken at DLR Stuttgart byBoxx et al.[22] have contributed motions near thisfrequency to be caused by the rotation of thePVC. (a)o.015 200 400 600 800 1000 Frequency (Hz) Fig. 8. Spectra of the ratio of flame surface lengthfluctuations in each lobe from kHz PLIF images. (a)Non-resonating flame showing a peak at 475 Hz corre-sponding to the asymmetric motion of the PVC acrossthe centerline of the burner. (b) Resonating flame,showing motion of the PVC at 525 Hz. The time-resolved behaviors observed in thiscase were captured with the ability to better iden-tify spatial variations in flame with the use ofhigh-speed PLIF. For both cases, large radialvariations in FSD were observed and thereappears to be influences of the PVC on the motionof the flame surface. This behavior is asymmetricdue to the helical structure of the PVC and wouldnot be captured in line-of-sight chemilumines-cence images. 4. Conclusions A combustion instability was studied in a gasturbine model combustor by varying the air veloc-ity, the flame speed and the flame shape. Dimethylether was used to maximize the signal from thekilohertz PLIF formaldehyde diagnostics. Thepressure spectrum for the acoustically excitedmode has a single peak and the frequency wasfound to increase nearly linearly as the air velocityis increased. This indicates that the instability isconvective-acoustic in nature. The frequency alsoincreases with flame speed, based on comparisonsto our data for faster burning fuels. Models of such instabilities show that the con-vection time scale determines the amplitude andfrequency of the instability. It was observed thatthe flame shape plays an important role; flatflamesexhibitaa strongiinstability whereas V-shaped flames are typically quiet. For flatflames, the entire flame has the same convectivetime scale. This convection time scale varies alonga V-flame, so only a small segment of the flamecan amplify the pressure oscillations. The flamegeometry in this GTMC is controlled by mixingand the upstream flow pattern; specifically theamount of radial velocity imparted by the distri-bution of flow through each swirler. It is shown that the flame geometry, includingits spatial and temporal variations, can be moreaccurately determined using kHz PLIF than byconventional chemiluminescence. Spatial varia-tions of flame surface density (and heat releaserate) in resonating flames differed from that ofnon-resonating flames. The resonating case has alarger flame surface area and the peak FSD waslocated at larger radial distances than for thenon-resonating case. When the instability is pres-ent, the magnitude of area fluctuations was muchgreater, indicating large scale surface creation anddestruction. The combination of large surfacearea and large area fluctuations leads to increasedamplification of the instability. It was demonstrated that high-speed PLIFdiagnostics offer advantages by providing boththe time-evolution of the flame surface structureand the spectrum of flame surface area fluctua-tions. Surface area and thus heat release rate wereseen to oscillate at the same 320 Hz frequency aspressure fluctuations. This coupling of pressureand heat release oscillations leads to amplificationof the instability based on the Rayleigh criterion.However, the flame surface also exhibited asym-metric motions at 525 Hz associated with the pres-ence of the PVC. For non-resonating flames,oscillations in flame surface density also occur ata low-frequency (10 Hz) due to a breathing modeand at the PVC rotation rate (475 Hz). Acknowledgments This research was funded by ONR under grantN00014-10-10561 and by the DOE-UTSR pro-gram under grant FE0007060. The authors thankDr. Wolfgang Meier of DLR Stuttgart for permis-sion to use the GTMC design. ( [1] J.W.S. Rayleigh, R. Lindsay, T he Theory of Sound,vol. 2 , D over P u blications, 1945, p . 230. ) ( [2] J.P . Hathout, M. Fleifi l , A.M . Annaswamy, A .F.Gh o niem, J. P r opul. P o wer 18 (2) (2002) 390-39 9 . ) ( [3] R. Giezendanner, P . Weigand, X . R. Duan, et al . , J.Eng. Gas Turbines Power 1 2 7 (2005) 492-496. ) ( [4] P. We i gand, W. M eier, X .R. D u an, W. Str i cker, ) ( M . Aigner, Combust. F l ame 1 4 4 ( 2 006) 205-2 2 4. [5] A.M. S t ei n berg , I . B oxx, M . S t ohr, C.D. Ca r ter, ) ( W. M eier, C ombust. F lame 157 (2010) 22 50-2666. ) ( [6] A.M. S teinbe r g,I. B oxx, M . Stohr, W. M e ier, C.D . C arter, AIAA J. 5 0 (4)(2012) 952-967. ) ( 7] ] J.G. Lee, D.A. S ant a vicca, J. P ropul. P o wer 19 ( 5)(2003 )7 35- 7 50. ) ( [81 ] C . A. D a ly, J .M. S immie, Combust. F l ame 12 5 (4 ) (2001) 1329 - 13 4 0. ) ( [9] K. Gabet, H. Shen, R. Patton, F. Fuest, J.Sutton,Proc. Combust. Inst. 34 (2013) 1447-1454. ) ( [10 ] 1 S . Ducruix, T. Schuller, D. Durox, S. Candel,J. Pr op ul. Power 19 ( 5) ( 2003) 722-734. ) ( [111 ] B.T. Zinn, T . Lieuwen, in: T . Lieuwen, V. Yang (Eds.), Combustion I n stabilities i n Gas T urbine Engines, AIAA , 2005, pp . 9 -1 3 . ) ( ] K.H. Yu, A . Trouve, J . W. Da i ly, J. F l uid Mech. 232(1991) 47- 7 2. ) ( ] T. L ieuwen, H. Torres, C. Johnson, B.T. Zinn, J.Eng. Gas T urbines Powe r 12 3 (2001) 182-189. ) ( [14] P . M. Allison, M. Ihme, J.F . Driscoll , Proc . Com-bust. Inst . 34 (20 1 3) 3 1 45 - 3153. ) ( [ 1 5] W. Meier, X.R. D uan, P. Weigand, P r oc. C o mbust.Inst. 30(2005) 8 35- 8 42. ) [16] R. Sadanandan, M. Stohr, W. Meier, Combust.Explo. Shock Waves 45 (2009) 518-529. [17] P. M. Allison, D.A. Rosenberg, J.F. Driscoll,Combustion instability interaction with fuel-airmixing in a partially-premixed gas turbine modelcombustor: syngas and hydrocarbon fuel compar-isons, 8th Mediterranean Combustion Symposium,International Centre for Heat and Mass Transfer,2013. [18] Y. C. See, M. Ihme, Proc. Combust. Inst. 35 (2014),accepted for presentation. ( Please cite this article in press as: P.M. A llison et a l ., Proc. Combust. In s t. (2014), htt p://dx.doi.org/10.1016/j.proci.2014.05.127 ) In the past, flame geometry was found to play an important role in determining when strong pressurefluctuations associated with a combustion instability occur in a gas turbine model combustor. The goals ofthis study were to use flame surface area as a more accurate way to quantify the flame shape and the heatrelease rate, in lieu of chemiluminescence; to accurately resolve both the spatial structure and the time historyof the heat release fluctuations, and to show that kilohertz formaldehyde planar laser-induced fluorescenceprovides a new way to achieve these goals. The dual-swirl burner, developed at DLR Stuttgart byMeier et al. was operated using dimethyl ether (DME) to study fluctuations in the flame surface area, flamebrush, flame length, and heat release rate. To understand the instability, accurate measurements are neededof the correlation between heat release rate fluctuations and pressure fluctuations. Thus heat release ratemust be recorded as a function of time and space. However conventional chemiluminescence offers onlya line-of-sight measurement. High-speed CH2O PLIF was applied to study the motion of flame surfacesin response to the pressure oscillations. Results show that the flame surface density fluctuated at the acousticfrequency (typically 320 Hz). The frequency of the combustion instability was found to increase aseither the gas velocity or the flame speed was increased. These trends are consistent with previous n-s theoriesthat model the convective time delay. Strong pressure oscillations occur for conditions when the flameis nearly flat; the instability disappears when the flame becomes V-shaped. The explanation is that all pointson a flatter flame have the same convective time delay but this is not true for the V-flame geometry.
确定
还剩6页未读,是否继续阅读?

产品配置单


北京欧兰科技发展有限公司为您提供《燃烧火焰中甲醛浓度分布检测方案(流量计)》,该方案主要用于其他中甲醛浓度分布检测,参考标准--,《燃烧火焰中甲醛浓度分布检测方案(流量计)》用到的仪器有PLIF平面激光诱导荧光火焰燃烧检测系统、德国LaVision PIV/PLIF粒子成像测速场仪、LaVision DaVis 智能成像软件平台
推荐专场


相关方案
更多
该厂商其他方案
更多